Density and infrared band strength of interstellar carbon monoxide (CO) ice analogues2022Density and infrared band strength of interstellar carbon monoxide (CO) ice analogues–References
Abstract
The motivation to study experimentally CO ice under mimicked interstellar conditions is supported by the large CO gas abundances and ubiquitous presence of CO in icy grain mantles. Upon irradiation in its pure ice form, this highly stable species presents a limited ion and photon-induced chemistry, and an efficient non-thermal desorption. Using infrared spectroscopy, single laser interference, and quadrupole mass spectrometry during CO ice deposition, the CO ice density was estimated as a function of deposition temperature. Only minor variations in the density were found. The proposed methodology can be used to obtain the density of other ice components at various deposition temperatures provided that this value of the density is known for one of these temperatures, which is typically the temperature corresponding to the crystalline form. The apparent tendency of the CO ice density to decrease at deposition temperatures below 14 K is in line with recently published colorimetric measurements. This work allowed to revisit the value of the infrared band strength needed for calculation of the CO ice column density in infrared observations, at 20 K deposition temperature.
Keywords:
astrochemistry – radiation mechanisms: non-thermal – methods: laboratory: solid state – techniques: spectroscopic – ISM: molecules – infrared: ISM1 Introduction
Carbon monoxide (CO) gas abundances in dense clouds suggest that 90 % of the CO molecules leave the gas phase along the line of sight, and over 99 % of them should deplete in the core nucleus (Caselli et al. 1999) due to CO freeze out onto dust grains forming ice mantles (e.g., Pontoppidan et al. 2008). Protostar formation heats the surrounding environment and triggers the thermal desorption of ice mantles (Cazaux et al. 2003). CO is considered to be one, if not the most, abundant species on the top ice layer covering inter- and circum-stellar dust grains observed toward the coldest regions. Along with CO and likely other volatile molecules of weak dipole moment, this top ice layer is expected to host species with no dipole moment like N2 (Pontoppidan et al. 2008). This ice phase is thus weakly bound by intermolecular van der Waals forces and offers the possibility to desorb molecules by direct cosmic-ray impact (Dartois et al. 2021; Huang et al. 2020), X-rays (Ciaravella et al. 2012; Ciaravella et al. 2016) in protoplanetary disks, or ultraviolet (UV) photons (Öberg et al. 2007; Öberg et al. 2009; Muñoz Caro et al. 2010; Fayolle et al. 2011; Chen et al. 2014; Cruz-Díaz et al. 2014) generated by the interaction of cosmic rays with H2 present in dense clouds (Prasad & Tarafdar 1983; Cecchi-Pestellini & Aiello 1992; Shen et al. 2004). In the case of multicomponent ice mixtures, the UV-photodesorption yield of CO is severely reduced in the presence of H2O, also N2 neighbours reduce the efficiency of CO UV-photodesorption (Bertin et al. 2012; Bertin et al. 2013; Carrascosa et al. 2019). But photodesorption of CO molecules during UV-irradiation of pure CO ice is not much hindered by the presence of other species in the ice. This is due to the low efficiency in the formation of CO photoproducts during irradiation.
The CO photodesorption yield reaches its highest value when this ice is deposited at low temperatures (down to 7 K, the lowest temperature studied experimentally) and decreases gradually at higher deposition temperatures (Öberg et al. 2007; Öberg et al. 2009; Muñoz Caro et al. 2010; Muñoz Caro et al. 2016; Sie et al. pted). The explanation for this phenomenon motivated further research. It was found that the columnar structure of CO ice samples, grown at incidence angles larger than 45∘, increases the effective ice surface exposed to UV photons and therefore the photodesorption efficiency (González Díaz et al. 2019), but ice surface effects cannot account for the large variations observed in the photodesorption of CO ice samples deposited at different temperatures (Muñoz Caro et al. 2016). Absorption band shifts of CO ice in the UV and IR ranges only occurred at deposition temperatures above 20 K (Lasne et al. 2015; Muñoz Caro et al. 2016), suggesting that CO ice grown at lower temperatures is amorphous below 20 K in our experiments, and therefore, the decreasing photodesorption yield is not related to a transition from amorphous to crystalline ice, instead it might be associated to a different degree of molecular disorder in CO ice samples, depending on their deposition temperature. Photon energy transfer via Wannier–Mott excitons between the first photoexcited molecule in the ice and a molecule on the ice surface capable to desorb was proposed (Chen et al. 2017; McCoustra & Thrower 2018). Molecular disorder seems to enhance this energy transfer between neighbor molecules. The color temperature variations measured at different deposition temperatures could also be the result of molecular disorder (Carrascosa et al. 2021). Urso et al. 2016, Cazaux et al. 2017, and Carrascosa et al. 2021 did not find significant changes in the desorption behaviour or the color temperature of pure CO ice during controlled warm-up, which points to a low value of the diffusion in the ice. Finally, Sie et al. pted investigated the CO photodesorption yield dependence on ice thickness.
CO ice density could also provide information about the ice structure dependence on deposition temperature. Luna et al. 2022 report the density of CO ice grown at different temperatures using laser interferometry and a microbalance. Here we use a different method to measure the density of CO ice grown at different temperatures and confirm the results of Luna et al. 2022; this method can be used by other authors to estimate the ice density with the use of infrared spectroscopy, laser interferometry and a quadrupole mass spectrometer.
The most commonly used IR band strength value of CO ice, 1.1 10-17 cm molecule-1, dates from 1975 (Jiang et al. 1975) and relies on much older references: They adopted a density of 1.028 g cm-3 for pure solid CO in the -phase (crystalline ice) at 30 K (Vegard 1930), which is significantly higher than the one reported by Roux et al. 1980, 0.80 g cm-3 at 20 K, and Luna et al. 2022, 0.88 g cm-3 at 20 K. Jiang et al. 1975 used a value of the refractive index, = 1.35, that is also higher than those reported by Roux et al. 1980, = 1.27 at 20 K, and Luna et al. 2022, = 1.30 at 20 K. Finally, Jiang et al. 1975 employed an ice thickness deposition rate between 0.5 and 2 m min-1, this rate is very high compared to the ones used in modern setups devoted to astrochemistry and might affect the ice structure; this issue is studied in the present article. For comparison, the highest deposition rate used in this work was around 30 nm min-1, which corresponds to a CO pressure of 10-6 mbar during deposition. The IR band strength is a fundamental parameter needed to calculate the ice column density in the line of sight of the observations, it is therefore revisited in this paper.
2 Experimental
2.1 Experimental setup
Experiments were carried out using the Interstellar Astrochemistry Chamber (ISAC), described in more detail in Muñoz Caro et al. 2010. ISAC is an ultra-high vacuum (UHV) chamber with a base pressure of 4 10-11 mbar designed to simulate the conditions present in the interstellar medium (ISM), regarding temperature, pressure and radiation field. A closed-cycle He cryostat allows to cool down the tip of the cold finger to 8 K, where a sample holder with a MgF2 window acting as the substrate for ice deposition is located. In the experiments reported in this work the lowest achievable temperature was 11 K because the radiation shield surrounding the sample holder would block the laser signal and was removed for this reason. Temperature is controlled by a Lakeshore temperature controller 331, with a precision of 0.1 K. The gas line system in ISAC allows to introduce gas species with a controlled composition, determined by quadrupole mass spectrometry (QMS, Pfeiffer Vacuum, Prisma QMS 200). Fig. 1 shows a scheme of the ISAC setup. The gas line is connected to the main chamber through a leak valve. During deposition, this valve is opened and the gas is directed to the cold substrate via a deposition tube. The end of this tube is about 3 cm away from the substrate. The sample holder can be rotated at any desired angle. Infrared spectra were recorded during deposition, irradiation (if it is the case) and temperature programmed desorption (TPD) using Fourier-transform infrared spectroscopy (FTIR) in transmittance mode with a Bruker Vertex 70 at working spectral resolution of 2 cm-1. Laser interferometry at 632.8 nm was implemented in ISAC to measure changes in the ice thickness for this work. A He-Ne red laser (5.0 mW, 500:1 Polarization. Longitudinal mode frequency is 438 MHz with the spectral bandwidth being approximately 1400 MHz, Model: N-LHP-151) and a Silicon Photodiode Power Sensor to measure the optical power of the laser light (model S120C) are placed with an angle of . The distance of 40 cm between the laser and the substrate allows to separate the laser reflection coming from the viewport of ISAC and the laser reflection arriving from the cold substrate where the ice sample is grown.
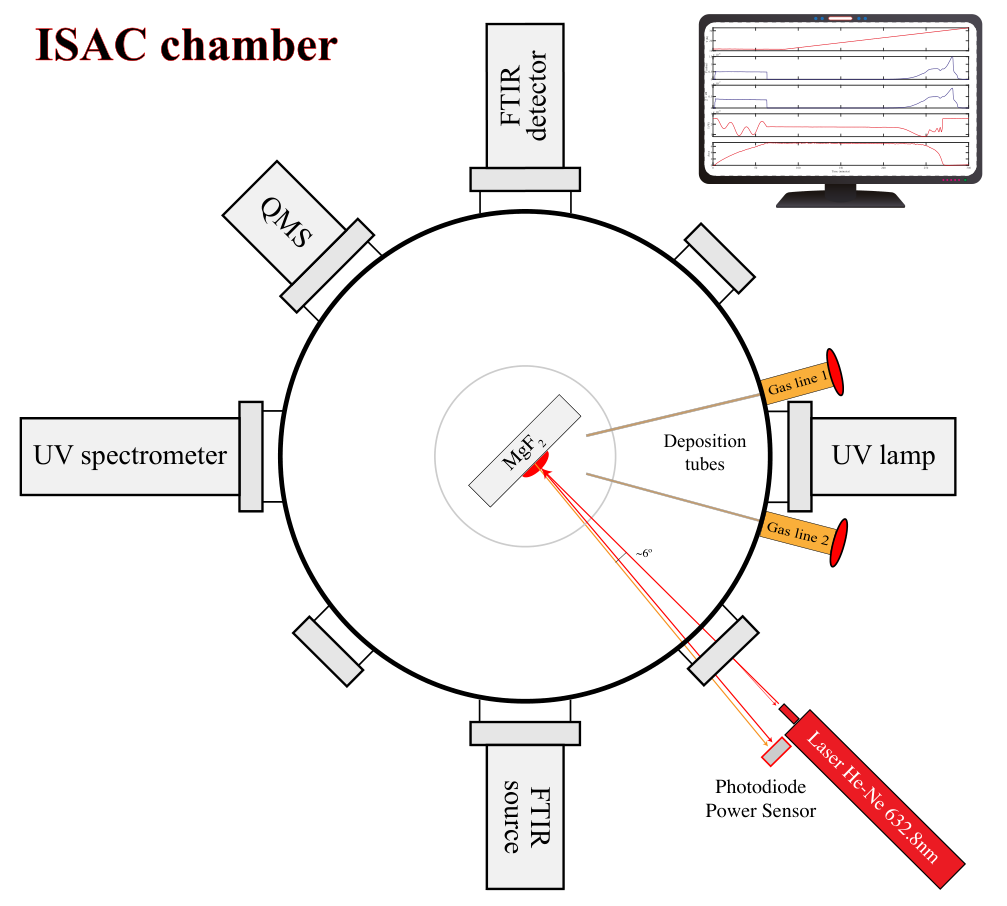
In a typical experiment, once the deposition temperature was reached, CO was introduced in the main chamber for 30 min by opening the leak valve of gas line 2 in Figure 1 and the desired deposition pressure of 1 10-6 mbar was reached. Additional experiments were performed using a lower CO pressure in the 10-8–10-6 mbar range and longer deposition times, to explore the effect of deposition pressure in the ice density. The laser was turned on for more than 30 min before starting the ice deposition, to ensure the stability of the signal. Infrared spectra at 45∘ incidence of the beam relative to the substrate were taken every 60 s during deposition of the ice. The laser was pointing to the substrate and laser interference was measured. Purity of the ice samples was >99.9 %, as inferred from QMS data taken during deposition of the ice. Warm-up of the samples after deposition was carried out at 0.1 K min-1 until desorption ended near 30 K, and IR measurements were performed every 60 s.
Fig. 2 shows the main parameters monitored during the experiments using various instruments. The temperature of the ice sample was measured using a silicon diode sensor placed just below the ice sample and attached to the sample holder. Pressure was monitored in the main chamber of ISAC using a Bayard-Alpert gauge located about 23 cm below the plane where deposition takes place. The relative sensitivity of Bayard-Alpert gauge to CO is 1.0, the same as N2 (Rumble 2022). Because CO was the only gas species deposited on the cold substrate, the pressure profile coincides with the signal measured by QMS. Laser interference was measured continuously, creating an interference pattern during deposition of the ice, and a new interference during TPD. In this configuration, the deposited ice film is homogeneous according to ballistic simulations, in particular the formation of a columnar structure in the ice becomes only important at larger deposition angles, i.e. above 45∘ (González Díaz et al. 2019). Finally, the column density of the ice was obtained from IR spectroscopy using the areas that result from integration of the absorption bands, this is discussed in Sect. 2.3. The lower sensitivity of our FTIR and the time lapses between IR spectra may account for the delayed onset of thermal desorption of the ice compared to the other techniques presented in Fig. 2. From this figure, the end of thermal desorption is observed simultaneously by IR spectroscopy and laser interferometry. The pressure gauge and the QMS still observe an increase of CO molecules in the gas due to desorption from CO ice layers accreted on the cold finger outside the MgF2 substrate window. This effect is enhanced by the absence of a radiation shield in our laser interferometry experiments.

2.2 Ice thickness estimation from laser interference
The ice thickness was measured using single laser interference. One wave is reflected from the ice surface and one transmitted through the ice and then reflected from the surface of the cold substrate used for ice deposition. The reflection of both waves, shown in Figure 3, creates an interference pattern as the result of ice thickness increase during deposition. If the deposition rate is constant, this interference forms a periodic pattern that allows estimation of the ice thickness, e.g. Hecht 2017.
The ray reflected on the ice surface (depicted in red in Fig. 3) travels from to , henceforth . It goes across a medium (vacuum in our experiments) with index of refraction , leading to optical path . The second ray travels across the ice and follows the path where is the ice index of refraction. The optical path length difference of the reflected rays is
| (1) |
From the triangle formed by it follows that
| (2) |
The angle between and the cold substrate is equal to , see Fig. 3, and therefore
| (3) |
can be written as
| (4) |
Using Snell’s law,
| (5) |
we obtain
| (6) | ||||
| (7) |
The optical path length difference can now be expressed as
| (8) | ||||
| (9) | ||||
| (10) |
The phase difference between the two reflected beams is where is the free-space propagation number. Adding the relative phase shift of radians between the reflected beams we obtain
| (11) | ||||
| (12) |
Using Snells´s law, eq. 12 can also be expressed as
| (13) |
The sign of the phase shift has no physical meaning, the minus sign is selected for convenience. An interference maximum occurs when the phase shift is = where = 0, 1, 2, …, then
| (14) |
where . A minimum in the interference curve corresponds to reflected curves displaying peaks of opposite signs, i.e. = , then
| (15) |
In practice, we estimated the ice thickness deposited during the time lapse between two consecutive minima as
| (16) |
where depends on the ice deposition temperature, according to Luna et al. 2022, = 632.8 nm for the He-Ne laser, and the angle is
| (17) |
with = 3o.
Finally, the total reflected signal collected by the sensor in our experiments is the result of the interference of the two reflected rays. If for simplicity only the first back-reflection is considered, what we obtain is known as the reflexibility (Ishikawa et al. 2004). If the medium surrounding the ice layer is air or vacuum, = 1, then
| (18) |
where
| (19) |
| (20) |
and
| (21) |
2.3 Infrared band strength of CO ice
The column density of the ice layer accreted on the cold substrate, in molecule cm-2, is obtained from integration of the infrared absorption band
| (22) |
where is the optical depth of the band, the wavenumber differential in cm-1, and the band strength in cm molecule-1. The integrated absorbance, is equal to 0.43 , where is the integrated optical depth of the band. The most commonly adopted band strength of CO ice is (CO)=1.1 10-17 cm molecule-1 (Jiang et al. 1975). This value of (CO) is revisited in Sect. 3.3.
3 Results
3.1 Interference of substrate window used for ice deposition
The MgF2 window used for ice deposition contracts and expands during cool down and warm-up, respectively. This can lead to a laser interference pattern that may be difficult to disentangle from the one caused by the ice layer during warm-up. The MgF2 window thickness does not change appreciably during ice deposition because the temperature was kept constant. What follows is an estimation of the thickness variation of the 2 mm-thick MgF2 window used in the reported experiments during warm-up or cool down. Figure 4 represents the expansion coefficient of MgF2 at different temperatures based on literature data values (Browder 1975; Browder & Ballard 1977; Feldman et al. 1975) for the 632.8 nm wavelength (blue empty squares). The solid black line is obtained from interpolation of these data points. Using the interpolated values and formula
| (23) |
where and are the time values for substrate temperatures and , the MgF2 window thickness d is calculated at the different temperatures as shown in Fig. 5. This figure shows that during the TPD of CO ice, which desorbed around 30 K in our experiments, there is no expansion of the MgF2 window and ice thickness variations are therefore responsible for the interference curve measured during TPD experiments. For more refractory ices the expansion of the MgF2 window during the TPD needs to be taken into account. In particular, the TPD of water ice from 10 K to its desorption near 170 K, leads to an expansion of the MgF2 window of about one micron.
A similar calculation was performed for a KBr window substrate. For this material, the literature data (Feldman et al. 1975; Meincke & Graham 1965) only allowed to calculate the thickness expansion above 90 K, an increase of 50 K in temperature corresponds to about 4 m expansion of the 2 mm-thick KBr substrate.
For this reason, we selected the MgF2 window as the substrate for laser interferometry measurements of ice samples.
3.2 Density measurements
The volumetric density, , of an ice layer of mass , thickness and flat surface area = 1 cm2 can be expressed as
| (24) |
where = 28 g is the molar mass of CO, Avogadro’s number = 6.022 1023 molecules, and the ice column density measured in the infrared is the number of molecules per cm2. Estimation of the density using this method involves measurement of using laser interferometry and the value of from infrared spectroscopy in transmittance using Eq. 22. The latter commonly assumes a value of the band strength = 1.1 10-17 cm molecule-1 (Jiang et al. 1975). We developed a second method to obtain the density () of CO ice samples and provide a new estimation of . The general expression for the total number of molecules that impinge on the cold substrate per unit time (s) and unit area (cm2) is known as the collision frequency per unit area (), this is
| (25) |
where is the average number of molecules per unit volume and is the average velocity of the molecules according to classical statistical mechanics. For a diluted gas that follows the Maxwell distribution this becomes
| (26) |
where is the gas pressure in the chamber, is the molecular mass, is the Boltzmann constant and is the gas temperature. The validity of the Maxwell distribution in surface physics experiments has been tested (Todorov & Bloch 2017, and ref. therein). In the ultra-high vacuum conditions of our chamber the background pressure is in the 10-11 mbar range. Due to the flow of CO molecules entering the ISAC chamber, the pressure increase measured during deposition in the reported experiments, , ranged from 1 10-6 to 1 10-8 mbar, and therefore . An analog formula was used by Schutte et al. 1993 to estimate the flow in ice deposition experiments, this is
| (27) |
where depends on the efficiency of the vacuum pump and the geometry of the system.
Therefore, the total number of molecules that accrete on the cold substrate per cm2 corresponds to the ice column density and is obtained from
| (28) |
where the proportionality factor must include the sticking probability . This value of is for the Maxwell distribution or according to Schutte et al. 1993. Eq. 28 simply shows that the column density of the accreted ice layer at deposition time is proportional to the increase in pressure . This condition was fulfilled in our experiments: for the same deposition temperature, the deposition rate expressed in units of ice thickness (nm) per second increased linearly with ; it is shown below that very small deviations were found attributable to a small dependence of ice density with . The CO gas temperature is not expected to vary appreciably between experiments. The sticking probability is close to unity and, within experimental errors, does not vary as a function of substrate temperature during deposition until this temperature approaches the desorption temperature (e.g., Sandford & Allamandola 1988; Gerakines et al. 1995; Bisschop et al. 2006). We thus considered as a constant in our experiments.
The density value of 0.876 g cm-3 for CO ice deposited at 20 K, and the refractive indices of CO ice samples deposited at 13 to 28 K (Luna et al. 2022) were adopted. From eqs. 24 and 28, the density of ice deposited at temperature different from 20 K can be obtained using
| (29) |
We note that the factor in eq. 28 does not appear in eq. 29 and therefore our estimation of the ice density at the different deposition temperatures is independent from the value or the expression adopted for . This is a great advantage because is difficult to measure in practice. This method thus requires the measurement of and the ice thickness during deposition in the reference experiment of known density, here the 20 K deposition temperature, and a second experiment at different deposition temperature with unknown density. The parameters of the experiments are summarized in Table 1. The first and second column are the substrate temperature, , and during deposition. The third column is the term , in mbar s m-1, in eq. 29. The fourth column is the ice density obtained with this formula, where the refractive index values, used for the estimation of the ice thickness , are those reported in Luna et al. 2022 and vary with deposition temperature. To test the effect of these values in the density estimation, the fifth and sixth columns are and for the fixed value of n = 1.30 at all temperatures, this is the value for the 20 K deposition experiment. The last column is the total area of the TPD during desorption divided by the same parameter for the deposition, . For experiments performed at the same deposition temperature, this value was highly reproducible and therefore a significant decrease at a certain deposition temperature was indicative of a decrease in the effective sticking probability S during deposition: this effect became observable at 24 K, in agreement with Sandford & Allamandola 1988, and was important at 26 K, where this decrease was near 20 %. For this reason, our method does not allow to estimate the ice density at deposition temperatures above 23 K unless the value of S is known at these high temperatures.
Figure 6 presents the estimated density of CO ice deposited at 11 K in various experiments performed at different deposition pressure of CO gas. Error bars correspond to the standard deviation calculated from at least two repeated experiments performed at the same conditions. According to this data, a relatively small increase in the CO ice density is observed when the deposition was done at the lower CO pressures.
Figure 7 shows the CO ice volumetric densities estimated for the various deposition temperatures from 11 to 23 K. As already mentioned in Sect. 2.1, the reported experiments were performed with no radiation shield and therefore 11 K, instead of the usual 8 K in our ISAC setup, was the lowest achievable temperature. Error bars correspond to the standard deviation calculated from at least two repeated experiments performed at the same conditions. A good agreement is found with the recent values reported in Luna et al. 2022, which is reproduced here for comparison (blue stars). Above 14 K, the CO ice density is stabilized around 0.88 g cm-3. A decrease in the density can be appreciated below 13 K deposition temperature.
| K | mbar | mbar s m-1 | g cm-3 | mbar s m-1 | g cm-3 | |
| 11 | 1 10-6 | 1465.30 | 0.831 | 1488.23 | 0.844 | 1.16 |
| 11 | 1 10-6 | 1487.03 | 0.843 | 1510.31 | 0.857 | 1.15 |
| 11 | 2 10-7 | 1530.94 | 0.868 | 1554.90 | 0.882 | 1.21 |
| 11 | 4 10-7 | 1640.57 | 0.931 | 1666.24 | 0.945 | 1.19 |
| 11 | 5 10-7 | 1507.72 | 0.855 | 1531.32 | 0.869 | 1.19 |
| 11 | 5 10-7 | 1517.92 | 0.861 | 1541.68 | 0.874 | 1.17 |
| 11 | 8 10-7 | 1505.57 | 0.854 | 1529.12 | 0.867 | 1.19 |
| 11 | 1 10-8 | 1538.55 | 0.873 | 1562.63 | 0.886 | 1.30 |
| 12 | 1 10-6 | 1487.15 | 0.844 | 1510.42 | 0.856 | —– |
| 13 | 1 10-6 | 1525.01 | 0.865 | 1548.88 | 0.879 | 1.17 |
| 14 | 1 10-6 | 1519.76 | 0.862 | 1523.28 | 0.864 | 1.17 |
| 15 | 1 10-6 | 1568.16 | 0.889 | 1570.58 | 0.891 | 1.16 |
| 15 | 1 10-6 | 1532.77 | 0.869 | 1535.14 | 0.871 | 1.17 |
| 16 | 1 10-6 | 1554.15 | 0.882 | 1555.35 | 0.882 | 1.16 |
| 17 | 1 10-6 | 1517.99 | 0.861 | 1520.33 | 0.862 | 1.18 |
| 17 | 1 10-6 | 1518.01 | 0.861 | 1520.36 | 0.862 | 1.16 |
| 18 | 1 10-6 | 1553.39 | 0.881 | 1563.02 | 0.887 | 1.16 |
| 18 | 1 10-6 | 1528.33 | 0.867 | 1537.81 | 0.872 | 1.17 |
| 19 | 1 10-6 | 1544.58 | 0.876 | 1544.58 | 0.876 | 1.15 |
| 20 | 1 10-6 | 1544.41 | 0.876 | 1544.41 | 0.876 | 1.16 |
| 20 | 1 10-6 | 1542.38 | 0.875 | 1542.38 | 0.875 | 1.16 |
| 21 | 1 10-6 | 1526.56 | 0.866 | 1526.56 | 0.866 | 1.17 |
| 22 | 1 10-6 | 1537.54 | 0.872 | 1537.54 | 0.872 | 1.16 |
| 23 | 1 10-6 | 1543.98 | 0.876 | 1560.21 | 0.885 | 1.14 |
3.3 Estimation of infrared band strength of CO ice
The infrared band strength of CO ice, , can be estimated from eqs. 22 and 24 according to
| (30) |
Eq. 30 was used for the estimation of the infrared band strength of CO ice, , at 20 K deposition temperature. The recent value of the density () at 20 K from Luna et al. 2022, and the parameters measured in our experiments, i.e. ice thickness and integrated band strength , were used as input in this equation. The main difficulty was the precise determination of the integrated band area, , at different deposition temperatures. Indeed, laser interferometry allows to measure micron-thick ices, but due to saturation of the infrared absorption for thick ice depositions, only a few infrared spectra could be acquired within the duration of one laser interference cycle, i.e. the distance between two minima. Fig. 8 shows a typical experiment, performed at 20 K, for the calculation of the integrated band areas as a function of deposition time. The laser interference corresponding to this experiment is shown in Fig. 9, along with the integrated band areas from Fig. 8, deposition took place between 100 s and 637 s. Despite this limitation, no significant variations were found in the value of as a function of deposition temperature. As mentioned in Sect. 2.1, the spectra were acquired at a 45∘ angle of the infrared beam with respect to the cold MgF2 window where the ice was deposited. We repeated this experiment using the same procedure but this time the infrared spectra of the ice sample were taken at normal incidence angle between the infrared beam and the MgF2 window and, from the ratio of the integrated absorbances, it was found that a multiplication factor of 1/1.30 0.77 is required for the estimation of the column density measured at 45∘. This correction accounts for the larger pathlength of the infrared beam across the ice layer in the 45∘ configuration. The band strength value obtained for 3 experiments where CO ice samples were grown at 20 K is
| (31) |
This value is applicable for infrared spectra measured at normal incidence angle.

4 Conclusions
We found a good agreement between the volumetric ice densities obtained by Luna et al. 2022 at different deposition temperatures of CO and those reported in this work. The different density values reported here for varying CO pressure during deposition indicate that this parameter must also be considered when data among different laboratories are compared. This new methodology can thus be used for calculation of the ice density at different ice accretion temperatures before the onset of thermal desorption, provided that this value is known for one specific temperature. This method presents some advantages: i) only one laser, instead of two, is required, to measure the ice thickness, ii) the microbalance is replaced by the more commonly used FTIR spectrometer for estimation of the ice mass, this allows estimation of the IR band strength of the ice and monitoring of possible structural ice changes, and iii) the pressure of the vacuum chamber is usually recorded during the experiments, or alternatively the mass spectrum of the deposited species, both techniques are routinely used in experimental astrochemistry setups.
The CO ice band strength provided in this work, = (8.7 0.5) 10-18 cm molecule-1, leads to column densities a factor of about 1.3 larger than the most frequently used literature value from Jiang et al. 1975, = 1.1 10-17 cm molecule-1. The updated CO band strength in Bouilloud et al. 2015 considered a refractive index of = 1.25 and density of = 0.8 g cm-3, it is very similar to the value of Jiang et al. 1975. As explained in Sect. 3.3, our lower value of was obtained from our measurements of ice thickness and IR absorbance, and the values reported in Luna et al. 2022 for the CO ice refractive index and density measured at 20 K deposition temperature, respectively = 1.30 and = 0.876 g cm-3.
5 Astrophysical implications
The CO ice density values obtained in this work are in line with those recently reported by Luna et al. 2022. Moreover, we observed a decrease of the density at deposition temperatures below 13 K. This behaviour of the density reminds that of color in analog CO ice experiments, where the color temperature increases in the same deposition temperature range. Eye observations see a brownish color at 8 K that becomes gradually less intense up to 13 K. At higher deposition temperatures, the CO ice is translucent and becomes almost transparent when the temperature approaches the thermal desorption of the ice, suggesting that the ice is nearly crystalline (Carrascosa et al. 2021). These colorimetric measurements and the linear drop of the CO photodesorption rate (Öberg et al. 2007; Öberg et al. 2009; Muñoz Caro et al. 2016; Sie et al. pted) for increasing deposition temperature, might be a manifestation of molecular disorder in CO ice grown below 20 K. If this is correct, CO ice grown at the lowest investigated temperature, around 10 K, presents the highest molecular disorder, and we report here that this CO ice structure corresponds to the lowest ice density.
Jiang et al. 1975 estimated the infrared band strength of CO ice deposited at high pressure compared to modern setups: their deposition rate of 0.5 to 2 m requires a pressure about 16 to 66 times higher than typical experiments performed at 1 10-6 mbar during deposition. To obtain this band strength, Jiang et al. 1975 also adopted a literature value of the CO ice density measured at a relatively high temperature, 30 K (Vegard 1930). According to Luna et al. 2022 and this work, the CO ice density depends on the temperature and pressure during deposition, and therefore, the value of the CO infrared band strength in Jiang et al. 1975 needs a revision. We propose to use = (8.7 0.5) 10-18 cm molecule-1 for future column density estimations. This value is valid in the experimental range from 11 to 28 K deposition temperatures investigated in this work, for which no variations of the integrated absorbance area and sticking probability were found (Cazaux et al. 2017). The CO ice column density values reported in previous experimental and observational papers might thus be underestimated, they would be about 23 % lower than the actual value. Most of the CO ice column densities reported in the literature adopted a band strength of = 1.1 10-17 cm molecule-1 (Jiang et al. 1975), they would need to be multiplied by a factor of 1.3 for correction. An example is the number of monolayers on the surface, or just beneath the surface of the ice, involved in the photodesorption of CO, i.e. = 5 1015 molecules cm-2 or about 5 monolayers (ML) where 1 ML = 1 1015 molecules cm-2 (Muñoz Caro et al. 2010; Fayolle et al. 2011; Chen et al. 2014). After correction, this becomes 6.5 ML. Considering our average density value of CO ice deposited at 11 K, 0.837 g cm-3, and Eq. 24, it is found that the thickness of one monolayer is 0.56 nm, and 3.36 nm for the top 6.5 ML of ice. The UV photons emitted by the MDHL that are absorbed deeper than 3.36 nm would not lead to photodesorption of CO molecules.
Acknowledgements
This research has been funded by projects PID2020-118974GB-C21, PID2020-118974GB-C22, and MDM-2017-0737 Unidad de Excelencia “María de Maeztu”– Centro de Astrobiología (INTA-CSIC) by the Spanish Ministry of Science and Innovation, and grant No. NSTC 110-2628-008-004-MY4 from Taiwan. The student G. Mettepenningen from TU Delft participated in the preliminary phase of this project.
Data Availability
The data underlying this article cannot be shared publicly.
References
- Bertin et al. (2012) Bertin M., et al., 2012, Phys. Chem. Chem. Phys., 14, 9929
- Bertin et al. (2013) Bertin M., et al., 2013, The Astrophysical Journal, 779, 120
- Bisschop et al. (2006) Bisschop S. E., Fraser H. J., Öberg K. I., van Dishoeck E. F., Schlemmer S., 2006, A&A, 449, 1297
- Bouilloud et al. (2015) Bouilloud M., Fray N., Benilan Y., Cottin H., Gazeau M.-C., Jolly A., 2015, Monthly Notices of the Royal Astronomical Society, 451, 2145
- Browder (1975) Browder J., 1975, Journal of Physics and Chemistry of Solids, 36, 193
- Browder & Ballard (1977) Browder J. S., Ballard S. S., 1977, Appl. Opt., 16, 3214
- Carrascosa et al. (2019) Carrascosa H., Hsiao L. C., Sie N. E., Muñoz Caro G. M., Chen Y.-J., 2019, Monthly Notices of the Royal Astronomical Society, 486, 1985
- Carrascosa et al. (2021) Carrascosa H., Muñoz Caro G. M., González Díaz C., Suevos J., Chen Y.-J., 2021, The Astrophysical Journal, 916, 1
- Caselli et al. (1999) Caselli P., Walmsley C. M., Tafalla M., Dore L., Myers P. C., 1999, The Astrophysical Journal, 523, L165
- Cazaux et al. (2003) Cazaux S., Tielens A. G. G. M., Ceccarelli C., Castets A., Wakelam V., Caux E., Parise B., Teyssier D., 2003, The Astrophysical Journal, 593, L51
- Cazaux et al. (2017) Cazaux S., Martín-Doménech R., Chen Y.-J., Muñoz Caro G. M., González Díaz C., 2017, ApJ, 849, 80
- Cecchi-Pestellini & Aiello (1992) Cecchi-Pestellini C., Aiello S., 1992, Monthly Notices of the Royal Astronomical Society, 258, 125
- Chen et al. (2014) Chen Y.-J., Chuang K.-J., Muñoz Caro G. M., Nuevo M., Chu C.-C., Yih T.-S., Ip W.-H., Wu C.-Y. R., 2014, ApJ, 781, 15
- Chen et al. (2017) Chen Y.-J., et al., 2017, Phys. Rev. Lett., 119, 157703
- Ciaravella et al. (2012) Ciaravella A., Jiménez-Escobar A., Muñoz Caro G. M., Cecchi-Pestellini C., Candia R., Giarrusso S., Barbera M., Collura A., 2012, The Astrophysical Journal, 746
- Ciaravella et al. (2016) Ciaravella A., Chen Y.-J., Cecchi-Pestellini C., Jiménez-Escobar A., Muñoz Caro G. M., Chuang K.-J., Huang C.-H., 2016, The Astrophysical Journal, 819, 38
- Cruz-Díaz et al. (2014) Cruz-Díaz G. A., Muñoz Caro G. M., Chen Y.-J., Yih T. S., 2014, A&A, 562, A120
- Dartois et al. (2021) Dartois E., Chabot M., Barkach T. I., Rothard H., Boduch P., Augé B., Agnihotri A. N., 2021, A&A, 647, A177
- Fayolle et al. (2011) Fayolle E. C., Bertin M., Romanzin C., Michaut X., Öberg K. I., Linnartz H., Fillion J.-H., 2011, ApJ, 739, L36
- Feldman et al. (1975) Feldman A., Horowitz D., Waxler R. M., Malitson I. H., Dodge M. J., 1975. National Bureau of Standards Washington DC Ceramics glass and solid State Science Div, https://nvlpubs.nist.gov/nistpubs/Legacy/IR/nbsir78-1473.pdf
- Gerakines et al. (1995) Gerakines P. A., Schutte W. A., Greenberg J. M., van Dishoeck E. F., 1995, A&A, 296, 810
- González Díaz et al. (2019) González Díaz C., Carrascosa de Lucas H., Aparicio S., Muñoz Caro G. M., Sie N.-E., Hsiao L.-C., Cazaux S., Chen Y.-J., 2019, Monthly Notices of the Royal Astronomical Society, 486, 5519
- Hecht (2017) Hecht E., 2017, Optics, global edition edn. Pearson Education
- Huang et al. (2020) Huang C.-H., et al., 2020, The Astrophysical Journal, 889, 57
- Ishikawa et al. (2004) Ishikawa K., Yamano H., Kagawa K., Asada K., Iwata K., Ueda M., 2004, Optics and Lasers in Engineering, 41, 19
- Jiang et al. (1975) Jiang G. J., Person W. B., Brown K. G., 1975, The Journal of Chemical Physics, 62, 1201
- Lasne et al. (2015) Lasne J., Rosu-Finsen A., Cassidy A., McCoustra M. R. S., Field D., 2015, Phys. Chem. Chem. Phys., 17, 30177
- Luna et al. (2022) Luna R., Millán C., Domingo M., Santonja C., Satorre M. Á., 2022, The Astrophysical Journal, 935, 134
- McCoustra & Thrower (2018) McCoustra M., Thrower J., 2018, in Wandelt K., ed., , Encyclopedia of Interfacial Chemistry. Elsevier, Oxford, pp 383–395, doi:https://doi.org/10.1016/B978-0-12-409547-2.13910-1
- Meincke & Graham (1965) Meincke P. P. M., Graham G. M., 1965, Canadian Journal of Physics, 43, 1853
- Muñoz Caro et al. (2010) Muñoz Caro G. M., Jiménez-Escobar A., Martín-Gago J. Á., Rogero C., Atienza C., Puertas S., Sobrado J. M., Torres-Redondo J., 2010, A&A, 522, A108
- Muñoz Caro et al. (2016) Muñoz Caro G. M., Chen Y.-J., Aparicio S., Jiménez-Escobar A., Rosu-Finsen A., Lasne J., McCoustra M. R. S., 2016, A&A, 589, A19
- Öberg et al. (2007) Öberg K. I., Fuchs G. W., Awad Z., Fraser H. J., Schlemmer S., van Dishoeck E. F., Linnartz H., 2007, ApJ, 662, L23
- Öberg et al. (2009) Öberg K. I., van Dishoeck E. F., Linnartz H., 2009, A&A, 496, 281
- Pontoppidan et al. (2008) Pontoppidan K. M., Blake G. A., van Dishoeck E. F., Smette A., Ireland M. J., Brown J., 2008, The Astrophysical Journal, 684, 1323
- Prasad & Tarafdar (1983) Prasad S. S., Tarafdar S. P., 1983, ApJ, 267, 603
- Roux et al. (1980) Roux J. A., Wood B. E., Smith A. M., Plyer R. R., 1980, Final Report, 1 Oct. 1978 - 1 Sep. 1979 ARO, Inc., Arnold Air Force Station, TN., pp 1–86
- Rumble (2022) Rumble J. R., 2022, Physical Constants of Organic Compounds in CRC Handbook of Chemistry and Physics, 103rd edition (internet version) edn. CRC Press/Taylor and Francis, Boca Raton, FL.
- Sandford & Allamandola (1988) Sandford S. A., Allamandola L. J., 1988, Icarus, 76, 201
- Schutte et al. (1993) Schutte W. A., Allamandola L. J., Sandford S. A., 1993, Icarus, 104, 118
- Shen et al. (2004) Shen C. J., Greenberg J. M., Schutte W. A., van Dishoeck E. F., 2004, A&A, 415, 203
- Sie et al. (pted) Sie N.-E., Cho Y.-T., Huang C.-H., Muñoz Caro G. M., Hsiao L.-C., Lin H.-C., Chen Y.-J., 2022 accepted, The Astrophysical Journal, arXiv number 4499702
- Todorov & Bloch (2017) Todorov P., Bloch D., 2017, The Journal of Chemical Physics, 147, 194202
- Urso et al. (2016) Urso R. G., Scirè C., Baratta G. A., Compagnini G., Palumbo M. E., 2016, A&A, 594, A80
- Vegard (1930) Vegard I., 1930, Zeitschrift für Physik, 61, 185