Datavoidant: An AI System for Addressing Political Data Voids on Social MediaDOI: 10.1145/1122445.1122456Conference: CSCW ’22: The 25th ACM Conference On Computer- Supported Cooperative Work And Social Computing ; November 12-16, 2022; Taipei, TaiwanCSCW ’22: The 25th ACM Conference On Computer- Supported Cooperative Work And Social Computing , November 12-16, 2022, Taipei, TaiwanPrice: 15.00ISBN: 978-1-4503-XXXX-X/18/06CCS: Human-centered computing Collaborative and social computing systems and tools; Collaborative and social computing design and evaluation methods
Abstract.
The limited information (data voids) on political topics relevant to underrepresented communities has facilitated the spread of disinformation. Independent journalists who combat disinformation in underrepresented communities have reported feeling overwhelmed because they lack the tools necessary to make sense of the information they monitor and address the data voids. In this paper, we present a system to identify and address political data voids within underrepresented communities. Armed with an interview study, indicating that the independent news media has the potential to address them, we designed an intelligent collaborative system, called Datavoidant. Datavoidant uses state-of-the-art machine learning models and introduces a novel design space to provide independent journalists with a collective understanding of data voids to facilitate generating content to cover the voids. We performed a user interface evaluation with independent news media journalists (N=22). These journalists reported that Datavoidant’s features allowed them to more rapidly while easily having a sense of what was taking place in the information ecosystem to address the data voids. They also reported feeling more confident about the content they created and the unique perspectives they had proposed to cover the voids. We conclude by discussing how Datavoidant enables a new design space wherein individuals can collaborate to make sense of their information ecosystem and actively devise strategies to prevent disinformation.
1. Introduction
Disinformation erodes the integrity of the information circulating on social media and reduces our capacity to make sense of it (Starbird et al. 2019). Together, this has impacted our society in negative ways. For instance, disinformation is negatively impacting our elections (Recuero et al. 2020; Woolley and Howard 2017; Flores-Saviaga et al. 2018), and it is even hurting people’s health by having them follow dangerous health conspiracy theories (Dupuis et al. 2021; Lu et al. 2021; Lee et al. 2021). Consequently, journalists and academics have spent significant time studying and identifying different ways to mitigate and address the problem of disinformation (Xu et al. 2021; Wild et al. 2020; Schwartz and Overdorf 2020; Stray 2019; Zhou and Zafarani 2019; Zhang et al. 2018). Journalists (Haque et al. 2020; McClure Haughey et al. 2020; Shu et al. 2019), professional fact-checkers (Noain-Sánchez 2020a; Noain-Sánchez 2020a), and automatic disinformation detection systems (Alam et al. 2021; Castelo et al. 2019; Jiang and Wilson 2021; Zeng et al. 2021) have contributed to countering the infodemic. However, bad actors are using a disinformation dynamic that journalists and academics have not yet been able to address (Donovan and Boyd 2021). This disinformation dynamic has dangerously targeted underrepresented groups to spread political lies and hinder their civic participation (Flores-Saviaga and Savage 2019; Thakur and Hankerson 2021). The dynamic consists of weaponizing the limited information that exists about a political topic to promote disinformation, especially concerning an underrepresented population. In other words, the bad actors are weaponizing “data voids” (Golebiewski and boyd 2019). A data void or data deficit, occurs when there is high demand for information about a topic, but credible information is non-existent or in low supply. The low supply can help the bad actors fill the void with their own ideological, economic, or political agendas more easily (Shane and Noel 2020; Smith and Cubbon 2020). Bad actors can expose their problematic content to wider audiences, by filling the voids with their own information. Especially, because when people search for the topic, search engines and social media platforms will tend to give the problematic content higher visibility (as there is no other content available) (Shane 2021; Kou et al. 2017; Hagen et al. 2019). Recent studies have highlighted that an effective way to start to address the problem is through collaborations of independent news media (Thakur and Hankerson 2021; Ziff 2016; Spangenberg and Heise 2014). Independent news media, different from the mainstream, has the incentives to collaborate and cover important data voids affecting society (Anderson and Rainie 2017; Donovan and Boyd 2021; Bayer et al. 2019). However, independent journalists currently are understaffed and have limited resources and tools (Ismail 2018); while, mainstream media is more tied to monetary incentives that can limit the type of news that can be covered (Entman 2010).
To empower independent journalists to identify and address data voids, we follow a human-centered design approach (Norman 2013) to ground the creation of a system that supports journalists in these tasks (See Figure 1). First, we conduct an interview study to understand the social processes, needs and challenges that independent journalists currently face for addressing data voids. We interview journalists who address political data voids concerning underrepresented populations (a critical type of data void given its implications in elections and civic engagement (Schneider 2021; Maly 2021)). Through interviews, we found that independent journalists work together to monitor social media, particularly Facebook, as part of their daily routine to find data voids. These journalists perceived themselves as uniquely positioned to collectively counter disinformation and data voids targeting underrepresented communities. However, the whole process usually takes them days because they lack systems to support their work effectively. They revealed that a significant amount of manual labor takes place.
Armed with this knowledge of how independent journalists operate, prior work, and Pirolli’s et al. sensemaking theory (Pirolli and Card 2005), we designed an intelligent collaborative system to support journalists in addressing data voids: Datavoidant. Datavoidant has two primary modules for empowering journalists to identify and cover data voids: “Intelligent Data Void Visualizer” and “Collaborative Data Void Addresser.” The Intelligent Visualizer deploys state-of-the-art machine learning models and data visualizations to help journalists collectively identify data voids on multiple levels. The module visualizes categorized social media data with intuitive figures and automated summaries to help journalists conduct collaborative sensemaking and understand where the data voids exist. The “Collaborative Data Void Addresser” introduces collaboration features to help journalists combine findings and create strategies on how they will fill the voids. It is important to note that most systems for journalists focus on helping them to fact check disinformation or conduct collaborative storytelling of local news (Karmakharm et al. 2019; Dalgali and Crowston 2020; Lin et al. 2021). Instead, Datavoidant, integrates key design features to enable journalists to specifically work for underrepresented populations and cover data voids present in their information ecosystem. Some of these key design features are that Datavoidant: operates within Facebook, which is the largest social network used for news consumption, especially among underrepresented communities (Newman et al. 2021); facilitates collaborations among journalists on a diverse set of political topics considering that diverse expertise is needed when working with underrepresented populations (Daniel and Jacquelyn 2020); and has a “backstage” space to enable journalists to strategize what content to produce to cover a data void (having a backstage is important because the journalists need to identify best ways to engage underrepresented populations with content that will be presented to them for the first time). Our evaluation study revealed that journalists found our tool easy to use, and appreciated the intelligent summaries, deep dives, and multiple perspectives that Datavoidant offered for inspecting the data. These features enabled journalists to quickly visualize what was occurring in the information ecosystem; collaborate and create strategies to collectivelly fill the data voids more effectively, while feeling more confident about the content they created and the unique perspectives they were able to offer. In this paper, we contribute: 1) an investigation of independent journalists’ practices for covering political data voids targeting underrepresented populations; 2) a system supporting independent journalists to cover data voids; 3) novel mechanisms for collective sensemaking and knowledge production; and 4) an interface evaluation showing that Datavoidant allows journalists to identify data voids on multiple levels.
2. Related Work
In this section, we first summarize the relationship between data voids and disinformation. Next, we discuss the evolution of journalism due to the popularity of social media and how disinformation has affected how they work. Furthermore, we examine how disinformation affects underrepresented communities (e.g. Latinx) and why advocacy groups are urging independent journalists within these groups to assist in tackling the problem. Then, we overview the sensemaking process used to help design our system. Finally, we discuss the current tools used by journalists for disinformation detection (Pirolli and Card 2005) and the challenges they face that motivate our system.
2.1. Data Voids, Data Deficits and, Disinformation.
Data voids were first studied in the context of search engines. According to Golebiewski and Boyd (Golebiewski and boyd 2019), a data void, or data deficit, occurs when there is high demand for information about a topic, but credible information is non-existent or in low supply. Fewer conversations regarding topics in different bipartisanship contexts can create deficits with weighted narratives of the predominant groups, leaving malicious actors free to exploit these deficits and instill their political and ideological agenda (Golebiewski and boyd 2019). As a result, when people are searching for the topic, search engines and social media platforms will show high visibility to the problematic content (Shane 2021; Golebiewski and boyd 2019), helping to increase the exposure to the political agendas of conspiracy theorists, white nationalists, and other extremist groups. Consequently, data voids on social media actively contribute to the spread of disinformation and cause real-world harm (Shane 2021; Smith and Cubbon 2020; Hernandez 2020).
The terms misinformation and disinformation are frequently used interchangeably; however, they are not synonymous. Although both terms refer to inaccurate, incorrect, or misleading information, the main difference is the intention behind them. Misinformation refers to inaccurate or erroneous information spread without intending to cause harm (Jack 2017), such as in crises when there is a lack of verified information (Starbird et al. 2014). In contrast, disinformation refers to the dissemination of false information with the intent of deceiving the public; for instance, for political purposes (Bittman 1985). The danger of disinformation is that it is designed to resonate with the existing beliefs of a targeted audience, therefore giving it a greater likelihood of being accepted as fact (Rid 2020). For years, state actors and partisan groups had spread disinformation through “disinformation campaigns” (Rid 2020; Bittman 1985). In this study, we focus on political information, in which bad actors can spread information to deceive public opinion, therefore, we use the term “disinformation”. Regarding our use of the term “data voids”, we recognize the term “data” has experienced a variety of definitions (Ackoff 1989); however, we use the term “data voids” to remain consistent with how previous research has defined it (Shane and Noel 2020; Maly 2021).
Recent research has analyzed how malicious actors weaponize data voids (Starbird et al. 2019; Thakur and Hankerson 2021; Flores-Saviaga and Savage 2019; Rory Smith 2021) and orchestrate disinformation campaigns (Pasquetto et al. 2022; Wilson and Starbird 2021), some of which target underrepresented communities (Starbird et al. 2019; Arif et al. 2018). A recent study found that data voids emerged on social media in the early stages of the COVID-19 pandemic as underrepresented communities sought health information (Rory Smith 2021). The study revealed that the data voids were being filled with disinformation, resulting in the development of narratives detrimental to vaccine confidence and trust in governmental institutions by underrepresented communities. For example, Facebook posts claimed that the COVID-19 vaccine altered people’s DNA and cause infertility in recipients. Researchers concluded that, since there was no high-quality information to challenge these narratives (i.e., there was a data void), the public, especially underrepresented populations, could not understand the development of the COVID-19 vaccine, and disinformation narratives easily spread without being confronted (Rory Smith 2021). For this reason, researchers recommend to stop relying on fact-checking efforts and platforms’ content moderation, since these approaches are reactive, insufficient, and potentially counterproductive (Chou et al. 2021; Lewandowsky et al. 2012). Researchers have argued that instead, there should be a focus on adopting a proactive stance where data voids are addressed before they are weaponized (Smith and Cubbon 2020; Rory Smith 2021; Hernandez 2020). Next, we discuss more on how journalists work on social media, and their efforts to proactively address disinformation and data voids. We connect how this influenced our system design.
2.2. The emergence of Social Media Journalism and Online Disinformation.
The rising popularity of social media has led news organizations and independent journalists to publish their news reports on these platforms (Newman 2011). These platforms have become especially important as people increasingly use them to consume their daily news (Shearer 2018). Similarly, journalists have started to heavily rely daily on social media to discover and share breaking news, connect with sources, and promote their work (Hermida 2012). For instance, during breaking news events, journalists monitor the social media accounts of institutions, people, and public figures to contextualize information and use it as part of their reporting (Newman 2009). Within the context of journalists focused on underrepresented audiences, most typically go on Facebook and post their news reports within Facebook groups and pages related to the underrepresented populations they target (Robé and Wolfson 2020). The journalists also tend to create their own Facebook groups or pages, and post their news stories on those spaces (Direito-Rebollal et al. 2020). Such practices have been adopted by both mainstream media and independent journalists; the latter have tended to use social media more, as it allows them to better connect and expand their audience (Hermida 2012). However, due to the increasing popularity of social media, the low entry barriers, and the data voids present (Ireton and Posetti 2018; Golebiewski and boyd 2019; Shane 2021), it has also been possible for disinformation to spread on these platforms. A recent survey of more than one-thousand journalists revealed that the proliferation of disinformation on social media has negatively affected them (PENAmerica 2022). They feel overwhelmed and outmatched (McClure Haughey et al. 2020), especially because they do not believe they have the skills and tools necessary to make sense of the amount of information they encounter to address disinformation properly (McClure Haughey et al. 2020; Beers et al. 2020). When aiming to counter disinformation, journalists must typically decide if they want to debunk it and how, since debunking the disinformation could also amplify it further (PENAmerica 2022; McClure Haughey et al. 2020). Thus, researchers argue for proactive measures to address disinformation. In such setting, social media content that may be weaponized for disinformation should be proactively addressed before it becomes problematic (Smith and Cubbon 2020; Rory Smith 2021; Hernandez 2020). However, the problem is that we currently lack tools to empower journalists for this task, especially within the context of the information ecosystem of underrepresented communities (nhmc 2020). This problem inspired our research. Next, we present more about underrepresented populations, disinformation, and the role of independent journalism in this context.
2.3. Disinformation, Underrepresented Groups, and Independent Journalism.
Disinformation targeting underrepresented groups can have significant consequences. Such consequences include eroding trust in institutions, suppressing their vote, increasing hatred against them, or even putting their health at risk (Judit and Bognar 2021; Thakur and Hankerson 2021). For example, in the case of the Latinx community, advocacy groups and governments are concerned about the role disinformation targeting the Latinx community could have on democracy (Sesin 2020; Gamboa 2020; Ghaffary 2020; Rodriguez and Caputo 2020). In the run-up to U.S. 2020 election, data voids were filled with disinformation and conspiracy theories regarding political issues in order to influence and divide Latinx voters or spark violence (Christopher Bing 2020). Examples of disinformation that emerged from data voids that were circulating on Facebook (the go-to platform for Latinx (Auxier 2020)), included: narratives that connected Biden to socialism (which may have been intended to dissuade Latino voters who fled socialist regimes in Venezuela, Cuba and Nicaragua) (Rodriguez and Caputo 2020); narratives intended to put Latino and Black voters against one another (Hazard 2020); or narratives that questioned in Spanish the reliability of mail-in voting (page 2020; Christopher Bing 2020). Organizations focused on Native Americans, Black, Afro-Latinx, and Latinx communities found that, during that time, large newsrooms were tackling disinformation based on what they assumed were relevant issues rather than attempting to learn which election-related issues were most important to those underrepresented communities (Daniel and Jacquelyn 2020; Hernandez 2020). Part of the problem, is that main stream media is interested in large profits (Herman and Chomsky 2010) or lacks proper representation of minorities in their staff (Dec 2018; PENAmerica 2022). As a result, they do not cover news stories tailored to the needs of those communities (Daniel and Jacquelyn 2020). Here is where independent journalists play a key role. Without independent journalism that focuses on underrepresented communities and creates content for them, the communities are less likely to be politically informed, become civically engaged, or get access to information shared by authentic sources they trust (PENAmerica 2022). As a result, independent journalists have become the ones addressing the information needs of these communities, as well as combating disinformation targeting them (Daniel and Jacquelyn 2020). However, this is also time consuming and difficult (nhmc 2020), especially because most journalists lack tools to help them in the process (PENAmerica 2022). In this research, we focus on creating a tool to help journalists address data voids in underrepresented communities. We argue we can accomplish this task by connecting to sensemaking theory and integrating it into our design. Next, we present about sensemaking theory, how it connects to data voids and our design process.
2.4. Disinformation and Sensemaking.
The process of understanding a data void can be understood as a sensemaking task to gather and analyze a large variety of unstructured data and arrive at a conclusion (Pirolli and Russell 2011; Pirolli and Card 2005). Pirolli and Card (Pirolli and Card 2005) characterize sensemaking as a bottom-up process that involves a series of iterations: foraging for relevant source data (e.g., searching and filtering for relevant Facebook groups/pages to study data voids and disinformation in them), extracting useful information (e.g., collecting and reading the data from the groups/pages), organizing and re-representing the information (e.g., schematizing the extracted data from the groups/pages), developing hypotheses from different perspectives (e.g., building a case about the different types of data voids present in the Facebook groups/pages), and deciding on the best explanation or outcome (e.g., deciding what story/narrative to write to address a particular void). There are active research efforts in the CSCW community focused on building tools that support collaborative sensemaking (Qu and Hansen 2008). Some example include tools for collaborative sensemaking in: web search (Paul and Morris 2009), mystery solving (Li et al. 2018b), self-directed learning (Butcher and Sumner 2011), and knowledge creation (Pirolli and Russell 2011). In this paper, we develop a human-AI collaboration solution that automates parts of the sensemaking pipeline to help journalists to more effectively address political data voids together. Next, we discuss general tools that journalists have for addressing disinformation, and we contextualize them with our system.
2.5. Journalism Tools to Address Disinformation.
According to Zubiaga et al. (Zubiaga et al. 2018), social media have become a critical publishing tool for journalists (Diakopoulos et al. 2012; Tolmie et al. 2017). However, the absence of control and fact-checking of posts makes social media a fertile ground for spreading unverified and/or false information (Zubiaga et al. 2018). The traditional approach to combating disinformation gaining popularity in recent years is fact-checking. Nevertheless, fact-checking is tedious work that does not keep up with the staggering amount of content posted on social media every day (Allen et al. 2021). For this reason, research efforts have been devoted to designing collaborative systems to help fact-checkers and journalists address mis- and disinformation. For instance, collaborative tools for fact-checking news (Sethi and Rangaraju 2018), videos (Carneiro et al. 2019) and visual disinformation (Venkatagiri et al. 2019; Matatov et al. 2018). Similar systems were also proposed to combat disinformation with crowdsourcing such as Newstrition (Joi [n. d.]), Checkdesk (Che [n. d.]) and Truly Media (Caled and Silva 2021). However, these methods generally underperform professional fact-checkers and rely heavily on politically knowledgeable individuals (Godel et al. 2021). Additionally, none of the tools are tailored to monitor and detect data voids. In fact, journalists do not use sophisticated tools to perform their job (Beers et al. 2020; McClure Haughey et al. 2020). For instance, Brands et al. (Brands et al. 2018) found that journalists use TinEye, FotoForensics, and Google’s reverse image search for image verification; InVid for video verification; Google Maps for audiovisual verification and Botometer for verifying unauthentic accounts on Twitter. Additionally, they found that journalists used Excel and Google Sheets to perform their analyses, including visualizing and aggregating data.They report that some of them used TweetDeck and CrowdTangle. Brandtzaeg et al. (Brandtzaeg et al. 2016) found that journalists in Europe also use traditional methods such as Exif, Topsy, Tungstene to verify images and videos posted on social media. Meanwhile, researchers coincide in the view that many journalists locate stories to cover lurking on social media feeds (Brands et al. 2018; Beers et al. 2020; Brandtzaeg et al. 2016). However, journalists report having a limited understanding of how to use some of these tools because some are not explicitly designed for journalists, are not intuitive to use (PENAmerica 2022), and not tailored for them (Beers et al. 2020). Other researchers also acknowledge the lack of understanding of journalists’ needs and values to design tools to support their work (McClure Haughey et al. 2020; Komatsu et al. 2020). Additionally, researchers have not developed systems that detect data voids (Shane 2021). Our work complements the lack of systems for addressing political data voids on social media. We also take a human centered design approach and conduct interviews with journalists to understand their needs and practices, and thus create a tool that will be useful for journalists to tackle data voids. We also connect to sensemaking theory to further help us in our design.
3. Interview Study
Our interview study aimed to understand the practices that independent journalists currently follow to address data voids targeting underrepresented communities. We use the findings from this study to help us explore and understand the design space. Notice that due to the niche nature of combating disinformation narratives that target underrepresented communities, the pool of interviewees was limited. It was therefore important to avoid sharing detailed information about our interviewees as they could be more easily identifiable given the few actors in the space (Carlson et al. 2021; Waisbord 2020).
3.1. Interview Study Participants
We invited independent news journalists to our study through social media, professional networks, and by attending disinformation workshops for independent journalists working with underrepresented communities. We also used snowball sampling to invite more individuals (Goodman 1961). For the purpose of the study, we considered independent news journalists as those who felt they were free to report on issues of public interest given that the organizations where they worked were free of the influence of governments, and other partisan interests (Deane 2016). In total, we recruited 22 individuals, all self-identified as independent news journalists; they created content to address disinformation targeting underrepresented populations (See in our appendix Table 4 with details of our interviewees). The majority of our participants (20) specialized exclusively in underrepresented communities; they worked in either niche newspapers, digital first outlets, or non-profit newsrooms; most (20) self-identified as underrepresented individuals, and worked primarily with either Latinx, Black, and Native American communities in the US. It is important to highlight that two of the authors of this paper are from underrepresented communities and have previously worked with independent journalists who concentrated on underrepresented communities. This helped us identify mailing lists, workshops, and social media spaces where we could connect with these type of journalists. Note, however, that participant recruitment was done entirely separately from our prior direct engagement with journalists. Futthermore, the recruitment was primarily led by students who were unknown to the journalists to ensure that participants saw participation as voluntary. In the rest of the paper we refer to these participants with the identification of “J”.
3.2. Interview Study Protocol
We interviewed 22 independent news journalists. These interviews helped us obtain information detailing how independent journalists addressed data voids, their motivations for covering them, and the challenges they faced. Although we could have interviewed more independent journalists to obtain additional insights, the interviews conducted allowed us to achieve sufficient data saturation (Guest et al. 2006; Weller et al. 2018) for the themes presented here. Our interview focused first on asking questions about the nature of participants’ jobs in journalism, their background (e.g., what they studied, other jobs they had in the past), and experiences using social media and related tools for their journalism. Next, we elicited information about how they worked, how they decided what stories to cover, how they used social media for news reporting, and how they tackled disinformation in their work. We also asked them to mention the opportunities and challenges they faced in their general journalism work and when addressing disinformation. We also questioned whether they had witnessed data voids and how they tackled them (pain points, high points, and also a walk-through of the process they adopted to cover the data voids). We were also interested in the type of values they had adopted for conducting their work (to help us understand their priorities). All of our interview questions were checked with our partners in journalism to ensure they were appropriate.
3.3. Data Analysis of the Interview Study
To analyze the interview responses, we coded them to extract initial concepts (Mihas 2019). To develop a set of codes for the data, two of the authors independently coded the data. They then worked together to create 17 axial codes, which were applied top-down to the responses from journalists. From the top-down axial codes, the authors then organized the interview data into 7 themes and produced a final list of mutually exclusive themes that denoted the main findings from our interviews. The 7 themes were highly agreed upon by the intercoders (Cohen’s Kappa coefficient (k) = 0.79). Authors discussed the disagreements during the writing and final synthesis process of the themes.
3.4. Interview Study Findings
We now present the 7 main themes (findings) that emerged from our interview analysis.
Finding 1. Independent media organizations perceive themselves as uniquely positioned to counter disinformation targeting underrepresented populations. 19 of the interviewed journalists thought mainstream news outlets had a difficult time addressing disinformation targeting underrepresented populations. They believed it was better for independent news media to take on the responsibility: “…In the fight against disinformation, we [independent media] play a crucial role. This is especially true if we consider that we [independent media] are economically and legally protected from having our editorial line influenced by the interests of our funding agencies…” J5. Part of the reason why they considered that independent news media were better for this is that they viewed the task as a social justice activity that tried to fix some of the distortions that mainstream media originally produced: “There’s a lot of social justice involved, especially because we know mainstream media is often run by monopolies and has a political agenda; a lot of the Hispanic media distorts reality […] hence, independent media brings you the truth no one else wants to tell. The independent journalists are like “social justice warriors”, they are the ones who risk their lives in the middle of a protest, and the ones who sometimes get gassed by the police. They are the ones who dare to be able to say what is happening, both from one side and the other.” J3. According to 8 of the journalists, a major advantage and opportunity that independent media is free from economic ties to any particular organization: “Media outlets outside the mainstream have a better chance of communicating truthfully and openly with citizens, as mainstream media have to follow agreements with governments, political parties, or companies based on economics. This can lead them to report in a biased way or report only one side of the coin.” J9. However, 2 of the journalists in our study also recognized that this economic freedom acts as a double-edged sword. They believe that it can also put independent media at a disadvantage, as independent media can then have less funding for accessing the same tools and resources as mainstream media: “Independent media are limited by funding, personnel, space, and infrastructure, unlike all the mainstream media’s machinery.” J4. 4 of participants considered that community trust in independent media helped these journalists to address disinformation because they were already considered a reliable source: “When the public reads our news they naturally think whatever is shared is already vetted [without disinformation]. You know, information they can trust. The best we can do as journalists is to take care of the relationship with the public by posting clear, useful, trustworthy information” J11. Generally, independent journalists are considered freer of economic or political interests (Hyde 2002). Consequently, people can trust independent media for specific topics more (Deane 2016), since independent journalists have more freedom about the topics they can cover (Price and Krug 2000). Together, these dynamics appeared to have helped independent journalists become the most prompt for covering data voids.
Finding 2. Independent journalists monitor conversations from multiple stakeholders with different political leanings to find stories to cover. Journalists reported that they constantly monitored the conversations from various actors in society to better determine the stories they will cover: “I always watch social media to see what people are saying, because we determine what we are going to verify or cover based on factors of public interest…” J7. Monitoring the different conversations also meant that journalists had to analyze what political actors from both sides discussed: “Our last elections were very polarized […] it was essential to pay attention to what both sides were saying…” J8. The monitoring of both political sides not only involved political actors but also analyzing what news sites with different political leanings covered: “There are news media outlets that are obviously blinded by a political side. I always read what other news outlets are covering, what topics they’re covering more, what kinds of stuff they want to put on the daily schedule. Then, I check who’s behind the editorial line and think: “why are they so interested in talking so much about this topic?” That gives me an idea about which mediums [news sites] to trust and which ones to fact-check.” J13. However, part of the problem was that it was difficult to study and quantify to what extent political groups pushed certain narratives: “Oftentimes the stories are promoted by groups with political interests, which is why they’re dominating the conversation in the media, but it’s hard to quantify”. J22. In order to devise strategies for adequately addressing disinformation, especially disinformation targeting underrepresented populations, it is important to understand who can be behind the disinformation, as well as with what groups the narrative is most resonating with (Persily and Tucker 2020). However, such analysis is not simple (Bradshaw and Howard 2018). Our goal with the design of Datavoidant was to further help journalist in this endeavour.
Finding 3. There is a need to identify and understand data voids. 9 of the interviewed journalists believed that social media suffered from data voids. Interviewees considered that the problem of data voids involves identifying and understanding what information about a given topic is inaccurate or insufficient. 5 indicated that they had difficulty finding data voids and identifying what information needed to be better clarified or covered: “Sometimes there is a lot of interest in a certain topic on social media, but not much supply of quality information; however, we don’t have a way to measure that and they can slip by [the existence of data voids].” J15. Journalists believed there were benefits associated with identifying data voids, especially as it allowed them to bring unique and quality perspectives to certain topics: “Finding a topic that is not adequately explained and has manipulative information, is a gem because it gives us the opportunity to talk about the topic, investigate, and communicate. If it is something that is already on people’s lips at that time, it is a gold mine. But it is not always easy to find those topics.” J18. Even though it is challenging for independent journalists to find data voids, 4 considered that identifying data voids was crucial, especially during election periods where data voids could adversely impact people’s vote: “In a political campaign, citizens’ perception of a politician will help them vote for or against him. In this case, we need to find out what limited information minority populations have [about a politician] and then disrupt it, improve it, and make it more accurate.” J20. Researchers agree that by identifying data voids early, journalists can more easily fill these gaps (Shane and Noel 2020).
Finding 4. To strategy how they will cover data voids, journalists need to understand how people interact with the limited content created around the void. Journalists indicated that it was important to know how people engage with manipulative content created around a data void. However, this was difficult: “We must know how people react to those limited stories [data voids] that are being created. I just have no sense of how to find that out. We don’t have tools to help us understand which messages are indeed resonating; it would be essential to know.” J14. Information about engagement mattered because it helped journalists to better plan how they would address certain data voids, especially given their own limited capacity and also not wanting to amplify problematic content: “We can’t just analyze every topic, and try and address it. We don’t have the capacity to do that, and we don’t want to draw attention to something that’s not getting any attention [engagement] in the first place.” J7. According to J10, prioritization is important since it is impossible to cover everything: “There’s too much information out there, so no matter how hard we try, we can’t cover everything. So we decide what to verify based on factors of public interest and virality, and the consequences it might have, like health risks.” J10. This finding is consistent with previous studies showing that journalists struggle to understand the extent and impact of problematic narratives on social media, impacting their decisions as to when to publish and when not to (McClure Haughey et al. 2020). It is also consistent with previous research that documents journalists’ need to understand how people are reacting to certain content to avoid amplifying the problematic content, or give bad actors more exposure than they would have otherwise (Phillips 2018). Within underrepresented communities, understanding what voids are most engaging is crucial because independent journalists are even more under resourced (Deane 2016). Journalists recognized this as an important undertaking, particularly in political situations where the voting decisions of under-represented populations can be affected (page 2020) or even suppressed (page 2020). Governments and advocacy groups have been raising alarm on this issue for years (Smith and Cubbon 2020). During the 2018 midterm elections, previous research found a shortage of information about political candidates and voting rights for minority groups, prompting bad actors to spread disinformation (Flores-Saviaga and Savage 2019; Woolley and Howard 2017).
Finding 5. Independent journalists want to detect automated accounts to know which narratives may be manipulated. The journalists in our study were aware that automated social media accounts existed and had strategies to identify them: “They usually don’t use their full names in the account, or they use random pictures. These accounts don’t have a lot of Facebook friends. One becomes more or less aware of them.” J2. Journalists noted that identifying automated accounts was important in allowing them to determine if a narrative is being manipulated and forced into the public discourse: “Identifying these accounts [automated accounts] gives us an idea of how legitimate or not a piece of information is” J15. This was agreed by J21: “You can get a better sense of what might be going on, especially when elections are coming up. For instance, I’ve noticed that politicians did polls on social media during elections to figure out who might win. They always showed the ultra-right candidate winning, but this didn’t happen in the end. By knowing that fake accounts [automated accounts] are pushing this, I could have a better understanding of the situation”J21. For us it was interesting to identify that, in difference to prior work (Beers et al. 2020), none of the journalists in our study reported using tools to detect automated accounts. This may be due to the fact that tools like Botometer are not adapted for use outside the English language, nor are they tailored for the bots in underrepsented communities (Forelle et al. 2015). Our hope is that our system can help address this gap, by providing information about where there is automation within underrepresented communities.
Finding 6. Independent journalists collaborate to identify and address data voids. As part of the process of identifying data voids, journalists turn to other colleagues to corroborate information and discuss whether there is a data void in order to create plans for addressing the void together. 5 of journalists mentioned that they consulted their colleagues for assistance in identifying data voids and created plans for how they would handle them: “I do collaborate to verify notes, even share sources of information. In the absence of sufficient data about a subject, this is crucial. We also do joint efforts to coordinate what information each person will look up. This can be quite time consuming when we have little information. You don’t know whether what little exists is problematic.” J5. Similarly, J14 stated the need to collaborate and brainstorm ideas about what stories around data voids to publish: “…We need to analyze the information [information about the data void] and brainstorm about what we should and shouldn’t publish because we as journalists have a big responsibility. We can’t just publish whatever, we have to be a filter […] we either brainstorm via chat (WhatsApp) or I call him and say: Let’s talk about our upcoming publications! […] Sometimes, how it works is that I create a document and the other person will say: “Look, I’ll go through it and see if I can add anything else, or we leave it like that” […] And it [the content to address the data void] is being worked on collaboratively.” J14. Overall, we saw that independent journalists reported working together to address data voids, at times even creating alliances to address data voids targeting underrepresented populations: “We now maintain an alliance with other Hispanic media outlets at the national level, especially during election seasons. In the last national elections, we had an alliance with 15 media outlets from all over the country to verify information and locate the items that are missing. Right now, we are collaborating to create content about COVID as it is a topic we all care about, and unfortunately, our audience isn’t always provided with good information [about COVID-19].” J16. According to our interviewees, collaboration had become an integral part of how they extended their capability and reach. J16 considered that by collaborating with others, they were able to produce more accurate and comprehensive stories with less budget. Working in collaboration also allowed journalists to reach broader networks (as they could reach the audiences of each involved journalist): “It’s the beauty of independent media, you can publish on one [news outlet] and then share it on others, we help each other reach more people” J11. Collaborations were likely even more important in this setting given the lower resources of these journalists (Deane 2016), as well as the diverse knowledge that is needed to understand data voids within underrepresented populations (Mesquita and de Lima-Santos 2021).
Finding 7. Independent journalists address data voids to help their audience make better decisions. Our participants expressed that they typically aimed to create content around data voids that could educate people and help them make more informed decisions. 8 of the interviewed journalists considered that educating the public about data voids is important to prevent the spread of disinformation: “Part of our job is to be "information translators". That’s why we’re creating content [content around a data void] to explain why some information is fake and how to spot it. By creating these articles [articles around data voids], we hope to increase the public’s media literacy.” J19. This was something that other journalists also echoed. For instance, J12 expressed: “We’re interested in having an educational role, so we create content about topics that might not be newsworthy right now. We do, however, consider it a good idea for the public to educate themselves on the issue, as their decisions may be impacted by it [the topic].” J12. Similarly, J15 expressed that they were interested in covering data voids that would help educate communities to make better decisions : “In our work, we try to address gaps related to community needs and will help community decisions be more educated, more informed.
3.5. Connecting Journalists’ Interviews to System Design
Based on our interview study, we identified 4 design goals (DG) and 6 subgoals (SG) to guide our system design:
Design Goal 1. Design for Independent Journalists Targeting Minorities. Through our interviews we identified that independent journalists were who could address data voids because, unlike mainstream media, they had less restrictions on the content to create (Finding 1). We therefore tailored our tool to independent journalists (SG1). Our interviews and prior work (Daniel and Jacquelyn 2020; Flores-Saviaga and Savage 2019), also helped us to understand that these journalists focused primarily on underrepresented populations where data voids were present (Finding 1). We consequently focused on designing the interface for independent journalists working with underrepresented groups (SG2). Based on prior work (Retis and Chacon 2021; Cobian 2019), we can also expect that journalists working with underrepresented populations will have to work in multiple languages, especially as the underrepresented populations could be immigrants for whom English is a second language, and consequently, will likely consume information in different languages (Retis and Chacon 2021; Cobian 2019). We considered that having to navigate between multiple languages can make it hard for journalists to understand data voids. We thus set out to create an interface that would help journalists navigate the different languages easily (SG3).
Design Goal 2. Collective Sensemaking to Understand Data Voids on Multiple Levels. Journalists reported constantly browsing social media and performing manual multi-level analyses to understand the different types of data voids (Findings 2,3,4,5). They were interested in finding topics with limited coverage (Finding 3). Thus, we argued for visualizations to allow for a topical analysis on multiple levels (SG4). We focus on visualizations that highlight the specific multi-level analysis that our interviewees mentioned was important: topical, political leanings, and bot analysis. We also provide visualization-friendly summaries of different variables that journalists reported they analyzed (e.g., amount of posts per topic, how different political leanings are discussing different topics).
Design Goal 3. Facilitate “Backstage Space” to Discuss Data Voids. Journalists collaborated to develop plans for addressing data voids together (Finding 6). Such planning was important as the journalists were often the first to create content for the underrepresented population. They had to strategize what to cover to best engage and educate their audience. Based on prior work (Flores-Saviaga and Savage 2021; Lampinen et al. 2011), we considered that a way to address this need was via a “backstage” space that facilitated such discussions. To that end, we introduced into our interface a chat with voice and video capabilities(SG5).
Design Goal 4. Collaborative Spaces for Creating Content To Address the Data Voids. Journalists explained that they typically attempted to produce content collaboratively to help address the data voids they had identified previously (Finding 7). To that end, we enabled in our interface a shared document through which journalists could create articles with their colleagues to address these voids together (SG6).
4. Datavoidant
Guided by our design goals, we created: Datavoidant, a collaborative online interactive system with state-of-the-art machine learning models and a dashboard to categorize social media content and help journalists visualize data voids on multiple levels. Next, we provide a scenario where Datavoidant can be employed, followed by the system description.
4.1. USER SCENARIO.
Laura is an independent journalist from the NGO “Voto Latino”, aiming to help the Latinx community access quality information for the upcoming election. Laura logs into Datavoidant and noticed by looking at the Post per Topic graph that immigration is among the topics most discussed on Facebook by the Latinx community. Based on her examination of the Political Leaning graph, she realized that the topic of “immigration” is also highly politicized. This topic has a crucial data void: it receives almost NO neutral coverage. Conservative news outlets predominantly cover the topic. Looking at the Type of Groups/Pages Generating Content graph, she discovered that a partisan citizen group, “Latinos Conservadores”, is among the top groups posting content about immigration. Laura asked Juan, a colleague from a neutral Latinx news media outlet, “Latino Justice”, to take a look. She hopes, she and Juan can devise a strategy to confront the data void. Juan examined the Percentage Bots per Topic graph and realized that around 20% of the posts on immigration are automated; in addition, over 60% of such posts are being commented on and shared. It worries him to see the lack of neutral content and how much people engage with non-neutral immigration content. The analysis of individual posts also reveals a false claim that Democrats were planning to send a caravan of Cuban immigrants to storm the U.S. border to disrupt the election (Ghaffary 2020). Juan and Laura decided to use the built-in chat function to formulate a strategy on how to fill the void and limit the spread of disinformation. The authors wrote a neutral article to discredit the disinformation and explain what is actually happening. The authors posted the story on the Facebook group of Latinos Conservadores and the Facebook page of Latino Justice. They also plan to organize a press conference to give visibility to their article and inform Latin voters about it through more neutral Latin media. Laura and Juan have been able to address data voids targeting Latinx communities within hours by using Datavoidant, instead of taking days.
4.2. SYSTEM DESCRIPTION.
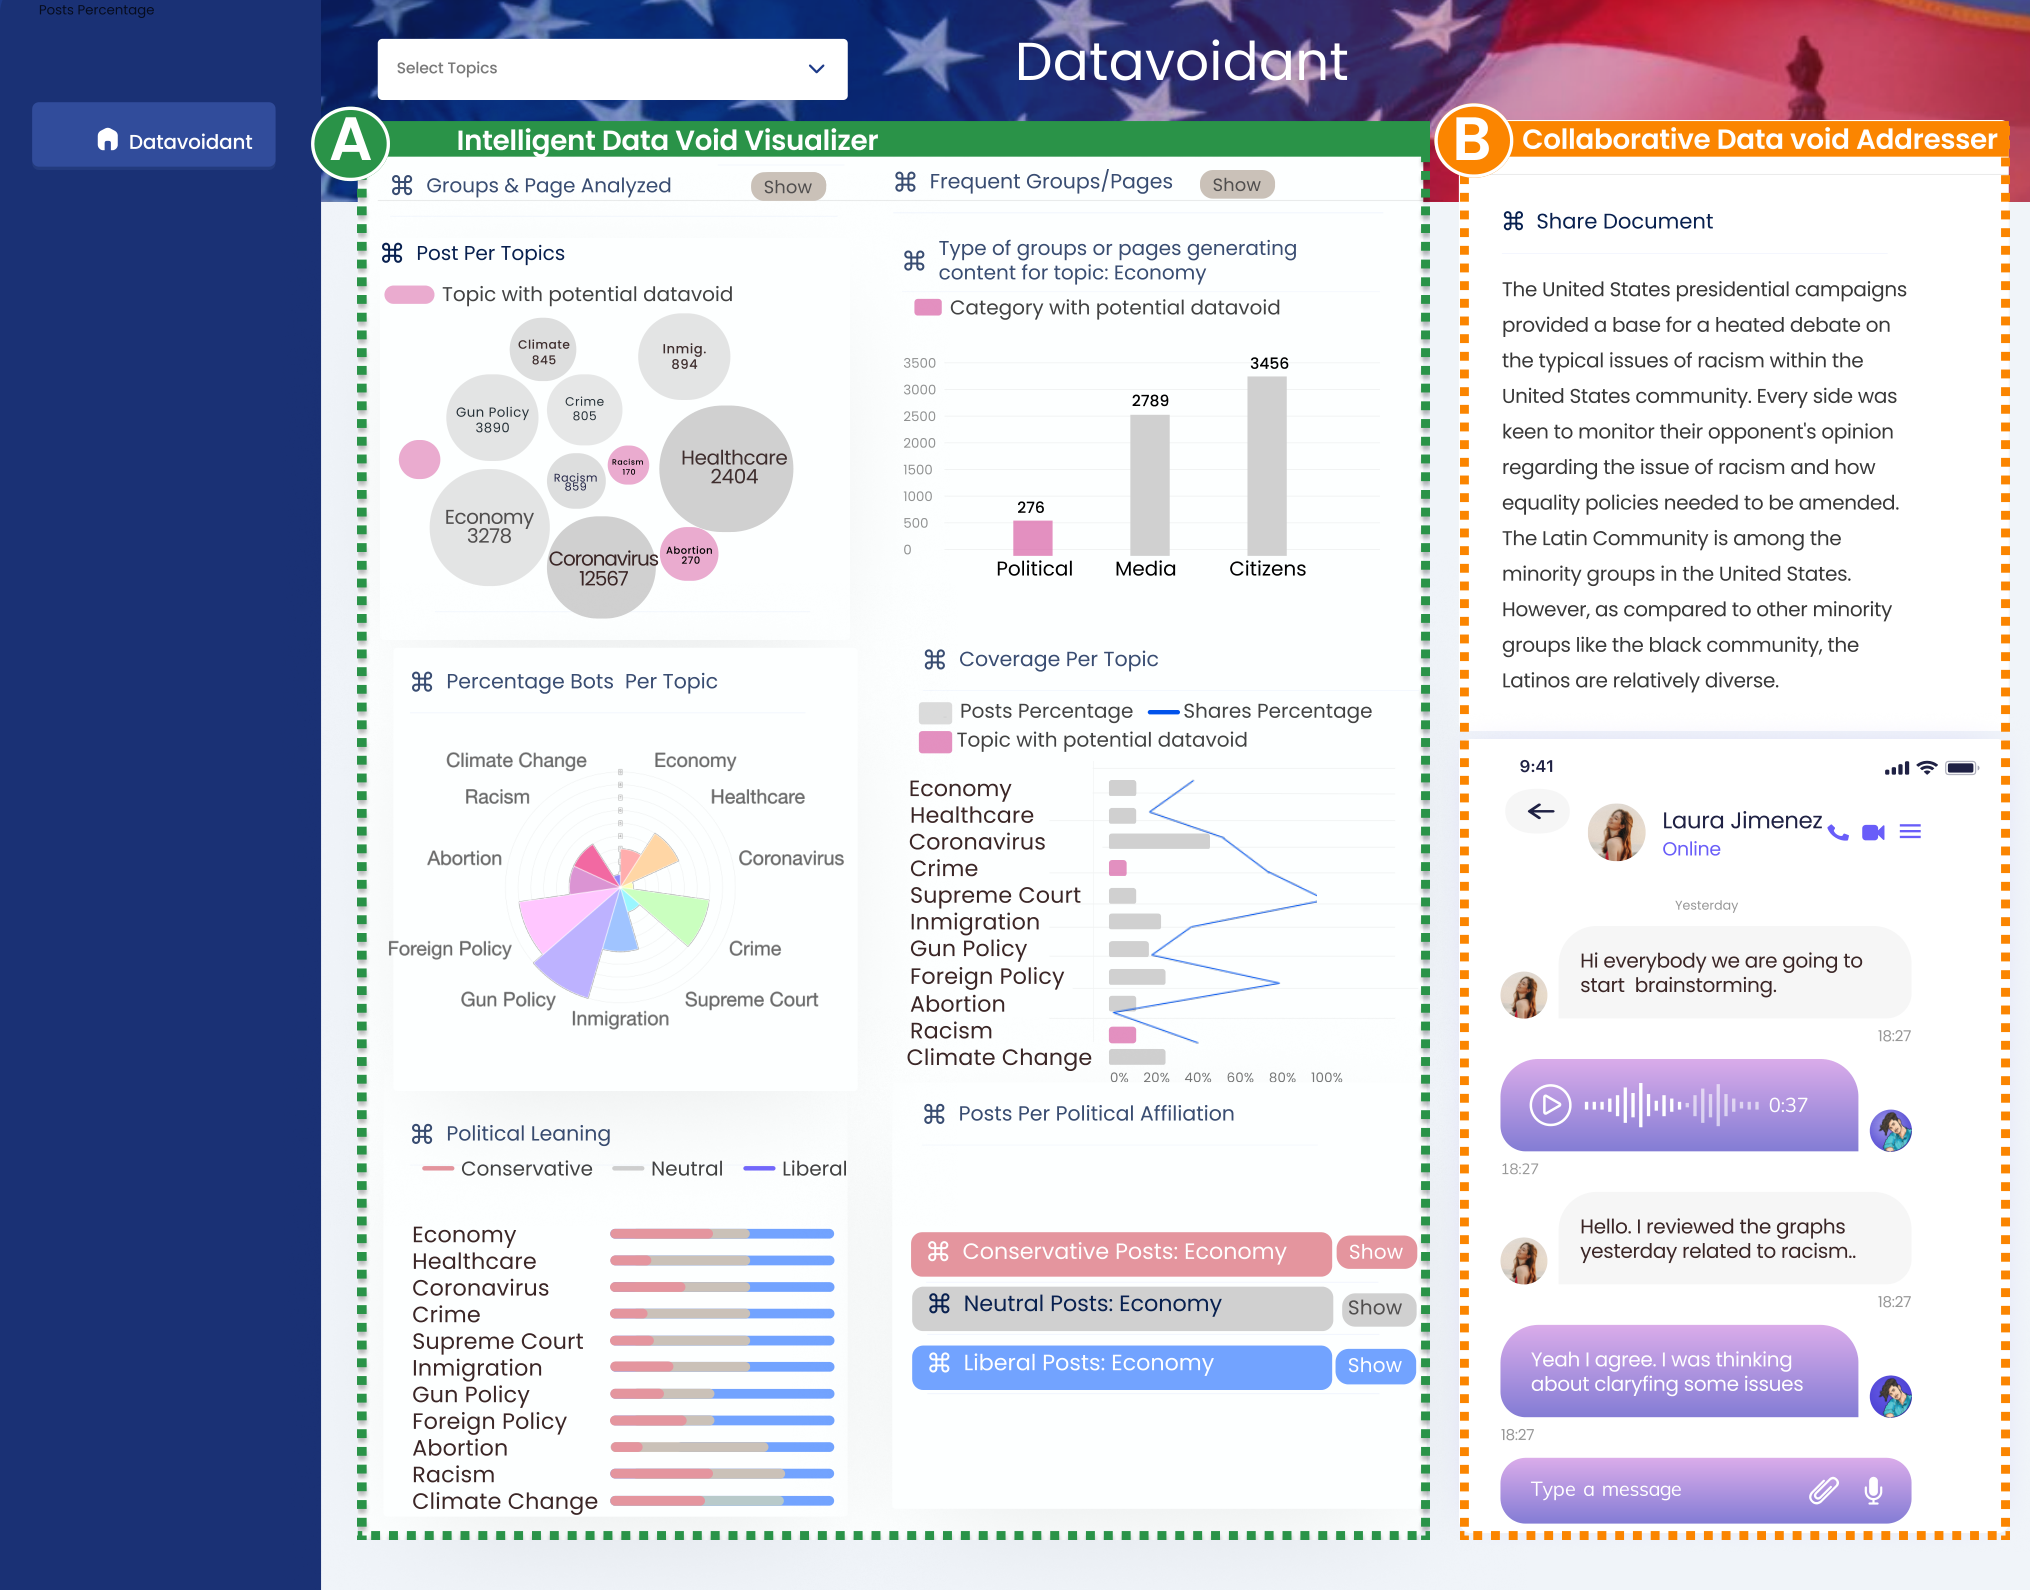
Datavoidant modularizes the sensemaking process to allow journalists to visualize existing data voids and devise strategies for covering the voids across different types of Facebook groups and pages (citizen, political, and news media). Fig. 2 presents an overview of our system. In the following section, we describe how Datavoidant is designed to be tailored for journalists working with underrepresented communities and the two major components of Datavoidant: “Intelligent Data Void Visualizer”; and “Collaborative Data Void Addresser”.
4.2.1. Designing Datavoidant for Minorities.
Our goal was to tailor our tool for independent journalists targeting underrepresented communities. For those journalists as opposed to more mainstream ones (Mesquita and de Lima-Santos 2021), collaboration is key, as it allows them to broaden their reach in an already limited (minority) audience. Working with underrepresented populations also requires diverse expertise and knowledge (Daniel and Jacquelyn 2020), highlighting even more the importance of collaborations. We thus designed Datavoidant with features that enabled journalist collaborations. Additionally, these journalists are among the first to deliver content to underrepresented audiences (as they covered data voids). Consequently, they spent time strategizing how they would best present the content to resonate with their underrepresented audiences. We then decided to integrate components for backstage planning. Based on prior work (Daniel and Jacquelyn 2020), we consider that journalists are experts on the underrepresented populations they target. We therefore designed our system to also allow journalists to use their expertise to drive the study of the data voids (e.g., by having journalists define what Facebook groups and pages to study). In the following section, we provide more information about Datavoidant’s different components and further highlight how it is design to work with underrepresented groups.
4.2.2. Intelligent Data Void Visualizer
This component of Datavoidant focuses on helping journalists to visualize and make sense of the data voids that exists in the information ecosystem of their desired underrepresented population. To accomplish this goal, the component has the following modules: 1) Data Collection module; 2) Smart Categorization module; and 3) Viz module. Each module integrates processes from the sensemaking loop of Pirolli et al. (Pirolli and Card 2005). Next, we explain each module in detail.
Data Collection Module (SG1, SG2). Independent journalists provide Datavoidant with a list of Facebook pages and groups for which they want to identify possible data voids (notice that this corresponds to the “Step: Search and Filter” in the sensemaking loop of Pirolli et al. (Pirolli and Card 2005)). Next, the system connects to the CrowdTangle API to read and extract all the posts, likes, number of comments and reshares from the public Facebook groups and pages that journalists initially provide (corresponding to “Step: Read and Extract” in the sensemaking loop).
Smart Categorization Module (SG4). Given that the data collected by the Data Collection Module can be massive and difficult for humans to interpret, this module focuses on structuring and categorizing the data to facilitate collective sensemaking. For this purpose, Datavoidant uses state-of-the-art machine learning models to categorize social media content and then synthesize the results (“Step: Schematize” in the sensemaking loop). This section provides an overview of how the module works (an in-depth explanation and evaluation can be found in the appendix Datavoidant: An AI System for Addressing Political Data Voids on Social Media).
To categorize the content, Datavoidant uses basic NLP techniques to categorize the Facebook groups and pages into either “content from political actors,” “content from citizen initiatives,” or “content from news sites.” This type of categorization is important given that journalists expressed an interest in being able to bridge the data gap between these different online spaces. However it is also important for journalists to conduct a multi-level analysis where they can understand what topics were less covered than others across these different online spaces, which political actors were pushing certain topics, and whether automated methods were pushing certain topics (to understand manipulations around data voids). For this purpose, Datavoidant integrates state-of-the-art machine learning models to categorize the content on multiple levels and facilitate these types of data analysis.
TOPIC LEVEL CATEGORIZATION. In the design of Datavoidant, we considered that journalists would likely not have the time or ability to interpret complex abstract topics without labels, like the ones that the topic modeling algorithm of LDA throws out (Blei et al. 2003). We assume that most journalists will likely not know how to provide labeled data to train machine learning algorithms that can discern one topic from another. Therefore, we opted for automated methods that could remove the unnecessary burden and complexity to journalists, while still allowing them to automatically categorize their data at scale. Datavoidant simply asks journalists to provide the list of topics they are interested in exploring and a list of keywords associated with each topic. The system then uses these keywords and topics to automatically create a training and testing set to teach machine learning models how to classify posts into topics.
POLITICAL LEANING CATEGORIZATION. In addition to topic-level data voids, Datavoidant also helps journalists to identify political-level data deficiencies, where some topics might be less discussed by accounts from certain political or ideological perspectives. For example, climate change content might be rarely covered by liberals, while critical race theory could be less covered by conservatives, creating partisan echo chambers and political-level data voids. For this purpose, Datavoidant identifies each post’s political leaning to facilitate visualization and understanding of political-level data deficits. To conduct its automatic categorization of posts with respect to political leanings, Datavoidant resorts to external knowledge about the political leanings of websites (Robertson 2018) and political actors (Feng et al. 2021a).
Notice that Datavoidant categorizes posts first based on the overall nature of the Facebook page from which the post is from. We consider that known conservative outlets will tend to always post conservative content and liberal outlets will tend to post liberal content. If the system cannot identify the nature of the Facebook page, it analyzes whether the post is discussing liberal or conservative actors in a positive or negative form, and uses this to calculate the political leaning score of the post. In all other cases, the system labels the post as neutral. In this way, Datavoidant calculates political leaning scores for social media posts, which helps to illustrate political-level data deficiencies across topics.
BOT CATEGORIZATION. Automated social media users, also known as bots, widely exist on online social networks and induce undesirable social effects. In the past decade, malicious actors have launched bot campaigns to interfere with elections (Ferrara 2017; Deb
et al. 2019), spread misinformation (Feng
et al. 2021c) and propagate extreme ideology (Berger and Morgan 2015). To address these issues, Datavoidant includes a bot detection component that categorizes accounts into bots and none-bots. The aim is to help journalists identify biased information propagated by malicious actors. In Datavoidant, we focus on the textual content of posts to identify Facebook bots and malicious actors. Specifically, we follow the method in the state-of-the-art approach (Feng
et al. 2021b) to encode post content with pre-trained language models (Liu et al. 2019) and train a multi-layer perceptron for bot detection. We train our model with the comprehensive benchmark TwiBot-20 (Feng
et al. 2021d).
Viz Module (SG3, SG4) Datavoidant employs diversified machine learning techniques to identify malicious actors, topic-level and political-level data deficiencies. However, these approaches can be highly technical and presenting the results as-is might that might confuse journalists. To address this issue, Datavoidant synthesizes results from different components to present an intuitive, easy-to-use and visualization-friendly summary of the system’s findings (“Step: Schematize” in the sensemaking loop). Datavoidant extracts the following information for the front-end visualization:
- •
Number of posts per topic: we use a bubble chart to show the number of posts per topic. Each bubble represent a specific topic. The bubbles then expand or shrink based on the number of posts that relate to each topic.
- •
Distribution of topical content by political leanings: We use stacked bar charts to show the political leanings of each topic. Each stack bar represents a topic, and the segments in the bar indicate the percentage of posts that each political side (neutral, conservative, liberal) has generated for the topic (the total sum of the different perspectives is always 100%).
- •
Percentage of comments and shares per topic: we use grouped bar charts to allow users to compare the percentage of comments, and shares per topic. The topic with the greatest percentage of comments, likes, and shares will indicate that it has received the most engagement among all topics. This visualization also helps to highlight which topics are NOT receiving engagement and where there could be a possible void. It is important to note that in some cases a high number of comments and shares on a topic could come from very specific outlier posts. In the future, we aim to present the outliers in a separate graph to help journalists further understand the dynamic.
- •
Number of topical posts produced per type of Facebook Group/Page: using separate bars for each type of page/group (news media, political, or citizens) indicates when certain actors are covering (or not covering) specific topics.
- •
Percentage of bot content per topic: we use bar charts to show the percentage of topical posts that were potentially were produced by automated accounts. It is important to note that there are news media outlets that utilize automated accounts to enhance their dissemination of news on social media (Lokot and Diakopoulos 2016; Diakopoulos 2019), which might show in this graph. Journalists may conclude that all of these accounts are malicious. Our aim is to also educate journalists to realize that seeing automation does not necessarily equate to an account spreading manipulative content.
- •
Frequent groups and pages per topic: we show in a table the names of the most frequent groups/pages that cover each topic, along with the type of Facebook page to which they belong (news media, political groups or citizens).
- •
Individual posts: when a journalists selects a specific topic, Datavoids shows the individual posts of that topic separated by political leaning. This allows journalists to take deep dives and analyze the data on different fronts.
- •
Automatic translation: if a journalist needs to translate the information on the platform, this feature allows them to instantly translate texts into more than one hundred languages.
Datavoidant presents these intuitive and easy-to-use visualizations to facilitate journalists’ sensemaking efforts to counter data voids and prevent disinformation that could weaponize those voids (Fig. 3). Notice that Datavoidant provides an interface that allows for deep-dive analysis of data voids on multiple levels.
4.2.3. Collaborative Data Void Addresser
This piece is composed of two modules that help journalists to collaborate and make sense of the data voids.
Chat Module(SG5). This module allows journalists to communicate with each other to identify potential data voids based on the information presented in Datavoidant’s Intelligent Data Void Visualizer. Notice that this corresponds to “Step: Build Case” in the sensemaking loop. For this, we integrated a chat room, in which participants can have conversations about the potential hypothesis they derive from the data presented in Datavoidant. This chat room can be seen as an “investigation” backspace where users can match their findings and discuss what hypotheses they are drawing. Through this chat room, users can discuss their findings and what they think the data might indicate. They can also start to devise strategies on how they will address the voids. To integrate the chat room we used RumbleTalk (Onl 2022). The chatroom allows users to chat via text, voice, video, and have live video calls.
Shared Document Module (SG6). When users understand what is going on (e.g., types of data voids that exist) and have decided how they will address the void, they can collaborate to create a final article or news report to fill the data void (“Step: Tell Story” in the sensemaking loop). We implemented a shared document that appears directly within Datavoidant’s. All users can use this document simultaneously to create a final document collaboratively. To integrate the shared document we used Pusher, an API service designed to facilitate adding real-time interactions (Pus [n. d.]).
5. Evaluation of Datavoidant
To study Datavoidant we conduct an interface evaluation. Note that in our appendix, we also share an evaluation of the machine learning models used (See Datavoidant: An AI System for Addressing Political Data Voids on Social Media). For our interface evaluation we investigate the impact of our system on journalists and how our tools helps (or hinders) journalists in addressing data voids. We designed our evaluation based on standard usability measures of performance and satisfaction metrics (Nielsen 1994; Venkatagiri et al. 2019). Our aim was to understand how well Datavoidant allows journalists to identify data voids and collaborate to address them (performance). We were also interested in understanding journalists’ experiences when using Datavoidant (satisfaction).
5.1. Participant Recruitment.
We recruited 22 independent journalists from Upwork to participate in our study. These individuals were all different than the journalists who took part in our initial interviews. To recruit participants, we posted a job on Upwork inviting people to our study. We set the Upwork job category to “content writing” and skills as: “independent journalism writing,” “article writing,” “experience writing for minorities,” “social media monitoring,”, “collaboration,” “experience exposing and debunking mis/disinformation”. We required that only U.S. based journalists apply for our study (to ensure they worked with underrepresented populations similar to the ones we studied previously). We also required people to show evidence that they were independent journalists who, as part of their day-to-day jobs, conducted social media monitoring of general political content for underrepresented groups. For this purpose, potential study participants had to share related articles they had authored as journalists with us. In our job description we told the participants they would be paid to use a new interface with another journalist to write an article together covering knowledge gaps in underrepresented populations. We paid participants $15 for taking part in a one-hour session. 12 of the participants were female; 9 male; 1 preferred not to disclose. 14 participants had a Bachelor’s Degree; 7 had a Master’s Degree; 1 had a Ph.D. 17 participants mentioned using social media four days a week or more for their journalist work; 5 used social media at least three days a week for their work. All primarily used Facebook for their work. In the rest of the paper we refer to these participants with the identification of “P”.
5.2. Study Procedure.
To measure performance, we conducted sessions over Zoom and had participants work together in pairs of two to complete a series of tasks. The tasks focused on identifying and addressing different types of data voids, and gathering information on a variety of usage scenarios. Notice that we had all participants use Datavoidant with the exact same dataset (in particular, we used a dataset that journalists helped us to create to evaluate our machine learning algorithms. See our appendix for details Datavoidant: An AI System for Addressing Political Data Voids on Social Media). This helped us to better control our experiment and the data voids that participants were exposed to. During each session, participants first completed the IRB approved consent form and a pre-survey asking about their demographic information. The sessions were conducted in teams of two to allow for collaboration. For each participant pair, we presented a brief overview of the dataset, including the time frame, the Facebook pages and groups included. We gave each participant a tour of Datavoidant and asked them to collaborate together on a series of different data void related tasks. In particular, participants were asked to work together to identify: (a) the topics with less content (measured in terms of number of Facebook posts), (b) the topics with missing or limited content for a specific political leaning, (c) groups or pages with limited content for specific topics, (d) groups or pages with limited content for specific political leanings and topics, and (e) a topic, political leaning, or group/page, with limited content. The goal was for participants to then create with their partner an article addressing that data void, especially for the underrepresented population in the dataset (i.e., Latinx). After journalists completed the tasks, we conducted short surveys to ask participants the level of difficulty they experienced in performing each task, using a five-point Likert scale. After that to measure satisfaction, we asked participants which aspects of the interface they liked and disliked, as well as any challenges and opportunities they experienced when using our system to complete the task. Furthermore, we asked participants to tell us about the alternative methods they would use to complete the task in question if Datavoidant were unavailable. Note that while participants completed the tasks in pairs, they responded survey questions individually.
5.3. Data Analysis of Journalists Usages of Datavoidant
Our data analysis focuses on studying the performance of journalists using our tool and the perspectives (satisfaction) that journalists have about it, allowing for quantitative and qualitative ways of studying tool usages.
5.3.1. Performance Data Analysis.
We were interested in studying how well our tool helped journalists to perform their work (performance). For this purpose, we quantitatively studied performance in terms of how long it took participants to complete all tasks using our tool, the number of participants who were able to use Datavoidant to identify data voids on multiple levels, the level of difficulty they had for performing the different tasks on Datavoidant, and average number of words that the journalists used for each article they created with our tool.
5.3.2. Satisfaction Data Analysis.
To analyze journalists’ perspectives about Datavoidant (the challenges and opportunities they identified when using our system) we analyzed the open-ended responses that participants provided in the survey, where they shared their impressions of the tool. Based on prior work that characterized people’s perspectives about different interfaces, we decided to use a hybrid approach of inductive and deductive thematic analysis (Fereday and Muir-Cochrane 2006). We first used the deductive approach to identify data patterns that were relevant to the usability themes of interest to our work. Deductive codes included interface learnability, efficiency, interface memorability, errors, and satisfaction (Nielsen 1994). We then used open coding to explore the qualitative data and allow for the discovery of emergent themes previously not identified (inductive analysis) (Mihas 2019). Two of the authors discussed the initial concepts (themes) as a group to iterate on them and created an initial codebook (the codebook included also the themes from the deductive process). We then had several iterations of the codebook and in-depth discussions among the research team to condense the codes into the final themes and created a finalized codebook. The finalized codebook with examples was shared with two coders who categorized the survey responses into the different themes. The coders agreed on 86.4% of the responses they categorized (Cohen’s kappa =0.82). We then asked a third coder to label the responses upon which the first two coders disagreed.
5.4. Results User Interface Evaluation: Performance
| Task a (Topics) | Task b (Political Leanings) | Task c (Topics in Groups/Pages) | Task d (Political Leanings & Topics in Groups/Pages) | Average Tasks | |
| Correct | 73% | 77% | 68% | 68% | 72% |
| Incorrect | 27% | 23% | 32% | 32% | 28% |
Participants took an average of 36 minutes to complete the tasks in our study (SD=27.73 minutes). The articles they created to address data voids had an average of 144 words. All participants were able to complete all tasks in our study. Notice that for tasks a,b,c,d we can quantify the quality of how participants completed them, especially because we can measure whether participants indeed were able to identify the data voids that existed in the dataset that we used for our study. Table 1 presents an overview of the percentage of participants who completed tasks a,b,c,d correctly. We were strict in our measurements and only considered that a participant completed a task correctly if they were able to find all the data voids related to the task at hand. In general, over half of the participants correctly identified the multiple level data voids (i.e., data voids in topics, political leanings, pages and groups). Overall the participants were better at identifying data voids about particular topics and political leanings than data voids within particular groups and pages. To better understand why this was happening, we analyzed details about participants’ difficulties using Datavoidant. Participants evaluated the level of difficulty for performing the different tasks on Datavoidant using a five-point Likert scale, ranging from “very easy” (+1) to “very difficult” (+5). Results are presented in Fig. 4. From Fig 4 we observe that across tasks, the majority of participants considered that Datavoidant was “very easy” or “easy” to use. Surprisingly, the task that most participants (15) considered was the easiest to conduct, was the task of identifying data voids based on topic and type of Facebook groups/pages. We mention this is surprising as it was also one of the tasks that participants struggled with the most to complete correctly (See Table 1). We believe that some participants likely mentioned only the first data voids they saw (note that when they did not provide the full list of data voids for a task, we marked the task as incorrect as we used strict measurements). In the future, we plan to explore interfaces that prompt end-users to explore data voids more and not just focus on the first results they see (Card 1999). Here it will be important to balance exploration with the tight deadlines in which journalists work.
5.5. Results User Interface Evaluation: Satisfaction
Next, we analyze participants’ open-ended responses to their survey answers to shed light on the challenges they faced when identifying and addressing data voids, as well as any opportunities they saw with Datavoidant.
Saving time: Without Datavoidant finding data voids is a time consuming process. Most journalists in our study (20) considered that Datavoidant helped them save time in identifying data voids, as normally, this process was much slower. Part of the reason was that they needed to analyze information manually: “To obtain these types of reports [lists of multi-level data voids], I would have to manually search all of Facebook and Google, convert the data, and then go through a lengthy process.” P8. Similarly, participant P21 mentioned how without Datavoidant, the process of finding data voids could take them days: “…it [Datavoidant] is very useful, as from Facebook, we get everything manually, and it can take days…” P21.
Helpful to have summarized information for countering data voids. Most (62%) mentioned that the most helpful element of the interface was the ability to see the summarized information, such as the coverage per topic. These summaries helped them to understand what they should focus on to address the data voids: “I’m able to easily understand the graphs [summary graphs] with ease after a few seconds of viewing them. On mouse hover it shows the percentages of the graphs as well, giving an even clearer picture of what things I should write about next.” P18. Similarly, P2 expressed: “ The political leaning graph [summary graph about what political topics are discussed by each side] is super helpful because you can see which issues matter to each political party; or what they want to push the most. In my community [the underrepresented population for which she writes] it’s very common to hear the right-wing political party talk about crime with us and say that they are like Superman, coming to protect and save us from all the bad stuff. It seems to me that being able to know this is very helpful. I could say: ”well, how strange, they’re talking a lot about that on this side”; then I could check in other sources, and I might realize the reality is totally different. When that happens, the topic for my next article will be clear to me.” P2. Overall, participants saw an opportunity in using the summarized data that Datavoidant provided to identify what their forthcoming articles would cover. For instance, P13 expressed that part of a journalist’s job was to help audiences make more informed decisions. He felt the summaries of Datavoidant helped him to find problematic content and identify what articles he would create for his audience to enable them to make more informed decisions: “The interface provides holistic, meta information [summaries] that gives an overview of all the information flowing on social media. Through the analysis of patterns of content across topics, I can determine if there is a large difference in coverage that might indicate that some topics have been artificially promoted. Then we can create notes that will make it easier for the audience to make educated decisions.” P13.
Deep dives allow journalists to understand data voids more easily. Most participants (18) expressed that one of their favorite aspects of Datavoidant was the ability to take deep dives and study data voids from different angles. In fact, this feature of the interface was the most used component in Datavoidant. P5 expressed how they enjoyed conducting deep dives to analyze topical data voids: “Selecting the topic from the drop down menu [deep dive interaction] was very useful. Like, a click is all it takes to learn everything you need to know about that topic.” P5. Similarly, journalists (6), expressed how they found the deep dive of the data voids within different groups/pages (media, citizen, political) to be useful. Some found it especially helpful for inspiring them on the interview questions that they could ask different actors to start addressing different voids: “The graph illustrating how many Facebook pages are covering a particular topic and which types of pages they are [deep dive interaction], is really helpful. The graph can be used to determine, for example, when the media is trying to impose a particular issue and how that influences citizens. This interface lets us cross validate data quickly and easily. For instance, by looking at the graph, I see that politicians aren’t concerned about racism. Politicians don’t seem to care about this issue. A very interesting interview scenario would be to meet with a politician, and ask him: “racism has been on everybody’s mouth, the media has been discussing it, and so have the citizens, but not you, why?…” P22.
Datavoidant gives journalists confidence on the content created for addressing data voids. Participants (9) expressed that Datavoidant gave them confidence about the content they created to address voids as they had a better overview of what existed, what did not exist, and how people engaged with information: “[While using the tool] I realized that I’d do my job with more confidence. As I would be able to tell with certainty what information is needed or wanted by the people, and I could report on topics that are not covered.” P16. Journalists also considered that our system could give them confidence in sharing more: “I think what journalism lacks today is journalists who dare to give their opinion; in general, I like to give my opinion about problems affecting my people [underrepresented population]. I know my perceptions are subjective, but if I knew the ‘exact count’ of comments on a topic instead of randomly guessing, then I would realize that there are a lot of people who care about this. That way, I’d be more brave about the opinion pieces I publish.” P5.
Collaborative features were valued, but missing the richness of traditional tools. Participants who considered that it was “very easy” or “easy” to use Datavoidant to create content to address data voids, also said that the collaborative features needed improvements. Part of the reason was that these journalists were already well-versed and comfortable collaborating with other tools (e.g., Google Docs). The shared document that was used in Datavoidant, therefore, appeared to be “under-featured” for them (especially when compared to the collaborative documents offered by Google): “The writing interface [of Datavoidant] is impressive, and it would empower journalists to analyze and improve their content, but the application lacks certain features that boost collaboration. (Check Google Doc features for reference)” P12. This may indicate a unwillingness to deviate from the norm and utilize collaborative tools that are unfamiliar to them. Other participants suggested adding encryption features to the collaborative chat interface. They considered that there could be occasions where delicate topics are discussed on Datavoidant that could put journalists in danger. As a consequence, participants considered it was important to have encryption in place to keep journalists safe: “There are certain topics where it is better not to be known as the one who helped expose them to the world. The features that Signal [an encrypted messaging application] has for discussing sensitive topics might be useful to you. I think it would be great if the chat [on datavoidant] were encrypted. It would make life much safer for journalists if it had that capability.” P7. Similarly, participants also wanted features to easily share what they were doing with others on Datavoidant. The sharing feature that they requested resembled the “Share” button that several social media platforms offer: “It would be helpful if it had a ‘Share’ button to share real-time data on other platforms such as Twitter, WhatsApp, Instagram, etc.” P9. This suggests the possibility of piggybacking on existing software infrastructure to enable enhanced collaboration interactions among journalists(Quackenbush 2020; Noain-Sánchez 2020b).
6. Discussion
We studied how journalists currently address data voids so we could enhance the process. We found that it was primarily the independent journalists who focused on underrepresented communities that addressed the data voids unlike journalists working with more general audiences (Daniel and Jacquelyn 2020). These journalists typically addressed the voids via a collaborative sensemaking process; however, the process was time-consuming and complex. Our system, Datavoidant, combines sensemaking theory, state-of-the-art machine learning models, and collaborative interfaces to empower journalists to understand data voids and create strategies for addressing the voids more easily. Through a user interface evaluation, we found that participants could use our tool to identify data voids on multiple levels, and were able to create content to cover the voids. Most journalists in our study found that our tool was easy to use, and appreciated the intelligent summaries and deep dives that Datavoidant offered. They felt these features allowed them to understand more rapidly what was happening in the information ecosystem in order to more effectively address the data voids. One benefit of this design is that by giving journalists a better sense of the information ecosystem, they felt more confident about the content they created and the unique perspectives they proposed. Datavoidant opens up a design space with potential impact on other domains, where people collaboratively make sense of their information ecosystem to proactively devise strategies for creating change and make unique contributions to their ecosystem.
A Proactive Approach to Counter Disinformation. Until now, journalists have primarily adopted a reactive approach to combating the problem of mis/disinformation where they use fact-checking and content moderation to take down problematic content (Wintersieck 2017; Graves et al. 2016). However, researchers and practitioners have recommended taking a more preventive approach to combating disinformation (Rory Smith 2021; Hernandez 2020), especially because “reactive approaches” are often not enough to persuade audience members to change their minds (Afrika Check 2019). With Datavoidant, we aim to enable more system designs that proactively address disinformation. By helping journalists identify data voids, they can proactively create content to fill them and avoid disinformation campaigns weaponizing the voids.
Designing to Address Disinformation Targeting Underrepresented Communities. In our interviews, independent journalists were eager to address data voids. They considered they had fewer limitations on what articles they were able to produce, thus enabling them to fill the voids more easily than “mainstream” journalists. This was important when working with underrepresented communities as the dynamics of what mainstream media decides to cover (and NOT cover) within underrepresented groups leads to data voids. Unfortunately, unlike mainstream media, independent journalists also felt limited in their ability to analyze large amounts of data. These struggles are a recurring theme of independent journalism working with underrepresented populations (Halper 2020; nhmc 2020). It becomes even more problematic as the time-consuming process depletes them of valuable resources that could be used to advocate and provide services to their communities (nhmc 2020). In building Datavoidant, we aimed to address these struggles by automating parts of the operations that independent journalists conducted for identifying and addressing data voids in underrepresented communities. Some key design features that Datavoidant integrates to empower journalists working with underrepresented groups are:
Visualizations of Data Voids on Multiple Levels. Our interviews highlighted that within underrepresented communities, data voids appeared based on topic, political leaning, and the actors driving the conversation. It was thus crucial to understand the multiple types of information asymmetries that existed (a problem not always present when working with general audiences, who have the privilege of being able to access vast information from multiple perspectives about the topics they care about (Ji et al. 2014).) It was based on these points from our interviews that we decided to enable data visualizations in Datavoidant that would allow journalists to identify and study data voids on multiple levels.
Collaborative Interface. Independent journalists working with underrepresented populations are typically even more under resourced than mainstream media (Deane 2016), and need more specialized knowledge in order to understand properly the information ecosystem of the underrepresented communities (Daniel and Jacquelyn 2020). Our interviews showed how these dynamics led independent journalists, in difference to mainstream journalists (who are more prone to compete for stories), to collaborate more. Collaborations also helped them to reach a wider network of underrepresented populations, which is crucial when working with these groups (Chung and Nah 2021). Thus, we designed Datavoidant to be a collaborative tools for journalists.
Backstage Space. Our interviews uncovered that journalists working with underrepresented communities had to strategize about what data voids they would cover and how they would address them. The strategies were important because they were heavily under resourced and hence, could not tackle all voids. It was also important to strategize about the content they would create to engage the communities, especially as they were the first to tailor the content for the underrepresented groups. (They did not have a reference for how the content should look like; it was important to collectively strategize on best ways to present the information). Thus, we enabled a backstage space to create strategies.
Datavoidant and Collaboratively Addressing Strategic Silences. The journalists in our study acknowledged the power of mainstream media and bad actors to silence certain voices, control all that is published, and set agendas, influencing public perceptions of reality. Donovan et al. call this a “strategic silence” (Donovan and Boyd 2021). In our interview study, independent journalists described themselves as “social justice warriors,” willing to cover these strategic silences by providing quality, informative content. Nonetheless, the journalists reported a lack of tools to learn what mainstream media and other critical actors are covering or ignoring. To address this challenge, we proposed Datavoidant as a platform to allow journalists to strategically understand data voids. According to the journalists who evaluated our system, the process of locating data voids would be much slower without Datavoidant. Journalists also felt more confident since they understood what information was necessary and how people engaged with particular types of information. Ideally, this will enable them to conduct strategic amplifications of content faster. Ultimately, Datavoidant enabled independent journalists to collaborate to fill critical voids in the information ecosystem and conduct “strategic amplifications” of content (Donovan and Boyd 2021). Datavoidant also provided journalists with the ability to identify unique angles for their news stories. During our evaluation, some journalists pointed out that Datavoidant had helped them identify novel interview questions for public officials. This brings several implications for designing new social computing systems that should help journalists to discover unique angles to stories.
Mitigating Risks and Exploitation of Datavoidant by Bad Actors. Based on prior work, which has studied how to mitigate bad actors from exploiting tools intended for a collective good (Lilley et al. 2020; Li et al. 2018a), an important next step in the development of Datavoidant is to define concrete mechanisms on who can access Datavoidant, and who is likely to be blacklisted. We can imagine that in order to use Datavoidant, journalists will need to share their reasons for wanting access. Journalists would be blacklisted and removed from access, if they are caught using the tool for other purposes. We envision connecting to the “Ethical OS” checklist to have an initial list of problematic usages that could be given to our tool. Journalists who express wanting to use our tool in problematic ways, or are caught engaging in such usages, would be banned from Datavoidant. We also imagine a group of trusted and experienced journalists helping to expand the checklist of problematic usages, based on their own experience, as well as motivated by the literature (Homoliak et al. 2019). We believe it is critical to include the voices of trusted independent journalists working with underrepresented populations, as prior work might not understand in detail all of the problems and bad behaviors that can emerge when working with underrepresented communities. But journalists might have much deeper insight. it will also be important to understand how Datavoidant can create social and economic differences among independent journalists, specially those living in rural vs urban areas (Flores-Saviaga et al. 2020b); and how Datavoidant could be used in collaborative settings in which paid senior journalists mentor aspiring journalists to create high-quality articles to fill data voids circulating within their communities (Flores-Saviaga et al. 2020a; Flores-Saviaga et al. 2016). Part of the solution is to release Datavoidant as open source, and hold workshops to ensure that a wide range of journalists can access our tool, which we plan to do.
Limitations and Future Work. Currently, Datavoidant works with Facebook information, which generates some challenges. For example, Facebook’s algorithm may downrank or filter publications written by independent journalists. Secondly, independent journalists and news outlets may not have enough Facebook followers, thereby affecting their reach. We start to counter these challenges by helping journalists to collaborate to expand their network and visibility. Furthermore, CrowdTangle tracks interactions from popular public Facebook groups and pages (with at least 25k followers and 2K members, respectively). While this means that we cannot help journalists to engage with small private groups, we consider Datavoidant a step forward in enabling journalists to understand data voids targeting underrepresented populations. In future work, we plan to expand Datavoidant to include other social media sources and allow journalists to study data voids across platforms. Datavoidant also works with the groups and pages that journalists define. Despite doing their best to include pages and groups from across the political spectrum, there may be asymmetries in the political leanings of the pages and groups that Datavoidant is fed. (It can be unintentional biases generated from the groups and pages that journalists originally select.) This may result in an over or under representation of certain political viewpoints. If, for example, journalists feed Datavoidant with only left-leaning groups, Datavoidant will show them that no one from the right-leaning side of the political spectrum is discussing certain topics. Evidently, this may lead to a false impression of reality. In the future, Datavoidant could be modified to inform journalists that the number of groups and pages is unbalanced and encourage them to draw a more accurate picture of the ecosystem. Finally, our methods focused on breadth rather than depth. Future work could conduct an in-depth analysis of how journalists across the globe address data voids, and how datavoidant is used long term by journalists.
7. Conclusion
In this study, we examined the practices of 22 independent journalists for covering political data voids targeted at underrepresented populations. Based on our findings, we created Datavoidant, an online collaborative tool that combines sensemaking theory, state-of-the-art machine learning models and data visualizations to help journalists on Facebook to collectively identify data voids in underrepresented communities at multiple levels. Our evaluation revealed that journalists found that our tool was easy to use, and appreciated the collaborative features, intelligent summaries, deep dives, and multiple perspectives that Datavoidant offered to inspect and address data voids.
8. ACKNOWLEDGMENTS
Special thanks to all the anonymous reviewers who helped us to strengthen the paper as well as the journalists who participated in the interviews and the user evaluation. This work was partially supported by NSF grant FW-HTF-19541.
References
- (1)
- 20T ([n. d.]) [n. d.]. (20+) The New York Times | Facebook. https://www.facebook.com/nytimes.
- Che ([n. d.]) [n. d.]. Check (@checkdesk) / Twitter. https://twitter.com/checkdesk.
- Pen ([n. d.]) [n. d.]. The Expanding News Desert. https://www.usnewsdeserts.com.
- Joi ([n. d.]) [n. d.]. Join us in pushing back on misinformation. https://our.news/.
- Pus ([n. d.]) [n. d.]. Pusher | Leader In Realtime Technologies. https://pusher.com/.
- Dec (2018) 2018. Decades of Failure - Columbia Journalism Review. https://www.cjr.org/special_report/race-ethnicity-newsrooms-data.php.
- 202 (2020a) 2020a. 2020 in United States politics and government - Wikipedia. https://en.wikipedia.org/wiki/2020_in_United_States_politics_and_government.
- 202 (2020b) 2020b. 2020 United States presidential election - Wikipedia. https://en.wikipedia.org/wiki/2020_United_States_presidential_election.
- Lat (2022) 2022. Latino Media Report | The State of Latino News Media. http://thelatinomediareport.journalism.cuny.edu/latino-media-report/.
- Onl (2022) 2022. Online group chat | Rumbletalk, chat for live events and websites. https://rumbletalk.com/.
- Ackoff (1989) Russell L Ackoff. 1989. From data to wisdom. Journal of Applied Systems Analysis 16, 1 (1989), 3–9.
- Afrika Check (2019) Full Fact Afrika Check, Chequeando. 2019. Fact checking doesn’t work (the way you think it does). https://fullfact.org/blog/2019/jun/how-fact-checking-works/.
- Alam et al. (2021) Firoj Alam, Stefano Cresci, Tanmoy Chakraborty, Fabrizio Silvestri, Dimiter Dimitrov, Giovanni Da San Martino, Shaden Shaar, Hamed Firooz, and Preslav Nakov. 2021. A Survey on Multimodal Disinformation Detection. arXiv e-prints (2021).
- Allen et al. (2021) Jennifer Allen, Antonio A Arechar, Gordon Pennycook, and David G Rand. 2021. Scaling up fact-checking using the wisdom of crowds. Science Advances 7, 36 (2021).
- Anderson and Rainie (2017) Janna Anderson and Lee Rainie. 2017. The future of truth and misinformation online. Pew Research Center 19 (2017).
- Arif et al. (2018) Ahmer Arif, Leo Graiden Stewart, and Kate Starbird. 2018. Examining information operations within# BlackLivesMatter discourse. Proceedings of CSCW’18 2 (2018), 1–27.
- Auxier (2020) Brooke Auxier. 2020. Social Media Use by Race | Pew Research Center. https://www.pewresearch.org/internet/chart/social-media-use-by-race/.
- Bayer et al. (2019) Judit Bayer, Natalija Bitiukova, Petra Bard, Judit Szakács, Alberto Alemanno, and Erik Uszkiewicz. 2019. Disinformation and propaganda–impact on the functioning of the rule of law in the EU and its Member States. European Parliament, LIBE Committee, Policy Department for Citizens’ Rights and Constitutional Affairs (2019).
- Beers et al. (2020) Andrew Beers, Melinda McClure Haughey, Ahmer Arif, and Kate Starbird. 2020. Examining the digital toolsets of journalists reporting on disinformation. Proceedings of Computation+ Journalism 2020 (C+ J’20) (2020).
- Berger and Morgan (2015) Jonathon M Berger and Jonathon Morgan. 2015. Defining and describing the population of ISIS supporters on Twitter. Center For Middle East Policy - Brookings (2015).
- Bittman (1985) Ladislav Bittman. 1985. The KGB and Soviet disinformation: an insider’s view. Washington: Pergamon-Brassey’s.
- Blei et al. (2003) David M Blei, Andrew Y Ng, and Michael I Jordan. 2003. Latent dirichlet allocation. the Journal of Machine Learning Research 3 (2003), 993–1022.
- Bradshaw and Howard (2018) Samantha Bradshaw and Philip N Howard. 2018. The global organization of social media disinformation campaigns. Journal of International Affairs 71, 1.5 (2018), 23–32.
- Brands et al. (2018) Bert Jan Brands, Todd Graham, and Marcel Broersma. 2018. Social media sourcing practices: How Dutch newspapers use tweets in political news coverage. In Managing Democracy in the Digital Age. Springer, 159–178.
- Brandtzaeg et al. (2016) Petter Bae Brandtzaeg, Marika Lüders, Jochen Spangenberg, Linda Rath-Wiggins, and Asbjørn Følstad. 2016. Emerging journalistic verification practices concerning social media. Journalism Practice 10, 3 (2016), 323–342.
- Butcher and Sumner (2011) Kirsten R Butcher and Tamara Sumner. 2011. Self-directed learning and the sensemaking paradox. Human–Computer Interaction 26, 1-2 (2011).
- Caled and Silva (2021) Danielle Caled and Mário J Silva. 2021. Digital media and misinformation: An outlook on multidisciplinary strategies against manipulation. Journal of Computational Social Science (2021), 1–37.
- Card (1999) Mackinlay Card. 1999. Readings in Information Visualization: Using Vision to Think. Morgan Kaufmann.
- Carlson et al. (2021) Matt Carlson, Sue Robinson, and Seth C Lewis. 2021. Digital press criticism: The symbolic dimensions of Donald Trump’s assault on US journalists as the “enemy of the people”. Digital Journalism 9, 6 (2021), 737–754.
- Carneiro et al. (2019) Guilherme Carneiro, Miguel Nacenta, Alice Toniolo, Gonzalo Mendez, and Aaron J Quigley. 2019. Deb8: A Tool for Collaborative Analysis of Video. In Proceedings of the 2019 ACM International Conference on Interactive Experiences for TV and Online Video. 47–58.
- Castelo et al. (2019) Sonia Castelo, Thais Almeida, Anas Elghafari, Aécio Santos, Kien Pham, Eduardo Nakamura, and Juliana Freire. 2019. A topic-agnostic approach for identifying fake news pages. In WWW’19 Companion. 975–980.
- Chou et al. (2021) Wen-Ying Sylvia Chou, Anna Gaysynsky, and Robin C Vanderpool. 2021. The COVID-19 Misinfodemic: moving beyond fact-checking. Health Education & Behavior 48, 1 (2021), 9–13.
- Christopher Bing (2020) Paresh Dave Christopher Bing, Elizabeth Culliford. 2020. Spanish-language misinformation dogged Democrats in U.S. election | Reuters. https://www.reuters.com/article/us-usa-election-disinformation-spanish/spanish-language-misinformation-dogged-democrats-in-u-s-election-idUSKBN27N0ED.
- Chung and Nah (2021) Deborah S Chung and Seungahn Nah. 2021. Community Newspaper Editors’ Perspectives on News Collaboration: Participatory Opportunities and Ethical Considerations Toward Citizen News Engagement. Journalism Practice (2021), 1–21.
- Cobian (2019) Jessica Cobian. 2019. How Misinformation Fueled Anti-Immigrant Sentiment in the Tijuana Border Region - Center for American Progress. https://www.americanprogress.org/article/misinformation-fueled-anti-immigrant-sentiment-tijuana-border-region/.
- Dalgali and Crowston (2020) Ayse Dalgali and Kevin Crowston. 2020. Algorithmic Journalism and Its Impacts on Work. (2020).
- Daniel and Jacquelyn (2020) Acosta-Ramos Daniel and Mason Jacquelyn. 2020. Failure to understand Black and Latinx communities will result in a critical misunderstanding of the impact of disinformation. https://firstdraftnews.org/articles/black-latinx-disinformation-impact/.
- Deane (2016) James Deane. 2016. The role of the independent media in curbing corruption in fragile settings. Policy Brief (2016).
- Deb et al. (2019) Ashok Deb, Luca Luceri, Adam Badaway, and Emilio Ferrara. 2019. Perils and challenges of social media and election manipulation analysis: The 2018 us midterms. In WWW’19 Companion. 237–247.
- Devlin et al. (2018) Jacob Devlin, Ming-Wei Chang, Kenton Lee, and Kristina Toutanova. 2018. Bert: Pre-training of deep bidirectional transformers for language understanding. (2018).
- Diakopoulos (2019) Nicholas Diakopoulos. 2019. Automating the News. Harvard University Press.
- Diakopoulos et al. (2012) Nicholas Diakopoulos, Munmun De Choudhury, and Mor Naaman. 2012. Finding and assessing social media information sources in the context of journalism. In Proceedings of the CHI’12. 2451–2460.
- Direito-Rebollal et al. (2020) Sabela Direito-Rebollal, María-Cruz Negreira-Rey, and Ana-Isabel Rodríguez-Vázquez. 2020. Social Media Guidelines for Journalists in European Public Service Media. In Journalistic Metamorphosis. Springer, 129–141.
- Donovan and Boyd (2021) Joan Donovan and Danah Boyd. 2021. Stop the presses? Moving from strategic silence to strategic amplification in a networked media ecosystem. American Behavioral Scientist 65, 2 (2021), 333–350.
- Dupuis et al. (2021) Marc Dupuis, Kelly Chhor, and Nhu Ly. 2021. Misinformation and Disinformation in the Era of COVID-19: The Role of Primary Information Sources and the Development of Attitudes Toward Vaccination. In Proceedings of the 22st Annual Conference on Information Technology Education.
- Entman (2010) Robert M Entman. 2010. Media framing biases and political power: Explaining slant in news of Campaign 2008. Journalism 11, 4 (2010), 389–408.
- Feng et al. (2021a) Shangbin Feng, Zilong Chen, Qingyao Li, and Minnan Luo. 2021a. Augmented Political Perspective Detection in News Media. CoRR (2021).
- Feng et al. (2021c) Shangbin Feng, Herun Wan, Ningnan Wang, Jundong Li, and Minnan Luo. 2021c. SATAR: A Self-supervised Approach to Twitter Account Representation Learning and its Application in Bot Detection. In Proceedings of CIKM’21. 3808–3817.
- Feng et al. (2021d) Shangbin Feng, Herun Wan, Ningnan Wang, Jundong Li, and Minnan Luo. 2021d. TwiBot-20: A Comprehensive Twitter Bot Detection Benchmark. In Proceedings of CIKM’21. 4485–4494.
- Feng et al. (2021b) Shangbin Feng, Herun Wan, Ningnan Wang, and Minnan Luo. 2021b. BotRGCN: Twitter bot detection with relational graph convolutional networks. In Proceedings of ASONAM’21. 236–239.
- Fereday and Muir-Cochrane (2006) Jennifer Fereday and Eimear Muir-Cochrane. 2006. A hybrid approach of inductive and deductive coding and theme development. International journal of qualitative methods 5, 1 (2006), 80–92.
- Ferrara (2017) Emilio Ferrara. 2017. Disinformation and social bot operations in the run up to the 2017 French presidential election. First Monday (2017).
- Flores-Saviaga et al. (2020a) Claudia Flores-Saviaga, Ricardo Granados, Liliana Savage, Lizbeth Escobedo, and Saiph Savage. 2020a. Understanding the complementary nature of paid and volunteer crowds for content creation. AIHC’20 (2020).
- Flores-Saviaga et al. (2018) Claudia Flores-Saviaga, Brian Keegan, and Saiph Savage. 2018. Mobilizing the trump train: Understanding collective action in a political trolling community. In Proceedings of ICWSM’18, Vol. 12.
- Flores-Saviaga et al. (2020b) Claudia Flores-Saviaga, Yuwen Li, Benjamin Hanrahan, Jeffrey Bigham, and Saiph Savage. 2020b. The challenges of crowd workers in rural and urban America. In Proceedings of HCOMP’2020, Vol. 8. 159–162.
- Flores-Saviaga and Savage (2019) Claudia Flores-Saviaga and Saiph Savage. 2019. Anti-Latinx Computational Propaganda in the United States. Institute For the Future (2019).
- Flores-Saviaga and Savage (2021) Claudia Flores-Saviaga and Saiph Savage. 2021. Fighting disaster misinformation in Latin America: the# 19S Mexican earthquake case study. Personal and Ubiquitous Computing 25, 2 (2021), 353–373.
- Flores-Saviaga et al. (2016) Claudia Flores-Saviaga, Saiph Savage, and Dario Taraborelli. 2016. Leadwise: using online bots to recruite and guide expert volunteers. In CSCW’16 Companion. 257–260.
- Forelle et al. (2015) Michelle C Forelle, Philip N Howard, Andres Monroy-Hernandez, and Saiph Savage. 2015. Political Bots and the Manipulation of Public Opinion in Venezuela. SSRN Electronic Journal (2015).
- Gamboa (2020) Suzanne Gamboa. 2020. Reps. Mucarsel-Powell, Castro call for FBI investigation of disinformation aimed at Latinos. https://www.nbcnews.com/news/latino/reps-mucarsel-powell-castro-call-fbi-investigation-disinformation-aimed-latinos-n1240853.
- Ghaffary (2020) Shirin Ghaffary. 2020. How fake news aimed at Latinos thrives on social media - Vox. https://www.vox.com/recode/21574293/social-media-latino-voters-2020-election.
- Godel et al. (2021) William Godel, Zeve Sanderson, Kevin Aslett, Jonathan Nagler, Richard Bonneau, Nathaniel Persily, and Joshua Tucker. 2021. Moderating with the Mob: Evaluating the Efficacy of Real-Time Crowdsourced Fact-Checking. Journal of Online Trust and Safety 1, 1 (2021).
- Golebiewski and boyd (2019) Michael Golebiewski and danah boyd. 2019. Data Voids: Where Missing Data Can Easily Be Exploited. Data & Society (October 2019). https://www.microsoft.com/en-us/research/publication/data-voids-where-missing-data-can-easily-be-exploited/
- Goodman (1961) Leo A Goodman. 1961. Snowball sampling. The annals of mathematical statistics (1961), 148–170.
- Graves et al. (2016) Lucas Graves, Brendan Nyhan, and Jason Reifler. 2016. Why do journalists fact-check. https://www. dartmouth. edu/˜ nyhan/journalist-fact-checking. pdf (2016).
- Guest et al. (2006) Greg Guest, Arwen Bunce, and Laura Johnson. 2006. How many interviews are enough? An experiment with data saturation and variability. Field methods 18, 1 (2006), 59–82.
- Hagen et al. (2019) Loni Hagen, Mary Falling, Oleksandr Lisnichenko, AbdelRahim A Elmadany, Pankti Mehta, Muhammad Abdul-Mageed, Justin Costakis, and Thomas E Keller. 2019. Emoji use in Twitter white nationalism communication. In Proceedings of CSCW’19. 201–205.
- Halper (2020) Evan Halper. 2020. A ’war room’ arms Black, Latino voters against disinformation - Los Angeles Times. https://www.latimes.com/politics/story/2020-08-06/war-room-arms-black-latino-voters-against-disinformation.
- Haque et al. (2020) Md Mahfuzul Haque, Mohammad Yousuf, Ahmed Shatil Alam, Pratyasha Saha, Syed Ishtiaque Ahmed, and Naeemul Hassan. 2020. Combating Misinformation in Bangladesh: Roles and Responsibilities as Perceived by Journalists, Fact-checkers, and Users. Proceedings of the ACM on Human-Computer Interaction 4, CSCW2 (2020), 1–32.
- Haughey et al. (2022) Melinda McClure Haughey, Martina Povolo, and Kate Starbird. 2022. Bridging Contextual and Methodological Gaps on the “Misinformation Beat”: Insights from Journalist-Researcher Collaborations at Speed. (2022).
- Hazard (2020) Laura Hazard. 2020. Spanish-language misinformation is flourishing — and often hidden. Is help on the way? | Nieman Journalism Lab. https://www.niemanlab.org/2020/09/spanish-language-misinformation-is-flourishing-and-often-hidden-is-help-on-the-way/.
- Herman and Chomsky (2010) Edward S Herman and Noam Chomsky. 2010. Manufacturing consent: The political economy of the mass media. Random House.
- Hermida (2012) Alfred Hermida. 2012. Social journalism: Exploring how social media is shaping journalism. The Handbook of Global Online Journalism 12 (2012), 309–328.
- Hernandez (2020) John Hernandez. 2020. Talking about misinformation with First Draft - American Press Institute. https://www.americanpressinstitute.org/publications/elections/trusted-elections-network/talking-about-misinformation-with-first-draft/.
- Homoliak et al. (2019) Ivan Homoliak, Flavio Toffalini, Juan Guarnizo, Yuval Elovici, and Martín Ochoa. 2019. Insight into insiders and it: A survey of insider threat taxonomies, analysis, modeling, and countermeasures. ACM Computing Surveys (CSUR) 52, 2 (2019), 1–40.
- Hyde (2002) Gene Hyde. 2002. Independent Media Centers: Cyber-subversion and the alternative press. First Monday (2002).
- Ireton and Posetti (2018) Cherilyn Ireton and Julie Posetti. 2018. Journalism, Fake News & Disinformation: Handbook for Journalism Education and Training. Unesco.
- Ismail (2018) Zenobia Ismail. 2018. Strengthening the financial independence of independent media organisations. (2018).
- Jack (2017) Caroline Jack. 2017. Lexicon of lies: Terms for problematic information. Data & Society 3, 22 (2017), 1094–1096.
- Ji et al. (2014) Qihao Ji, Louisa Ha, and Ulla Sypher. 2014. The role of news media use and demographic characteristics in the possibility of information overload prediction. International Journal of Communication 8 (2014), 16.
- Jiang and Wilson (2021) Shan Jiang and Christo Wilson. 2021. Structurizing misinformation stories via rationalizing fact-checks. In Proceedings of ACL | IJCNLP’21. 617–631.
- Judit and Bognar (2021) Szakacs Judit and Eva Bognar. 2021. The impact of disinformation campaigns about migrants and minority groups in the EU. (2021).
- Karmakharm et al. (2019) Twin Karmakharm, Nikolaos Aletras, and Kalina Bontcheva. 2019. Journalist-in-the-loop: Continuous learning as a service for rumour analysis. In Proceedings of EMNLP-IJCNLP’19. 115–120.
- Komatsu et al. (2020) Tomoko Komatsu, Marisela Gutierrez Lopez, Stephann Makri, Colin Porlezza, Glenda Cooper, Andrew MacFarlane, and Sondess Missaoui. 2020. AI should embody our values: Investigating journalistic values to inform AI technology design. In Proceedings of NordiCHI’20. 1–13.
- Kou et al. (2017) Yubo Kou, Xinning Gui, Yunan Chen, and Kathleen Pine. 2017. Conspiracy talk on social media: collective sensemaking during a public health crisis. Proceedings of the ACM on Human-Computer Interaction 1, CSCW (2017), 1–21.
- Krogstad and Lopez (2020) Jens Krogstad and Mark Lopez. 2020. Top election issues for Latino voters: Economy, health care, COVID-19 | Pew Research Center. https://www.pewresearch.org/fact-tank/2020/09/11/hispanic-voters-say-economy-health-care-and-covid-19-are-top-issues-in-2020-presidential-election/.
- Lampinen et al. (2011) Airi Lampinen, Vilma Lehtinen, Asko Lehmuskallio, and Sakari Tamminen. 2011. We’re in it together: interpersonal management of disclosure in social network services. In Proceedings of CHI’11. 3217–3226.
- Lee et al. (2021) Crystal Lee, Tanya Yang, Gabrielle D Inchoco, Graham M Jones, and Arvind Satyanarayan. 2021. Viral Visualizations: How Coronavirus Skeptics Use Orthodox Data Practices to Promote Unorthodox Science Online. In Proceedings of CHI’21. 1–18.
- Lewandowsky et al. (2012) Stephan Lewandowsky, Ullrich KH Ecker, Colleen M Seifert, Norbert Schwarz, and John Cook. 2012. Misinformation and its correction: Continued influence and successful debiasing. Psychological science in the public interest 13, 3 (2012), 106–131.
- Li et al. (2018a) Hanlin Li, Bodhi Alarcon, Sara Milkes Espinosa, and Brent Hecht. 2018a. Out of site: Empowering a new approach to online boycotts. Proceedings of the ACM on Human-Computer Interaction 2, CSCW (2018), 1–28.
- Li et al. (2018b) Tianyi Li, Kurt Luther, and Chris North. 2018b. Crowdia: Solving mysteries with crowdsourced sensemaking. Proceedings of the ACM on Human-Computer Interaction 2, CSCW (2018), 1–29.
- Lilley et al. (2020) Mariana Lilley, Anne Currie, Andrew Pyper, and Sue Attwood. 2020. Using the Ethical OS Toolkit to Mitigate the Risk of Unintended Consequences. In International Conference on Human-Computer Interaction. Springer, 77–82.
- Lin et al. (2021) Jin-An Lin, Feng-Yi Hsu, Hsin-Yu Yao, Shang-Hsun Lu, Tsai-Yu Kuo, Chieh-Kai Lin, and Yung-Ju Chang. 2021. SYNC: A Crowdsourcing Platform for News Co-editing. In CSCW’21. 126–129.
- Liu et al. (2019) Yinhan Liu, Myle Ott, Naman Goyal, Jingfei Du, Mandar Joshi, Danqi Chen, Omer Levy, Mike Lewis, Luke Zettlemoyer, and Veselin Stoyanov. 2019. Roberta: A robustly optimized bert pretraining approach. (2019).
- Lokot and Diakopoulos (2016) Tetyana Lokot and Nicholas Diakopoulos. 2016. Automating news and information dissemination on Twitter. Digital Journalism (2016).
- Lu et al. (2021) Zhicong Lu, Yue Jiang, Chenxinran Shen, Margaret C Jack, Daniel Wigdor, and Mor Naaman. 2021. " Positive Energy" Perceptions and Attitudes Towards COVID-19 Information on Social Media in China. Proceedings of the ACM on Human-Computer Interaction 5, CSCW1 (2021), 1–25.
- Maly (2021) Ico Maly. 2021. Data voids: What are they and do they threaten democracy? https://www.diggitmagazine.com/articles/data-voids-what-are-they-and-do-they-threaten-democracy.
- Matatov et al. (2018) Hana Matatov, Adina Bechhofer, Lora Aroyo, Ofra Amir, and Mor Naaman. 2018. DejaVu: a system for journalists to collaboratively address visual misinformation. In Computation+ Journalism Symposium. Miami.
- McClure Haughey et al. (2020) Melinda McClure Haughey, Meena Devii Muralikumar, Cameron A Wood, and Kate Starbird. 2020. On the Misinformation Beat: Understanding the Work of Investigative Journalists Reporting on Problematic Information Online. Proceedings of CSCW’20 4 (2020), 1–22.
- Mesquita and de Lima-Santos (2021) Lucia Mesquita and Mathias-Felipe de Lima-Santos. 2021. Collaborative Journalism from a Latin American Perspective: An Empirical Analysis. Journalism and Media 2, 4 (2021), 545–571.
- Mihas (2019) Paul Mihas. 2019. Qualitative data analysis. In Oxford research encyclopedia of education.
- Newman (2009) Nic Newman. 2009. The rise of social media and its impact on mainstream journalism. Reuters Institute for the Study of Journalism 8, 2 (2009).
- Newman (2011) Nic Newman. 2011. Mainstream media and the distribution of news in the age of social discovery. Reuters Institute for the Study of Journalism, University of Oxford (2011), 6.
- Newman et al. (2021) Nic Newman, Anne Schulz Richard Fletcher, Craig T. Robertson Simge Andı, and Rasmus Kleis Nielsen. 2021. Digital News Report 2021 | Reuters Institute for the Study of Journalism. https://reutersinstitute.politics.ox.ac.uk/digital-news-report/2021.
- nhmc (2020) nhmc. 2020. Facebook’s Spanish Language Disinformation Gap – NHMC National Hispanic Media Coalition. https://www.nhmc.org/facebooks-spanish-language-disinformation-gap/.
- Nielsen (1994) Jakob Nielsen. 1994. Usability Engineering. Morgan Kaufmann.
- Noain-Sánchez (2020a) Amaya Noain-Sánchez. 2020a. 13 Collaborative journalism versus disinformation. The Politics of Technology in Latin America (Volume 2): Digital Media, Daily Life and Public Engagement (2020), 194.
- Noain-Sánchez (2020b) Amaya Noain-Sánchez. 2020b. Collaborative journalism versus disinformation: An approach to fact-checking projects in Mexico, Argentina, Colombia, Brazil, and Spain. The Politics of Technology in Latin America (Volume 2) (2020), 194–211.
- Norman (2013) Don Norman. 2013. The Design of Everyday Things: Revised and Expanded Edition. Basic books.
- page (2020) Tate Ryan-Mosleyarchive page. 2020. It’s been really, really bad: How Hispanic voters are being targeted by disinformation | MIT Technology Review. https://www.technologyreview.com/2020/10/12/1010061/hispanic-voter-political-targeting-facebook-whatsapp/.
- Pasquetto et al. (2022) Irene V Pasquetto, Alberto F Olivieri, Luca Tacchetti, Gianni Riotta, and Alessandra Spada. 2022. Disinformation as Infrastructure: Making and maintaining the QAnon conspiracy on Italian digital media. Proceedings of the ACM on Human-Computer Interaction 6, CSCW1 (2022), 1–31.
- Paul and Morris (2009) Sharoda A Paul and Meredith Ringel Morris. 2009. CoSense: enhancing sensemaking for collaborative web search. In Proceedings of CHI’09. 1771–1780.
- PENAmerica (2022) PENAmerica. 2022. Hard News: Journalists and the Threat of Disinformation - PEN America. https://pen.org/report/hard-news-journalists-and-the-threat-of-disinformation/.
- Persily and Tucker (2020) Nathaniel Persily and Joshua A Tucker. 2020. Social Media and Democracy: The State of the Field, Prospects for Reform. Cambridge U. Press.
- Phillips (2018) Whitney Phillips. 2018. The oxygen of amplification. Data & Society 22 (2018), 1–128.
- Pirolli and Card (2005) Peter Pirolli and Stuart Card. 2005. The sensemaking process and leverage points for analyst technology as identified through cognitive task analysis. In Proceedings of international conference on intelligence analysis, Vol. 5. McLean, VA, USA, 2–4.
- Pirolli and Russell (2011) Peter Pirolli and Daniel M Russell. 2011. Introduction to this special issue on sensemaking.
- Price and Krug (2000) Monroe E Price and Peter Krug. 2000. The enabling environment for free and independent media. Available at SSRN 245494 (2000).
- Qu and Hansen (2008) Yan Qu and Derek L Hansen. 2008. Building shared understanding in collaborative sensemaking. In Proceedings of CHI’08.
- Quackenbush (2020) Casey Quackenbush. 2020. “Collaboration is the Future of Journalism” - Nieman Reports. https://niemanreports.org/articles/collaboration-is-the-future-of-journalism/.
- Recuero et al. (2020) Raquel Recuero, Felipe Bonow Soares, and Anatoliy Gruzd. 2020. Hyperpartisanship, disinformation and political conversations on Twitter: The Brazilian presidential election of 2018. In Proceedings of ICWSM’20, Vol. 14. 569–578.
- Retis and Chacon (2021) Jessica Retis and Lourdes M. Cueva Chacon. 2021. Auditing Partisan Audience Bias within Google Search. ISOJ Journal 11, 1 (2021), 35–63.
- Rid (2020) Thomas Rid. 2020. Active Measures: The Secret History of Disinformation and Political Warfare. Farrar, Straus and Giroux.
- Robé and Wolfson (2020) Chris Robé and Todd Wolfson. 2020. Reflections on the inheritances of Indymedia in the age of surveillance and social media. Media, Culture & Society 42, 6 (2020), 1024–1030.
- Robertson (2018) Ronald Robertson. 2018. Partisan Bias Scores for Web Domains. https://doi.org/10.7910/DVN/QAN5VX
- Rodriguez and Caputo (2020) Sabrina Rodriguez and Marc Caputo. 2020. ‘This is f—ing crazy’: Florida Latinos swamped by wild conspiracy theories - POLITICO. https://www.politico.com/news/2020/09/14/florida-latinos-disinformation-413923.
- Rory Smith (2021) Claire Wardle Rory Smith, Seb Cubbon. 2021. Under the surface: Covid-19 vaccine narratives, misinformation and data deficits on social media. https://firstdraftnews.org/long-form-article/under-the-surface-covid-19-vaccine-narratives-misinformation-and-data-deficits-on-social-media/.
- Schneider (2021) Ari Schneider. 2021. How trolls are weaponizing data voids online. https://slate.com/technology/2020/11/data-voids-election-misinformation.html.
- Schwartz and Overdorf (2020) Christopher Schwartz and Rebekah Overdorf. 2020. Disinformation from the Inside: Combining Machine Learning and Journalism to Investigate Sockpuppet Campaigns. In WWW’20 Companion. 623–628.
- Sesin (2020) Carmen Sesin. 2020. Spanish-language disinformation intensifies among Florida Latinos, worrying Democrats. https://www.nbcnews.com/news/latino/spanish-language-disinformation-intensifies-among-florida-latinos-worrying-democrats-n1240361.
- Sethi and Rangaraju (2018) Ricky Sethi and Raghuram Rangaraju. 2018. Extinguishing the backfire effect: using emotions in online social collaborative argumentation for fact checking. In IEEE ICWS’18. IEEE, 363–366.
- Shane (2021) Tommy Shane. 2021. People are using Facebook and Instagram as search engines. During a pandemic, that’s dangerous. https://www.niemanlab.org/2020/08/people-are-using-facebook-and-instagram-as-search-engines-during-a-pandemic-thats-dangerous/.
- Shane and Noel (2020) T Shane and P Noel. 2020. Data deficits: why we need to monitor the demand and supply of information in real time - First Draft. https://firstdraftnews.org/long-form-article/data-deficits/.
- Shearer (2018) Elisa Shearer. 2018. Social media outpaces print newspapers in the US as a news source | Pew Research Center. https://www.pewresearch.org/fact-tank/2018/12/10/social-media-outpaces-print-newspapers-in-the-u-s-as-a-news-source/.
- Shu et al. (2019) Kai Shu, Limeng Cui, Suhang Wang, Dongwon Lee, and Huan Liu. 2019. defend: Explainable fake news detection. In Proceedings of SIGKDD ’19. 395–405.
- Smith and Cubbon (2020) Rory Smith and Seb Cubbon. 2020. The Covid-19 and other vaccines: Where we’re failing to provide the right information - First Draft. https://firstdraftnews.org/long-form-article/the-covid-19-and-other-vaccines-where-were-failing-to-provide-the-right-information/.
- Spangenberg and Heise (2014) Jochen Spangenberg and Nicolaus Heise. 2014. News from the crowd: Grassroots and collaborative journalism in the digital age. In Proceedings of WWW’14. 765–768.
- Starbird et al. (2019) Kate Starbird, Ahmer Arif, and Tom Wilson. 2019. Disinformation as collaborative work: Surfacing the participatory nature of strategic information operations. Proceedings of CSCW ’19 3 (2019), 1–26.
- Starbird et al. (2014) Kate Starbird, Jim Maddock, Mania Orand, Peg Achterman, and Robert M Mason. 2014. Rumors, false flags, and digital vigilantes: Misinformation on twitter after the 2013 boston marathon bombing. IConference Proceedings (2014).
- Stray (2019) Jonathan Stray. 2019. Institutional Counter-disinformation Strategies in a Networked Democracy. In Proceedings of WWW’19. 1020–1025.
- Thakur and Hankerson (2021) Dhanaraj Thakur and DeVan Hankerson. 2021. Facts and their Discontents: A Research Agenda for Online Disinformation, Race, and Gender - CDT. https://cdt.org/insights/facts-and-their-discontents-a-research-agenda-for-online-disinformation-race-and-gender/.
- Tolmie et al. (2017) Peter Tolmie, Rob Procter, David William Randall, Mark Rouncefield, Christian Burger, Geraldine Wong Sak Hoi, Arkaitz Zubiaga, and Maria Liakata. 2017. Supporting the use of user generated content in journalistic practice. In Proceedings of CHI’17. 3632–3644.
- Venkatagiri et al. (2019) Sukrit Venkatagiri, Jacob Thebault-Spieker, Rachel Kohler, John Purviance, Rifat Sabbir Mansur, and Kurt Luther. 2019. GroundTruth: Augmenting expert image geolocation with crowdsourcing and shared representations. Proceedings of CSCW’19 3 (2019), 1–30.
- Waisbord (2020) Silvio Waisbord. 2020. Mob censorship: Online harassment of US journalists in times of digital hate and populism. Digital Journalism 8, 8 (2020).
- Weller et al. (2018) Susan C Weller, Ben Vickers, H Russell Bernard, Alyssa M Blackburn, Stephen Borgatti, Clarence C Gravlee, and Jeffrey C Johnson. 2018. Open-ended interview questions and saturation. PloS one 13, 6 (2018), e0198606.
- Wild et al. (2020) Antonia Wild, Andrei Ciortea, and Simon Mayer. 2020. Designing social machines for tackling online disinformation. In WWW’20 Companion.
- Wilson and Starbird (2021) Tom Wilson and Kate Starbird. 2021. Cross-platform Information Operations: Mobilizing Narratives & Building Resilience through both’Big’&’Alt’Tech. Proceedings of CSCW’21 5 (2021), 1–32.
- Wintersieck (2017) Amanda L Wintersieck. 2017. Debating the truth: The impact of fact-checking during electoral debates. American politics research 45, 2 (2017).
- Wolf et al. (2020) Thomas Wolf, Lysandre Debut, Victor Sanh, Julien Chaumond, Clement Delangue, Anthony Moi, Pierric Cistac, Tim Rault, Rémi Louf, Morgan Funtowicz, Joe Davison, Sam Shleifer, Patrick von Platen, Clara Ma, Yacine Jernite, Julien Plu, Canwen Xu, Teven Le Scao, Sylvain Gugger, Mariama Drame, Quentin Lhoest, and Alexander M. Rush. 2020. Transformers: State-of-the-Art Natural Language Processing. In Proceedings of EMNLP’20. 38–45.
- Woolley and Howard (2017) Samuel C Woolley and Philip Howard. 2017. Computational propaganda worldwide: Executive summary. (2017).
- Xu et al. (2021) Fan Xu, Victor S Sheng, and Mingwen Wang. 2021. A Unified Perspective for Disinformation Detection and Truth Discovery in Social Sensing: A Survey. ACM Computing Surveys (CSUR) 55, 1 (2021), 1–33.
- Zeng et al. (2021) Xia Zeng, Amani S Abumansour, and Arkaitz Zubiaga. 2021. Automated fact-checking: A survey. Language and Linguistics Compass 15, 10 (2021).
- Zhang et al. (2018) Amy X Zhang, Aditya Ranganathan, Sarah Emlen Metz, Scott Appling, Connie Moon Sehat, Norman Gilmore, Nick B Adams, Emmanuel Vincent, Jennifer Lee, Martin Robbins, et al. 2018. A structured response to misinformation. In WWW’18 Companion. 603–612.
- Zhou and Zafarani (2019) Xinyi Zhou and Reza Zafarani. 2019. Fake news detection: An interdisciplinary research. In WWW’19 Companion. 1292–1292.
- Ziff (2016) Benjamin Ziff. 2016. Countering Disinformation Through a Free Press. Hampton Roads International Security Quarterly (2016), 35.
- Zubiaga et al. (2018) Arkaitz Zubiaga, Ahmet Aker, Kalina Bontcheva, Maria Liakata, and Rob Procter. 2018. Detection and resolution of rumours in social media: A survey. ACM Computing Surveys (CSUR) 51, 2 (2018), 1–36.
A APPENDIX - EVALUATION OF DATAVOIDANT
A.1 Evaluation of the Machine Learning Algorithms in Datavoidant.
Our system uses state-of-the-art machine learning models that learn how to categorize social media data to help end-users identify data voids. We study whether the automated approaches that we utilize match human intuition, specifically how humans themselves would categorize the social media data.
A.1.1 Dataset for Studying Machine Learning Models.
To support the evaluation of our machine learning algorithms, we created a dataset. We use the dataset to help us have a way for comparing the categorization conducted by our machine learning algorithms to how humans would categorize the same data. For this purpose, we asked 10 journalists to first provide a list of Facebook groups and pages from underrepresented communities for which they would like to potentially study and address data voids. The 10 journalists provided a list of 1,150 Facebook groups and pages. Next, we collected a month’s worth of data from the groups and pages, collecting a total of 271,717 Facebook posts.
A.1.2 Evaluation of the Topic Categorization Machine Algorithms.
We believe that our system will be more intuitive and better for independent journalists to use, the more the system’s automation matches human decision-making. We therefore, compared the topic categorization of our system to the topic categorization done by humans. For this purpose, we first asked the 10 journalists who helped us to create our initial dataset (See Datavoidant: An AI System for Addressing Political Data Voids on Social Media) to provide the number of topics that they wanted to consider for studying data voids (recall this is one of the minimal inputs that our system needs for the categorization of content). The journalists agreed on having 11 topics to study the data voids. They defined the number of topics based on the number of issues that the Pew Research Center reported as mattering the most to underrepresented communities in the 2020 US presidential election (Krogstad and
Lopez 2020). The journalists considered they wanted to cover data voids within these 11 key issues. Next, we asked three of the journalists to categorize a subset of posts in our dataset independently into the 11 topics. For this purpose, we used stratified sampling to collect 5% of the Facebook posts from our dataset ensuring the posts covered all 11 topics. Next, we asked two of the coders to manually categorize each of the 13,585 posts using one of the 11 topics. We asked the workers to pick the “most relevant” topic for each post. The two workers agreed on 81.82% posts (Cohen’s kappa: .80). We then asked the third coder to label the remaining posts upon which the first two coders had disagreed. We then used a “majority rule” approach to determine the topic for those posts. At the end of this step, we had all the posts of our dataset categorized into one of the 11 topics. We considered this human categorized dataset to be our “Gold Standard”. Next, we separated this Gold Standard dataset into 80% and 20% for the training and validation of our system’s data categorization. We evaluate our approach on the validation set. We had the following results: 208,869 / 271,717 = 76.87% accuracy (with 11 topics). These results suggest that the machine learning algorithm of our system can successfully categorize posts into topics that are similar to how humans would do the categorization.
A.1.3 Evaluation of the Political Leaning Categorization. Our system has a module that automatically categorizes content into its political leaning (primarily “conservative” or ”liberal”). We are interested in studying how accurate this automated categorization is, especially in comparison to how humans would categorize the political leaning of the same content. For this purpose, we used stratified sampling to collect 5% of the Facebook posts from our dataset, ensuring the posts covered all 11 topics and also had a balance of Facebook groups and pages from citizens, political actors, and news media outlets. We then asked the three journalists who had done the topic categorization to help us again to conduct the categorization of the political leaning of the posts. We asked two of the coders to categorize each of the 13,585 posts into whether they were “liberal” or “conservative”. We asked them to take into account if the post mentioned a political actor, the website political leaning score from Robertson et al. (Robertson 2018) dataset, and the tone (sentiment) of the posts pick the “most relevant” political leaning for each post. If the post mentioned neither websites nor political actors we asked them to classify it as neutral. The two coders agreed on 80% of posts (Cohen’s kappa: 0.70). We then asked the third coder to label the posts upon which the first two coders had disagreed. We again used a “majority rule” approach to determine the political leaning of those posts. After this step, we had a dataset with “gold-standard” labels of the political leanings. Armed with our dataset, we tested how much our algorithm could accurately classify posts into their political leanings according to the gold standard dataset. Our algorithm achieved a precision of 74.42%; recall of 94.12%; and accuracy of 81.43%. Details are in Table 2. This result suggests that our political leaning identification module can successfully categorize liberal and conservative posts. This helps the system to identify data voids that relate to political leanings.
| Real: liberal | Real: conservative | Precision | Recall | Accuracy | F1-Score | |
|---|---|---|---|---|---|---|
| Pred: liberal | 32 | 11 | 74.42% | 94.12% | 81.43% | 83.12% |
| Pred: conservative | 2 | 25 |
A.1.4 Evaluation of the Bot Detection Machine Learning Algorithm. We trained our machine learning algorithms that detect bots on the comprehensive bot detection benchmark of TwiBot-20 (Feng et al. 2021d). The benchmark provides a dataset that has manually categorized social media accounts into “bots” and ”humans” (i.e., they provide a gold standard). We evaluate the machine learning algorithm that we use for detecting bots on the test set of (Feng et al. 2021d). Our algorithm achieved a precision of 76.09%; a recall of 86.19% and accuracy of 80.47%, which is comparable to other state-of-the-art bot detection algorithms. See details on Table 3. Given these results, we argue that our bot detection module enables our system to identify and present the online political narratives that automated accounts could push.
| Gold: bot | Gold: human | Precision | Recall | Accuracy | F1-Score | |
|---|---|---|---|---|---|---|
| Pred: bot | 487 | 153 | 80.47% | 76.09% | 86.19% | 80.83% |
| Pred: human | 78 | 465 |
A2 Smart Categorization Module.
Given that the data collected by the Data Collection Module can be massive and difficult for humans to interpret, this module focuses on structuring and categorizing the data to facilitate collective sensemaking. For this purpose, Datavoidant uses state-of-the-art machine learning models to categorize social media content and then synthesize results (“Step: Schematize” in the sensemaking loop). First, Datavoidant uses basic NLP techniques to categorize the Facebook groups and pages into either “content from political actors,” “content from citizen initiatives,” or “content from news sites.” In particular, the system uses public datasets that list different news sites (Pen [n. d.]), especially datasets of news sites targeting underrepresented populations (Lat 2022), to analyze whether the name of a given Facebook group or page matches any of the news sites in the datasets. If it finds a match, the system labels that Facebook group or page as “content from news sites.” For example, if a journalist inputs the Facebook page of “The New York Times” (20T [n. d.]), the system will label that page as being “content from news sites” because it found a match in the dataset. Similarly, to identify whether a Facebook page or group is “content from political actors,” Datavoidant takes the name and description of the page, and analyzes whether it directly mentions the term “political” (or related synonyms). Datavoidant also analyzes whether the page mentions a political actor or political party in its name. For this purpose, Datavoidant crawls Wikipedia to obtain lists of political actors and political parties to consider(202 2020b; 202 2020a). All other Facebook groups and pages are labeled as “content from citizen initiatives”. Notice that we allow journalists to correct the system’s categorization of Facebook groups and pages and re-categorize the content as they consider more appropriate. The system also allows journalists to input the sources of data they want Datavoidant to use for this first categorization (e.g., Wikipedia articles about political actors, lists of newspapers etc). After this step, we have all the Facebook groups and pages categorized into three main types: news media, political spaces, and citizen groups. This type of categorization was important given that journalists expressed an interest in being able to bridge the data gap between these different online spaces. However, it was also important for journalists to be able to conduct a multi-level analysis where they could understand what topics were covered less than others across these different online spaces, what political actors were pushing certain content, as well as identify whether automated methods were pushing certain topics (to understand manipulations around the data voids). For this purpose, Datavoidant integrates state-of-the-art machine learning models to categorize the content on multiple levels and facilitate these types of data analysis.
TOPIC LEVEL CATEGORIZATION. In the design of Datavoidant, we considered that journalists would likely not have the time or ability to interpret complex abstract topics without labels, like the ones that the topic modeling algorithm of LDA throws out (Blei et al. 2003). We assume that most journalists will likely not know how to provide labeled data to train machine learning algorithms that can discern one topic from another. Therefore, we opted for automated methods that could remove the unnecessary burden and complexity to journalists, while still allowing them to automatically categorize their data at scale. Datavoidant simply asks journalists to provide the list of topics they are interested in exploring and a list of keywords associated with each topic. The system then uses these keywords and topics to automatically create a training and testing set to teach machine learning models how to classify posts into the different topics. In specific, for each topic, the system uses its associated keywords to randomly sample Facebook posts that mention the keywords. The posts are taken from the lists of Facebook groups and pages that the end-user provided initially. The system then labels each post with one topic, selecting the topic with the greatest number of keywords in the post. The system will aim to have the same number of posts for each topic, but allows the end user to know when this is is not the case. Through this, the end user can easily modify the topics and facilitate creating a more balanced dataset. Datavoidant then trains a pre-trained language model RoBERTa (Liu et al. 2019) and uses fully connected layers for topic classification. This model is trained on the collected, labeled dataset of Facebook posts and their topics with a 8:2 split for training and validation set.
POLITICAL LEANING CATEGORIZATION. In addition to topic-level data voids, Datavoidant also helps journalists to identify political-level data deficiencies, where some topics might be less discussed by accounts from certain political or ideological perspectives. For example, climate change content might be rarely covered by liberals, while critical race theory could be less covered by conservatives, creating partisan echo chambers and political-level data voids. For this purpose, Datavoidant identifies each post’s political leaning to facilitate visualization and understanding of political-level data deficits. To conduct its automatic categorization of posts with respect to political leanings, Datavoidant resorts to external knowledge about the political leanings of websites (Robertson 2018) and political actors (Feng et al. 2021a). Datavoidant conducts the following approach to calculate the political leaning score of a given Facebook post:
- •
If the post comes from a Facebook page that represents a websites that is in the list (i.e., a website with a clear political leaning), the system:
- –
averages the mentioned websites’ political leaning score based on (Robertson 2018) and through this obtains the post’s final “political leaning score” as .
- –
- •
If the post mentions any website on the list or mentions any political actors then the system:
- –
calculates the sentiment score (Devlin et al. 2018; Wolf et al. 2020) for the post, with -1 as most negative and +1 as most positive.
- –
averages the political leaning score of the actors and websites mentioned based on (Feng et al. 2021a; Robertson 2018) to obtain the “political leaning score” . The final political leaning score of the post is then obtained by .
- –
- •
If the post mentions neither websites nor political actors, the system takes 0 for its political leaning score and regard the post as neutral.
Notice that Datavoidant categorizes posts first based on the overall nature of the Facebook page from which the post is from. We consider that known conservative outlets will tend to always post conservative content and liberal outlets will tend to post liberal content. If the system cannot identify the nature of the Facebook page, it analyzes whether the post is discussing liberal or conservative actors in a positive or negative form, and uses this to calculate the political leaning score of the post. In all other cases, the system labels the post as neutral. In this way, Datavoidant calculates political leaning scores for social media posts, which helps to illustrate political-level data deficiencies across topics.
BOT CATEGORIZATION. Automated social media users, also known as bots, widely exist on online social networks and induce undesirable social effects. In the past decade, malicious actors have launched bot campaigns to interfere with elections (Ferrara 2017; Deb et al. 2019), spread misinformation (Feng et al. 2021c) and propagate extreme ideology (Berger and Morgan 2015). To these issues, Datavoidant includes a bot detection component that categorizes accounts into bots and none-bots. The aim is to help journalists identify biased information propagated by malicious actors. In Datavoidant, we focus on the textual content of posts to identify Facebook bots and malicious actors. Specifically, we follow the method in the state-of-the-art approach (Feng et al. 2021b) to encode post content with pre-trained language models (Liu et al. 2019) and train a multi-layer perceptron for bot detection. We train our model with the comprehensive benchmark TwiBot-20 (Feng et al. 2021d).
B PARTICIPANTS INTERVIEW STUDY
For the purpose of protecting the anonymity of our interviewees, we have anonymized the data from the journalists we recruited for our interview study. We followed guidelines used in prior work for disclosing information about journalists who take part in interview studies (McClure Haughey et al. 2020; Haughey
et al. 2022).
|
Organization Type | Language | ||
|---|---|---|---|---|
| J1 | Niche Newspaper | Monolingual | ||
| J2 | Niche Newspaper | Bilingual | ||
| J3 | Niche Newspaper | Monolingual | ||
| J4 | Niche Newspaper | Monolingual | ||
| J5 | Niche Newspaper | Monolingual | ||
| J6 | Niche Newspaper | Monolingual | ||
| J7 | U.S. Local Radio | Bilingual | ||
| J8 | Niche Newspaper | Monolingual | ||
| J9 | Niche Newspaper | Monolingual | ||
| J10 | Non-Profit Newsroom & Civic Engagement Organization | Monolingual | ||
| J11 | Niche Newspaper | Monolingual | ||
| J12 | Digital First Outlet | Monolingual | ||
| J13 | Digital First Outlet | Monolingual | ||
| J14 | Non-Profit Newsroom & Civic Engagement Organization | Bilingual | ||
| J15 | Digital First Outlet | Monolingual | ||
| J16 | Digital First Outlet | Monolingual | ||
| J17 | Digital First Outlet | Bilingual | ||
| J18 | Digital First Outlet | Monolingual | ||
| J19 | Digital First Outlet | Monolingual | ||
| J20 | Digital First Outlet | Monolingual | ||
| J21 | Digital First Outlet | Monolingual | ||
| J22 | Digital First Outlet | Monolingual |