Axial segregation of granular mixtures in laterally shaken multi-trapezium channelsPreprint: Ansari-Bhateja-Sharma-2022
Abstract
We investigate axial segregation of binary mixtures in a laterally shaken horizontal channel formed by ratchet-like sidewalls that appear as concatenated trapeziums when not offset axially. Grain mixtures shaken in such a channel are observed to segregate in two stages: they first separate rapidly into two vertically arranged layers and, then, these layers move axially in opposite directions, segregating the two species. Here, we conduct experiments to study the influence on the segregation process of various parameters: the size ratio of grains, the shaking frequency and the channel’s geometry. We find that (a) segregation quality depends upon shaking frequency and it is possible to find a unique optimal frequency for segregation, (b) the optimal frequency lowers with increase in size ratio, (c) segregation is generally poorer when the sidewalls are more inclined to each other, and (d) segregation is improved when the sidewalls are axially offset from each other. We then carry out discrete element simulations of the segregation process in order to relate the experimental observations to the interfacial pressure gradient mechanism of Bhateja et al. [Bhateja, A., I. Sharma and J. K. Singh 2017. Segregation physics of a macroscale granular ratchet, Phys. Rev. Fluids 2, 052301]. We demonstrate that the segregation quality correlates well with the scaled interfacial pressure gradient, which is the ratio of the interfacial pressure gradient between the layers, formed in the first stage of the segregation process, to the axial body force provided by the tapered sidewalls.
I Introduction
Granular materials are typically composed of constituent grains with different sizes, densities, and surface properties. One of the many intriguing and practically relevant features of such materials is segregation, wherein an originally uniform mixture comprising grains of different geometrical and material properties demixes into its constituent species when externally energisedOttino and Khakhar 2000; Kudrolli 2004; Gray 2018. Segregation of granular mixtures is observed in nature and industry in a variety of granular systems, e.g. verticallyRosato et al. 1987; Shinbrot and Muzzio 1998; Liao et al. 2014 and horizontallySchnautz et al. 2005; Mobarakabadi et al. 2013; Bhateja, Sharma, and Singh 2017; Mobarakabadi et al. 2017 vibrated containers, rotating cylindersOttino and Khakhar 2000; Richard and Taberlet 2008; Yang et al. 2017a; Yang et al. 2017b, and flow on an inclined surfaceGray 2018; Staron and Phillips 2014; Mandal and Khakhar 2019. A comprehensive understanding of granular segregation remains elusive, given its dependence on a number of factors such as sizeKudrolli 2004, densityTripathi and Khakhar 2013 and shapeMandal and Khakhar 2019 differences of grains, interstitial fluidYan et al. 2003, and shape of the containerGrossman 1997. Several mechanismsRosato et al. 1987; Savage and Lun 1988; Knight, Jaeger, and Nagel 1993; Fan and Hill 2011; Bhateja, Sharma, and Singh 2017 and theoriesGray 2018; Umbanhowar, Lueptow, and Ottino 2019 for segregation have been reported, including percolationRosato et al. 1987 where voids between big grains make way for small ones to settle down, kinetic-stress based mechanismFan and Hill 2011 causing the motion of small grains from a high to a low fluctuational velocity region, development of convection currentsKnight, Jaeger, and Nagel 1993, and an interfacial pressure-gradient mechanismBhateja, Sharma, and Singh 2017.
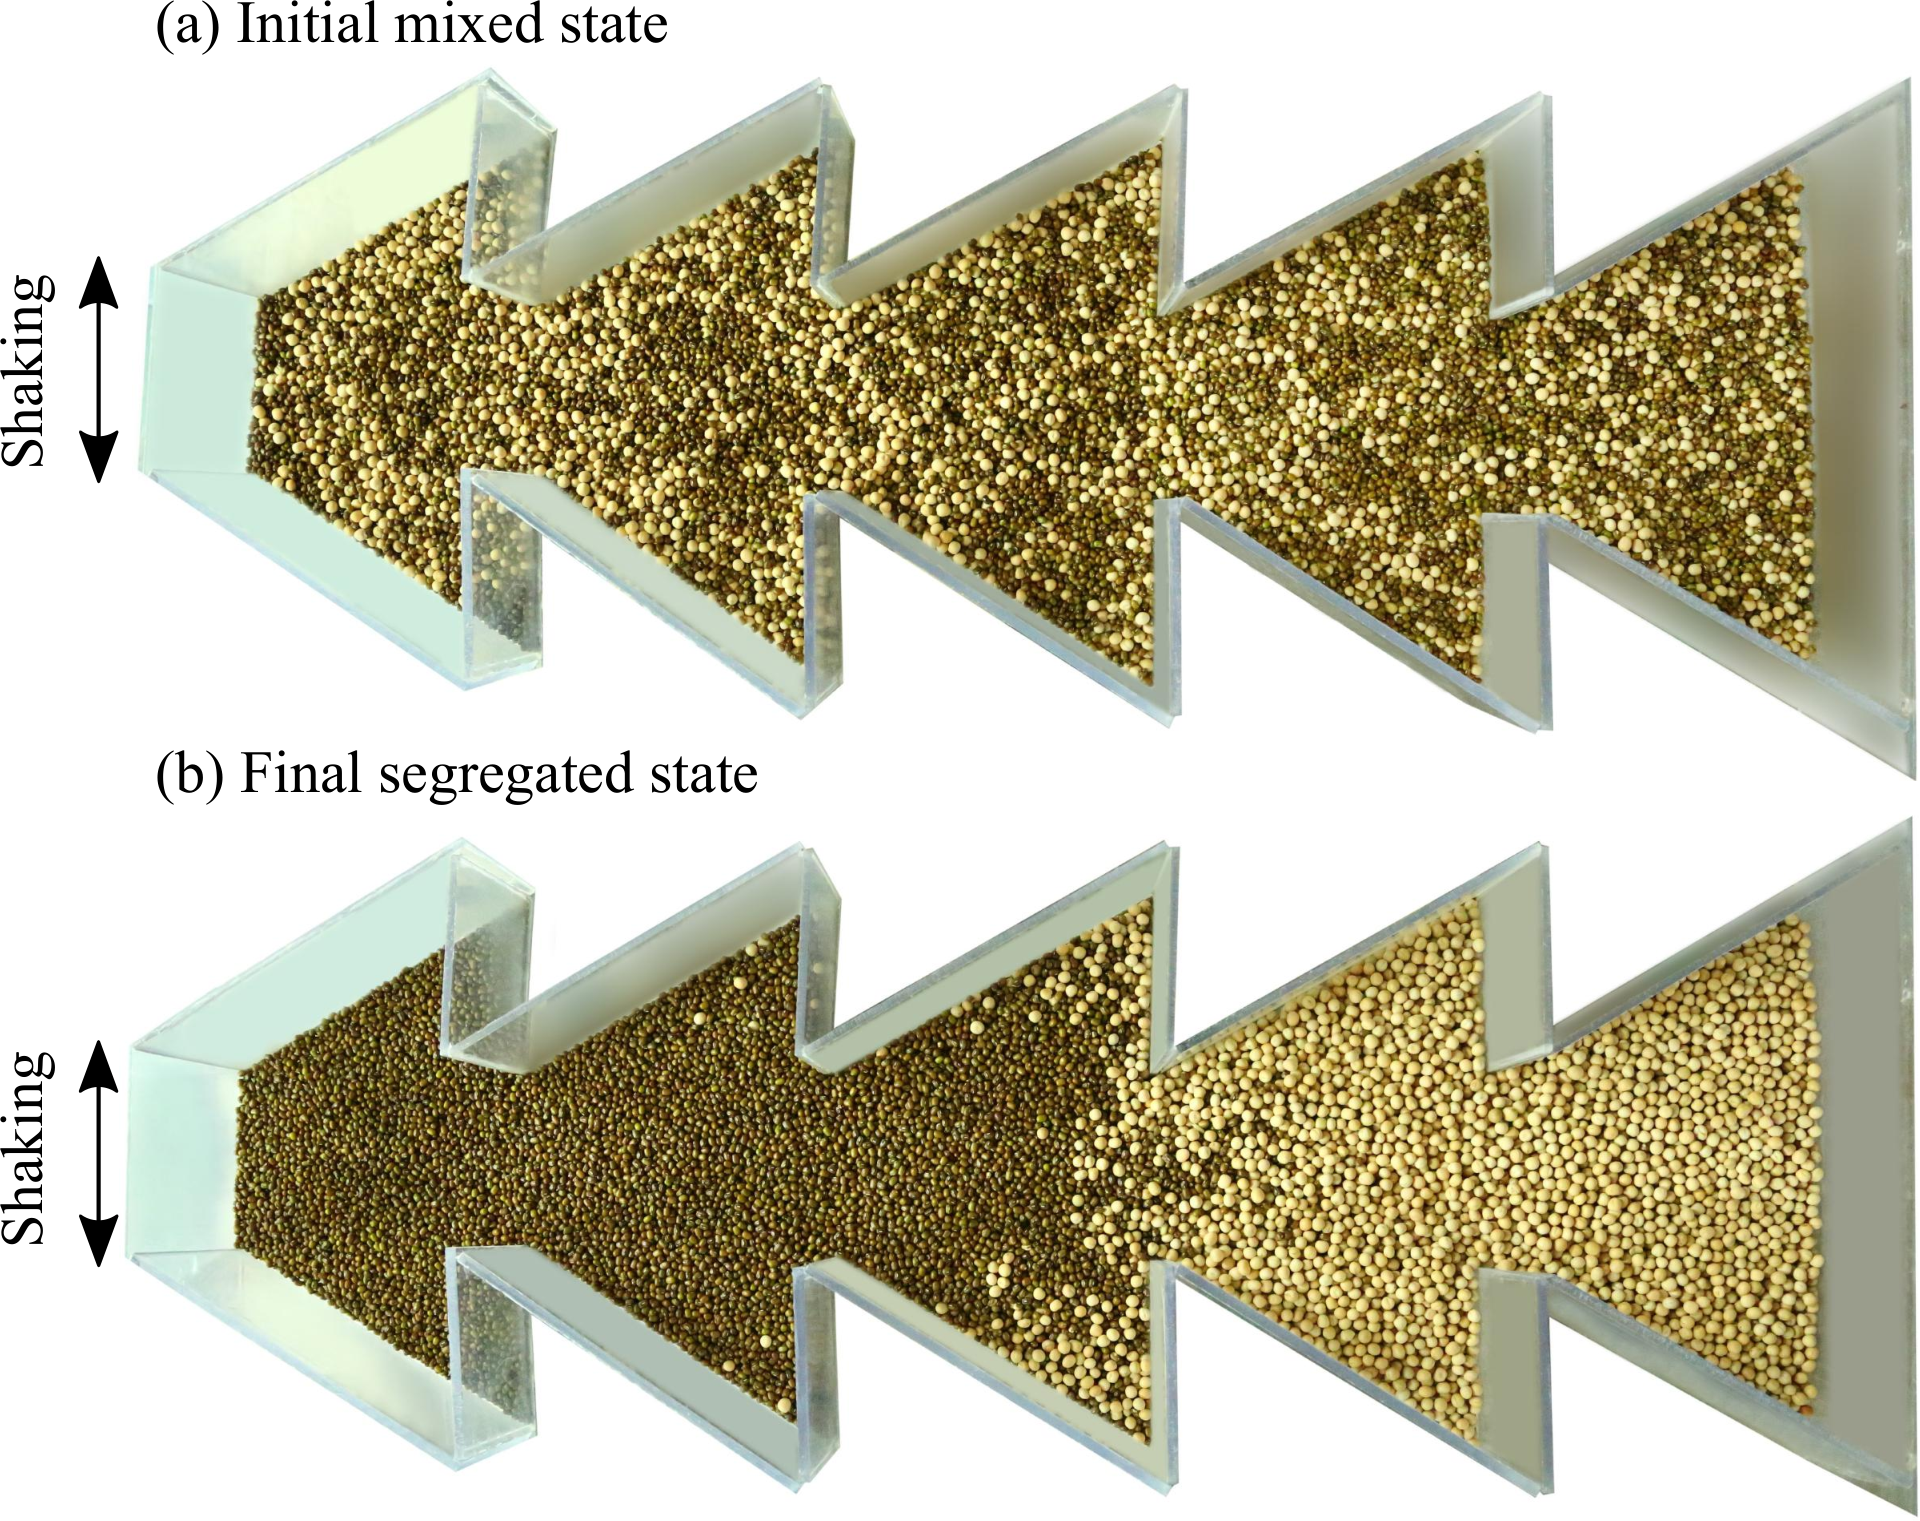
The interfacial pressure-gradient mechanism was proposed recently by Bhateja et al.(Bhateja, Sharma, and Singh 2017) to explain the axial segregation in binary mixtures of grains when they are shaken laterally in a horizontal, multi-trapezium, closed-end channels, such as those shown schematically in Fig. 1. They reported that the segregation in such systems proceeds by rapid vertical sorting of the constituent species normal to the channel’s base, followed by slow separation of the species in the axial () direction. Figure 2 shows an initial mixture and the final outcome of a typical experiment.

We now appeal to the three-dimensional plots in Fig. 3 obtained from the discrete element simulations conducted by Bhateja et al. (Bhateja, Sharma, and Singh 2017) to summarize their explanation of the process. When the binary mixture Fig. 3(A) is shaken laterally in a multi-trapezium channel, vertical sorting – which, depending upon the relative sizes and densities of the two species, is the outcome of the Brazil-nut Rosato et al. 1987; Möbius et al. 2001 or the reverse Brazil-nut effect Hong, Quinn, and Luding 2001; Shinbrot 2004 – quickly stratifies the grains into two layers; cf. Fig. 3(B). The subsequent slow axial separation of the two layers relies upon a gentle interfacial pressure gradient that develops between the top and bottom layers of grains, as we now describe. Repeated collisions with the slanted sidewalls push both layers towards the right end of the channel, as shown in Fig. 3(C), where they begin to pile up at the end wall. The difference in the mobility of the top and bottom layers causes the grains in the top layer to accumulate faster at the right-end wall. Because of this, there is an increase in the interfacial pressure between the grains in the top and bottom layers along the channel’s axis toward its right end, and this may be observed in Fig. 3(C′). This interfacial pressure gradient then squeezes the grains in the bottom layer towards the channel’s left end leading to the final segregated state displayed in Fig. 3(D).
This paper aims to extend the study of Bhateja et al.(Bhateja, Sharma, and Singh 2017) with the following two objectives. First, we will employ experiments to identify parameters which affect and optimize segregation in the multi-trapezium channel. The parameters investigated here include the shaking frequency, the size ratio of the grains and the channel’s geometry. Second, utilizing soft-sphere discrete element (DE) simulations we will compute the interfacial pressure gradient driving the axial segregation, and correlate it with experiments, in order to provide further confirmation and insight into the segregation mechanism proposed by Bhateja et al.
II Experiments
II.1 System and parameters
Our experimental setup consists of a horizontal channel built of several interconnected trapezoidal sections, as shown in Fig. 1(a). The dimensions of the setup are as follows: , , and . We also consider a variant of the multi-trapezium channel displayed in Fig. 1(a), in which the trapezoidal sections are offset by an amount ; see Fig. 1(b). Henceforth, we will call the former and latter channels as, respectively, the regular and staggered multi-trapezium channels. The channels are closed at both ends, have a flat base and are open at the top. The slant of the channel sidewalls is given by the taper angle , as illustrated in Fig. 1.
The channels are shaken in a sinusoidal manner in the horizontal plane along the lateral direction, i.e. transverse to the channel’s axis, as indicated in Fig. 1. The experiments are performed at a fixed shaking amplitude and at frequencies varying between and in increments of 5 rpm. Typically, dimensionless acceleration is used to quantify the shaking strength of a vibrated granular media. Here, we keep the amplitude fixed and vary the frequency, so that varies between 0.5 and 1.32 corresponding to the lowest and highest . For simplicity, the data in this work are presented in terms of , as the amplitude is kept constant. We employ various foodgrains of different sizes and shapes as the granular material in our experiments. The shape, size with standard deviation, and density of the foodgrains are given in Table 1. The shape of the foodgrains are displayed in Fig. 4.
| Foodgrains | Shape | Size (SD) | Density () |
|---|---|---|---|
| Peas | Near-spherical | (0.413) | |
| Green Gram | Elongated | (0.295) (0.515) | |
| Sago | Near-spherical | (0.347) | |
| Black Mustard | Near-spherical | (0.193) | |
| Millet | Near-spherical | (0.215) |

For analyzing the role of size ratio, we consider four different binary mixtures comprising equal weights of two different types of foodgrains. The size ratio and density ratio of the mixtures that we investigate are provided in Table 2, where is the diameter and is the density of grains, and the subscripts and correspond, respectively, to big and small grains. We note that the density of the foodgrains is nearly the same. The taper angle varies between and in steps of .
| Mixture type | Size ratio () | Density ratio () |
|---|---|---|
| Peas and green gram | 1.4 | 0.97 |
| Millet and black mustard | 1.47 | 1.125 |
| Sago and black mustard | 1.86 | 0.98 |
| Peas and black mustard | 3.18 | 1.07 |
II.2 Procedure and Data Analysis
The procedure followed for conducting experiments is as follows. At the beginning of every experiment, a binary mixture is prepared by homogeneously mixing by hand equal weights ( kg each) of two different foodgrains. The experiments are performed until a final segregated steady-state is achieved. The time to achieve the steady-state depends upon the shaking frequency and varies between to minutes. The experiment is stopped once the steady-state is achieved, and then the images are captured. We observed that the grains moved synchronously with the channel like a solid body and did not segregate when the system was shaken below . This reflects a lack of adequate fluidization at low frequencies. Ansari et al. Ansari, Rivas, and Alam 2018 also reported a similar frequency threshold in the Brazil-nut system, which was coupled with the frictional force and weight of the grains. They did not observe any fluidization in the system below this threshold frequency. Similarly, at the other extreme, segregation did not occur when the system was shaken at frequencies larger than rpm. This is because, at high shaking frequencies, the rightwards axial momentum provided by the sidewalls to the bottom layer of grains dominates the pressure gradient that drives this layer leftwards, so that all grains displace towards the right end. For this reason we investigate shaking frequencies lying between 80 and 130 rpm.
We now define two parameters – segregation index () and normalized overlap () – that we will employ to quantify the degree of segregation in our system. The segregation index corresponding to either of the two grain species () is defined as
| (1) |
where is the total number of pixels in the image of the system’s top view corresponding to grain type in a slice of length that spans the channel’s width, while is the pixel count in an ideally segregated system, which we define below through two examples. We note that we employed (1) for computing the segregation index for both types of grains, i.e. for and , and found that . Thus, we define the average segregation index and report this value henceforth.

Figure 5(a) shows an image of a final segregated state of a binary mixture of millet and mustard grains at in a channel with , where mustard and millet have segregated towards the right and left ends, respectively. The corresponding cropped image is shown in Fig. 5(b) after removing the sidewalls and the background. Figure 5(c) displays the binary version of Fig. 5(b) in black and white, with the colors representing, respectively, mustard and millet. Two trapeziums of the channel are superimposed in the left portion of this binary image to guide the reader’s eye. It is evident from Fig. 5(c) that there is a discernible linear interface lying along the -axis to the left of which there are very few mustard grains. At the same time, there is a patch of millet grains to the right of this interface, which appears to be small. We now identify and fix this interfacial line and set every pixel in the image on its right side to be black and on the left to be white to generate a sharp interface, and this transformed image, which corresponds to an ideally segregated state, is displayed in Fig. 5(d). The function in (1) corresponds to this ideally segregated version of the experimentally derived image in Fig. 5(c), with or 2 depending upon which species – millet or black mustard in the present case – that we focus upon. As another example, consider the segregated state at rpm shown in Fig. 6, wherein the interface is observed to be V-shaped. In such scenarios, in order to generate the ideal binary image, we first locate the interface as a lateral line, i.e. lying along the -axis, and passing through the centroid of the triangle constructed in Fig. 6(c). We then set every pixel in the image on the right side of this imaginary interfacial line to be black and on the left to be white, as in the preceding example, to obtain the ideally segregated state in Fig. 6(d).

We note that more different and/or more complex interfaces could have been chosen to define the ideally segregated state. However, we believe that doing so will defeat our aim for a simple definition for the ideally segregated system. Moreover, the fact that the interface that we select is not the perfect one, in that there are grains present on either side of the interface that should not be there, is taken into account when we compute the segregation index through (1), which contrasts the observed segregated state with the ideal state that we define through our choice of the interface.
We note that the computation of the segregation index utilizes the top view of the system, which may not provide us with a complete picture about the extent of segregation through the depth of the mixture bed. Thus, we simultaneously examined the bulk state of the mixture by calculating the degree of overlap of the two grain species near the interface in order to obtain through-depth information. This overlap reflects the distance through which the small grains may have diffused into the zone nominally identified as being comprised of only big grains. For measuring this overlap, the top layer of big grains was manually probed by gently brushing aside the surface grains at the center of the channel along the axis to check for the presence of small grains underneath. We measured the shortest distance from the nominal interface – as identified above to define the ideally segregated system – to the point lying along the channel’s axis, to the right of the nominal interface, beyond which no small grains were found, as shown in the schematic of Fig. 7. This overlap length () is then normalized by the channel’s length, to define the normalized overlap as
| (2) |
Note that a lower corresponds to better segregation.
Here we rely upon manual probing because our granular bed is three-dimensional and opaque, and comprises of a large number of grains. The opacity of granular materials and related issues in investigating through-depth dynamics of granular systems have been discussed in detail by Amon et al. Amon et al. 2017. We note that although our defined normalized overlap is less constrained compared to the segregation index , its correlation with , if established, will be useful and will lend confidence to our quantification of the state of segregation.
III Results: Experiments
III.1 Effect of size ratio and frequency on segregation
We now investigate the quality of segregation in binary mixtures of foodgrains experimentally. Table 2 lists the various mixtures that we consider. Recall that the density ratio for all these mixtures. To begin our discussion, we consider experiments conducted on a binary mixture of millet and black mustard grains with size ratio and density ratio , confined in a regular multi-trapezium channel with taper angle . The channel is filled with the mixture up to an initial height of small grain (millet) diameter. The images of the final segregated states at several frequencies are displayed in Fig. 8.

We did not observe any discernible segregation for this mixture below 95 rpm as the grains collectively move with the channel like a solid body. At 95 rpm, segregation may be clearly observed, although it is of poor quality; see Fig. 8(a). Further increasing the shaking frequency improves the segregation quality until rpm – see Figs. 8(b) and (c) – beyond which the quality of segregation is found to decrease as depicted in Fig. 8(d). It is also evident from Figs. 8(b) and (c) that the interface between the two species is very sharp and nearly V-shaped at rpm and rpm. As increases further, the final segregated states show mustard grains spread in the vicinity of the interface, thereby making it dull, even as the interface assumes a nearly straight shape. This is observed, for example, in Fig. 8(d), which corresponds to the highest shaking frequency rpm that we report.
The above aspects are illustrated quantitatively in Fig. 9, which displays the variations of the segregation index and the normalized overlap with the shaking frequency . We observe that, as the shaking frequency is raised, the parameter increases and reaches a maximum before decreasing, while follows an opposite trend. Recalling that lowering of indicates better separation of the species through the mixture’s depth, this confirms that the overall segregation quality – surface and through-depth – improves initially when the system is shaken more vigorously, but diminishes at high shaking frequencies. Very interestingly, Fig. 9 shows that the maximum segregation index, , occurs at the shaking frequency rpm, which is also the frequency at which the normalized overlap attains a minimum, . Although this feature is not true for all mixtures which we investigate, the frequencies at which and are achieved are typically close together. Thus, this indicates that the best segregation is achieved over a unique narrow range of optimal frequencies. Finally, Fig. 9 indicates that the overlap grows as increases beyond 105 rpm and saturates to a maximum value of . The segregation index too decays gradually for rpm. The high value of and the low at 130 rpm corroborate the poor quality of the observed segregation.

The second mixture that we present here is of peas and green gram, having the size ratio and an initial filling height of small grain size (minimum diameter of green gram). The final segregated states at several frequencies are shown in Fig. 10. We notice that the interface between the two species at low frequencies is nearly straight, which transforms to a curvilinear shape at frequencies equal and higher than 120 rpm. The quality of segregation is poorer in comparison to the millet-mustard mixture discussed above, but still reasonably good. This feature is reflected in Fig. 11 that plots the segregation index and the normalized overlap for all the mixtures that we report here. We observe from Fig. 11(a) that the curve for the segregation index for the peas and green gram mixture lies below the corresponding curve for the millet and mustard mixture. Similarly, in Fig. 11(b), the curve for the normalized overlap lies above the one for the millet and mustard mixture, indicating longer axial diffusion of green gram into the zone populated by peas. Moreover, as displayed in Fig. 11, the frequency corresponding to the greatest segregation index, , does not yield the best segregation through the depth of the mixture, which occurs when . However, the curve is reasonably flat, so that through-depth segregation remains nearly optimal even when only is maximized.
We next discuss segregation in a mixture of (white) sago and (black) mustard grains that have size ratio and an initial filling height of small grain (mustard) diameter. We observe that the quality of segregation is relatively poor in comparison to the previous two mixtures, as shown in Figs. 12(a)-(c). This is quantitatively evident from Fig. 11(a) where the curve for the segregation index for the sago-mustard mixture lies below the curve for the millet-mustard and peas-green gram mixtures. Moreover, the frequency at which maximum segregation occurs, again, does not lead exactly to minimum of normalized overlap . However, as for the peas-green gram mixture, the -curve is flat bottomed, so that, again, through-depth segregation remains close to its optimal value at the frequency that maximizes . In passing, we observe that some sago grains remain trapped at the corners of the trapezoidal section due to the development of dead zones. These zones may be relieved by blunting the sharpness of those corners of the trapezium.

Finally, we consider the mixture of (off-white) peas and (black) mustard grains with size ratio and an initial filling height of small grain (mustard) diameter; see Figs. 12(d)-(f). We observe that the quality of segregation is similar to that of the sago-mustard mixture. However, as Fig. 11 shows, the highest value for the segregation index is achieved at a frequency of rpm in this mixture, which is lower than the previous three mixtures. We find a sharply peaked response for , suggesting sensitivity of the segregation to the shaking frequency . However, the overlap continues to display a flat-bottomed response, as seen in Fig. 11(b). Thus, even though the frequency at which occurs does not match the frequency corresponding to , one may still get near-optimal through-depth segregation when is maximized. Furthermore, we found a overlap at rpm, at which point is also very low, indicating no segregation. This is in contrast to the other mixtures where some segregation, albeit poor, was observed even at 130 rpm. Lastly, this mixture also exhibits the effect of dead zones that, here, grow and meet each other.
The plots of Fig. 11 allow us to make the following general observations about the segregation in the four mixtures that we investigated. First, although millet-mustard mixture has higher values of segregation index than the peas-green gram mixture, the value of peas-green gram mixture surpasses that of the millet-mustard mixture at the two ends of the frequency range, i.e. at rpm and rpm. Similarly, at rpm the value of millet-mustard mixture exceeds that of the peas-green gram mixture. Thus, at the minimum operating frequency of rpm, the peas-green gram mixture segregates better than the millet-mustard mixture. Also, the segregation index curves in Fig. 11 for both peas-mustard and sago-mustard grains mixtures have sharper peaks compared to the curves for the millet-mustard and peas-green gram mixtures. This suggests that segregation in millet-mustard and peas-green gram mixtures is less sensitive to shaking frequency. Moreover, the fall in the quality of segregation for peas-mustard and sago-mustard mixtures is very rapid, and the minimum value of segregation index is much lower than that for millet-mustard and peas-green gram mixtures. This indicates that at higher frequencies the former two mixtures exhibit poorer segregation compared to the latter two mixtures, as is also evident when we compare Fig. 12 with Figs. 8 and 10.
We now proceed to investigate the effect of various system parameters on the segregation.
III.2 Effect of channel taper ()
We begin by discussing the effect of channel taper on the quality of segregation. We varied the taper angle of channel’s sidewalls and conducted experiments with millet and mustard mixture, which we saw above to display, arguably, the best segregation in a channel. Note that the number of sections changes while varying , keeping the dimensions , and same. Figure 13 displays the plots for the segregation index and normalized overlap for a millet-mustard mixture shaken in differently tapered channels. We observed that the channels with taper angles and yield comparable segregation outcomes, which is corroborated by the similarity in the behaviors of the and curves. In contrast, the and channels exhibit anomalous and weak segregation, respectively, and we discuss them separately further below.
The segregation index for the taper channel was discussed in the preceding section. The and curves for this channel are almost flat, displaying good segregation quality at frequencies around the optimum value at which is achieved. The and curves for the taper channel lie, respectively, below and above the corresponding curves for the taper channel, signifying comparatively poorer segregation in the former channel. Nevertheless, the peak segregation index in the is still higher than , with the corresponding . Figures 14(a)-(c) display images of the final segregation in a channel at three different . From the images of Figs. 14(a)-(c) we may also explain the reason for the poorer performance of the as follows: the segregation quality is lowered by the formation of dead zones whose tally and extent are augmented by the increased number of trapezia when the taper is reduced to from .

Turning to the channel, Fig. 13 shows that the segregation index curve for the channel lies above the one for the channel, except for a narrow range of frequencies around rpm. Interestingly, the for the segregation achieved in the channel is better than the channel for rpm, but poorer for smaller . The normalized overlap for the channel behaves analogously. We observe that the channel needs to be shaken at a higher frequency in order to achieve the same level of segregation as the channel. We explain this as follows. When the taper is large, the channel has to be shaken more vigorously in order to provide the required level of axial momentum to drive the mixture to the channel’s right end, which is a necessary first step in the segregation process. Figures 14(d)-(f) display images of the final segregation in a channel at three different . We note the reduced number and the lower extent of the dead zones.
We turn now to the weak and anomalous segregation outcomes that we observed in the and channels, respectively. The taper channel displays weak segregation at rpm and rpm, and almost no segregation as we further increase the frequency, which is evident from Fig. 15. This aspect is also reflected quantitatively in the plots of the segregation index and normalized overlap in Fig. 13, where and . We note that, while vertical segregation takes place effectively, with the larger mustard seeds lying on top of the smaller millet grains, the axial separation of the grains is largely impeded by the incomplete accumulation of the mustard seeds at the right end of the channel. This, we believe, is caused by the presence of many narrow trapezia in a channel that increase the number and extent of the dead zones which, in turn, obstruct the rightward motion of grains.

We expected outcomes similar to the taper channel from a channel. We were, however, greatly surprised to find that the taper channel shows reverse segregation, wherein the small grains (millet) accumulate near the right end of the channel and big grains (mustard) accumulate at the left end of the channel, as displayed in Fig. 16. The quality of the segregation is also rather good at shaking frequencies rpm, as confirmed by the high/low values of segregation index / normalized overlap in Fig. 13. At low , is less than and the corresponding values of are more than , which correspond to poor segregation that is also noticeable in Figs. 16(a) and (b). At present we are unable to explain this observation completely, but hypothesize that the reason may lie in the manner the many dead zones that are formed in a channel extend and interact. This remains a problem to investigate in the future.

We also conducted experiments with millet and mustard mixture confined in a single trapezium channel. Figure 17 displays the final segregated states and we note that this channel is also able to segregate the mixture reasonably well. Thus, we conclude that concatenation of the trapezium sections is not required to achieve segregation, rather only tuning the channel taper is needed to achieve better segregation. This single trapezium channel is simple in design, avoids unnecessary complications in fabricating the multi-trapezium channel, and thus could be utilized as a surrogate for the multi-trapezium channel.

III.3 Effect of channel offset ()
So far we focussed on channels with no offset, i.e. ; cf. Fig. 1. We now investigate the effect of staggering or offsetting the trapezoidal sections on the quality of segregation in taper channel. We hypothesize that offsetting will improve segregation, as it will help release the dead zones that form in the corners of the trapezia. Figure 18 compares the final segregated state in a channel with no offset with those obtained in staggered channels with offsets and , where we recall that is the axial length of a trapezoidal section in a multi-trapezium channel when . Note that, because of translational periodicity, there is no need to study channels with offset greater than . As in the preceding section, we employ a millet-mustard mixture.

Figure 19 depicts the variation of segregation index and the normalized overlap with the shaking frequency for the four channels mentioned above. We find that the best segregation is achieved in the channel with the largest offset , and the segregation quality decreases with offset, so that the channel with no offset () performs relatively most poorly. The optimum frequency to obtain the best segregation remains rpm, as is evident from Fig. 19(a). We do not observe much difference in for these four cases near . However, providing an offset flattens the curve, so that segregation quality remains high over a much larger range of shaking frequencies, as is clear from Fig. 19(a). Indeed, the offset channel exhibits very good segregation even at the low of 90 rpm and the high of 130 rpm. Below rpm, while remains acceptably high, the overlap in the offset channel is too great – see Fig. 19(b) – so that the overall segregation quality lowers. In contrast to the discernible effect on , we note that providing an offset affects the normalized overlap minimally over the frequency range and remains between .
IV Results: Simulations
We now relate the experimental results obtained above to the interfacial pressure-gradient mechanism of Bhateja et al.Bhateja, Sharma, and Singh 2017 For this we will perform simulations based on the discrete element methodCundall and Strack 1979 (DEM). The computational technique, the procedure followed, and chosen parameters are stated in Appendix A. We record that the size ratio of grains is kept at . We recall from Sec. I that as per the interfacial pressure-gradient mechanism of Bhateja et al. Bhateja, Sharma, and Singh 2017 the interfacial pressure between the top and the bottom layers develops a gradient that drives the bottom layer from the right to the left end of the channel, thereby segregating the mixture. In our experiments the large and small grains occupied, respectively, the top and bottom layers after the initial vertical sorting and, so, separate to the right and left ends of the channel.

We simulate segregation of binary granular mixtures in channels having taper angles and . Simulation snapshots for these taper angles depicting the initial and segregated configurations in steady state after 2150 cycles are displayed in Fig. 20. We note qualitative similarity with experimental observations of the previous section. Moreover, comparing the views of the top and the bottom of the channel in Fig. 20 confirms the variation in the segregation through the depth of the mixture. This supports our computing an overlap length in experiments.
We will quantify segregation in our simulations through two measures. We first define a bulk segregation index by
| (3) |
where and are axial locations of the centers of mass of big and small grains, respectively. A larger will generally indicate a better separated granular aggregate. However, does not capture the spread of a species about its mass center; e.g. it is possible that remain high but a significant fraction of small grains continue to occupy the rightmost trapezoidal section, and we will present an example at the end of this section illustrating this. Thus, we introduce a second segregation measure. For this we first define the percentage ratio of the number of small grains located to the right of an axial location , with respect to the total number of small grains in the mixture; Fig. 21 shows in a sketch. Thus, fixing a percentage ratio yields a scaled axial shift
| (4) |
where is the length of a trapezium (see Fig. 21); this is the second measure of segregation that we will employ. For any , we note that implies that less than percent of small grains lie in the rightmost trapeziums. Thus, we may say that a mixture is not well separated if . Figure 22 presents the variation of with for three taper angles. We observe that increases monotonically with for a fixed shaking frequency. Furthermore, as shown in Fig. 22, qualitatively similar results are obtained for varying between and . Therefore, without loss of generality, we will set , and assume that, if the corresponding , then we have achieved an acceptable level of axial separation. Below we discuss further how and relate to each other and with the segregation measure utilized in experiments.
The variation of with shaking frequency for and is shown in Fig. 23(a). Here, is calculated utilizing the axial center of mass locations averaged over sufficient number of cycles. As in experiments, see, e.g. Fig. 13a, the bulk segregation index shows a non-monotonic trend with shaking frequency for these three angles. It grows with the shaking frequency, attains a maximum value and reduces on further increase in .
Consider next the variation of scaled pressure gradient , where is the appropriately non-dimensionalized pressure gradient at the interface of the top and bottom layer of grains that forms after the rapid vertical sorting; recall Fig. 3 and the associated discussion. The procedure for computing pressure gradient is outlined in Appendix B. The variation of with is shown in Fig. 23(b) for various taper angles . Note that plotting the inverse of the scaled pressure gradient does not affect our analysis in any way, and is done so as to limit the vertical span of the plots. For each , it is clear that the behaviour of is non-monotonic with , similarly to what is exhibited by and the experimental segregation index . The simulation with rpm in the channel should not be taken into consideration given the absence of significant granular flow in the system. In this case the bottom layer comprising small grains does not reverse its motion but, rather, remains roughly static, while the top layer consisting of big grains displaces by five-grain diameters towards the right. For this reason the pressure gradient for this case is not plotted. Returning to Fig. 23, guided by the vertical lines through the peaks of , we observe that the frequency response of matches well with that of , thereby demonstrating a correlation between the bulk segregation index and the scaled pressure gradient.
Finally, in Fig. 23(c) we plot the second segregation measure, the scaled axial shift , with shaking frequency . We find that the curve for correlates very well with the scaled pressure gradient through its inverse and the bulk segregation index . Indeed, the largest values of and for occur at the same frequency. The correspondence between the two segregation measures and the scaled pressure gradient helps lend further support to the interfacial pressure-gradient mechanism of Bhateja et al.(Bhateja, Sharma, and Singh 2017).
Before closing this section we make three remarks. First, we explain why the scaled pressure gradient is the correct physical parameter to correlate with the segregation process rather than the pressure gradient alone. This is because the segregation is driven by an interplay between the interfacial pressure gradient that drives the grains at the bottom leftwards and the rightward motion provided by the tapered side walls, the extent of which is proportional to . Indeed, consider the variation of pressure gradient with shaking frequency presented in Fig. 24. We note that, for all taper angles the pressure gradient rises with shaking frequencies whereas, in contrast, the segregation index reduces with increasing beyond an optimal frequency – compare, say, Figs. 23a and 24. At the same time, the inverse of the scaled pressure gradient in Fig. 23b reaches a maximum at about the same as and then reduces. This correlation between and corresponds to our expectation that at low shaking frequencies the sidewalls are unable to drive enough of the grains towards the channel’s right end. This prevents the formation of an adequate pressure gradient that would drive the bottom layer of grains to the left. On the other hand, when is high enough, then the rightward push from the walls would dominate and all grains would be pushed in that direction, suppressing axial segregation and, thereby, lowering .
Second, we note that the bulk segregation index relates to the entire collection of grains, as it employs the locations of the centers of mass of the small and big grains in the system. In contrast, the experimentally determined segregation index considers grains in the top layer alone. In order to check how and relate to each other, we estimated a layerwise segregation index that computes the separation between the mass centers of the big and small grains in a bin that is centered at the vertical location , has a vertical thickness of one particle diameter and spans the length and width of the channel. Thus, may be computed through a formula analogous to (3), with for the topmost bin corresponding to . Figure 25 plots the steady state value of at various coordinates with in a channel with . We find that the variation of is qualitatively similar at all depths so that , which is the through-depth average of , will also behave analogously. Therefore, generally, found from simulations may be employed as a surrogate for estimated from experiments.

Finally, we comment on how the channel geometry is changed when the taper angle is varied and its effect on the segregation process. In the simulations reported above, while varying , the number of sections, the channel length , and the length of the shorter of the parallel sides of the trapezoidal sections remain invariant; see Fig. 21 and associated discussion in Appendix A. Accordingly, the length of the longer parallel side of the trapeziums changes. In contrast, recall, in experiments the number of sections are varied as changes, while and are kept the same. We now investigate the effect that this difference may have. For this we simulate segregation in a channel with nine trapezoidal sections, similarly to the experiments shown in Fig. 14. Simulation snapshots for segregation in the nine-section channel are depicted in Fig. 26, and Fig. 27 presents the corresponding variations in , and with . The bulk segregation index reaches a high value by rpm, beyond which it stays flat before increasing slightly yet again when rpm. At the same time, the scaled shift reaches a peak of about 3 by rpm after which it decays slightly. Recall that indicates that 5% of the small grains are in the rightmost three trapezoidal sections. The inverse of the scaled pressure gradient correlates reasonably with both segregation measures, but cannot explain the second increase in at rpm. We believe that this is because, as discussed at the beginning of this section, the bulk segregation index is unable to adequately capture the distribution of a species about its mass center, which is estimated better by the scaled shift . Indeed, a decrease in suggests a lowering in the segregation quality which, in Fig. 27(c), happens markedly after rpm. In contrast, in Fig. 27(a) grows when rpm, falsely indicating improved segregation.
V Conclusions
Axial segregation in binary mixtures in a laterally shaken multi-trapezium channel was originally reported by Bhateja et al.(Bhateja, Sharma, and Singh 2017). In this paper, we carried that investigation further in two important ways. First, we studied experimentally the influence on the segregation process of various system parameters, namely, the size ratio of the grains, the shaking frequency and the channel’s geometry through the taper and the offset of the sidewalls. To quantify the segregation found experimentally, we introduced two measures: the segregation index that quantified the separation between big and small grains from the top view of the system, and the overlap length that reported the through-depth variation in the segregation quality. We found that segregation quality depends on the shaking frequency , and there are generally different, but closely spaced, optimal frequencies at which and are extremized. However, because the variation of is gentle around its optimal , so one may locate a unique optimal that provides the best segregation. This optimal frequency is observed to lower with increase in size ratio. Further, this feature is true for all except the very low taper angles . When segregation is weak because of the formation of large interacting dead zones in the narrow trapezoidal sections. Anomalously, at the segregation, instead of becoming poorer, reverses in direction and improves dramatically. This is an unexplained feature that requires further investigation. We also found that offsetting the sidewalls axially releases the dead zones and improves segregation quality. Lastly, we did not observe any dependence of the segregation quality on the shape of the particles, which corroborates a recent finding by Jones et al. (Jones et al. 2020), wherein they showed that the degree of segregation in a binary mixture of different shaped particles depends mainly on the volume ratio of the two species, irrespective of their shapes.
In the second part of the work, we simulated the segregation process in order to relate the experimental observations to the interfacial pressure gradient mechanism of Bhateja et al.(Bhateja, Sharma, and Singh 2017). For this we utilized discrete element simulations. The segregation quality was again quantified through two measures better suited to simulations: a bulk segregation index that reported the separation between the centers of mass of the small and big grains, and a scaled shift that estimated the location of a segregation boundary in the axial direction. We showed that both and generally correspond with each other. Further, as far as qualitative response is concerned, may be utilized as a surrogate for the experimental segregation measure . Finally, we demonstrated that the segregation quality correlated very well with the scaled interfacial pressure gradient – the ratio of the interfacial pressure gradient to the axial body force provided by the sidewalls – in that the best segregation was achieved when reached an extremum. This provided further support to the interfacial pressure gradient mechanism.
Looking ahead there are several avenues to investigate. For example, it appears possible to utilize depth-averaged granular flow equations to theoretically model the segregation process. Furthermore, Bhateja et al.(Bhateja, Sharma, and Singh 2017) reported that the present system can segregate mixtures with more than two species, and this needs to be studied more carefully.
Appendix A Computational setup and procedure
Computations are performed utilizing an in-house code based on the discrete element methodCundall and Strack 1979; Shäfer, Dippel, and Wolf 1996. Grains are assumed to be cohesionless and dry spheres. Interactions between grains occur when they come into contact, and the contact force is computed by considering the linear spring-dashpot modelZhang and Whiten 1996; Mishra 2003. For modelling the normal contact force, both spring and dashpot are considered, whereas only dashpot is taken into account for the tangential interaction. Details of the model are given elsewhereBhateja, Sharma, and Singh 2016. Note that we do not consider the attractive force during rebounding phasePöschel and Schwager 2005. All quantities of interest presented in this work are dimensionless, which are nondimensionalized in terms of the grain diameter , mass density , and gravitational acceleration .
The shaking amplitude is taken to be the same as in experiments, i.e. cm. The simulations are performed for shaking frequencies ranging between 95 rpm and 130 rpm, in steps of 5 rpm. The dimensionless shaking acceleration varies between 0.71 and 1.32 for these amplitude and frequency range. Recall, as argued in Sec. II.1, we present the data in terms of as the shaking amplitude remains constant. The size ratio of grains is 1.4, with the diameter of small ones being mm, which corresponds to the binary mixture of peas and green gram (see Tables 1 and 2). All grains have the same density.
All simulations are performed in a regular multi-trapezium channel; see Fig. 21. The number of trapeziums in the channel is 5, unless explicitly stated otherwise. Three taper angles are considered, and . For a channel with the parameters are as follows. The lower and upper straight edges of a trapezium, in terms of , are and , respectively. In dimensional units these correspond to mm and mm, which are smaller than those employed in experiments. Nevertheless, is large enough to ensure an uninterrupted flowZuriguel et al. 2005 through the passage at the junction of two trapeziums. The number of small and big grains are and , respectively.
While changing the taper angle, we ensure that the length of each section, the lower width, and the initial filling fraction of the mixture remain the same. Therefore, the width of the upper edge and the number of small and big grains are varied accordingly for and . Employing the format [] these are, respectively, [64.23, 6865, 2505] and [27.46, 3640, 1330]. The initial fill height of the mixtures for all cases is .
The normal spring constant is , and the restitution and friction coefficients for grain-grain interactions are 0.8 and 0.3, respectively. The same values of these parameters are employed for wall-grain interactions. Note that the normal damping coefficient may be computed from the restitution coefficient and the effective mass of two colliding grains and having mass and , respectively:
| (5) |
In this study, the normal and tangential damping coefficients are equal.
Appendix B Interfacial pressure gradient
For computing pressure at the interface of top and bottom layers comprising big and small grains, respectively, the channel is first divided into several trapezoidal bins along axial direction as illustrated schematically in Fig. 28(a). In each bin, contacts between those big and small grains are identified whenever the former is located above the latter as depicted in Fig. 28(b). This helps in identifying the interface between the top and bottom layers that are formed after the rapid vertical sorting; cf. Fig. 3. It is evident that the interface of the contacting grains will not be straight. However, as a first approximation, the interface area may be taken equal to the area of a trapezium, as shown in blue in Fig. 28(a). The pressure due to collisions is calculated in each bin by obtaining the total vertical force (along direction) exerted by big grains on the small ones and dividing it by the interface area:
| (6) |
where is the total number of contacts between the big and small grains, and is the vertical component of the force acting at the contact .
In addition to the collisional component of the pressure, the streaming or kinetic contribution due to fluctuation velocity of grains in each bin is also estimated through the tensorCampbell 1989; Tripathi and Khakhar 2010
| (7) |
where is the number of contacting big and small grains enclosed in a volume of height equal to one small particle diameter centered at the interface of the top and bottom layers, and and are the mass and fluctuational velocity of grain with being its instantaneous velocity and the mean velocity of grains located in . Note that the non-dimensional height of the volume is one, so that .
The total pressure in each trapezoidal bin is obtained by adding the -component of to the pressure due to collisions, i.e. . It is worth mentioning that the kinetic component is small in comparison to , which is expected for dense granular flowsCampbell 1989. Specifically, we note that the maximum value of is less than of for all shaking frequencies and taper angles considered. The variation of pressure along the axial direction is displayed in Fig. 29 for the channel shaken at 105 rpm. We observe that the pressure grows locally in each trapezoidal section, besides its overall increase along the channel. The steep drop in the pressure at the right end of each section is caused due to the sudden reduction in the channel’s width. From the pressure data we compute the mean pressure in each trapezoidal section. Subsequently, the pressure gradient along the channel is estimated from a linear fit to these mean pressure values.
The mean value of the pressure gradient is itself computed by averaging over several vibration cycles. To find this averaging range, we consider the percentage fraction of small grains in the rightmost trapezoidal section, where and are the number of small grains present in the rightmost section before shaking and after vibration cycles, respectively. Thus, indicates that the number of small grains in the rightmost section is greater that it was at the beginning of the simulation. The variation of with shaking cycle is shown in Fig. 30 for various frequencies. In all cases, as time progresses first increases, attains a peak, and then decreases. The range of vibration cycles over which to calculate the average pressure gradient is taken to be the number of cycles lying it takes for to reduce from its peak to , i.e. when the number of small grains equals to its value at the start of the simulation. Besides 100%, we also considered averages taken over a greater number of cycles corresponding to when returned to 95% and 90% from its peak value. The variation of the mean pressure gradient with shaking frequency was found to display the same trends.
Acknowledgements
We gratefully acknowledge the support of IIT Kanpur for providing access to its HPC facility. M.I.H.A. sincerely acknowledges the financial support from IIT Kanpur through post-doctoral fellowship. A.B. gratefully acknowledges the financial support from IIT Goa through Start-up Grant (2019/SG/AB/025). We also thank Satya Prakash Mishra from IIT Kanpur for help with experiments.
Conflict of Interest
The authors have no conflicts to disclose.
Data Availability
The data that support the findings of this study are available from the corresponding author upon reasonable request.
References
- Ottino and Khakhar (2000) J. M. Ottino and D. V. Khakhar, “Mixing and segregation of granular materials,” Annu. Rev. Fluid Mech. 32, 55–91 (2000).
- Kudrolli (2004) A. Kudrolli, “Size separation in vibrated granular matter,” Rep. Prog. Phys. 67, 209 (2004).
- Gray (2018) J. M. N. T. Gray, “Particle segregation in dense granular flows,” Annu. Rev. Fluid Mech. 50, 407–433 (2018).
- Rosato et al. (1987) A. Rosato, K. J. Strandburg, F. Prinz, and R. H. Swendsen, “Why the brazil nuts are on top: Size segregation of particulate matter by shaking,” Phys. Rev. Lett. 58, 1038–1041 (1987).
- Shinbrot and Muzzio (1998) T. Shinbrot and F. J. Muzzio, “Reverse buoyancy in shaken granular beds,” Phys. Rev. Lett. 81, 4365–4368 (1998).
- Liao et al. (2014) C. C. Liao, M. L. Hunt, S. S. Hsiau, and S. H. Lu, “Investigation of the effect of a bumpy base on granular segregation and transport properties under vertical vibration,” Phys. Fluids 26, 073302 (2014).
- Schnautz et al. (2005) T. Schnautz, R. Brito, C. A. Kruelle, and I. Rehberg, “A horizontal brazil-nut effect and its reverse,” Phys. Rev. Lett. 95, 028001 (2005).
- Mobarakabadi et al. (2013) S. Mobarakabadi, E. N. Oskoee, M. Schröter, and M. Habibi, “Granular transport in a horizontally vibrated sawtooth channel,” Phys. Rev. E 88, 042201 (2013).
- Bhateja, Sharma, and Singh (2017) A. Bhateja, I. Sharma, and J. K. Singh, “Segregation physics of a macroscale granular ratchet,” Phys. Rev. Fluids 2, 052301 (2017).
- Mobarakabadi et al. (2017) S. Mobarakabadi, N. Adrang, M. Habibi, and E. N. Oskoee, “Segregation of a binary granular mixture in a vibrating sawtooth base container,” Eur. Phys. J. E 40, 1–7 (2017).
- Richard and Taberlet (2008) P. Richard and N. Taberlet, “Recent advances in dem simulations of grains in a rotating drum,” Soft Matter 4, 1345–1348 (2008).
- Yang et al. (2017a) S. Yang, Y. Sun, L. Zhang, and J. W. Chew, “Numerical study on the axial segregation dynamics of a binary-size granular mixture in a three-dimensional rotating drum,” Phys. Fluids 29, 103302 (2017a).
- Yang et al. (2017b) S. Yang, L. Zhang, K. Luo, and J. W. Chew, “Dem study of the size-induced segregation dynamics of a ternary-size granular mixture in the rolling-regime rotating drum,” Phys. Fluids 29, 123301 (2017b).
- Staron and Phillips (2014) L. Staron and J. C. Phillips, “Segregation time-scale in bi-disperse granular flows,” Phys. Fluids 26, 033302 (2014).
- Mandal and Khakhar (2019) S. Mandal and D. V. Khakhar, “Dense granular flow of mixtures of spheres and dumbbells down a rough inclined plane: Segregation and rheology,” Phys. Fluids 31, 023304 (2019).
- Tripathi and Khakhar (2013) A. Tripathi and D. V. Khakhar, “Density difference-driven segregation in a dense granular flow,” J. Fluid Mech. 717, 643–669 (2013).
- Yan et al. (2003) X. Yan, Q. Shi, M. Hou, K. Lu, and C. K. Chan, “Effects of air on the segregation of particles in a shaken granular bed,” Phys. Rev. Lett. 91, 014302 (2003).
- Grossman (1997) E. L. Grossman, “Effects of container geometry on granular convection,” Phys. Rev. E. 56, 3290–3300 (1997).
- Savage and Lun (1988) S. B. Savage and C. K. K. Lun, “Particle size segregation in inclined chute flow of dry cohesionless granular solids,” J. Fluid Mech. 189, 311–335 (1988).
- Knight, Jaeger, and Nagel (1993) J. B. Knight, H. M. Jaeger, and S. R. Nagel, “Vibration induced size separation in granular media: The convection connection,” Phys. Rev. Lett. 70, 3728–3731 (1993).
- Fan and Hill (2011) Y. Fan and K. M. Hill, “Phase transitions in shear-induced segregation of granular materials,” Phys. Rev. Lett. 106, 218301 (2011).
- Umbanhowar, Lueptow, and Ottino (2019) P. B. Umbanhowar, R. M. Lueptow, and J. M. Ottino, “Modeling segregation in granular flows,” Annu. Rev. Chem. Biomol. Eng 10, 129–153 (2019).
- Möbius et al. (2001) M. E. Möbius, B. E. Lauderdale, S. R. Nagel, and H. M. Jaeger, “Brazil-nut effect: Size separation of granular particles,” Nature 414, 270 (2001).
- Hong, Quinn, and Luding (2001) D. C. Hong, P. V. Quinn, and S. Luding, “Reverse Brazil-nut problem: Competetion between percolation and condensation,” Phys. Rev. Lett. 86, 3423–3426 (2001).
- Shinbrot (2004) T. Shinbrot, “Granular materials: The brazil nut effect – in reverse,” Nature 429, 352–353 (2004).
- (26) “Machine and process design,” http://www.mpd-inc.com, accessed: 08.03.2022.
- (27) “Engineering tool box,” https://www.engineeringtoolbox.com, accessed: 08.03.2022.
- Ansari, Rivas, and Alam (2018) I. H. Ansari, N. Rivas, and M. Alam, “Phase-coexisting patterns, horizontal segregation, and controlled convection in vertically vibrated binary granular mixtures,” Phys. Rev. E 97, 012911 (2018).
- Amon et al. (2017) A. Amon, P. Born, K. E. Daniels, J. A. Dijksman, K. Huang, D. Parker, M. Schröter, R. Stannarius, and A. Wierschem, “Preface: Focus on imaging methods in granular physics,” Review of Scientific Instruments 88, 051701 (2017).
- Cundall and Strack (1979) P. A. Cundall and O. D. L. Strack, “A discrete numerical model for granular assemblies,” Geotechnique 29(1), 47–65 (1979).
- Jones et al. (2020) R. P. Jones, J. M. Ottino, P. B. Umbanhowar, and R. M. Lueptow, “Remarkable simplicity in the prediction of nonspherical particle segregation,” Phys. Rev. Research 2, 042021 (2020).
- Shäfer, Dippel, and Wolf (1996) J. Shäfer, S. Dippel, and D. E. Wolf, “Force schemes in simulations of granular materials,” Journal de Physique I 6, 5–20 (1996).
- Zhang and Whiten (1996) D. Zhang and W. J. Whiten, “The calculation of contact forces between particles using spring and damping models,” Powder Technol. 88, 59–64 (1996).
- Mishra (2003) B. K. Mishra, “A review of computer simulation of tumbling mills by the discrete element method: Part I-contact mechanics,” Int. J. Miner. Process. 71, 73–93 (2003).
- Bhateja, Sharma, and Singh (2016) A. Bhateja, I. Sharma, and J. K. Singh, “Scaling of granular temperature in vibro-fluidized grains,” Phys. Fluids 28, 043301 (2016).
- Pöschel and Schwager (2005) T. Pöschel and T. Schwager, Computational Granular Dynamics: Models and Algorithms (Springer, 2005).
- Zuriguel et al. (2005) I. Zuriguel, A. Garcimartín, D. Maza, L. A. Pugnaloni, and J. M. Pastor, “Jamming during the discharge of granular matter from a silo,” Phys. Rev. E 71, 051303 (2005).
- Campbell (1989) C. S. Campbell, “The stress tensor for simple shear flows of a granular material,” J. Fluid Mech. 203, 449–473 (1989).
- Tripathi and Khakhar (2010) A. Tripathi and D. V. Khakhar, “Steady flow of smooth, inelastic particles on a bumpy inclined plane: Hard and soft particle simulations,” Phys. Rev. E 81, 041307 (2010).