Pretrained Transformers Do not Always Improve Robustness
Abstract
Pretrained Transformers (PT) have been shown to improve Out of Distribution (OOD) robustness than traditional models such as Bag of Words (BOW), LSTMs, Convolutional Neural Networks (CNN) powered by Word2Vec and Glove embeddings. How does the robustness comparison hold in a real world setting where some part of the dataset can be noisy? Do PT also provide more robust representation than traditional models on exposure to noisy data? We perform a comparative study on 10 models and find an empirical evidence that PT provide less robust representation than traditional models on exposure to noisy data. We investigate further and augment PT with an adversarial filtering (AF) mechanism that has been shown to improve OOD generalization. However, increase in generalization does not necessarily increase robustness, as we find that noisy data fools the AF method powered by PT.
1 Introduction
ML models, especially large neural networks, have surpassed humans in a variety of AI benchmarks such as GLUE Wang et al. 2018. However these benchmarks all have IID evaluation sets; model performance decreases drastically on testing with OOD data Bras et al. 2020; Hendrycks and Dietterich 2019; Mishra et al. 2020b; Gokhale et al. 2022. This raises questions regarding the applicability of ML models beyond conventional datasets, demanding the development of better evaluation methods Ribeiro et al. 2020; Mishra et al. 2020a; Mishra and Arunkumar 2021 that can reduce the overestimated performance of models and better estimate their capability in real world.
We introduce a robustness metric Mean Rate of Change of Accuracy with Change in Poisoining (MRAP) to measure the real world capability of models by evaluating them on data with varying levels of poisoning. This is an important parameter to evaluate because data poisoning is inevitable in real world due to several potential reasons such as annotation issues due to task hardness/crowdworker error/unclear instruction, lack of resources to verify correctness of data, quick evolution of tasks leaving less time to verify, a translated or domain shifted task where the interpretation flips and there exist some users who deliberately mislead. Also, model performance on poisoned data is a bottleneck to reduce our dependency on the expensive annotation process which also has the risk of generating spurious bias Gururangan et al. 2018 .
Humans can detect changes in their surroundings based on their background knowledge and know to ignore poisoned data. Vision models have not been able to do so as they achieve zero training error on replacing true labels with random labels Zhang et al. 2016. Popular regularization techniques have not been able to control this behavior.
PT is shown to improve OOD robustness more than any other model Hendrycks et al. 2020. This is inline with our expectations, as self-supervised pre-training makes the model robust and provides less room to overfit. This paper focuses on studying robustness of a series of models to poisoned data. Do PT also have higher MRAP than other models?
We create poisoned data using a simple method of label flipping and experiment across 10 models. We find an empirical evidence that PT provide less robust representation than traditional models on exposure to noisy data. Our evidence further suggests that model ranking based on accuracy does not translate to their ranking based on robustness to noisy data. In order to investigate further, we augment PT with an adversarial filtering mechanism AFLiteSakaguchi et al. 2020 that has been shown to improve OOD generalization. Since AFLite was not originally designed to filter poisoned data, we extend it and propose Adversarial Filtering of Poisoned Data(AFPLite)– a flipped version of AFLite Sakaguchi et al. 2020– that is intended to prune poisoned data. We observe that adversarial filtering empowered by PT is not robust against poisoned data; hence increase in generalization does not necessarily increase robustness.
2 Experiments
2.1 Models
We select the same models used in the OOD robustness evaluation work Hendrycks et al. 2020. The models covers a variety of feature representations.
Bag of Words (BOW) : It Harris 1954 is a primal technique involving neural networks. We choose BOW as it has high bias and low variance
Word Embedding: Word2Vec Mikolov et al. 2013 converts raw words into vectors using a two-layer neural network. We also include Global Vectors for Word Representation (GloVe) in our study Pennington et al. 2014. These embeddings are encoded with word averages Wieting et al. 2015, LSTM Hochreiter and Schmidhuber 1997 and convolutional neural networks LeCun et al. 1995.
Transformers (PT): We use RoBERTA Liu et al. 2019 and two versions of the BERT model Devlin et al. 2018 - BERT-Base and BERT-Large.
2.2 Datasets
We experiment over the following sentiment classification datasets.
SST-2 Socher et al. 2013 is a collection of movie reviews along with human annotations. All the samples are classified as positive or negative.
IMDB Maas et al. 2011 is a collection of highly polarized reviews from the movies database site IMDb. A negative and positive review has scores of 4 and 7 out of 10 respectively. There are no neutral reviews included in dataset.
2.3 Experimental Setup
Data Poisoning: We create poisoned data by flipping some labels of the training set, keeping the evaluation set unaltered. We control label flipping at 5 different levels: (i) 0%, (ii) 30%, (iii) 50%, (iv) 70% and (v) 90%. We iterate through the dataset, mutating labels at random, till we reach the given threshold. For 70% and 90% label mutations, we follow the same procedure in reverse.
Implementation: We leverage AllenNLP Gardner et al. 2018 for implementing models. We lightly tune learning rate and number of epochs to maximize validation performance11 1 Code is attached in the supplementary material and will be open sourced upon acceptance..
MRAP: Let be the accuracies of model for dataset (the variant of dataset ) where the percentage of poisoned data is , , represents the set of available datasets i.e and represents the set of available models i.e . We define and its normalized version as:
|
|
(1) |
| (2) |
| (3) |
|
|
(4) |
3 Results and Analysis
We calculate NMRAP for all models and explore the following questions while analyzing results.
() Does our advancement in ML models from a simple neural network to Transformers is also reflected in robustness to data poisoning? Figure 1 shows the comparison between normalized accuracy (converted to [0,1] for fair comparison) and NMRAP for 10 models. We arrange models in the increasing order of accuracy, however NMRAP is not monotonically increasing and results in several ranking changes. So, our advancement in ML models (measured using accuracy) is not reflected in robustness to data poisoning. This finding is in-contrast to the emerging new behavior in new models e.g. few shot instruction-following Mishra et al. 2022b; Wei et al. 2021; Sanh et al. 2021; Mishra et al. 2022a; Ouyang et al. 2022; Parmar et al. 2022. We further analyze by segregating models into 4 clusters: Transformers, LSTM, CNN, and others (also called as Naive in various contexts). CNNs and Transformers are seen to perform worse than Naive models and LSTMs (Table 1). Even though Transformers have higher validation accuracy for each poisoning level, the accuracy perturbs significantly with respect to the poisoning levels; this results in lower robustness which is reflected in NMRAP.

| Pi\Model | CNN | LSTM | Naive | Transformers |
|---|---|---|---|---|
| 0 | 84.29 | 86.25 | 81.96 | 94.25 |
| 30 | 67.83 | 82.93 | 75.4 | 80.39 |
| 50 | 49.71 | 49.66 | 49.49 | 50.43 |
| 70 | 75.04 | 83.01 | 69.83 | 77 |
| 90 | 81.48 | 85.95 | 79.95 | 94.04 |
| MRAP | 87.44 | 245.07 | 136.12 | 110.02 |
| NMRAP | 0 | 1 | 0.31 | 0.14 |
() Does pre-training with a greater quantity and diversity of data improve robustness to data poisoning? Table 1 –where Pre-trained Transformers are outperformed by simpler models– indicates that pre-training does not necessarily improve robustness to data poisoning. Within Transformers, BERT-BASE-POOL outperforms ROBERTA-LARGE-POOL (Figure 1). RoBERTA is pretrained with a greater quantity and diversity of data than BERT. This signals that pre-training with a greater quantity and diversity of data does not necessarily improve this aspect of robustness.

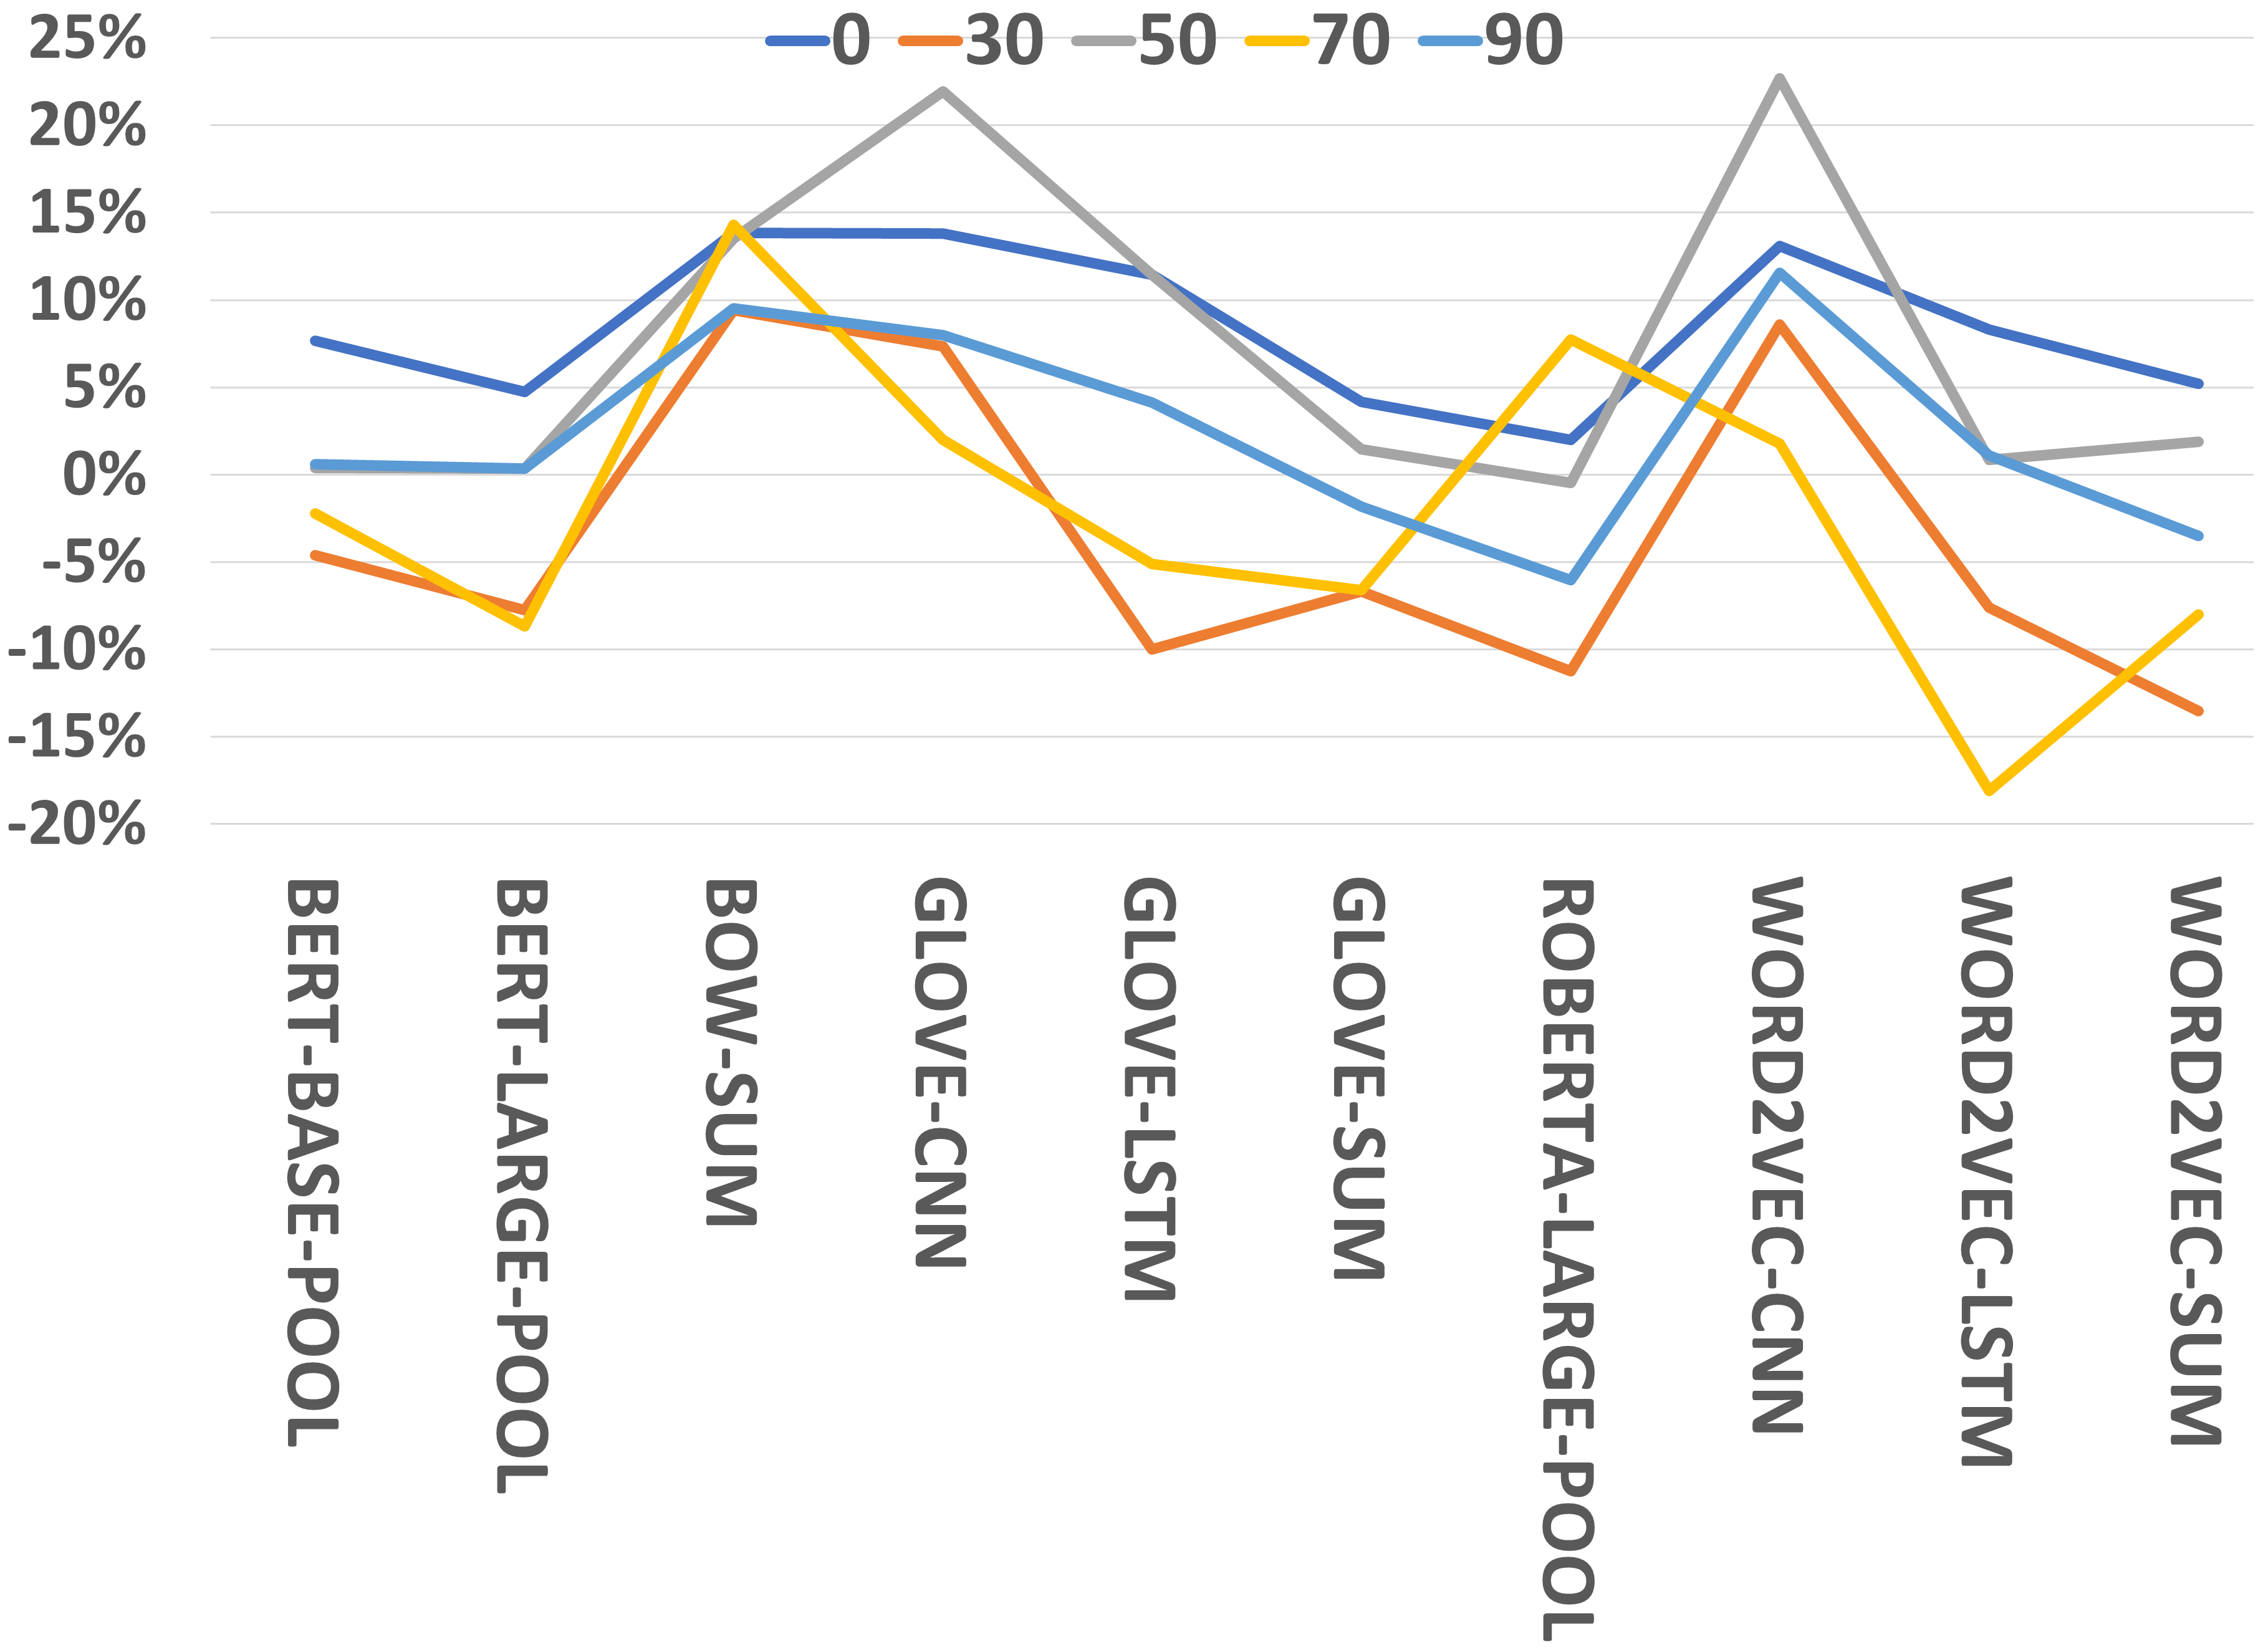
() How are the models sensitive to the percentage of poisoning within and across datasets? Figure 2 shows that, model accuracy initially decreases as we increase the percentage of label mutations. However, this trend reverses beyond 50% mutation- the accuracy increases- because the label interpretation is flipped when over 50% of the labels are flipped. WORD2VEC-SUM shows a minimal change in the validation accuracy at all poisoning levels, thus has the highest NMRAP score. Figure 3 further illustrates the sensitivity of models with respect to datasets; Transformers have relatively higher variation than other architectures. Currently MRAP and NMRAP does not take variance across datasets into consideration, however those can be integrated in a future metric for fine grained analysis of robustness.

() How does the generalization gap varies across models? The difference between training and testing accuracy represents the generalization gap. Higher gap indicates overfitting and so undesirable. Figure 4 shows that CNNs and Transformers have highest and lowest generalization gap respectively. This characteristics can also be incorporated in a future metric, specially for applications where getting a poison free development set is less likely and so the primary indicator of model capability is training set performance.
4 Adversarial Filtering of Noisy Labels
4.1 Algorithm
We design AFPLite (Algorithm 1) based on the results of Section 3 that shows how noisy labels pose challenges to PT. Here, we use RoBERTA as PT. The key intuition behind AFPLite is that samples with flipped labels will be hard to solve using linear models on top of RoBERTA embeddings. This is exact opposite of AFLite’s intuition, i.e., samples containing spurious bias – that provides shortcuts to models for solving– will be easy to solve using linear models on top of RoBERTA embeddings.
Formalization:
Let represents dataset, represent samples, be the set of models (SVM and Logistic Regression) , be the pruned set, , and be the evaluation score, correct prediction score and predictability score of each sample respectively.
4.2 Results and Analysis
A key hyperparameter in Algorithm 1 is which defines the upper threshold for filtering. Since samples with noisy labels are hard samples, we start with as 0.1 and keep on increasing it til 1, however we could never filter only poisoned data. Filtered data always contain poisoned and not poisoned data uniformly (Figure 5). We also observe the same distribution for varying percentages of poisoning (Table 2). Since Adversarial filtering (empowered by PT i.e. RoBERTA embeddings) is unable to distinguish poisoned and nonpoisoned data, data poisoning is indeed a challenge for PT.

| P(s)\ | 1 | 5 | 10 | 50 |
|---|---|---|---|---|
| 0-0.1 | 0.00 | 0.00 | 0.00 | 0.00 |
| 0.1-0.2 | 3.25 | 5.32 | 12.35 | 100.00 |
| 0.2-0.3 | 0.90 | 4.40 | 9.62 | 88.24 |
| 0.3-0.4 | 0.84 | 4.07 | 9.87 | 85.20 |
| 0.4-0.5 | 0.63 | 4.05 | 11.23 | 81.32 |
| 0.5-0.6 | 1.17 | 4.64 | 9.35 | 81.20 |
| 0.6-0.7 | 1.01 | 4.70 | 9.88 | 77.73 |
| 0.7-0.8 | 0.80 | 4.85 | 9.31 | 119.05 |
| 0.8-0.9 | 0.84 | 5.17 | 10.21 | 0.00 |
| 0.9-1.0 | 0.00 | 3.92 | 50.00 | 0.00 |
5 Conclusion
Considering the model performance inflation caused by accuracy, we propose MRAP to measure robustness of models in handling poisoned data, a key skill required in the real world for various reasons. We experiment across 10 models and find an evidence where LSTMs and other models outperform PT in robustness to noisy data. In order to understand the failure mode of PT, we extend AFLite and build AFPLite - a flipped version of AFLite- that is meant to prune poisoned data. We show that adversarial filtering (empowered by PT) which is known to improve OOD generalization does not necessarily improve robustness as a simple data poisoning method fools adversarial filtering. We analyze several concepts related to robustness such as generalization, pre-training and sensitivity. A potential future extension is to analyze our evidence further by performing large scale experiment on more datasets and models. We hope our insights from model comparison will help the community develop better real world models/ensembles.
6 Limitations
We experiment with only 2 datasets. However, note that the goal of this paper is to justify a negative result. As in logic and mathematics, only one instance is enough to prove that something is not True (in contrast to the exhaustive evaluation required to proof something is True).
Noisy data in real world can be more complex than label flipping. In this paper, all our experiments are limited to label flipping. However, the goal of this paper is to show a negative finding. We feel its actually a strength of the paper to show the negative finding with such a simple technique.
References
- Bras et al. (2020) Ronan Le Bras, Swabha Swayamdipta, Chandra Bhagavatula, Rowan Zellers, Matthew E Peters, Ashish Sabharwal, and Yejin Choi. 2020. Adversarial filters of dataset biases. arXiv preprint arXiv:2002.04108.
- Devlin et al. (2018) Jacob Devlin, Ming-Wei Chang, Kenton Lee, and Kristina Toutanova. 2018. Bert: Pre-training of deep bidirectional transformers for language understanding. arXiv preprint arXiv:1810.04805.
- Gardner et al. (2018) Matt Gardner, Joel Grus, Mark Neumann, Oyvind Tafjord, Pradeep Dasigi, Nelson Liu, Matthew Peters, Michael Schmitz, and Luke Zettlemoyer. 2018. Allennlp: A deep semantic natural language processing platform. arXiv preprint arXiv:1803.07640.
- Gokhale et al. (2022) Tejas Gokhale, Swaroop Mishra, Man Luo, Bhavdeep Sachdeva, and Chitta Baral. 2022. Generalized but not robust? comparing the effects of data modification methods on out-of-domain generalization and adversarial robustness. In Findings of the Association for Computational Linguistics: ACL 2022, pages 2705–2718.
- Gururangan et al. (2018) Suchin Gururangan, Swabha Swayamdipta, Omer Levy, Roy Schwartz, Samuel R Bowman, and Noah A Smith. 2018. Annotation artifacts in natural language inference data. arXiv preprint arXiv:1803.02324.
- Harris (1954) Zellig S Harris. 1954. Distributional structure. Word, 10(2-3):146–162.
- Hendrycks and Dietterich (2019) Dan Hendrycks and Thomas Dietterich. 2019. Benchmarking neural network robustness to common corruptions and perturbations. arXiv preprint arXiv:1903.12261.
- Hendrycks et al. (2020) Dan Hendrycks, Xiaoyuan Liu, Eric Wallace, Adam Dziedzic, Rishabh Krishnan, and Dawn Song. 2020. Pretrained transformers improve out-of-distribution robustness.
- Hochreiter and Schmidhuber (1997) Sepp Hochreiter and Jürgen Schmidhuber. 1997. Long short-term memory. Neural computation, 9:1735–80.
- LeCun et al. (1995) Yann LeCun, Yoshua Bengio, et al. 1995. Convolutional networks for images, speech, and time series. The handbook of brain theory and neural networks, 3361(10):1995.
- Liu et al. (2019) Yinhan Liu, Myle Ott, Naman Goyal, Jingfei Du, Mandar Joshi, Danqi Chen, Omer Levy, Mike Lewis, Luke Zettlemoyer, and Veselin Stoyanov. 2019. Roberta: A robustly optimized bert pretraining approach. arXiv preprint arXiv:1907.11692.
- Maas et al. (2011) Andrew L. Maas, Raymond E. Daly, Peter T. Pham, Dan Huang, Andrew Y. Ng, and Christopher Potts. 2011. Learning word vectors for sentiment analysis. In Proceedings of the 49th Annual Meeting of the Association for Computational Linguistics: Human Language Technologies, pages 142–150, Portland, Oregon, USA. Association for Computational Linguistics.
- Mikolov et al. (2013) Tomas Mikolov, Ilya Sutskever, Kai Chen, G.s Corrado, and Jeffrey Dean. 2013. Distributed representations of words and phrases and their compositionality. Advances in Neural Information Processing Systems, 26.
- Mishra and Arunkumar (2021) Swaroop Mishra and Anjana Arunkumar. 2021. How robust are model rankings: A leaderboard customization approach for equitable evaluation. In Proceedings of the AAAI Conference on Artificial Intelligence, volume 35, pages 13561–13569.
- Mishra et al. (2020a) Swaroop Mishra, Anjana Arunkumar, Chris Bryan, and Chitta Baral. 2020a. Our evaluation metric needs an update to encourage generalization. arXiv preprint arXiv:2007.06898.
- Mishra et al. (2020b) Swaroop Mishra, Anjana Arunkumar, Bhavdeep Sachdeva, Chris Bryan, and Chitta Baral. 2020b. Dqi: Measuring data quality in nlp. arXiv, pages arXiv–2005.
- Mishra et al. (2022a) Swaroop Mishra, Daniel Khashabi, Chitta Baral, Yejin Choi, and Hannaneh Hajishirzi. 2022a. Reframing instructional prompts to GPTk’s language. In Findings of the Association for Computational Linguistics: ACL 2022, pages 589–612, Dublin, Ireland. Association for Computational Linguistics.
- Mishra et al. (2022b) Swaroop Mishra, Daniel Khashabi, Chitta Baral, and Hannaneh Hajishirzi. 2022b. Cross-task generalization via natural language crowdsourcing instructions. In Proceedings of the 60th Annual Meeting of the Association for Computational Linguistics (Volume 1: Long Papers), pages 3470–3487.
- Ouyang et al. (2022) Long Ouyang, Jeff Wu, Xu Jiang, Diogo Almeida, Carroll L Wainwright, Pamela Mishkin, Chong Zhang, Sandhini Agarwal, Katarina Slama, Alex Ray, et al. 2022. Training language models to follow instructions with human feedback. Preprint.
- Parmar et al. (2022) Mihir Parmar, Swaroop Mishra, Mirali Purohit, Man Luo, M Hassan Murad, and Chitta Baral. 2022. In-boxbart: Get instructions into biomedical multi-task learning. arXiv preprint arXiv:2204.07600.
- Pennington et al. (2014) Jeffrey Pennington, Richard Socher, and Christopher Manning. 2014. GloVe: Global vectors for word representation. In Proceedings of the 2014 Conference on Empirical Methods in Natural Language Processing (EMNLP), pages 1532–1543, Doha, Qatar. Association for Computational Linguistics.
- Ribeiro et al. (2020) Marco Tulio Ribeiro, Tongshuang Wu, Carlos Guestrin, and Sameer Singh. 2020. Beyond accuracy: Behavioral testing of nlp models with checklist. In Proceedings of the 58th Annual Meeting of the Association for Computational Linguistics, pages 4902–4912.
- Sakaguchi et al. (2020) Keisuke Sakaguchi, Ronan Le Bras, Chandra Bhagavatula, and Yejin Choi. 2020. Winogrande: An adversarial winograd schema challenge at scale. In Proceedings of the AAAI Conference on Artificial Intelligence, volume 34, pages 8732–8740.
- Sanh et al. (2021) Victor Sanh, Albert Webson, Colin Raffel, Stephen H Bach, Lintang Sutawika, Zaid Alyafeai, Antoine Chaffin, Arnaud Stiegler, Teven Le Scao, Arun Raja, et al. 2021. Multitask prompted training enables zero-shot task generalization. arXiv preprint arXiv:2110.08207.
- Socher et al. (2013) Richard Socher, Alex Perelygin, Jean Y. Wu, Jason Chuang, Christopher D. Manning, Andrew Y. Ng, and Christopher Potts. 2013. Recursive deep models for semantic compositionality over a sentiment treebank. In In Proceedings of EMNLP, pages 1631–1642.
- Wang et al. (2018) Alex Wang, Amanpreet Singh, Julian Michael, Felix Hill, Omer Levy, and Samuel R Bowman. 2018. Glue: A multi-task benchmark and analysis platform for natural language understanding. arXiv preprint arXiv:1804.07461.
- Wei et al. (2021) Jason Wei, Maarten Bosma, Vincent Y Zhao, Kelvin Guu, Adams Wei Yu, Brian Lester, Nan Du, Andrew M Dai, and Quoc V Le. 2021. Finetuned language models are zero-shot learners. arXiv preprint arXiv:2109.01652.
- Wieting et al. (2015) John Wieting, Mohit Bansal, Kevin Gimpel, and Karen Livescu. 2015. Towards universal paraphrastic sentence embeddings.
- Zhang et al. (2016) Chiyuan Zhang, Samy Bengio, Moritz Hardt, Benjamin Recht, and Oriol Vinyals. 2016. Understanding deep learning requires rethinking generalization.
Appendix A Supplemental Material
This supplementary section is provided to shed some more light on the experiments presented in the paper.
A.0.1 Models Accuracy
The table 3 provides more detail for the model’s accuracy with respect to the amount of poisoning in the data as discussed in of Results and Analysis Section.

| bert-base-pool | bert-large-pool | bow-sum | glove-cnn | glove-lstm | glove-sum | roberta-large-pool | word2vec-cnn | word2vec-lstm | word2vec-sum | |
|---|---|---|---|---|---|---|---|---|---|---|
| 0 | 91.36% | 93.65% | 85.58% | 90.79% | 85.91% | 83.75% | 94.85% | 89.52% | 86.25% | 80.76% |
| 30 | 80.39% | 87.97% | 64.72% | 72.92% | 81.67% | 79.27% | 88.65% | 72.78% | 82.93% | 80.53% |
| 50 | 50.00% | 50.86% | 50.40% | 51.55% | 50.52% | 50.96% | 50.86% | 49.08% | 49.14% | 51.20% |
| 70 | 83.12% | 89.35% | 63.23% | 75.89% | 81.35% | 77.43% | 50.86% | 76.45% | 83.09% | 80.07% |
| 90 | 88.85% | 92.44% | 73.43% | 87.42% | 87.55% | 80.64% | 94.04% | 80.76% | 87.37% | 81.10% |
A.0.2 Model Categorization
Table 4 depicts how different models are combined and averaged to produce the results in Results and Analysis section. Table 5 further illustrates the generalization gap between training and dev set as discussed in Results and Analysis section.
| Corruption Percentage Percentage | |||||||
|---|---|---|---|---|---|---|---|
| Embedder | Seq2Vec | Category | 0 | 30 | 50 | 70 | 90 |
| bow | sum | Naïve | 81.96% | 62.43% | 49.49% | 63.08% | 72.34% |
| word2vec | sum | Naïve | 79.04% | 75.40% | 48.80% | 69.83% | 79.95% |
| glove | sum | Naïve | 79.14% | 66.33% | 49.12% | 66.18% | 76.31% |
| word2vec | lstm | LSTM | 86.25% | 82.93% | 49.14% | 83.01% | 85.95% |
| glove | lstm | LSTM | 85.74% | 81.27% | 49.66% | 78.81% | 85.23% |
| word2vec | cnn | CNN | 84.29% | 65.36% | 47.95% | 75.04% | 78.83% |
| glove | cnn | CNN | 84.18% | 67.83% | 49.71% | 74.44% | 81.48% |
| bert-base | pool | Transformers | 91.36% | 80.39% | 49.51% | 66.99% | 88.85% |
| bert-large | pool | Transformers | 92.74% | 72.47% | 49.73% | 77.98% | 83.02% |
| roberta-large | pool | Transformers | 94.25% | 69.75% | 50.43% | 50.86% | 94.04% |
A.1 Infrastructure Used
All the experiments were conducted on "TeslaV100-SXM2-16GB"; CPU cores per node 20; CPU memory per node: 95,142 MB; CPU memory per core: 4,757 MB. This configuration is not a necessity for these experiments as we ran our operations with NVIDIA Quadro RTX 4000 as well with lesser memory.
| 0 | 30 | 50 | 70 | 90 | ||
|---|---|---|---|---|---|---|
| IMDB | bert-base-pool | 7.91% | -0.74% | -0.19% | -4.86% | 2.72% |
| bert-large-pool | 1.99% | -7.58% | 0.02% | -7.05% | 3.43% | |
| bow-sum | 13.69% | 20.44% | 21.44% | 29.26% | 11.03% | |
| glove-cnn | 9.21% | 22.62% | 48.22% | 23.68% | 10.93% | |
| glove-lstm | 8.40% | -8.32% | 26.94% | -7.42% | 1.71% | |
| glove-sum | -1.19% | -6.56% | -0.17% | 1.70% | -9.04% | |
| roberta-large-pool | 1.99% | -22.83% | -0.04% | 14.92% | -4.21% | |
| word2vec-cnn | 8.75% | 15.24% | 50.46% | 21.91% | 24.56% | |
| word2vec-lstm | 6.23% | 0.40% | 0.23% | -20.67% | -0.93% | |
| word2vec-sum | 3.48% | -12.29% | -0.34% | 4.95% | -5.94% | |
| SST-2 | bert-base-pool | 7.40% | -8.49% | 0.94% | 0.44% | -1.55% |
| bert-large-pool | 5.13% | -15.60% | -0.66% | -13.95% | 0.26% | |
| bow-sum | 14.01% | -1.64% | 5.61% | -0.64% | 7.99% | |
| glove-cnn | 14.41% | 1.30% | 18.16% | -5.63% | 7.64% | |
| glove-lstm | 12.84% | -11.15% | 3.70% | -5.92% | 5.12% | |
| glove-sum | 4.74% | -15.78% | 1.25% | -14.33% | -3.04% | |
| roberta-large-pool | 2.01% | 0.34% | -0.93% | 0.55% | -7.87% | |
| word2vec-cnn | 13.28% | 5.93% | 13.90% | -4.56% | 7.30% | |
| word2vec-lstm | 10.39% | -15.63% | 1.47% | -15.50% | 3.11% | |
| word2vec-sum | 3.67% | -17.09% | 0.00% | -16.75% | -3.84% |