2023
While much research focused on producing explanations, it is still unclear how the produced explanations’ quality can be evaluated in a meaningful way. Today’s predominant approach is to quantify explanations using proxy scores which compare explanations to (human-annotated) gold explanations. This approach assumes that explanations which reach higher proxy scores will also provide a greater benefit to human users. In this paper, we present problems of this approach. Concretely, we (i) formulate desired characteristics of explanation quality, (ii) describe how current evaluation practices violate them, and (iii) support our argumentation with initial evidence from a crowdsourcing case study in which we investigate the explanation quality of state-of-the-art explainable question answering systems. We find that proxy scores correlate poorly with human quality ratings and, additionally, become less expressive the more often they are used (i.e. following Goodhart’s law). Finally, we propose guidelines to enable a meaningful evaluation of explanations to drive the development of systems that provide tangible benefits to human users.
Challenges in Explanation Quality Evaluation
keywords
Explainable Artificial Intelligence, Evaluation, Natural Language Processing, Question Answering, Human Evaluation1 Introduction
While deep neural network models, such as transformers, achieve state-of-the-art results on many natural language processing (NLP) tasks, they are mainly black-box models. This raises the need to provide—in addition to the systems’ predictions—explanations of why the systems made these predictions. Such explanations are essential when deploying models in real-world scenarios with human end-users (Angwin et al. 2016; Rudin et al. 2020) as they can help to identify dangerous model behavior and thereby, e.g., prevent discrimination. Explanations can be given in diverse forms. A popular type of explanation shows which parts of the model input were necessary for the model’s output. It is frequently implemented as a heat map over the input that visualizes an importance measure, such as integrated gradients (Sundararajan et al. 2017) or attention weights (Wiegreffe and Pinter 2019). Alternatively, model behavior can also be explained by providing supporting arguments for the model’s prediction, e.g., by selecting a set of facts from a context (Yang et al. 2018) or by generating textual explanations that directly verbalize why a model took a decision (Camburu et al. 2018). Table 1 shows examples of these three types of explanations for the example of text-related tasks.
| Type | Description | Example | Proxy Scores |
|---|---|---|---|
| Rationals, saliency maps | Input tokens are highlighted to reflect what was most important to the model (e.g., based on attention or saliency scores such as integrated gradients). | Input: I like this movie. Prediction: positive sentiment Rational explanation: I like this movie. Saliency explanation: I like this movie. | Overlap to human rational annotations (e.g., via F1), Removal analysis (e.g., quantifying the drop in performance when highlighted input parts are removed) (Atanasova et al. 2020, i.a.,), Student model accuracy gains when trained on the explanations (Pruthi et al. 2022) |
| Supporting facts | A set of facts (i.e., sentences) extracted from a given context are provided as evidence for the prediction. | Question: What is the area of the desert that Ghanzi is in the middle of? Answer: 900000 km² Fact 1: Ghanzi is a town in the middle of the Kalahari Desert the western part of the Republic of Botswana in southern Africa. Fact 2: The Kalahari Desert is […] extending for 900000 km². | Overlap to human annotations of supporting facts (e.g., via F1) (Yang et al. 2018), Removal and consistency analysis (Schuff et al. 2020) |
| Free text | Generated textual explanation that supports the prediction. | Premise: A man in an orange vest leans over a pickup truck. Hypothesis: A man is touching a truck. Predicted label: entailment Explanation: Man leans over a pickup truck implies that he is touching it. (from Camburu et al. 2018) | Overlap to human-written references (e.g., via BLEU or BLEURT) (Camburu et al. 2018; Schuff et al. 2021; Kayser et al. 2021)) |
The predominant approach to evaluating the produced explanations’ quality is to use automatic proxy scores, such as BLEU or F1 (Camburu et al. 2018; Yang et al. 2018; DeYoung et al. 2020; Atanasova et al. 2020). These scores are, in turn, ranked on leaderboards to define state-of-the-art systems. Much research goes to great lengths to reach new highscores on these leaderboards. However, it is still to be determined if developing systems that provide explanations that reach new highscores will also produce systems that provide a larger benefit to their human users.
This paper argues that the prevalent explanation evaluation process fails to measure explanation quality in a meaningful way. We first discuss desired characteristics of explanation quality based on findings from social sciences, such as Miller 2019. Next, we show that current evaluation practices conflict with these characteristics. We support our argumentation with initial empirical evidence from a crowdsourcing study in which we investigate explainable question answering systems from the HotpotQA (Yang et al. 2018) leaderboard.11 1 https://hotpotqa.github.io/ Concretely, we demonstrate the lack of proxy score validity, the corresponding conflation of quality dimensions and the erosion of target scores over time (i.e., Goodhart’s Law).
Finally, we propose practical guidelines to overcome those obstacles to meaningful explanation quality evaluation. We release the collected human ratings and the corresponding analysis code.22 2 https://released-upon-acceptance.com (we remove questions and answer texts to prevent leakage of the secret test set)
2 Characteristics of Explanation Quality
Criteria for high-quality explanations have mainly been discussed in social sciences so far. Besides desirable explanation features such as coherence (Thagard 1989; Ranney and Thagard 1988; Read and Marcus-Newhall 1993), soundness or completeness (Kulesza et al. 2013), literature has pointed out the importance of the explainees (Miller 2019; Wang and Yin 2021) and their goals (Vasilyeva et al. 2015). Based on this prior work, we discuss characteristics of explanation quality in NLP in this section. Note that we assume the faithfulness of an explanation and only focus on characteristics for its perceivable quality.33 3 We consider explanation characteristics that can be judged without access to the underlying model. We refer to Jacovi and Goldberg 2020 for a discussion of faithfulness evaluation and to Liao et al. 2022 for a distinction between model-intrinsic and human-centered explanation properties.
2.1 Explanation Quality is User-dependent
We argue that in AI, an explanation exists only in relation to a system that should be explained (the explanandum) and the human that receives the explanation (the explainee). This statement is in line with the social process function of an explanation described by Miller 2019 referring to the conversational model of explanation of Hilton 1990. Hilton argues that an explanation should be considered a conversation and emphasizes that “the verb to explain is a three-place predicate: Someone explains something to someone” (Miller 2019). Given that explanations are always targeted towards a specific user group, we argue that their quality needs to be assessed accordingly.
In the following, we detail how user goals, individual user characteristics as well as general peculiarities of human perception impact the definition of how good an explanation is and why such a definition can never be universal.
Goals of Target Users
Vasilyeva et al. 2015 showed that users’ perception of explanation quality depends on their goals. Similarly, Liao et al. 2022 found that users’ usage context affects which explanation quality properties they consider to be important.
While, for example, an explanation in the form of a heatmap over a text (as shown in the first row of Table 1) might be sufficient for an NLP developer or researcher who aims at analyzing and improving the system, it might not fit the needs of an end-user who has no machine-learning background but uses the system in practice. Although the explanation contains the same information, its perceived quality might be considered lower by end-users compared to developers because, for example, the mental effort to process the explanation could be higher for end-users that are unfamiliar with such visualizations.
Individual Differences of Target Users
In addition to the users’ goals, their background knowledge affects which type and extent of explanations are most useful for them (Preece et al. 2018; Yu and Shi 2018; Suresh et al. 2021). As a trivial but illustrative example, a perfect explanation in Spanish is clearly useless to a monolingual English speaker and an “explanation” as it is provided by the coefficients of a linear model is useless to a user with dyscalculia. Concretely, prior work showed that, i.a., (a) an increase in users’ education levels and technical literacy corresponds to an increased algorithm understanding (Cheng et al. 2019), (b) users’ need for cognition (i.e., their motivation to engage in effortful mental activities) impacts how much they benefit from interventions that increase analytical engagement with explanations (Buçinca et al. 2021), and (c) the effect of explanation on users strongly depends on the users’ domain knowledge (Wang and Yin 2021).
Intersubjective Quality within User Groups
While the individual goals and characteristics of each user make them perceive and use explanations in a unique way, certain groups of “similar” explainees (e.g., Spanish native speakers reading a generated Spanish text) will be affected by explanations similarly. Therefore, we argue that explanation quality is an intersubjective construct. This has two immediate implications. First, it implies that every evaluation of explanation quality is limited to a specific group of explainees. However, it also implies that explanation quality can be objectively assessed within a suitable group of explainees. For example, an often-used categorization in explainability is to divide users into three groups: developers, domain experts and lay users (Ribera and Lapedriza 2019). Dividing users into such high-level groups can already help to identify important differences regarding their explanation needs, however a more fine-grained categorization including, e.g., social and cognitive user properties—as suggested by Jacovi et al. 2022—could further improve evaluation quality.
Cognitive Biases and Social Attribution
Hilton’s conversational conversational model of explanation distinguishes two stages: (a) the diagnosis stage in which causal factors of an event/observation are determined and (b) the explanation presentation stage in which this information is communicated to the explainee Hilton 1990.44 4 We refer to Miller 2019 for a more detailed discussion of Hilton’s work in the context of explainability. So even if the first stage is successful (i.e., the right “explanation information” has been identified), communicating the explanation information can fail (e.g., by relying on an inappropriate visualization to visualize the information). Schuff et al. 2022 empirically showed that such problems in explanation communication can occur for heat map explanations over text and that the information that users understand from these explanations is distorted by unrelated factors such as word length. Similar, Gonzalez et al. 2021 show that belief bias (i.e., a particular cognitive bias) affects which explanation method users prefer. More broadly, Jacovi et al. 2022 propose a framework of social attribution by the human explainee that describes which information an explainee is comprehending from an explanation and thereby allows to identify failures of explainability methods.
2.2 Explanation Quality has (Orthogonal) Dimensions
Explanation quality is commonly treated as a monolithic construct in which explanations can be ranked along a unidimensional range of explanation “goodness”. We, in contrast, argue that there are different dimensions of explanation quality and that these dimensions can be orthogonal to each other. Thus, explanation should be evaluated along multiple facets of explanation quality.
An example of two orthogonal quality dimensions are faithfulness and plausibility. Consider an explanation that explains the decision process of a system A in a way that (a) faithfully reflects the system decision process and (b) plausibly convinces a user of the correctness of the prediction. We then replace the system with a new system B while keeping the explanation constant. The explanation will still be plausible to the user (it did not change), however, if system B has a different decision process, the explanation is not faithful anymore as it no longer reflects the model’s inner workings. Consequently, the two explanation quality dimensions faithfulness and plausibility can be independent and cannot be captured with the same score.55 5 We refer to Jacovi and Goldberg 2020 for a detailed comparison of faithfulness and plausibility.
Similarly, an explanation that is perceived to be helpful by explainees does not actually have to be helpful for them. Buçinca et al. 2020 showed that between two decision support systems, users preferred one system (in terms of rating it as more helpful and trusted), although their actual performance was significantly better with the less-favored system. Also, their subjective ratings were not predictive of their objective performance with the system. In their follow-up work, Buçinca et al. 2021 found a trade-off between subjective system quality ratings and effective human-AI performance for explainable AI systems. Related effects have been reported by Scharrer et al. 2012 who compared the impact of showing easy versus difficult scientific arguments to lay people and found that the easy arguments lead to participants being more convinced and underestimating their own knowledge limitations. These findings suggest that effective explanations have to combine or balance (a) their perceived utility and (b) their actual utility to their users. While an explanation that only subjectively seems to provide a benefit clearly is not desirable, an explanation that affects users to their own benefit but is disliked by them will not be used in practice.66 6 Nadarzynski et al. 2019 found AI acceptability to be correlated with, i.a., perceived utility and trustworthiness.
Overall, effective explanation evaluation thus has to account for the numerous, partially orthogonal dimensions of explanation quality.
3 Case Study on the HotpotQA Leaderboard
Before we present our arguments on how current explainability quality evaluations fall short, we introduce our case study which we will refer back to throughout Section 4. To support the following discussion with empirical evidence, we conduct a crowdsourcing study analyzing systems from 10 real models submitted to the official HotpotQA (Yang et al. 2018) leaderboard ranking explainable question answering models.77 7 We thank the HotpotQA maintainers for providing us with the predictions and the system submitters for giving us their consent to include their model in our case study.
3.1 Task, Models and Automatic Evaluation
In the following, we describe the HotpotQA task, present the leaderboard models we analyze and list proxy metrics that we use to automatically quantify the models’ explanation capabilities.
Task and Data
In the HotpotQA task, systems receive a question and parts of 10 Wikipedia88 8 In our case study, we focus on the distractor setting. articles as context and have to predict (i) an answer to the question (yes/no or a text span from the context) as well as (ii) which sentences from the context are supporting facts to their predicted answer. The supporting facts serve as an explanation for the predicted answer of the model. The HotpotQA dataset provides gold annotations for answers as well as supporting facts for 113k instances in total. Figure 2 shows an example of a (real) model prediction that contains the correct answer and one of two ground facts but misses the second ground truth fact and, instead, returns a fact that is unrelated to the answer. The training and development splits of the dataset are publicly available while the test set is only used to evaluate models on the official leaderboard.99 9 https://hotpotqa.github.io/
Evaluated Models
We obtained consent from submitters of 24 real models to include the system predictions in our analysis. From those 24 models, we choose 10 models for our user study: AMGN (rank 16) (anonymous submittor), FE2H on ALBERT (3) (Li et al. 2022), HGN (Fang et al. 2020) (35), IRC (63) (Nishida et al. 2021), Longformer (25) (anonymous), S2G-large (31) (anonymous), Text-CAN (47) (Usyd NLP), GRN (65) (anonymous), SAE (48) (Tu et al. 2020), DecompRC (unranked1010 10 DecompRC reports answer metrics only.) (Min et al. 2019).1111 11 Ranks last updated 24th of February 2023.
Additionally, we derive five synthetic models using the ground truth annotations to include extreme cases of the potential space of systems: (i) gold answers and gold facts (plain gold annotations), (ii) gold answers and random facts (we sample the same number of of facts as the gold annotations, but do not sample from the articles in which the gold facts are located in), (iii) random answers and gold facts (we sample a random answer from the context while keeping the number of words the same as in the gold answer), (iv) random answers and random facts (both answers and facts are sampled, as described before), (v) gold answers and all facts (gold answers but the predicted facts are all facts from the context, i.e. from 10 Wikipedia articles).
Proxy Scores
| Proxy score | Description | |
|---|---|---|
| leaderboard scores | answer-precision, answer-recall, answer-F1, answer-EM | Overlap metrics that compare the predicted answer tokens and the ground truth answer tokens using precision, recall, F1 and exact match (EM) |
| SP-precision, SP-recall, SP-F1, SP-EM | Overlap metrics that compare the set of predicted supporting facts and the set of ground truth supporting facts using precision, recall, F1 and EM on a sentence level | |
| joint-precision, joint-recall, joint-F1, joint-EM | Joint versions of the answer and supporting facts metrics based on instance-wise products of EM, precision and recall | |
| additional scores | LocA score | A score that measures how well the predicted answer and explanation are coupled. It compares the fraction of answer tokens inside an explanation to the fraction of tokens outside an explanation. |
| #facts | Number of facts (i.e., sentences) within the predicted explanation | |
| #words | The number of words over all facts inside the predicted explanation |
The HotpotQA leaderboard reports the metrics exact match (EM), precision, recall and F1 for three levels: (i) answer, (ii) supporting facts (i.e., the explanation) and (iii) on the answer and explanation jointly. Table 2 lists and describes all of these proxy scores in the upper part of the table. The leaderboard ranks the systems according to joint-F1 scores on a non-public test set (breaking ties by using other measures like joint-EM and answer-F1).
We consider three additional scores shown in the lower part of Table 2. The LocA score is a task-specific score proposed by Schuff et al. 2020 and measures to which extent predictions and explanations are coupled. LocA is defined as
where and denote the number of answers inside/outside of the predicted facts and denotes the total number of answers. A higher LocA score corresponds to a better explanation-answer coupling. While the original LocA score measures how many predicted answers are located in explanations by comparing offsets, we generalize this concept to general string matching because we do not have access to the answer offsets of the leaderboard models. As a positive side-effect, this makes the score applicable to every kind of model and not only to extractive question answering models.
Furthermore, we include two additional surface scores that measure an explanation’s length in terms of (a) the number of facts it includes and (b) the total number of words that these facts contain.
We provide all F1, LocA and explanation length values of the 24 models for which we got permission to include them in our analysis as well as our five synthetic models in Table 9 in Appendix A.
3.2 Human Evaluation
To obtain a clearer perspective onto (i) the relation between the described proxy scores and human ratings and (ii) the model ranks regarding various human ratings, we analyze test set predictions of the 10 real model submissions as well as the five synthetic models we discussed in Section 3.1. We evaluate the models in a crowdsourced user study with 75 participants, collecting subjective quality ratings of utility, consistency, usability, answer correctness and mental effort as well as objective completion time measures.
Note that, although Schuff et al. 2020 already conduct a human evaluation to investigate the relation between the different proxy scores and various human ratings for HotpotQA, their evaluation is limited to three models and the ground truth predictions on the public validation set only. In the following, we describe the conducted user study in more detail.
Experiment Design and Participants
We make use of a between-subject experiment design, i.e., each participant is exposed to model predictions from exactly one model. The participants are distributed to models such that each model receives ratings from five different participants.1212 12 We ensure that each participant only participates once across the whole experiment. We include two attention checks to filter out participants that do not read the question or the explanations.
For each model, we collect ratings from five crowdworkers who each rate a sample of 25 questions drawn from a pool of 100 questions.1313 13 To support our assumption that a pool of 100 questions is sufficiently representative, we simulate experiments with various question subsets. We find that correlations stabilize for as few as 20 questions and report details in Section B.4. For each participant, we present the individual sample of 25 questions in a randomized order to avoid potential carry-over effects between questions. We make use of this approach to (i) cover a large amount of questions to better reflect the dataset and at the same time (ii) restrict the user’s workload to evade fatigue effects.
We recruit a total of 75 crowdworkers from the US using Mechanical Turk. We require workers to have a 90% approval rate and an MTurk Master qualification and ensure that each worker participates no more than once in our experiments.
Collected Human Ratings
| Quality dimension | Description | |
| instance | Explanation utility | “The explanation helps me to decide if the answer is correct.” |
| Explanation consistency | “The explanation helps me to understand how the model came up with its answer” (similar to Nourani et al. 2019a and Schuff et al. 2020) | |
| Answer correctness | “The answer is correct” (similar to Bussone et al. 2015a, Camburu et al. 2018, Schuff et al. 2020, Kumar and Talukdar 2020, and Narang et al. 2020) | |
| Completion time | Time per instance (similar to Lim et al. 2009, Lage et al. 2019a, Cheng et al. 2019, and Schuff et al. 2020) | |
| system | Usability | UMUX system usability questionnaire (Finstad 2010; Finstad 2013). |
| Mental effort | Paas mental effort scale (Paas 1992) |
We collect the human ratings/scores listed in Table 3. We collect per-instance participant ratings of perceived explanation utility, explanation consistency and answer correctness. In addition, we track the completion time, the participants take to finish each question. Further, we collect per-system ratings within a post questionnaire at the end of the experiment where we ask participants to rate usability using the UMUX scale (Finstad 2010; Finstad 2013) and mental effort using the Paas scale (Paas 1992).
Results
We discuss our results and, in particular, the relation between the proxy scores and the collected human ratings in the context of the respective shortcomings in the evaluation of explanation quality in the following section. We provide the detailed averaged ratings over all 15 models in Section B.3 (Table 10). In order to ease readability,
we highlight the main results of our case study using grey boxes. Further details on the collected proxy scores over all 24 real and 5 synthetic models are provided in Table 9 in Appendix A. Details on the exact human ratings over all models included in our human evaluation are provided in Table 10 in Section B.2.
4 Shortcomings of Current Evaluations
Explanation evaluation in NLP is mainly performed automatically (Yang et al. 2018; DeYoung et al. 2020; Atanasova et al. 2020), borrowing proxy scores from other tasks, such as accuracy, F1, BLEU (Papineni et al. 2002) or BLEURT (Sellam et al. 2020). DeYoung et al. 2020, for example, propose to use automatic measures to evaluate explanation quality aspects, such as faithfulness, comprehensiveness and sufficiency. While they compute a variety of automatic scores that capture (a) how faithful a model’s predictions are (which they operationalize using comprehensiveness and sufficiency measures) and (b) how similar a model’s predictions are to human-annotated rationales, their evaluation does not include a human evaluation of the model explanations and leaves open how their proposed measures relate to user-perceived explanation characteristics. Other works evaluate explanation quality more indirectly, such as Pruthi et al. 2022, who evaluate saliency explanations via the accuracy gains they provide when training a student model on the produced explanations.
In the following, we present common evaluation practices and assess to which extent they conflict with the explanation quality characteristics presented in Section 2. Figure 1 provides an overview of the main challenges discussed in this paper.
4.1 Unvalidated Proxy Scores
The underlying assumption of using proxy scores for evaluating explanation quality is that an improvement in proxy scores implies an increase in user benefits. However, to the best of our knowledge, there is no established view to which extent those scores actually reflect the value of explanations to users (i.e., to which extent they are valid and measure what they should measure). This practice conflicts with both, the user-centered (Section 2.1) and the multidimensionality characteristic (Section 2.2) of explanation quality. In the following, we discuss different aspects of the relation between proxy scores and human ratings. Concretely, we investigate (i) the pairwise relation between proxy scores and human ratings, (ii) their overall relation in terms of their underlying factor structure and (iii) the dynamics of their relation over time.
4.1.1 Low Correlations Between Proxy Scores and Human Ratings
If the assumption that higher values on a specific proxy score correspond to higher user benefits holds true, this benefit should also reflect in one or multiple human subjective ratings or objective performance markers.
One of the few studies that study the strength of the link between proxy scores and human ratings is conducted by Kayser et al. 2021. They analyze the correlation between natural language generation (NLG) metrics (i.a., BLEU, BERT-Score and BLEURT) and human quality ratings to quantify free text explanations for three visual question answering datasets within a large crowdsourcing study. They find that (averaged over the three datasets), the highest Spearman correlation across 10 different proxy scores only reaches 0.29. Similarly, earlier work of Camburu et al. 2018 finds that BLEU does not reliably reflect human quality ratings of textual explanations for a natural language inference (NLI) task which is supported by the results of Schuff et al. 2021 who find that even high performance differences regarding proxy scores of explainable NLI models are not reflected in human ratings of explanation quality. Clinciu et al. 2021 study human ratings of explanation clarity and informativeness in the context of natural language explanations of Bayesian networks. Averaged over different scenarios, they find that, across 11 proxy scores, the highest Spearman correlation still only reaches 0.39 while the correlation between the two human ratings reaches a much higher value of 0.82.
Overall, to the best of our knowldege, all (of the few) available studies indicate that proxy scores and human ratings correlate weakly.
Case Study
We provide an additional analysis for explainable question answering and exceed previous studies in the diversity of human rating dimensions. Additionally, our results are evaluated using predictions of real leaderboard models instead of evaluating correlations on ground truth datasets (Camburu et al. 2018; Kayser et al. 2021; Clinciu et al. 2021) and thus cover a distribution of scores and ratings that better reflects the scores’ usage within leaderboards.
Figure 3 shows Kendall’s correlation coefficients between (a) the automatic scores included in the leaderboard and (b) the human ratings we collected in our study. A heat map visualization of all pairwise correlations including statistical significance markers and coefficients can be found in Figure 11 in Section B.3.
While we observe moderate correlations between, e.g., joint-F1 and explanation consistency, the majority of correlations is under 0.5 and thus the previously described weak relation between human ratings and proxy scores is supported by our case study.
4.1.2 Proxy Scores Conflate Different Dimensions
We argue that the currently used explanation quality proxy scores can, and often will, conflate different dimensions of explanation quality, and, consequently, information about the individual independent dimensions is lost and cannot be recovered. For example, given two systems with similar proxy scores, it cannot be determined which one was superior in terms of individual explanation quality aspects, such consistency or understandability. Therefore, it is not possible to identify an isolated improvement of a model in some of those aspects using the proxy score. For example, when we improve the proxy score, we cannot assess whether we actually improved all quality aspects or only a subset of them (and possibly decreased the performance on others). Similarly, a targeted improvement of particular quality aspects (e.g., for a particular use-case) is not possible.
| Score/rating | Type | F1 | F2 | F3 | F4 |
| answer-EM |
![[Uncaptioned image]](2210.07126v2/figures/desktop.png)
|
0.98 | |||
| answer-F1 |
|
0.97 | |||
| answer-recall |
|
0.97 | |||
| answer-precision |
|
0.97 | |||
| correctness rating |
![[Uncaptioned image]](2210.07126v2/figures/judge.png)
|
0.80 | |||
| sp-EM |
|
0.97 | |||
| sp-F1 |
|
0.89 | |||
| sp-precision |
|
0.83 | |||
| sp-recall |
|
0.82 | |||
| joint-EM |
|
0.58 | |||
| joint-F1 |
|
0.55 | |||
| consistency rating |
|
0.79 | |||
| usability rating |
|
0.74 | |||
| joint-recall |
|
0.64 | |||
| utility rating |
|
0.63 | |||
| LocA score |
|
0.56 | |||
| joint-precision |
|
0.53 | |||
| completion time |
|
(0.24) | |||
| #words |
|
0.95 | |||
| #facts |
|
0.95 |
, human ratings/scores are marked as . We observe that F3 contains all explanation-related human ratings as well as the three three proxy scores joint-recall, LocA and joint-precision. This suggests that these three scores are better-suited to capture perceived explanation quality compared to the currently used joint-F1 which loads onto factor F2.Case Study
In order to assess the degree to which proxy scores are related to multiple human ratings, we also analyze the ratings’ factor structure. While the correlations shown in Figure 3 demonstrates that the pairwise correlations are weak, they do not tell us how a score/rating is associated to the “big picture” in terms of the latent structures behind the scores and ratings. A factor analysis is used to describe each score/rating in terms of its association to empirically-derived latent factors. In order to determine the number of factors, we follow the method agreement procedure in which the optimal number of factors is chosen based on the largest concensus between numerous methods. We find four dimensions to be supported by the highest number of methods as—among a total of 14 methods—four methods agree on a number of four factors (i.e., beta, Optimal coordinates, Parallel analysis and Kaiser) which has a higher support than every other number of factors (ranging between 1 and 19). We therefore conduct a factor analysis using a varimax rotation that maps each score/rating to one of the four latent factors such that the resulting factors describe the data as good as possible. Table 4 displays the respective loadings (i.e., correlations of the score/rating with the latent factor).
Factor F1 contains all answer-related scores including human ratings of answer correctness. Factor F2 only contains the fact-related automatic scores as well as joint-F1 and joint-EM. Factor F3 contains all explanation-related human ratings. Interestingly, F3 also contains the automatic scores joint-recall, LocA and joint-precision. Factor F4 contains the explanation-length-related automatic scores #words and #facts.
We observe that the answer-related proxy scores and the human correctness ratings form a cluster and have strong loadings on their joint factor. This can be interpreted as evidence that perceived answer correctness can—to a moderately strong extent—be measured via the answer-related proxy scores.
If (one of) the evaluated proxy scores for explanation quality would have an equally strong association to any human rating, we would expect to observe a factor, that, e.g., contains joint-F1 and perceived utility along with strong factor loadings of both scores/ratings onto their joint factor.
However, Table 4 demonstrates that all of the different explanation-related human ratings can be found in one factor along with the proxy scores joint-recall, LocA and joint-precision. This shows that our explanation quality measurements cannot be grouped into distinguishable groups (as we observe for the answer-related scores and ratings). Instead, they form a hardly-interpretable diffuse factor 3 that mixes up all kinds of human ratings and yields much lower factor loadings and—in addition—does not contain the leaderboard ranking score joint-F1.
Overall, our factor analysis suggests that (a) the answer-related proxy scores reflect human answer correctness ratings, (b) no explanation-related proxy score can be associated to a particular human rating. In particular, joint-F1 does not share a joint factor with any human rating.
4.1.3 Goodhart’s Law: Validity Can Change Over Time
Even if we had a score that is valid, i.e., it measures one dimension of explanation quality in a decent way, using this score as the sole ranking criterion of a leaderboard can subvert its validity over time. This effect is described in Goodhart’s Law that is commonly stated as “when a measure becomes a target, it ceases to be a good measure” (Goodhart 1975; Campbell 1979; Strathern 1997; Manheim 2018; Manheim and Garrabrant 2018). Thomas and Uminsky 2022 discuss this in the context of AI and highlight the field’s problematic reliance on (single) metrics including the issue of metrics being gamed (Bevan and Hood 2006).
Assume that an initial investigation of some systems showed that a particular proxy score can be considered to be valid (in a certain use case for a certain user group). If now more and more systems are developed with the primary goal of reaching higher values on that score, the initial set of models no longer represent the new model population. As a result, it cannot be ensured that the original strong relation between the (initially valid) proxy score and the measured quality dimension still holds. Consequently, the score’s validity can “wear off” over time as it is used in isolation.
Case Study
We investigate whether we can find such a temporal deterioration in the HotpotQA leaderboard. For this, we study the association of the leaderboard’s target metric (i.e., joint-F1) with the measured human ratings across different time windows. Figure 4 shows Kendall’s correlation coefficients between joint-F1 and human ratings for a 12-month sliding window over system submissions. We observe that correlations decrease from moderate positive to lower and even negative correlations. We hypothesize that this decrease could have been mitigated using multiple proxy scores.
Overall, our observations indicate that Goodhart’s law affects today’s leaderboards and single target metrics loose their expressiveness over time.
4.2 Neglecting Users
So far, we argued why the currently used proxy scores of explanation quality do not reliably reflect user-perceived quality properties. But if we had proxy scores that were shown to successfully reflect various aspects of explanation quality, could we stop human evaluation and rely on these scores alone? We, just like (Thomas and Uminsky 2022), argue that we could not.
The predominant evaluation practice of relying on automatic scores is questioned in many contexts in NLP today, especially in NLG (Callison-Burch et al. 2006; Liu et al. 2016; Novikova et al. 2017; Sulem et al. 2018; Reiter 2018). In the context of explainability, the need for human-centered evaluation is stressed by, i.a., Ribera and Lapedriza 2019, Chu et al. 2020, Gonzalez et al. 2021, Colin et al. 2021, Schlegel et al. 2022 or Liao et al. 2022. We argue that human evaluation always has to be part of explanation quality evaluation. User studies yield insights beyond proxy scores as they can comprise (i) a broader set of quantifiable dimensions than proxy scores can offer as well as (ii) dimensions of explanation quality that are inaccessible using quantitative methods at all but require qualitative approaches, such as mental model analysis (Schrills and Franke 2020; Kulesza et al. 2013) or thematic analysis (Braun and Clarke 2006) in which themes are extracted from textual responses or transcriptions via various steps (coding, theme generation and review etc.).
We argue that searching for valuable systems based on proxy metrics alone can be regarded to be an instance of the Streetlight Effect, also know as the Drunkard’s Search Principle (Kaplan 1964; Iyengar 1993). This effect describes a situation in which a drunken man lost his keys in a park, but instead of searching for them in the place where he lost them, he is searching under a streetlight because this is where the light is. We argue that we face a similar situation when we exclusively rely on proxy metrics as shown in Figure 5. Instead of focusing on what we ultimately are interested in, i.e., providing good explanations to users, we narrow our focus onto increasing proxy scores instead. To shed light on a broader spectrum of explanation quality, our quantitative measures should include both, validated proxy scores and human ratings/signals.
Case Study
Our results reported in Section 4.1 already show that human ratings exceed the information we are able to get from our investigated proxy scores. In addition, there also is information that we cannot obtain using human ratings alone. To illustrate this, we collect voluntary free text feedback from our participants:
- •
“I see why the model thought it, but it doesn’t provide any useful info in reality”.
This comment shows that users have the impression that a model “thinks”, hinting at anthropomorphisation. Concretely, this suggests to consider the inclusion of an anthropomormphism questionnaire in subsequent user studies. - •
“The question asks about two players but there is only a correct answer for one player and only one explanation”.
This comment confirms that one type of model error is to provide answers that do not semantically match the question. Consequently, developing a new proxy score to quantify the semantic overlap between the predicted answer and the question could help to guide model development. - •
“It doesn’t really state how it came up with this answer, as it only told about other fights. My default answer is incorrect, until the system proves it to be true.”
This comment informs us about the user’s rating behavior and suggests that a re-wording of the question could allow us to capture the range of perceived correctness in a better way.
Overall, the collected comments illustrate that qualitative evaluation can yield insights beyond quantitative participant ratings which in turn can help to improve proxy scores and human rating evaluation.
4.3 Single-score Leaderboards
The current practice in NLP leaderboards (and many NLP research work in general) is the scoring and comparing of systems using a single score such as accuracy, BLEU or F1. In Section 2.2, we already motivated that explanation quality has multiple independent dimensions. Therefore, it should be measured with multiple scores. Moreover, aggregating those scores (e.g., via averaging) to obtain a single measure will not be expedient either since the dimensions might be independently useful and/or scaled differently.
Ranking systems using a single score can also lead to over-optimization of this one score (Thomas and Uminsky 2022) and can lead to the deterioration of score validity as we argued and demonstrated in Section 4.1.3. This could be prevented by using a diverse set of scores instead of only one score.
| ranking criterion | |||||
|---|---|---|---|---|---|
| joint-F1 | LocA | averaged proxy scores | factor-weighted proxy scores | human usability ratings | |
| 1 | gold (1.00) | gold (1.00) | gold (1.00) | gold (1.73) | FE2H on ALBERT (0.98) |
| 2 | FE2H on ALBERT (0.77) | gold-answers-all-facts (1.00) | FE2H on ALBERT (0.78) | FE2H on ALBERT (1.47) | HGN (0.90) |
| 3 | AMGN (0.74) | FE2H on ALBERT (0.98) | AMGN (0.76) | AMGN (1.43) | S2G-large (0.88) |
| 4 | Longformer (0.73) | HGN (0.97) | HGN (0.74) | HGN (1.4) | Longformer (0.87) |
| 5 | S2G-large (0.72) | AMGN (0.95) | Longformer (0.74) | Text-CAN (1.31) | SAE (0.87) |
| 6 | HGN (0.71) | Text-CAN (0.92) | Text-CAN (0.70) | Longformer (1.28) | Text-CAN (0.87) |
| 7 | Text-CAN (0.66) | GRN (0.89) | S2G-large (0.69) | SAE (1.25) | AMGN (0.87) |
| 8 | SAE (0.63) | SAE (0.86) | SAE (0.67) | gold-answers-all-facts (1.23) | gold-answers-all-facts (0.86) |
| 9 | IRC (0.59) | IRC (0.77) | GRN (0.64) | GRN (1.21) | gold (0.83) |
| 10 | GRN (0.58) | Longformer (0.72) | IRC (0.62) | IRC (1.17) | IRC (0.83) |
| 11 | gold-answers-all-facts (0.12) | random-answers-gold-facts (0.12) | gold-answers-all-facts (0.53) | S2G-large (0.94) | GRN (0.68) |
| 12 | random-answers-all-facts (0.02) | S2G-large (0.12) | random-answers-gold-facts (0.3) | random-answers-gold-facts (0.09) | random-answers-random-facts (0.23) |
| 13 | gold-answers-random-facts (0.00) | random-answers-random-facts (0.11) | gold-answers-random-facts (0.29) | random-answers-random-facts (0.06) | random-answers-gold-facts (0.21) |
| 14 | random-answers-random-facts (0.00) | gold-answers-random-facts (0.03) | random-answers-random-facts (0.01) | gold-answers-random-facts (0.02) | gold-answers-random-facts (0.16) |
Case Study
We construct various leaderboards from the HotpotQA systems and evaluate how sensitive model rankings are with respect to the ranking criterion. Table 5 displays the respective model rankings of four criteria.
We observe that different scores and weighting schemes lead to contradicting model rankings. For example, S2G-large (marked with a box in Table 5) is rated the fourth-best real model according to joint-F1 and the third-best regarding usability ratings but rated the worst real model according to LocA. While all real models except FE2H on ALBERT differ with respect to their relative rankings, FE2H on ALBERT is ranked as the best real model across all criteria including human usability ratings, indicating that this model offers substantial benefits over the other models.
Further, rankings regarding human ratings and proxy metrics disagree heavily as we can see for the gold predictions that consistently are ranked top following the proxy score leaderboards, but are ranked eighth following human usability ratings. Interestingly, the gold answers along with all facts are ranked as more usable then the gold facts with only the relevant facts.
Overall, our results signal a disagreement between the user needs assumed within the HotpotQA dataset and the actual user needs within our participant sample.
5 Guidelines
This section proposes guidelines to address the shortcomings described in Section 4.
5.1 Validate Proxy Scores Against Humans
While there is a lot of work on investigating the relation between automatic scores and human ratings in natural language generation (Belz and Reiter 2006; Novikova et al. 2017; Dušek et al. 2019), only few studies consider this aspect in the context of explanation evaluation (Jannach and Bauer 2020; Schuff et al. 2020; Schuff et al. 2021; Kayser et al. 2021; Clinciu et al. 2021). To address the problem of unvalidated proxy scores for explanation quality evaluation (Section 4.1), we advise to consistently validate the relation between proxy scores and human signals, such as human-AI performance, subjective ratings, completion times or physiological measures like eye tracking. One straight-forward approach to quantify these relations is a correlation analysis.
Advantages
Given proxy scores that yield sufficiently strong correlations to human ratings/signals, those scores can be used to develop systems that are actually useful for users.
Limitations
Given a new task or leaderboard, it is unlikely that we have access to a representable pool of models which can be used to validate the metrics. Therefore, we have to accept a certain grace period in which we can only assume that the chosen evaluation scores lead to reasonable results. Once there is a handful of models available, the proxy metrics should then be validated against human scores and revised if necessary.
Referring to our discussion of Goodhart’s law in Section 4.3, any proxy metric has to be periodically re-tested for its validity.1414 14 The need for re-testing can be recognized by, e.g., monitoring demographic changes in the target population and/or changes in the correlations within user ratings.
Finally, each validity evaluation is limited to a group of explainees (see Section 2.1). Different groups of users will have different needs and, as a result, explanation quality evaluation will need different measures. For example, validity findings for a population of high-school students might not transfer to NLP researchers.
5.2 Do Human Evaluation
In Section 5.1, we already recommend user studies for the purpose of proxy score validation. Based on our discussion in Section 4.2, we also propose to do as much human evaluation as possible in order to gain additional explanation quality indicators from human rating scores directly. In the context of application-oriented model development, human evaluation can be conducted as the final evaluation step after model tuning. In the context of leaderboards, we propose to regularly conduct human assessments of (a subset) of system submissions.
Measures of Human Behavior and Perceived Quality
When choosing what to measure within a user study, we suggest to collect objective measures of user behavior as well as subjective ratings. Table 6 lists a selection of possible measures of (a) objective measures of human behavior (top) and (b) subjective human ratings (bottom) along with exemplary publications including the respective scores/ratings.1515 15 We refer to Chromik and Schuessler 2020 as well as Nauta et al. 2022 for a review of (quantitative) human evaluation methods conducted in explainability research.
| Measure | Description | References | |
| objective scores | Time | Time measures of, e.g., task completion or interaction with the system | Lim et al. 2009, Lage et al. 2019a, Cheng et al. 2019, Schuff et al. 2020 |
| Human performance | Task performance of users (e.g., accuracy in an AI-supported decision task) | Feng and Boyd-Graber 2019, Schuff et al. 2020, Lage et al. 2019b, Bansal et al. 2021 | |
| Simulatability | Measures related to how well explanations enable users to predict system performance (given an explanation when making predictions on new instances) | Hase and Bansal 2020, Wang and Yin 2021 | |
| Teachability | Measures related to how well explanations enable users to predict system performance (without having access to explanations when making predictions on new instances) | Goyal et al. 2019, Wang and Vasconcelos 2020 | |
| Agreement | Frequency of how often a user accepts a system decision | Zhang et al. 2020, Bansal et al. 2021 | |
| Number of user interactions | Number of times a user, e.g., runs a model to predict an output | Pezeshkpour et al. 2022 | |
| subjective ratings | Perceived performance | Subjective estimate of system performance | Nourani et al. 2019b, Schuff et al. 2020 |
| Over- / underestimation | Difference between perceived system performance and actual system performance | Nourani et al. 2019a, Schuff et al. 2020 | |
| Trust | Trust in the model’s abilities/correctness | Bussone et al. 2015b, Schuff et al. 2020, Ribes et al. 2021, Buçinca et al. 2021 | |
| Perceived usefulness | User-reported system usefulness | Khurana et al. 2021, Bansal et al. 2021 | |
| Subjective understanding | Self-reported degree of system understanding | Ehsan et al. 2019, Wang and Yin 2021, Ribes et al. 2021 | |
| Grammaticality | Ratings or grammatical correctness | Schuff et al. 2021, Liu et al. 2022 | |
| Perceived factuality | Ratings of factual correctness | Schuff et al. 2021, Liu et al. 2022 | |
| Mental demand | Self-reports of mental demand in processing the explanation | Buçinca et al. 2021 |
Objective measures include, e.g., response time, human task performance, human-AI agreement, but also more complex scores, e.g., Utility- (Colin et al. 2021).
Subjective ratings include, e.g., perceived accuracy, trust, perceived usefulness (Liu et al. 2022), or mental demand (Buçinca et al. 2021). As noted by Buçinca et al. 2020, subjective ratings should complement objective measures of user performance as the latter cannot necessarily be inferred from the former (Buçinca et al. 2020).
Following Jannach and Bauer 2020 and Thomas and Uminsky 2022, we further advocate to also collect qualitative feedback (e.g., participant comments within a user study or a focus group) to complement quantitative measures. We demonstrate how qualitative feedback can yield insights beyond quantitative evaluation within our case study in Section 4.2.
The study conducted by Cheng et al. 2019 is a good example of how objective measures can be combined with both qualitative as well as quantitative human evaluation. Additional examples of such mixed-methods evaluations can be found in the work of Bansal et al. 2021 in the context of complementary human-AI team performance and Sivaraman et al. 2023 in the context of clinical AI acceptance. Note, however, that collecting qualitative feedback via, e.g., the think-aloud method, can impact users’ mental effort allocation and potentially impact participant behavior (Buçinca et al. 2020) and, consequently, studies should be designed carefully.
Advantages
Human evaluation allow us to re-adjust the direction into which we develop systems by unveiling explanation quality dimensions that were previously hidden. For example, qualitative findings from user comments can help us to identify system qualities we did not think of before. Moreover, human evaluations can reward the development of systems that follow an unconventional approach and, as a result, whose explanation qualities might be undetectable using proxy scores. This can motivate researchers to develop original models and can ultimately diversify and accelerate research.
Limitations
Each human evaluation is bound to noise w.r.t. the pool of participants and the way they approach the study (for example whether they carefully read the questions). However, in contrast to annotation (on an instance level), noisy human responses do not have to limit human evaluation (on a system level) using adequate statistical tools.
Further, potentially high costs to compensate the participants and longer preparation times to recruit participants and conduct and carefully evaluate the studies might hinder the conduction of a user study.
Additionally, proxy task evaluations (i.e., evaluations that are conducted on simplified human-AI tasks) do not necessarily lead to the same findings that real human-AI tasks yield and, in fact, can even contradict the latter (Buçinca et al. 2020).
Finally, user study interfaces have to be designed carefully as presumably minor design choices can heavily affect participant behavior. For example, Sullivan Jr. et al. 2022 find participants’ rational explanation selections (i.e., marking relevant words in the text input) was greatly impacted by whether participants could mark multiple words at once or not. Introductory texts on designing and conducting user studies in NLP can be found in, e.g., Belz et al. 2020 (NLG), Iskender et al. 2021 (text summarization), Sedoc et al. 2019 (chat bots), or Schuff et al. 2023 (general NLP).
Case Study
We discuss the experiment design of our case study along with a description of collected ratings in Section 3.2. A detailed discussion of our results can be found in the “case study” paragraphs across Section 4.
Overall, our human evaluation allowed us to identify low correlations between human ratings and proxy scores, detect that correlations decreased over three years of system submissions, qualitative user feedback helps to spot shortcomings of proxy scores and human rating evaluation, and systems ranks based on proxy scores conflict with system ranks based on human ratings.
5.3 Report Various Scores Without Averaging
As we argued in Section 4.3, using a single score for evaluation (regardless of proxy scores or human ratings/signals) can be misleading. Therefore, we propose to use various scores rather than weighting quality dimensions against each other to get a single score. This is in line with the recommendations by Thomas and Uminsky 2022. While prior work proposed alternative leaderboards using on-demand (crowdsourcing) evaluation (Chaganty et al. 2017) and personalized utility rankings (Ethayarajh and Jurafsky 2020), we are—to the best of our knowledge—the first to provide a leaderboard that does not condense multiple scores into a single one.
Pareto Front Leaderboards
To compare systems based on multiple scores, e.g., on a leaderboard, we propose to leverage the concept of Pareto efficiency. In the context of multidimensional leaderboards, a system is called Pareto efficient if the only way to select another system that is better regarding any score dimension is to worsen another score dimension. For example, system A is Pareto efficient if the only way to select another system to increase, e.g., the F1 score, is to choose a system that has a lower, e.g., accuracy. Given a set of systems, multiple systems can simultaneously be Pareto efficient. Figure 6 shows a fictional example with nine systems (visualized by points) and two higher-is-better quality scores and (visualized by axes). All five systems on the so-called Pareto front (front 1) are Pareto efficient and thus have rank 1. To rank the remaining systems, we remove those five systems, calculate the next Pareto front (front 2), and repeat this until all systems are ranked. The resulting leaderboard of the example shown in Figure 6 would consequently have five models on the first place (i.e., front), two models on the second and two models on the third.
Related Applications of Pareto Efficiency
We are not the first to leverage Pareto efficiency within NLP. Pimentel et al. 2020 use Pareto efficiency to propose a new probing approach that trades-off probe accuracy and complexity. In contrast to their work, we use Pareto efficiency to construct leaderboards. Similar to our approach, Liu et al. 2022 argue that, in the context of efficient NLP models, models should be judged in terms of how far they overstep the performance-efficiency Pareto front. In contrast to their work, we do not only consider the (first) Pareto front, but extend the concept of Pareto-efficiency to multiple fronts which form the ranks of our proposed leaderboard.
Advantages
Using multiple scores for evaluation offers the advantage of capturing diverse aspects of a system. If a sufficiently diverse set of scores is used, the over-optimization of one score can be prevented since other scores would likely be decreased at the same time. This is supported by surrogation effects (Choi et al. 2012; Choi et al. 2013) where, in the context of manager compensation, Choi et al. 2012 find that manager decisions can be improved when “managers are compensated on multiple measures of a strategic construct” instead of on a single one. We hypothesize that this observation also holds for AI practitioners that need to choose a system, e.g., from a leaderboard.
When using Pareto front leaderboards, we can rank systems without weighting the different quality dimensions against each other. In particular, the concept of Pareto efficiency allows us to choose systems that are not worse than others on all fronts. Note that Pareto fronts are robust to score re-scaling and are applicable to ordinal (e.g., Likert) ratings.
Limitations
With multiple scores, it can be hard to determine a “winning” system because different models might rank best on different scores. Pareto Front Leaderboards can mitigate this problem, however, they may result in a set of winning systems instead of a single winning system. We argue that this is not a real limitation though since the concept of Pareto efficiency ensures that a system on one front is not worse than other systems on the same front.
In the extreme case when the number of scores is high in comparison to the number of systems that should be scored, the resulting leaderboard can collapse to a single front because the fronts’ surface grows exponentially with the number of scores. We therefore recommend to ensure that the number of variables should only be increased along with a sufficient increase in the number of systems.
Further, Pareto Front leaderboards can be “attacked” by optimizing a single metric with the purpose of positioning a new system inside the first front. Although this allows the leaderboards to be gamed to a certain extent, a truly remarkable improvement is one that creates a new front which is, in turn, robust to the improvement of single metrics.
| Rank | Models (original HotpotQA ranks in parantheses) |
|---|---|
| 1 | gold (*), random-answers-gold-facts (*), FE2H on ALBERT (3), Longformer (25), S2G-large (31), HGN (35), Text-CAN (47), IRC (63) |
| 2 | AMGN (16), SAE (48), GRN (65), DecompRC (unranked), random-answers-random-facts (*), gold-answers-all-facts (*) |
| 3 | gold-answers-random-facts (*) |
| Rank | Models (original HotpotQA ranks in parantheses) |
|---|---|
| 1 | gold (*) |
| 2 | gold-answers-all-facts (*), rand.-answers-gold-facts (*), FE2H on ALBERT (3), AMGN (16) |
| 3 | Longformer (25), HGN (35), IRC (63), gold-answers-random-facts (*) |
| 4 | S2G-large (31), Text-CAN (47) |
| 5 | SAE (48), GRN (65) |
| 6 | DecompRC (unranked) |
| 7 | random-answers-random-facts (*) |
Case Study
We evaluate the 15 models described in Section 3.1 on numerous (i) human ratings and (ii) automatic scores. Then, we construct two Pareto front leaderboards, one for human ratings and one for automatic scores.
Table 7 shows the Pareto front leaderboard based on human ratings (usability, mental effort, utility, correctness, consistency and completion time). We observe that high-performing models, such as FE2H on ALBERT (official leaderboard rank 3) are located within the rank 1 Pareto front en-par with the gold prediction system. Interestingly, previously lower-ranked models, such as IRC (leaderboard rank 63) are also located in the first Pareto front which means that they also possess a combination of strengths that dominates the models in the other ranks.
Table 8 shows the leaderboard based on automatic proxy scores. The gold prediction system is the single winner in this leaderboard, followed by the two real models FE2H on ALBERT and AMGN. While the first models are ordered consistently with the HotpotQA leaderboard, the Pareto front leaderboards disagrees w.r.t. ranks for others, e.g., the IRC model (leaderboard rank 63), Longformer (leaderboard rank 25) or S2G-large (leaderboard rank 31). For the synthetic systems, we observe differences across the two Pareto front leaderboards. For example, the gold-answers-random-facts system is ranked last w.r.t. human ratings but ranked third w.r.t. automatic scores.
Our results highlight, again, that proxy metrics do not reflect the quality dimensions probed in the human ratings sufficiently well. We provide details on the exact proxy scores and model ratings in Appendix A and Section B.2.
6 Conclusion
This paper aims at increasing the awareness of the shortcomings and open challenges that today’s explanation quality evaluation practices face. We discuss general characteristics of explanation quality, describe current practices and point out to which extent they violate the discussed characteristics. We support our arguments with empirical evidence of a crowdsourced case study that we conducted for the example of explainable question answering systems from the HotpotQA leaderboard.
Concretely, we demonstrate that (i) proxy scores poorly reflect human explanation quality ratings, (ii) proxy scores can loose their expressiveness over time, (iii) human evaluation yields quantitative as well as qualitative insight beyond automatic evaluation, and (iv) single-score leaderboards fail to reflect the spectrum of explanation quality dimensions.
We propose (a) guidelines for a more effective and human-centered evaluation as well as (b) an alternative type of leaderboard that constructs ranks from multiple dimensions without averaging scores. We aim to inform and inspire future work and ultimately drive the field towards reliable and meaningful explanation quality evaluation.
Acknowledgments
We are grateful to Annemarie Friedrich for valuable feedback and helpful discussions. We also thank all HotpotQA system submittors that allowed us to include their systems in our analysis.
Appendix A Detailed Proxy Scores
We provide values of all analyzed proxy scores for all analyzed 10 leaderboard systems as well as our five synthetic systems in Table 9.
| joint_f1 | f1 | sp_f1 | _loca_score | num_words | num_facts | num_excess_facts | |
|---|---|---|---|---|---|---|---|
| gold | 0.9999 | 0.9999 | 1.0000 | 0.9980 | 58.4296 | 2.4305 | 0.0000 |
| fe2h_albert | 0.7654 | 0.8444 | 0.8914 | 0.9823 | 56.0451 | 2.3020 | -0.1286 |
| amgn_plus | 0.7525 | 0.8338 | 0.8883 | 0.9596 | 56.4771 | 2.3291 | -0.1014 |
| fe2h_electra | 0.7491 | 0.8269 | 0.8872 | 0.9860 | 55.7048 | 2.2872 | -0.1433 |
| s2g_plus | 0.7436 | 0.8217 | 0.8873 | 0.1261 | 55.5947 | 2.2758 | -0.1548 |
| hgn_large | 0.7422 | 0.8220 | 0.8848 | 0.9719 | 55.9020 | 2.3045 | -0.1260 |
| amgn | 0.7420 | 0.8280 | 0.8812 | 0.9547 | 54.0543 | 2.2154 | -0.2151 |
| git | 0.7387 | 0.8201 | 0.8819 | 0.9691 | 56.7310 | 2.3357 | -0.0948 |
| ffreader_large | 0.7379 | 0.8216 | 0.8843 | 0.9203 | 56.3926 | 2.3213 | -0.1070 |
| longformer | 0.7317 | 0.8126 | 0.8834 | 0.7154 | 56.4994 | 2.3255 | -0.1051 |
| hgn_roberta_large | 0.7258 | 0.8062 | 0.8761 | 0.9829 | 57.2278 | 2.3661 | -0.0644 |
| text_can_large | 0.7253 | 0.8080 | 0.8696 | 0.9519 | 56.1457 | 2.3049 | -0.1256 |
| s2g_large | 0.7226 | 0.8024 | 0.8761 | 0.1194 | 55.8983 | 2.3055 | -0.1251 |
| sae_large | 0.7145 | 0.7963 | 0.8687 | 0.9583 | 56.2038 | 2.3067 | -0.1238 |
| hgn | 0.7104 | 0.7937 | 0.8733 | 0.9682 | 57.3562 | 2.3606 | -0.0700 |
| s2g_base | 0.6952 | 0.7703 | 0.8720 | 0.1233 | 56.4389 | 2.3271 | -0.1034 |
| text_can | 0.6596 | 0.7399 | 0.8576 | 0.9212 | 56.6486 | 2.3294 | -0.1011 |
| sae | 0.6292 | 0.7277 | 0.8282 | 0.8645 | 57.4972 | 2.3773 | -0.0532 |
| grn_update | 0.6173 | 0.7023 | 0.8420 | 0.8493 | 52.1172 | 2.1249 | -0.2971 |
| mkgn | 0.6169 | 0.7069 | 0.8354 | 0.7238 | 54.2208 | 2.2308 | -0.1997 |
| qfe | 0.5962 | 0.6806 | 0.8450 | 0.8708 | 54.6789 | 2.2408 | -0.1777 |
| irc | 0.5922 | 0.7253 | 0.7936 | 0.7686 | 70.3375 | 2.9413 | 0.5107 |
| grn | 0.5848 | 0.6672 | 0.8411 | 0.8886 | 57.3488 | 2.3715 | -0.0470 |
| kgnn | 0.5282 | 0.6575 | 0.7680 | 0.8608 | 55.6323 | 2.3449 | -0.0856 |
| decomprecomb | 0.4517 | 0.6977 | 0.5938 | 0.1250 | 33.3648 | 1.3646 | -1.0659 |
| gold_answers_all_facts | 0.1179 | 0.9999 | 0.1180 | 0.9980 | 923.9561 | 41.2556 | 38.8251 |
| random_answers_gold_facts | 0.0193 | 0.0193 | 1.0000 | 0.1205 | 58.4296 | 2.4305 | 0.0000 |
| random_answers_random_facts | 0.0000 | 0.0189 | 0.0000 | 0.1070 | 55.9535 | 2.4255 | -0.0050 |
| gold_answers_random_facts | 0.0000 | 0.9999 | 0.0000 | 0.0322 | 55.8294 | 2.4255 | -0.0050 |
Appendix B User Study Details
We show screenshots of our study interface in Section B.1 and report human ratings along all measured rating dimensions in Section B.2.
B.1 User Study Interface
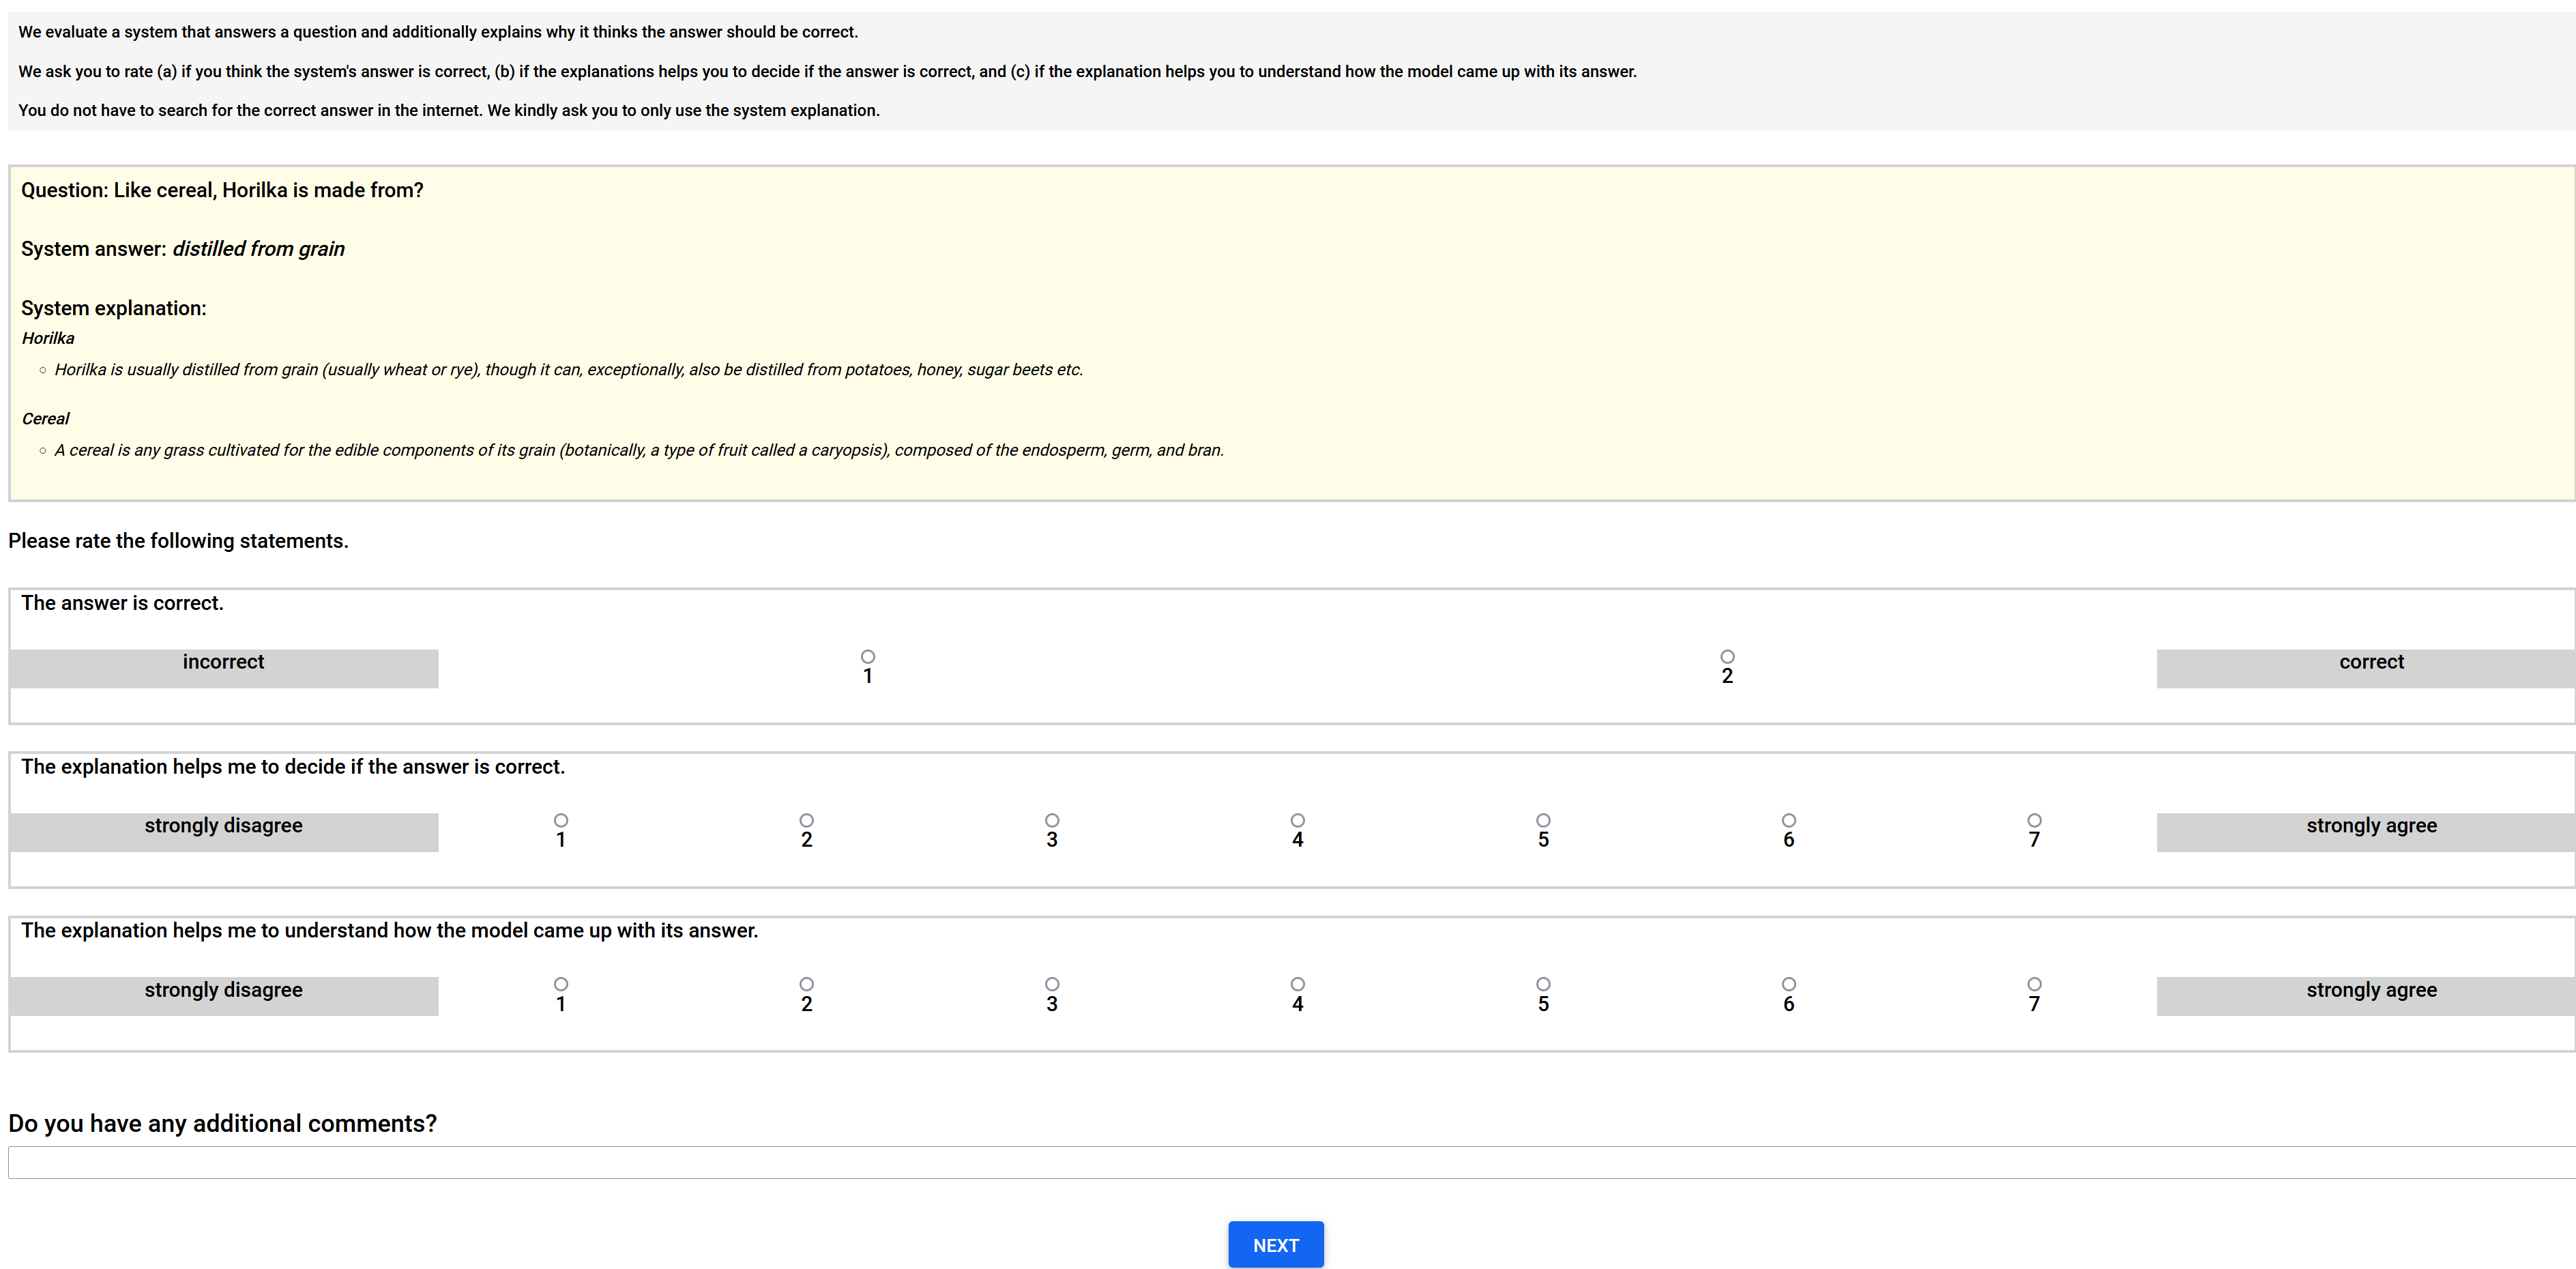
We provide screenshots of the user study interface that we showed to participants. Figure 7 displays the rating interface we showed for each question. Figure 8 displays the post hoc questionnaire we asked participants to fill out at the end of the study (per system, once per participant).

B.2 Detailed Human Ratings
Table 10 displays the human ratings and completion times we obtained within the user study for the 10 leaderboard systems as well as our five synthetic systems.
B.3 Proxy Scores and Human Ratings
Figure 11 displays the Kendall’s correlations between proxy scores and human ratings. We additionally provide Bonferroni-corrected significance levels.
We further evaluate (i) grouped weighted inter-annotator agreements (IAAs) Cohen 1968 as an appropriate IAA measure for ordinal responses and (ii) standard deviations to provide an additional perspective on the ratings’ variances. We observe / SD for correctness, / SD for utility and / SD for consistency. These IAAs and standard deviations signal a low agreement / high variability which is commonly interpreted to correspond to low-quality annotations.1616 16 We note that this interpretation can be challenged and low IAAs are not necessary to collect highly reliable data (Beigman Klebanov and Beigman 2009). However, we want to emphasize that the purpose of our study is not (and should not be) to collect clean annotations of specific explanation instances but instead to capture the relation between automatic scores and intentionally and potentially noisy subjective human ratings as these are the exact ratings that constitute human assessment of explanation quality.
| Usability (UMUX) | Consistency | Utility | Answer Correctness | Mental Effort | Completion Time (seconds) | |
|---|---|---|---|---|---|---|
| AMGN | 86.7 | 5.8 | 5.6 | 0.9 | 5.8 | 80.2 |
| DecompRC | 78.3 | 5.0 | 4.8 | 0.9 | 5.8 | 43.2 |
| FE2H on ALBERT | 97.5 | 6.3 | 6.2 | 1.9 | 4.0 | 81.8 |
| gold | 83.3 | 6.1 | 6.2 | 2.0 | 5.6 | 41.4 |
| gold-answers-all-facts | 85.8 | 5.0 | 5.6 | 1.8 | 5.8 | 75.4 |
| gold-answers-random-facts | 15.8 | 2.3 | 2.4 | 1.7 | 7.8 | 43.8 |
| GRN | 68.3 | 5.4 | 5.8 | 1.7 | 4.8 | 75.1 |
| HGN | 90.0 | 6.3 | 6.3 | 1.9 | 4.2 | 64.4 |
| IRC | 83.3 | 6.0 | 6.3 | 1.8 | 5.8 | 118.0 |
| Longformer | 86.7 | 5.9 | 6.3 | 1.9 | 5.0 | 42.0 |
| random-answers-gold-facts | 20.8 | 2.1 | 5.4 | 1.0 | 4.6 | 44.4 |
| random-answers-random-facts | 23.3 | 2.4 | 2.9 | 1.0 | 5.2 | 48.7 |
| S2G-large | 88.3 | 6.1 | 6.1 | 1.8 | 4.0 | 50.9 |
| SAE | 86.7 | 5.9 | 6.3 | 1.8 | 4.2 | 86.6 |
| Text-CAN | 86.7 | 6.0 | 6.3 | 1.9 | 4.6 | 94.2 |

B.4 Question Pool Size Simulations.
In order to support our assumption that our pool of 100 questions is sufficiently representative, we simulate experiments with various question subsets. Figure 10 shows that correlations already stabilize for 20 questions and that there are no qualitative or quantitative differences to using 100 (all differences<=0.04).

References
- Angwin et al. (2016) Angwin, J., J. Larson, S. Mattu, and L. Kirchner. 2016. Machine bias, Ethics of Data and Analytics, 254–264. Auerbach Publications.
- Atanasova et al. (2020) Atanasova, P., J.G. Simonsen, C. Lioma, and I. Augenstein 2020, November. A diagnostic study of explainability techniques for text classification. In Proceedings of the 2020 Conference on Empirical Methods in Natural Language Processing (EMNLP), Online, pp. 3256–3274. Association for Computational Linguistics.
- Bansal et al. (2021) Bansal, G., T. Wu, J. Zhou, R. Fok, B. Nushi, E. Kamar, M.T. Ribeiro, and D.S. Weld 2021. Does the Whole Exceed its Parts? The Effect of AI Explanations on Complementary Team Performance. In Y. Kitamura, A. Quigley, K. Isbister, T. Igarashi, P. Bjørn, and S. M. Drucker (Eds.), CHI ’21: CHI Conference on Human Factors in Computing Systems, Virtual Event / Yokohama, Japan, May 8-13, 2021, pp. 81:1–81:16. ACM.
- Beigman Klebanov and Beigman (2009) Beigman Klebanov, B. and E. Beigman. 2009, December. Squibs: From annotator agreement to noise models. Computational Linguistics 35(4): 495–503. 10.1162/coli.2009.35.4.35402 .
- Belz et al. (2020) Belz, A., S. Mille, and D.M. Howcroft 2020, December. Disentangling the properties of human evaluation methods: A classification system to support comparability, meta-evaluation and reproducibility testing. In Proceedings of the 13th International Conference on Natural Language Generation, Dublin, Ireland, pp. 183–194. Association for Computational Linguistics.
- Belz and Reiter (2006) Belz, A. and E. Reiter 2006, April. Comparing automatic and human evaluation of NLG systems. In 11th Conference of the European Chapter of the Association for Computational Linguistics, Trento, Italy, pp. 313–320. Association for Computational Linguistics.
- Bevan and Hood (2006) Bevan, G. and C. Hood. 2006, August. What’s measured is what matters: Targets and gaming in the English public health care system. Public Administration 84(3): 517–538. 10.1111/j.1467-9299.2006.00600.x .
- Braun and Clarke (2006) Braun, V. and V. Clarke. 2006. Using thematic analysis in psychology. Qualitative research in psychology 3(2): 77–101 .
- Buçinca et al. (2020) Buçinca, Z., P. Lin, K.Z. Gajos, and E.L. Glassman 2020. Proxy tasks and subjective measures can be misleading in evaluating explainable AI systems. In F. Paternò, N. Oliver, C. Conati, L. D. Spano, and N. Tintarev (Eds.), IUI ’20: 25th International Conference on Intelligent User Interfaces, Cagliari, Italy, March 17-20, 2020, pp. 454–464. ACM.
- Buçinca et al. (2021) Buçinca, Z., M.B. Malaya, and K.Z. Gajos. 2021. To trust or to think: Cognitive forcing functions can reduce overreliance on AI in ai-assisted decision-making. Proc. ACM Hum. Comput. Interact. 5(CSCW1): 188:1–188:21. 10.1145/3449287 .
- Bussone et al. (2015a) Bussone, A., S. Stumpf, and D. O’Sullivan 2015a. The role of explanations on trust and reliance in clinical decision support systems. In P. Balakrishnan, J. Srivatsava, W. Fu, S. M. Harabagiu, and F. Wang (Eds.), 2015 International Conference on Healthcare Informatics, ICHI 2015, Dallas, TX, USA, October 21-23, 2015, pp. 160–169. IEEE Computer Society.
- Bussone et al. (2015b) Bussone, A., S. Stumpf, and D. O’Sullivan 2015b. The role of explanations on trust and reliance in clinical decision support systems. In P. Balakrishnan, J. Srivatsava, W. Fu, S. M. Harabagiu, and F. Wang (Eds.), 2015 International Conference on Healthcare Informatics, Dallas, TX, USA, pp. 160–169. IEEE Computer Society.
- Callison-Burch et al. (2006) Callison-Burch, C., M. Osborne, and P. Koehn 2006, April. Re-evaluating the role of Bleu in machine translation research. In 11th Conference of the European Chapter of the Association for Computational Linguistics, Trento, Italy, pp. 249–256. Association for Computational Linguistics.
- Camburu et al. (2018) Camburu, O., T. Rocktäschel, T. Lukasiewicz, and P. Blunsom 2018. e-snli: Natural language inference with natural language explanations. In S. Bengio, H. M. Wallach, H. Larochelle, K. Grauman, N. Cesa-Bianchi, and R. Garnett (Eds.), Advances in Neural Information Processing Systems 31: Annual Conference on Neural Information Processing Systems 2018, NeurIPS 2018, December 3-8, 2018, Montréal, Canada, pp. 9560–9572.
- Campbell (1979) Campbell, D.T. 1979. Assessing the impact of planned social change. Evaluation and program planning 2(1): 67–90 .
- Chaganty et al. (2017) Chaganty, A., A. Paranjape, P. Liang, and C.D. Manning 2017, September. Importance sampling for unbiased on-demand evaluation of knowledge base population. In Proceedings of the 2017 Conference on Empirical Methods in Natural Language Processing, Copenhagen, Denmark, pp. 1038–1048. Association for Computational Linguistics.
- Cheng et al. (2019) Cheng, H.F., R. Wang, Z. Zhang, F. O’Connell, T. Gray, F.M. Harper, and H. Zhu 2019. Explaining decision-making algorithms through UI: strategies to help non-expert stakeholders. In S. A. Brewster, G. Fitzpatrick, A. L. Cox, and V. Kostakos (Eds.), Proceedings of the 2019 CHI Conference on Human Factors in Computing Systems, CHI 2019, Glasgow, Scotland, UK, May 04-09, 2019, pp. 559. ACM.
- Choi et al. (2012) Choi, J.W., G.W. Hecht, and W.B. Tayler. 2012, July. Lost in translation: The effects of incentive compensation on strategy surrogation. The Accounting Review 87(4): 1135–1163. 10.2308/accr-10273 .
- Choi et al. (2013) Choi, J.W., G.W. Hecht, and W.B. Tayler. 2013. Strategy selection, surrogation, and strategic performance measurement systems. Journal of Accounting Research 51(1): 105–133. https://doi.org/10.1111/j.1475-679X.2012.00465.x .
- Chromik and Schuessler (2020) Chromik, M. and M. Schuessler 2020. A taxonomy for human subject evaluation of black-box explanations in XAI. In A. Smith-Renner, S. Kleanthous, B. Y. Lim, T. Kuflik, S. Stumpf, J. Otterbacher, A. Sarkar, C. Dugan, and A. S. Tal (Eds.), Proceedings of the Workshop on Explainable Smart Systems for Algorithmic Transparency in Emerging Technologies co-located with 25th International Conference on Intelligent User Interfaces (IUI 2020), Cagliari, Italy, March 17, 2020, Volume 2582 of CEUR Workshop Proceedings. CEUR-WS.org.
- Chu et al. (2020) Chu, E., D. Roy, and J. Andreas. 2020. Are visual explanations useful? A case study in model-in-the-loop prediction. CoRR abs/2007.12248. 2007.12248 .
- Clinciu et al. (2021) Clinciu, M.A., A. Eshghi, and H. Hastie 2021, April. A study of automatic metrics for the evaluation of natural language explanations. In Proceedings of the 16th Conference of the European Chapter of the Association for Computational Linguistics: Main Volume, Online, pp. 2376–2387. Association for Computational Linguistics.
- Cohen (1968) Cohen, J. 1968. Weighted kappa: nominal scale agreement provision for scaled disagreement or partial credit. Psychological bulletin 70(4): 213 .
- Colin et al. (2021) Colin, J., T. Fel, R. Cadene, and T. Serre. 2021. What i cannot predict, i do not understand: A human-centered evaluation framework for explainability methods.
- DeYoung et al. (2020) DeYoung, J., S. Jain, N.F. Rajani, E. Lehman, C. Xiong, R. Socher, and B.C. Wallace 2020, July. ERASER: A benchmark to evaluate rationalized NLP models. In Proceedings of the 58th Annual Meeting of the Association for Computational Linguistics, Online, pp. 4443–4458. Association for Computational Linguistics.
- Dušek et al. (2019) Dušek, O., K. Sevegnani, I. Konstas, and V. Rieser 2019, October–November. Automatic quality estimation for natural language generation: Ranting (jointly rating and ranking). In Proceedings of the 12th International Conference on Natural Language Generation, Tokyo, Japan, pp. 369–376. Association for Computational Linguistics.
- Ehsan et al. (2019) Ehsan, U., P. Tambwekar, L. Chan, B. Harrison, and M.O. Riedl 2019. Automated rationale generation: a technique for explainable AI and its effects on human perceptions. In W. Fu, S. Pan, O. Brdiczka, P. Chau, and G. Calvary (Eds.), Proceedings of the 24th International Conference on Intelligent User Interfaces, IUI 2019, Marina del Ray, CA, USA, March 17-20, 2019, pp. 263–274. ACM.
- Ethayarajh and Jurafsky (2020) Ethayarajh, K. and D. Jurafsky 2020, November. Utility is in the eye of the user: A critique of NLP leaderboards. In Proceedings of the 2020 Conference on Empirical Methods in Natural Language Processing (EMNLP), Online, pp. 4846–4853. Association for Computational Linguistics.
- Fang et al. (2020) Fang, Y., S. Sun, Z. Gan, R. Pillai, S. Wang, and J. Liu 2020. Hierarchical graph network for multi-hop question answering. In B. Webber, T. Cohn, Y. He, and Y. Liu (Eds.), Proceedings of the 2020 Conference on Empirical Methods in Natural Language Processing, EMNLP 2020, Online, November 16-20, 2020, pp. 8823–8838. Association for Computational Linguistics.
- Feng and Boyd-Graber (2019) Feng, S. and J.L. Boyd-Graber 2019. What can AI do for me?: evaluating machine learning interpretations in cooperative play. In W. Fu, S. Pan, O. Brdiczka, P. Chau, and G. Calvary (Eds.), Proceedings of the 24th International Conference on Intelligent User Interfaces, IUI 2019, Marina del Ray, CA, USA, March 17-20, 2019, pp. 229–239. ACM.
- Finstad (2010) Finstad, K. 2010. The usability metric for user experience. Interact. Comput. 22(5): 323–327. 10.1016/j.intcom.2010.04.004 .
- Finstad (2013) Finstad, K. 2013. Response to commentaries on ’The Usability Metric for User Experience’. Interact. Comput. 25(4): 327–330. 10.1093/iwc/iwt005 .
- Gonzalez et al. (2021) Gonzalez, A.V., A. Rogers, and A. Søgaard 2021. On the interaction of belief bias and explanations. In C. Zong, F. Xia, W. Li, and R. Navigli (Eds.), Findings of the Association for Computational Linguistics: ACL/IJCNLP 2021, Online Event, August 1-6, 2021, Volume ACL/IJCNLP 2021 of Findings of ACL, pp. 2930–2942. Association for Computational Linguistics.
- Goodhart (1975) Goodhart, C. 1975. Problems of monetary management: The U.K. experience. Papers in monetary economics 1975 1: 1–20 .
- Goyal et al. (2019) Goyal, Y., Z. Wu, J. Ernst, D. Batra, D. Parikh, and S. Lee 2019. Counterfactual visual explanations. In K. Chaudhuri and R. Salakhutdinov (Eds.), Proceedings of the 36th International Conference on Machine Learning, ICML 2019, 9-15 June 2019, Long Beach, California, USA, Volume 97 of Proceedings of Machine Learning Research, pp. 2376–2384. PMLR.
- Hase and Bansal (2020) Hase, P. and M. Bansal 2020, July. Evaluating explainable AI: Which algorithmic explanations help users predict model behavior? In Proceedings of the 58th Annual Meeting of the Association for Computational Linguistics, Online, pp. 5540–5552. Association for Computational Linguistics.
- Hilton (1990) Hilton, D.J. 1990. Conversational processes and causal explanation. Psychological Bulletin 107(1): 65 .
- Iskender et al. (2021) Iskender, N., T. Polzehl, and S. Möller 2021, April. Reliability of human evaluation for text summarization: Lessons learned and challenges ahead. In Proceedings of the Workshop on Human Evaluation of NLP Systems (HumEval), Online, pp. 86–96. Association for Computational Linguistics.
- Iyengar (1993) Iyengar, S. 1993. Explorations in political psychology. Duke University Press.
- Jacovi et al. (2022) Jacovi, A., J. Bastings, S. Gehrmann, Y. Goldberg, and K. Filippova. 2022. Diagnosing AI explanation methods with folk concepts of behavior. CoRR abs/2201.11239. 2201.11239 .
- Jacovi and Goldberg (2020) Jacovi, A. and Y. Goldberg 2020, July. Towards faithfully interpretable NLP systems: How should we define and evaluate faithfulness? In Proceedings of the 58th Annual Meeting of the Association for Computational Linguistics, Online, pp. 4198–4205. Association for Computational Linguistics.
- Jannach and Bauer (2020) Jannach, D. and C. Bauer. 2020, December. Escaping the McNamara fallacy: Towards more impactful recommender systems research. AI Magazine 41(4): 79–95. 10.1609/aimag.v41i4.5312 .
- Kaplan (1964) Kaplan, A. 1964. The Conduct of inquiry: Methodology for behavioral science; Chandler Pub. Co.: San Francisco, CA, USA .
- Kayser et al. (2021) Kayser, M., O. Camburu, L. Salewski, C. Emde, V. Do, Z. Akata, and T. Lukasiewicz 2021. e-vil: A dataset and benchmark for natural language explanations in vision-language tasks. In 2021 IEEE/CVF International Conference on Computer Vision, ICCV 2021, Montreal, QC, Canada, October 10-17, 2021, pp. 1224–1234. IEEE.
- Khurana et al. (2021) Khurana, A., P. Alamzadeh, and P.K. Chilana 2021. Chatrex: Designing explainable chatbot interfaces for enhancing usefulness, transparency, and trust. In K. J. Harms, J. Cunha, S. Oney, and C. Kelleher (Eds.), IEEE Symposium on Visual Languages and Human-Centric Computing, VL/HCC 2021, St Louis, MO, USA, October 10-13, 2021, pp. 1–11. IEEE.
- Kulesza et al. (2013) Kulesza, T., S. Stumpf, M. Burnett, S. Yang, I. Kwan, and W.K. Wong 2013, September. Too much, too little, or just right? Ways explanations impact end users’ mental models. In 2013 IEEE Symposium on Visual Languages and Human Centric Computing, pp. 3–10. ISSN: 1943-6106.
- Kumar and Talukdar (2020) Kumar, S. and P. Talukdar 2020, July. NILE : Natural language inference with faithful natural language explanations. In Proceedings of the 58th Annual Meeting of the Association for Computational Linguistics, Online, pp. 8730–8742. Association for Computational Linguistics.
- Lage et al. (2019a) Lage, I., E. Chen, J. He, M. Narayanan, B. Kim, S.J. Gershman, and F. Doshi-Velez. 2019a, Oct. Human evaluation of models built for interpretability. Proceedings of the AAAI Conference on Human Computation and Crowdsourcing 7(1): 59–67 .
- Lage et al. (2019b) Lage, I., E. Chen, J. He, M. Narayanan, B. Kim, S.J. Gershman, and F. Doshi-Velez 2019b. Human evaluation of models built for interpretability. In Proceedings of the AAAI Conference on Human Computation and Crowdsourcing, Volume 7, pp. 59–67.
- Li et al. (2022) Li, X., W. Lei, and Y. Yang. 2022. From easy to hard: Two-stage selector and reader for multi-hop question answering. CoRR abs/2205.11729. 10.48550/arXiv.2205.11729. 2205.11729 .
- Liao et al. (2022) Liao, Q.V., Y. Zhang, R. Luss, F. Doshi-Velez, and A. Dhurandhar 2022. Connecting algorithmic research and usage contexts: A perspective of contextualized evaluation for explainable ai. In Proceedings of the AAAI Conference on Human Computation and Crowdsourcing, Volume 10, pp. 147–159.
- Lim et al. (2009) Lim, B.Y., A.K. Dey, and D. Avrahami 2009. Why and why not explanations improve the intelligibility of context-aware intelligent systems. In D. R. O. Jr., R. B. Arthur, K. Hinckley, M. R. Morris, S. E. Hudson, and S. Greenberg (Eds.), Proceedings of the 27th International Conference on Human Factors in Computing Systems, CHI 2009, Boston, MA, USA, April 4-9, 2009, pp. 2119–2128. ACM.
- Liu et al. (2016) Liu, C.W., R. Lowe, I. Serban, M. Noseworthy, L. Charlin, and J. Pineau 2016, November. How NOT to evaluate your dialogue system: An empirical study of unsupervised evaluation metrics for dialogue response generation. In Proceedings of the 2016 Conference on Empirical Methods in Natural Language Processing, Austin, Texas, pp. 2122–2132. Association for Computational Linguistics.
- Liu et al. (2022) Liu, J., A. Liu, X. Lu, S. Welleck, P. West, R. Le Bras, Y. Choi, and H. Hajishirzi 2022, May. Generated knowledge prompting for commonsense reasoning. In Proceedings of the 60th Annual Meeting of the Association for Computational Linguistics (Volume 1: Long Papers), Dublin, Ireland, pp. 3154–3169. Association for Computational Linguistics.
- Liu et al. (2022) Liu, X., T. Sun, J. He, J. Wu, L. Wu, X. Zhang, H. Jiang, Z. Cao, X. Huang, and X. Qiu 2022, July. Towards efficient NLP: A standard evaluation and a strong baseline. In Proceedings of the 2022 Conference of the North American Chapter of the Association for Computational Linguistics: Human Language Technologies, Seattle, United States, pp. 3288–3303. Association for Computational Linguistics.
- Manheim (2018) Manheim, D. 2018. Building less flawed metrics: Dodging Goodhart and Campbell’s laws. Munich Personal RePEc Archive .
- Manheim and Garrabrant (2018) Manheim, D. and S. Garrabrant. 2018. Categorizing variants of goodhart’s law. CoRR abs/1803.04585. 1803.04585 .
- Miller (2019) Miller, T. 2019. Explanation in artificial intelligence: Insights from the social sciences. Artif. Intell. 267: 1–38. 10.1016/j.artint.2018.07.007 .
- Min et al. (2019) Min, S., V. Zhong, L. Zettlemoyer, and H. Hajishirzi 2019. Multi-hop reading comprehension through question decomposition and rescoring. In A. Korhonen, D. R. Traum, and L. Màrquez (Eds.), Proceedings of the 57th Conference of the Association for Computational Linguistics, ACL 2019, Florence, Italy, July 28- August 2, 2019, Volume 1: Long Papers, pp. 6097–6109. Association for Computational Linguistics.
- Nadarzynski et al. (2019) Nadarzynski, T., O. Miles, A. Cowie, and D. Ridge. 2019. Acceptability of artificial intelligence (ai)-led chatbot services in healthcare: A mixed-methods study. Digital health 5: 2055207619871808 .
- Narang et al. (2020) Narang, S., C. Raffel, K. Lee, A. Roberts, N. Fiedel, and K. Malkan. 2020. Wt5?! training text-to-text models to explain their predictions. CoRR abs/2004.14546. 2004.14546 .
- Nauta et al. (2022) Nauta, M., J. Trienes, S. Pathak, E. Nguyen, M. Peters, Y. Schmitt, J. Schlötterer, M. van Keulen, and C. Seifert. 2022. From anecdotal evidence to quantitative evaluation methods: A systematic review on evaluating explainable ai.
- Nishida et al. (2021) Nishida, K., K. Nishida, I. Saito, and S. Yoshida 2021. Towards interpretable and reliable reading comprehension: A pipeline model with unanswerability prediction. In International Joint Conference on Neural Networks, IJCNN 2021, Shenzhen, China, July 18-22, 2021, pp. 1–8. IEEE.
- Nourani et al. (2019a) Nourani, M., S. Kabir, S. Mohseni, and E.D. Ragan. 2019a, Oct. The effects of meaningful and meaningless explanations on trust and perceived system accuracy in intelligent systems. Proceedings of the AAAI Conference on Human Computation and Crowdsourcing 7(1): 97–105 .
- Nourani et al. (2019b) Nourani, M., S. Kabir, S. Mohseni, and E.D. Ragan 2019b. The effects of meaningful and meaningless explanations on trust and perceived system accuracy in intelligent systems. In Proceedings of the AAAI Conference on Human Computation and Crowdsourcing, Volume 7, pp. 97–105.
- Novikova et al. (2017) Novikova, J., O. Dušek, A. Cercas Curry, and V. Rieser 2017, September. Why we need new evaluation metrics for NLG. In Proceedings of the 2017 Conference on Empirical Methods in Natural Language Processing, Copenhagen, Denmark, pp. 2241–2252. Association for Computational Linguistics.
- Paas (1992) Paas, F.G. 1992. Training strategies for attaining transfer of problem-solving skill in statistics: a cognitive-load approach. Journal of educational psychology 84(4): 429 .
- Papineni et al. (2002) Papineni, K., S. Roukos, T. Ward, and W.J. Zhu 2002, July. Bleu: a method for automatic evaluation of machine translation. In Proceedings of the 40th Annual Meeting of the Association for Computational Linguistics, Philadelphia, Pennsylvania, USA, pp. 311–318. Association for Computational Linguistics.
- Pezeshkpour et al. (2022) Pezeshkpour, P., S. Jain, S. Singh, and B. Wallace 2022, May. Combining feature and instance attribution to detect artifacts. In Findings of the Association for Computational Linguistics: ACL 2022, Dublin, Ireland, pp. 1934–1946. Association for Computational Linguistics.
- Pimentel et al. (2020) Pimentel, T., N. Saphra, A. Williams, and R. Cotterell 2020, November. Pareto probing: Trading off accuracy for complexity. In Proceedings of the 2020 Conference on Empirical Methods in Natural Language Processing (EMNLP), Online, pp. 3138–3153. Association for Computational Linguistics.
- Preece et al. (2018) Preece, A.D., D. Harborne, D. Braines, R. Tomsett, and S. Chakraborty. 2018. Stakeholders in explainable AI. CoRR abs/1810.00184. 1810.00184 .
- Pruthi et al. (2022) Pruthi, D., R. Bansal, B. Dhingra, L. Baldini Soares, M. Collins, Z.C. Lipton, G. Neubig, and W.W. Cohen. 2022. Evaluating explanations: How much do explanations from the teacher aid students? Transactions of the Association for Computational Linguistics 10: 359–375. 10.1162/tacl_a_00465 .
- Ranney and Thagard (1988) Ranney, M. and P. Thagard 1988. Explanatory coherence and belief revision in naive physics. Technical report, Pittsburgh Univ PA Learning Research an Development Center.
- Read and Marcus-Newhall (1993) Read, S. and A. Marcus-Newhall. 1993. Explanatory coherence in social explanations: A parallel distributed processing account. Journal of Personality and Social Psychology 65(3): 429–447. 10.1037/0022-3514.65.3.429 .
- Reiter (2018) Reiter, E. 2018, September. A structured review of the validity of BLEU. Computational Linguistics 44(3): 393–401. 10.1162/coli_a_00322 .
- Ribera and Lapedriza (2019) Ribera, M. and À. Lapedriza 2019. Can we do better explanations? A proposal of user-centered explainable AI. In C. Trattner, D. Parra, and N. Riche (Eds.), Joint Proceedings of the ACM IUI 2019 Workshops co-located with the 24th ACM Conference on Intelligent User Interfaces (ACM IUI 2019), Los Angeles, USA, March 20, 2019, Volume 2327 of CEUR Workshop Proceedings. CEUR-WS.org.
- Ribes et al. (2021) Ribes, D., N. Henchoz, H. Portier, L. Défayes, T. Phan, D. Gatica-Perez, and A. Sonderegger 2021. Trust indicators and explainable AI: A study on user perceptions. In C. Ardito, R. Lanzilotti, A. Malizia, H. Petrie, A. Piccinno, G. Desolda, and K. Inkpen (Eds.), Human-Computer Interaction - INTERACT 2021 - 18th IFIP TC 13 International Conference, Bari, Italy, August 30 - September 3, 2021, Proceedings, Part II, Volume 12933 of Lecture Notes in Computer Science, pp. 662–671. Springer.
- Rudin et al. (2020) Rudin, C., C. Wang, and B. Coker. 2020, mar 31. The Age of Secrecy and Unfairness in Recidivism Prediction. Harvard Data Science Review 2(1) .
- Scharrer et al. (2012) Scharrer, L., R. Bromme, M.A. Britt, and M. Stadtler. 2012. The seduction of easiness: How science depictions influence laypeople’s reliance on their own evaluation of scientific information. Learning and Instruction 22(3): 231–243 .
- Schlegel et al. (2022) Schlegel, V., E.M. Guzman, and R. Batista-Navarro 2022. Towards human-centred explainability benchmarks for text classification. In P. O. S. V. de Melo, W. Jeng, and C. Buntain (Eds.), Workshop Proceedings of the 16th International AAAI Conference on Web and Social Media, ICWSM 2022 Workshops, Atlanta, Georgia, USA [hybrid], June 6, 2022.
- Schrills and Franke (2020) Schrills, T. and T. Franke. 2020. How to answer why - evaluating the explanations of AI through mental model analysis. CoRR abs/2002.02526. 2002.02526 .
- Schuff et al. (2020) Schuff, H., H. Adel, and N.T. Vu 2020, November. F1 is Not Enough! Models and Evaluation Towards User-Centered Explainable Question Answering. In Proceedings of the 2020 Conference on Empirical Methods in Natural Language Processing (EMNLP), Online, pp. 7076–7095. Association for Computational Linguistics.
- Schuff et al. (2022) Schuff, H., A. Jacovi, H. Adel, Y. Goldberg, and N.T. Vu 2022. Human interpretation of saliency-based explanation over text. In 2022 ACM Conference on Fairness, Accountability, and Transparency, FAccT ’22, New York, NY, USA, pp. 611–636. Association for Computing Machinery.
- Schuff et al. (2023) Schuff, H., L. Vanderlyn, H. Adel, and N.T. Vu. 2023. How to do human evaluation: A brief introduction to user studies in nlp. Natural Language Engineering: 1–24. 10.1017/S1351324922000535 .
- Schuff et al. (2021) Schuff, H., H.Y. Yang, H. Adel, and N.T. Vu 2021, November. Does external knowledge help explainable natural language inference? automatic evaluation vs. human ratings. In Proceedings of the Fourth BlackboxNLP Workshop on Analyzing and Interpreting Neural Networks for NLP, Punta Cana, Dominican Republic, pp. 26–41. Association for Computational Linguistics.
- Sedoc et al. (2019) Sedoc, J., D. Ippolito, A. Kirubarajan, J. Thirani, L. Ungar, and C. Callison-Burch 2019, June. ChatEval: A tool for chatbot evaluation. In Proceedings of the 2019 Conference of the North American Chapter of the Association for Computational Linguistics (Demonstrations), Minneapolis, Minnesota, pp. 60–65. Association for Computational Linguistics.
- Sellam et al. (2020) Sellam, T., D. Das, and A. Parikh 2020, July. BLEURT: Learning robust metrics for text generation. In Proceedings of the 58th Annual Meeting of the Association for Computational Linguistics, Online, pp. 7881–7892. Association for Computational Linguistics.
- Sivaraman et al. (2023) Sivaraman, V., L.A. Bukowski, J. Levin, J.M. Kahn, and A. Perer. 2023. Ignore, trust, or negotiate: Understanding clinician acceptance of ai-based treatment recommendations in health care.
- Strathern (1997) Strathern, M. 1997. ‘Improving ratings’: audit in the British University system. European review 5(3): 305–321 .
- Sulem et al. (2018) Sulem, E., O. Abend, and A. Rappoport 2018, October-November. BLEU is not suitable for the evaluation of text simplification. In Proceedings of the 2018 Conference on Empirical Methods in Natural Language Processing, Brussels, Belgium, pp. 738–744. Association for Computational Linguistics.
- Sullivan Jr. et al. (2022) Sullivan Jr., J., W. Brackenbury, A. McNutt, K. Bryson, K. Byll, Y. Chen, M. Littman, C. Tan, and B. Ur 2022, July. Explaining why: How instructions and user interfaces impact annotator rationales when labeling text data. In Proceedings of the 2022 Conference of the North American Chapter of the Association for Computational Linguistics: Human Language Technologies, Seattle, United States, pp. 521–531. Association for Computational Linguistics.
- Sundararajan et al. (2017) Sundararajan, M., A. Taly, and Q. Yan 2017. Axiomatic attribution for deep networks. In D. Precup and Y. W. Teh (Eds.), Proceedings of the 34th International Conference on Machine Learning, ICML 2017, Sydney, NSW, Australia, 6-11 August 2017, Volume 70 of Proceedings of Machine Learning Research, pp. 3319–3328. PMLR.
- Suresh et al. (2021) Suresh, H., S.R. Gomez, K.K. Nam, and A. Satyanarayan 2021. Beyond expertise and roles: A framework to characterize the stakeholders of interpretable machine learning and their needs. In Proceedings of the 2021 CHI Conference on Human Factors in Computing Systems, CHI ’21, New York, NY, USA. Association for Computing Machinery.
- Thagard (1989) Thagard, P. 1989. Explanatory coherence. Behavioral and Brain Sciences 12(3): 435–467. 10.1017/S0140525X00057046 .
- Thomas and Uminsky (2022) Thomas, R.L. and D. Uminsky. 2022. Reliance on metrics is a fundamental challenge for AI. Patterns 3(5): 100476 .
- Tu et al. (2020) Tu, M., K. Huang, G. Wang, J. Huang, X. He, and B. Zhou 2020. Select, answer and explain: Interpretable multi-hop reading comprehension over multiple documents. In The Thirty-Fourth AAAI Conference on Artificial Intelligence, AAAI 2020, The Thirty-Second Innovative Applications of Artificial Intelligence Conference, IAAI 2020, The Tenth AAAI Symposium on Educational Advances in Artificial Intelligence, EAAI 2020, New York, NY, USA, February 7-12, 2020, pp. 9073–9080. AAAI Press.
- Vasilyeva et al. (2015) Vasilyeva, N., D.A. Wilkenfeld, and T. Lombrozo 2015. Goals affect the perceived quality of explanations. In CogSci.
- Wang and Vasconcelos (2020) Wang, P. and N. Vasconcelos 2020. SCOUT: self-aware discriminant counterfactual explanations. In 2020 IEEE/CVF Conference on Computer Vision and Pattern Recognition, CVPR 2020, Seattle, WA, USA, June 13-19, 2020, pp. 8978–8987. Computer Vision Foundation / IEEE.
- Wang and Yin (2021) Wang, X. and M. Yin 2021. Are explanations helpful? A comparative study of the effects of explanations in ai-assisted decision-making. In T. Hammond, K. Verbert, D. Parra, B. P. Knijnenburg, J. O’Donovan, and P. Teale (Eds.), IUI ’21: 26th International Conference on Intelligent User Interfaces, College Station, TX, USA, April 13-17, 2021, pp. 318–328. ACM.
- Wiegreffe and Pinter (2019) Wiegreffe, S. and Y. Pinter 2019, November. Attention is not not explanation. In Proceedings of the 2019 Conference on Empirical Methods in Natural Language Processing and the 9th International Joint Conference on Natural Language Processing (EMNLP-IJCNLP), Hong Kong, China, pp. 11–20. Association for Computational Linguistics.
- Yang et al. (2018) Yang, Z., P. Qi, S. Zhang, Y. Bengio, W. Cohen, R. Salakhutdinov, and C.D. Manning 2018, October-November. HotpotQA: A dataset for diverse, explainable multi-hop question answering. In Proceedings of the 2018 Conference on Empirical Methods in Natural Language Processing, Brussels, Belgium, pp. 2369–2380. Association for Computational Linguistics.
- Yu and Shi (2018) Yu, R. and L. Shi. 2018. A user-based taxonomy for deep learning visualization. Vis. Informatics 2(3): 147–154. 10.1016/j.visinf.2018.09.001 .
- Zhang et al. (2020) Zhang, Y., Q.V. Liao, and R.K.E. Bellamy 2020. Effect of confidence and explanation on accuracy and trust calibration in ai-assisted decision making. In M. Hildebrandt, C. Castillo, L. E. Celis, S. Ruggieri, L. Taylor, and G. Zanfir-Fortuna (Eds.), FAT* ’20: Conference on Fairness, Accountability, and Transparency, Barcelona, Spain, January 27-30, 2020, pp. 295–305. ACM.