Dynamic Response Recovery Using Ambient Synchrophasor Data:
A Synthetic Texas Interconnection Case Study
Abstract
Wide-area dynamic studies are of paramount importance to ensure the stability and reliability of power grids. This paper puts forth a comprehensive framework for inferring the dynamic responses in the small-signal regime using ubiquitous fast-rate ambient data collected during normal grid operations. We have shown that the impulse response between any pair of locations can be recovered in a model-free fashion by cross-correlating angle and power flow data streams collected only at these two locations, going beyond previous work based on frequency data only. The result has been established via model-based analysis of linearized second-order swing dynamics under certain conditions. Numerical validations demonstrate its applicability to realistic power system models including nonlinear, higher-order dynamics. In particular, the case study using synthetic PMU data on a synthetic Texas Interconnection (TI) system strongly corroborates the benefit of using angle PMU data over frequency data for real-world power system dynamic modeling.
1 Introduction
Power system dynamic studies are critical for achieving stability and security in control center operations [1, Ch. 1]. Poorly damped or forced oscillations can notoriously affect the operation of interconnected systems; see [2, 3, 4, 5, 6]. Thus, enhancing the modeling and analysis of dynamic responses is of imperative needs.
Recently, high-rate synchrophasor data have provided unprecedented visibility of grid transients. Using synchrophasor data, data-driven approaches have been developed for estimating dynamical models; e.g., [7, 8]. However, most of them are limited to post-event analysis, due to the dependence on large faults for triggering noticeable transient responses. By considering the small-signal analysis in power system dynamics [1, Ch. 12], ambient synchrophasor data have been popularly used for estimating individual oscillation modes; see for example [9, 10, 11] and references therein. To recover the full system’s dynamic responses11 1 In this paper, the frequency, angle, or line flow response refers to the respective impulse response of frequency, angle, or line flow in the time domain. This terminology is consistent with the generator frequency response in power system dynamics [12], which is different from frequency-domain analysis of signals and systems., the statistical information of ambient data has been utilized to estimate the dynamic state Jacobian matrix [13, 14]. However, these approaches to estimate the Jacobian matrix require the availability of state measurements at a majority of grid locations and cannot cope with limited PMU deployments thus far.
Our goal is to develop a general recovery framework for inertia-based dynamic responses in the small-signal regime by using ambient synchrophasor data. We propose a cross-correlation-based approach to process ambient synchrophasor data and utilize a synthetic Texas Interconnection (TI) system to demonstrate its effectiveness and advantages. The proposed approach is quite general and flexible in data types or PMU locations, as it can incorporate any frequency, angle, or line flow data streams from any pair of bus locations. Targeting at the small-signal regime, we first study the second-order swing dynamics to establish the theoretical underpinnings of the proposed data-driven approach. While this analytical result requires homogeneous damping among key inter-area modes, such condition is reasonable for wide-area interconnection [15] and corroborated by numerical case studies as well. An ambient data-driven algorithm is accordingly developed to recover the dynamic responses to a disturbance from any input location. Going beyond the theoretical analysis, the proposed approach is numerically validated on a synthetic TI system that includes realistic nonlinear higher-order dynamics. The case study results strongly support the effectiveness of our approach in recovering dynamic responses and its advantage of incorporating general types of synchrophasor data.
The present work extends a prior work [16] on ambient frequency data analytics to comprehensively encompass ambient data of angles and line flows. This extension is valuable for real-world applications, as PMUs are typically installed at buses or branches instead of measuring generators directly. Additionally, angle/power data are known to have higher accuracy than frequency data, as the high-pass filtering for PMUs to generate frequency data [17] can adversely affect data quality as corroborated by our synthetic TI system studies later on. Another related work [18, 19] has recently proposed a Gaussian process (GP)-based approach for inferring data streams at multiple locations assuming the system model is known.
The main contribution of this work is two-fold. First, we establish the equivalence between model-based dynamic responses and the cross-correlation of various ambient data. This equivalence builds upon the second-order swing dynamics and considers reasonable assumptions for wide-area interconnections. Second, we develop a fully data-driven algorithm to recover system responses that can incorporate all types of data at minimal PMU deployment. The proposed recovery algorithm requires no knowledge of the actual system model or parameters and is applicable to synchrophasor data streams from any pair of grid locations.
The rest of paper is organized as follows. Section 2 introduces the problem and the synthetic TI system. Section 3 establishes the equivalence between small-signal dynamic responses and the cross-correlation of ambient data, which enables Section 4 to develop the proposed data-driven algorithm. Section 5 demonstrates its validity and advantages on the 2000-bus synthetic TI systems with realistic dynamic modeling and PMU data generation. The work is concluded in Section 6.
2 Problem Statement
We aim to develop a data-driven framework to infer the dynamic responses of the power system using ambient synchrophasor data. First, we provide a brief review of small-signal dynamic modeling. The approximate swing equation [20, Ch. 9] for a power system with generators is given by
| (1) | ||||
| (2) |
where states are the rotor angle and speed (frequency) vectors, respectively. The diagonal matrices and contain respectively the generator inertia and damping constants, while stands for the power flow Jacobian matrix evaluated at the given operating point. The swing dynamics in (2) is a linearized approximation of the actual power system dynamics, which are nonlinear and contain higher-order components (e.g., governors and exciters) to be discussed later.
Model (2) can also be written in an equivalent second-order form
| (3) |
Note that all state variables in the linear time-invariant (LTI) system (3) are represented by the deviations from their steady-state values. For simplicity, the term deviations will be dropped henceforth.
Under this LTI approximation, the system’s dynamic response to a power deviation input is fully characterized through the impulse response. Let denote the impulse response of the target rotor angle from input source at . Similar notations will used for other target variables; for example, the impulse response of frequency from input source is denoted by . Leveraging the unique properties of the swing dynamics, we show that the aforesaid impulse responses between grid locations can be recovered by simply cross-correlating synchrophasor data collected only at under ambient conditions. Such methodology does not require to know the system model or probe the system with any particular inputs. The term ambient conditions here refers to random perturbations of active power injections (due to load or generation variations) giving rise to a “white-noise” type of input satisfying [11, 13]
| (4) |
where is the Dirac delta function. Under the input in (4), the corresponding ambient state/output will be denoted by hatted symbols, such as and . The cross-correlation of ambient angle signals is defined as
| (5) |
where the second equality is due to the stationary input process [cf. (4)], as detailed in [21, Ch. 9]. The same equivalence holds for other types of cross-correlations to be discussed later on. Note that PMUs are installed at terminal buses, and thus, do not directly measure the internal generator states or . Nevertheless, the terminal angle and frequency measured at generator bus are excellent surrogates of their internal counterparts [22].

This work will utilize a synthetic TI system to showcase the effectiveness of the proposed data-driven method. As a large-scale test case, the synthetic TI system is of high interest for numerical studies with inter-area modes in the range of Hz [6]. To overcome the issue of actual synchrophasor data access, we use the dynamic data generated on a 2000-bus synthetic TI system [23], as illustrated in Fig. 1. As a realistic representation, this synthetic TI system has 1500 substations, 500 generators, approximately 50 GW of peak load, and 3206 transmission lines. The dynamic components including generators and loads have been modeled based on the actual Texas system, while the dynamic responses have been validated with the actual data [24].
3 Ambient Data Analytics
Our goal is to establish the theoretical equivalence between the actual system responses and the cross-correlation of phasor data collected under ambient grid conditions based on analyzing the swing equation (3). To this end, the following simplifying assumptions are posed to decouple the system into independent modes:
AS 1.
The generator inertia and damping constants are homogeneous; namely for a constant .
AS 2.
The power flow Jacobian is a symmetric Laplacian, and hence, positive semidefinite (PSD) matrix.
Assumption (AS1) holds if damping and inertia parameters scale proportionally for each generator. This assumption has been frequently adopted for approximating power system dynamics [25, 16, 18]. As for (AS2), if transmission lines are all purely inductive (lossless) and loads are of constant power outputs in (2), matrix becomes symmetric and (AS2) would hold. Certain load models (such as constant-current ones [26]) could affect the dynamic models, but may have minimal impact on the symmetry of . This is because under small-signal analysis, the system voltages tend to be steady, thus leading to minimal load power changes. Assumptions (AS1)–(AS2) are adopted only to establish the analytical results, but will be waived during our numerical tests; see Remark 1 for further discussions on generalizability.
Under (AS1)-(AS2), the multi-input multi-output (MIMO) LTI system in (3) decouples into single-input single-output (SISO) systems. This is achieved upon linearly transforming system states as , where matrix is specified by the generalized eigenvalue problem and diagonal matrix carries the eigenvalues . Matrix is -orthonormal and satisfies [27, Sec. 5.2]:
| (6) |
Substituting (6) into (3) and utilizing (AS1) lead to a completely decoupled second-order system, given by
| (7) |
Solving for each independent mode in (7) gives rise to the impulse responses [16]
| (8) | ||||
| (9) |
where is the -th entry of matrix , and with the mode-associated complex-valued parameters
for . Upon obtaining the impulse responses in (8)–(9), we will exploit the structure therein for ambient data processing. Ambient conditions are formally defined as:
AS 3.
Ambient data during nominal operations are generated by random noise satisfying (4) with variance proportional to inertia as with a constant .
Assumption (AS3) is introduced to guarantee that all modes in (7) are equally and independently excited, thanks to the diagonalization [cf. (6)]. Note that real-world power systems may not perfectly balance generation inertia with load variability, as most types of generation are placed based upon resource availability. However, for a large interconnection (AS3) could hold broadly over all control areas, instead of at every location. Furthermore, to deal with lowering inertia in current power systems, the placement of virtual synchronous generators [28] and virtual inertia [29] tend to account for load variability. To sum up, even though (AS3) may not hold perfectly for actual grids, it aims to ensure homogeneous damping among significant inter-area modes, which is reasonable for a wide-area system as shown by actual synchrophasor data analysis in [15].
Reference [16] established that under (AS1)–(AS3) the frequency response between any pair of buses can be recovered up to a scalar uncertainty in a model-agnostic fashion by simply cross-correlating frequency data collected during ambient conditions.
Lemma 1.
This is an interesting result as it does not hold for a general LTI system. Surprisingly, it does hold for swing dynamics because (3) decouples into scalar systems under (AS1)–(AS2), while (AS3) guarantees the theoretical equivalence. Thanks to this unique property, one can recover pairwise frequency responses without knowing the system model by simply cross-correlating frequency datastreams. Nonetheless, in practice synchronized frequency data are not as accurate as angle and line flow measurements because of the PMU internal low-pass filtering [17]. To this end, we generalize this previous result by incorporating general types of PMU measurements, such as bus angle and line flow readings. Heed that the extension is technically challenging, as states at buses are not explicitly reflected in (3). Furthermore, it is also of high practical value as PMUs are typically installed at buses or branches rather than measuring generator states directly.
To generalize Lemma 1, we propose new approaches for directly processing ambient angle and power measurements provided by PMUs, as follows.
Proposition 1.
Proof: The ambient angle is the convolution of input noise and the impulse response in (9). Hence, we can define the vector and show that
where the second equality uses the white-noise property and the diagonalization in (AS3). Taking its derivative and utilizing the relations among , and lead to the equivalence between and as in (9). To obtain the result for , one can use the fact that to show the relation between the two cross-correlations. ∎
Proposition 1 leads to a corollary on recovering the frequency response due to its relation to angle response as in (8)-(9).
Corollary 1.
Proposition 1 and Corollary 1 neatly extend the ambient frequency data analysis to that for angle data. The key difference is the differentiation needed for achieving the original model coefficients in (8)–(9). As in (10), there exists a scaling difference between the cross-correlation and the dynamic response, which could be estimated based on past event analysis [30].
As mentioned in Section 2, PMUs actually measure bus- or branch-related quantities, instead of generator internal states. Hence, we will generalize the cross-correlation equivalence to include bus angle and line power flow from bus to . Recall that in small-signal analysis, the linearized power flow equation in (2) admits that the output bus angle is linearly related to the state as
| (13) |
and similarly for line flow . This linearity is instrumental for extending the analysis to cross-correlating ambient angle , as the corresponding dynamic response and cross-correlation also follow this linear transformation; that is,
| (14) | ||||
| (15) |
Observe that the generator bus frequency or equivalently the derivative of generator bus angle, can accurately approximate the connected rotor speed, as discussed in Section 2. For brevity, we use as the observed angle at the bus closest to input and establish the following result using the observed ambient angle (frequency).
Proposition 2.
Similar to bus angle, the ambient line flow measurements can be used to recover its response as well.
Proposition 3.
Remark 1.
(Generalizability) Although assumptions (AS1)–(AS3) are necessary for the analytical equivalence, they can be well relaxed to match real-world grid conditions. A key premise for our analysis is that under (AS3) the modes are equally and independently excited, such that the cross-correlation output would maintain the same coefficients for all modes. In practice, inter-area modes are more evident than local intra-area modes in a wide-area interconnection [31, Ch. 10]. As long as the dominant inter-area modes are equally excited, the equivalence results should hold as well. Our numerical studies have demonstrated the cross-correlation outputs can approximately recover the dynamic responses even when (AS1)-(AS3) are violated, including using higher-order generator dynamics and perturbing load demands instead of generator inputs for ambient conditions.
4 The Recovery Algorithm
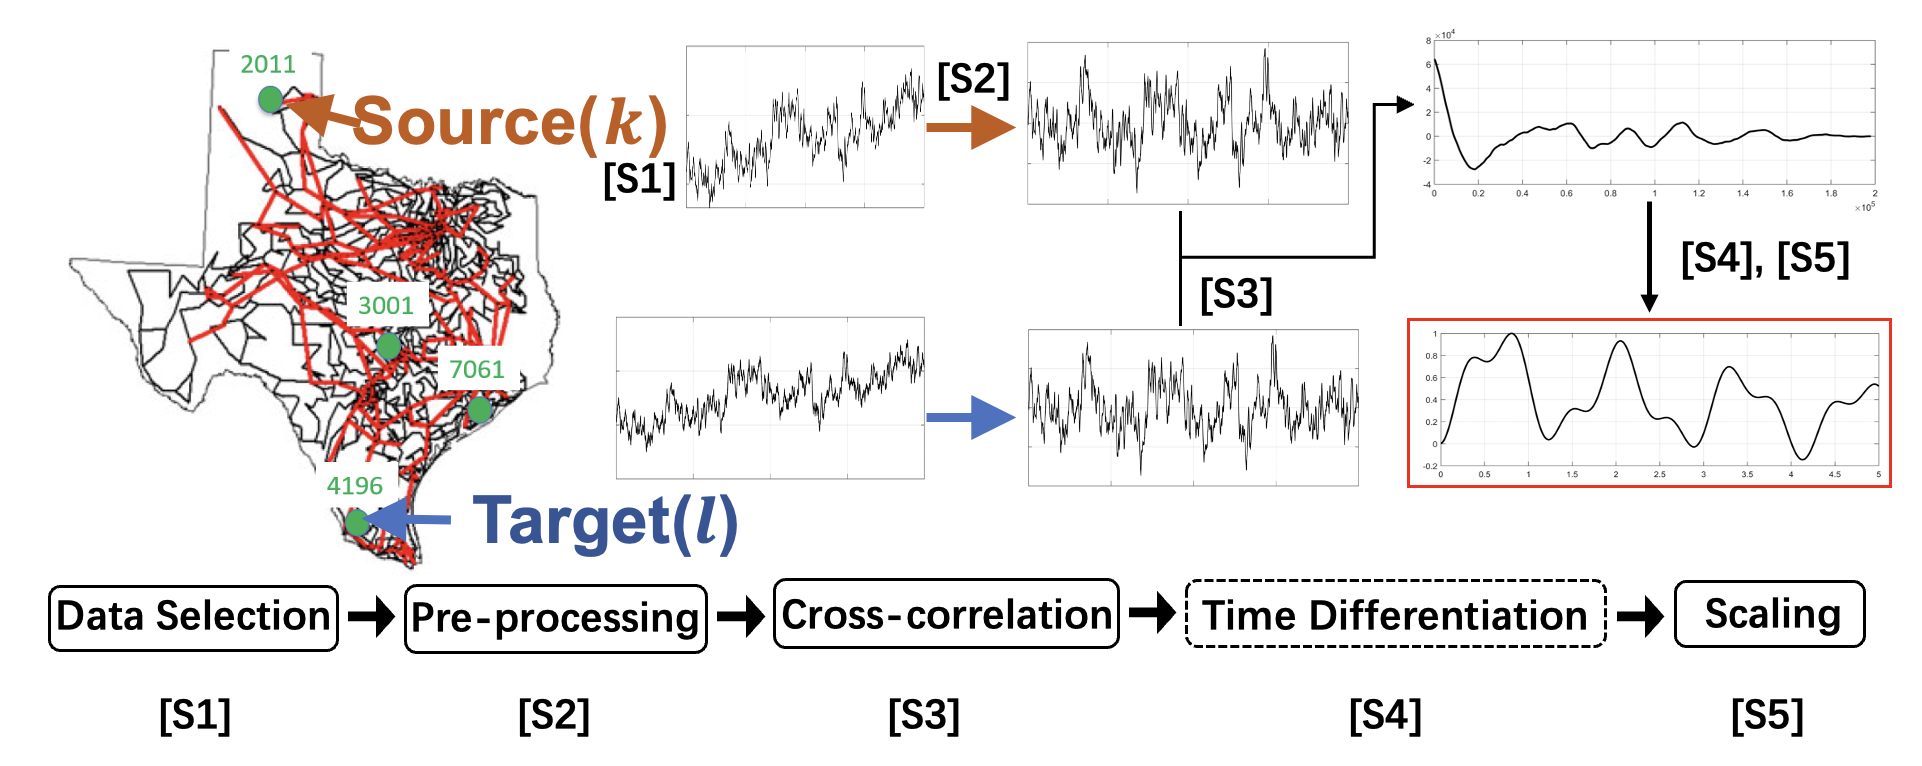

Using the equivalence results, we next describe the algorithm for recovering dynamic responses. The implementation is flexible in the types or locations of data. Typically, PMUs are installed at critical substations with large generation or power flow within each control area. As shown by the cross-correlation equivalence results, the PMU data streams from any two locations can be used for recovering the dynamic responses, including measurements from PMUs not located at generators. Motivated by the idea, we propose the following five-step dynamics recovery algorithm illustrated in Fig. 2.
- [S1]
(Data selection) For recovering response , select the raw data at any source () and any target () locations, from the closest PMUs in terms of electrical distance [32]. For input generator , this could be frequency/angle data from the substation directly connected to it. For the target location, it can be system-level outputs, such as bus frequency, bus angle, or line flows.
- [S2]
(Preprocessing) Preprocess the raw data to obtain the proper ambient response signals. We use a bandpass filter to find the detrended signals and . As inter-area oscillation modes are of high interest, the recommended passband of the filter is between Hz [6].
- [S3]
(Cross-correlation) With a sampling period and thus a total of samples, compute the discrete-time version of the cross-correlation as
- [S4]
(Differentiation) Take the numerical difference of depending on the type of dynamic responses of interest, e.g., recovering the frequency response from ambient angle data (cf. Corollary 1).
- [S5]
(Scaling) If the frequency nadir point is known, one can scale the cross-correlation output to match it. Otherwise, the recovered responses will be used for evaluating the propagation time.
The proposed algorithm can directly be applied to infer the dynamic response from any source to another target from the ambient measurements at both locations. It is also computationally efficient. For samples, the computation is mainly due to [S3] at .
| 2nd unif. | 6th non-unif. | |
|---|---|---|
| Frequency | 0.25 | 0.26 |
| Angle | 0.12 | 0.10 |
| Flow | 0.20 | 0.37 |
4.1 Validation on the WSCC 9-Bus System
To demonstrate the effectiveness of the proposed algorithm, we first use the small WSCC 9-Bus System.22
2
All codes, and results are available at:
https://github.com/ShaohuiLiu/dy_resp_pkg_new. This system has 3 generators, 3 loads, and 9 transmission lines. Impulse responses as well as ambient data have been generated in MATLAB using PSAT [33]. To emulate realistic grid operations, we set the disturbance location at one generator bus and use load perturbations for ambient data generation. For the impulse response, we have run time-domain simulation based on the nonlinear models with a very short “impulse”-like input at the generator bus 2. To generate ambient signals, all loads have been perturbed by random white noise generated by MATLAB’s function randn to mimic (AS3). The sampling rate is set to 100Hz using the simulation time-step of . Estimation accuracy is quantified by the normalized mean squared error (MSE)
| (18) |
where or here stand for the model-based or data-driven response, respectively, normalized by its maximum absolute value.
We first validated the proposed algorithm under the classical second-order generator model and uniform damping condition () following (AS1). Note that the power flow Jacobian is not perfectly symmetric as needed in (AS2), as transmission lines are not purely inductive. Despite this slight violation of (AS2), we have observed that the recovered dynamic responses match well with the model-based ones, as shown in Table 1 by averaging over all system locations. The small estimation error is attributed primarily to linearization and the asymmetry of matrix .
We further considered the original setting with the sixth-order generator model that includes controllers like governor, exciter, and power system stabilizer. We have also changed the damping to be non-uniform (). All these settings reflect realistic power system dynamics with nonlinearity and ambient conditions. Figure 3 compares the responses for frequency, angle, and line flow outputs at selected locations. The MSE values between model-based and data-driven dynamic responses as given in Table 1 confirm the effectiveness of our novel algorithm, despite that this test has significantly departed from assumptions (AS1)-(AS2).
We also compared the recovery performance by comparing the corresponding oscillation frequency and damping coefficient, both estimated by using the logarithmic decrement method [34, Ch. 2]. Table 2 lists these estimated parameters for the data- and model-based approaches alike, confirming the effectiveness of our proposed solution in terms of recovering dynamic parameters. Therefore, relaxing our analytical assumptions to more realistic grid conditions has led to minimal effect on the recovery performance. To sum up, the proposed framework can well recover different types of system responses based on simulated tests on the small 9-bus system.
5 Synthetic TI Case Study
| Frequency | Damping | |||
|---|---|---|---|---|
| data | model | data | model | |
| 0.642 | 0.634 | 0.290 | 0.315 | |
| 0.645 | 0.638 | 0.309 | 0.353 | |
| 0.653 | 0.655 | 0.436 | 0.406 | |
This section presents the case study results for the synthetic TI system presented in Section 2. The case study uses synthetically generated ambient synchrophasor data, which can demonstrate the importance of using angle/line flow data over frequency data in real-world grid conditions. Ambient dynamics were simulated as follows: i) Periodic variations at 5s- and 7s-intervals have been set up for loads and generators, respectively; ii) A simulation time step of one-quarter cycles, with power flow result storage every 8 time steps, is used by the solver specification, close to PMU data rates of 30 samples per second. For ambient data, we consider a total duration of min data with a sampling rate of Hz. The simulated ambient data have been further processed to produce synthetic synchrophasor data, by adding 0.002% random measurement noise to all data streams. In addition, frequency data are further filtered based on the actual PMU processing method as described in [24], to mimic the statistics of actual frequency data. This filtering step for synthetic frequency data has made it less reliable for recovering dynamic responses, as detailed soon.
As illustrated in Fig. 1, we pick 4 buses in different regions of TI. The distance between the north-region Bus 2011 and south-region Bus 4196 is around 670 miles, while the distance from north- to coastal region Bus 7061 is about 450 miles. The frequency responses are very similar within the TI system due to system size and frequency control designs [35, Ch. 10]. To compare responses, we selected Bus 2011 in the north region as the input/source location, and the three other buses (3001, 4196, and 7061) as the output/target locations.
We first compared the recovered frequency responses obtained by both ambient frequency data and angle data, as plotted in Fig. 4. To process ambient data, we have set the filter passbands in [S2] to be Hz to include inter-area modes. As for the ambient angle data, we also need to compute a reference angle by taking the average over all recorded angle data, as discussed in [S1]. This reference angle is subtracted from the ambient angle data prior to bandpass filtering. The simulated frequency data have been used as the benchmark for evaluating synthetic angle and frequency data. Using the simulated frequency data, the proposed cross-correlation outputs show very similar frequency responses at all locations, except for some minor time lags among the first nadir points, as shown by Fig. 4(a). The time of frequency nadir points as estimated by our proposed algorithm is listed in Table 3. A closer look at the time lags confirms with the nominal speed for electromechanical wave propagation, which is around 200-1,000 mi/sec for typical systems [36]. The synthetic angle data produce very similar frequency responses in Fig. 4(b), corroborating the effectiveness of the proposed framework. However, due to PMUs’ signal processing step in filtering frequency data, the synthetic frequency data have led to highly inaccurate frequency responses which clearly lack in synchronization, as shown in Fig. 4(c). This comparison speaks for the importance of the proposed extension over the frequency data only approach of [16].
| Bus Index | 2011 | 3001 | 7061 | 4196 |
|---|---|---|---|---|
| Distance/mi | 0 | 370 | 535 | 670 |
| Time/s | 0.93 | 1.17 | 1.37 | 1.43 |
| Lag/s | 0 | 0.24 | 0.44 | 0.50 |
We further evaluated the angle response recovery from synthetic angle data, as plotted in Fig. 5. Similar to frequency responses, the underlying oscillation modes in all angle responses are very similar among all locations. Nonetheless, the time shifts among them are visible, consistent with the fact that their relative distances to the source of input are different. Thus, the proposed data-driven algorithm has achieved accurate and consistent recovery of grid dynamics from ambient PMU data that have been realistically generated. Thanks to the higher accuracy of ambient angle data over frequency data, our proposed work exhibits enhanced practical value than the previous frequency-based method with improved performance and reliability.

(a) Simulated frequency data

(b) Synthetic angle data

(c) Synthetic frequency data

6 Conclusions
This paper develops a general data-driven framework for recovering small-signal dynamic responses from various types of ambient synchrophasor data. We have proposed a cross-correlation approach to process ambient data from any two locations of interest. Using the second-order swing dynamics, we have established analytically the equivalence between the proposed cross-correlation and the inertia-based dynamic responses under mild assumptions that hold for large-scale power systems. This equivalence allows to develop a general algorithm to process ambient frequency, angle, and line flow data, that is flexible in both location and type of PMU data. The effectiveness of the proposed algorithm under realistic, higher-order, and nonlinear dynamics has been validated on the WSCC 9-bus case. The case study on the synthetic TI system with realistically generated synchrophasor data further confirms the benefit of using angle data over frequency data, and the applicability to large system implementation. Thus, our proposed data-driven algorithm is attractive in terms of being flexible with the types of synchrophasor data while not requiring any grid modeling information.
Exciting future research directions include the integration with dynamic model estimation for system parameters, and the consideration of high-dimensional data analytics that utilize system-wide data. Furthermore, we are actively exploring new applications for the proposed framework in localizing forced oscillation modes and evaluating advanced control designs.
References
References
- [1] P. Kundur, N. J. Balu, and M. G. Lauby, Power System Stability and Control. McGraw-hill, 1994.
- [2] D. N. Kosterev, C. W. Taylor, and W. A. Mittelstadt, “Model validation for the august 10, 1996 WSCC system outage,” IEEE Trans. Power Syst., vol. 14, no. 3, pp. 967–979, 1999.
- [3] Y. V. Makarov, V. I. Reshetov, A. Stroev, and I. Voropai, “Blackout prevention in the United States, Europe, and Russia,” Proc. IEEE, vol. 93, no. 11, pp. 1942–1955, 2005.
- [4] J. Adams, C. Carter, and S.-H. Huang, “ERCOT experience with sub-synchronous control interaction and proposed remediation,” in PES T&D, 2012.
- [5] NERC and T. R. Staff, “Odessa disturbance,” NERC, Tech. Rep., 2021. [Online]. Available: https://www.nerc.com/pa/rrm/ea/Pages/May-June-2021-Odessa-Disturbance.aspx
- [6] S. M. W. Group, “Oscillation analysis monitoring and mitigation,” NERC, Tech. Rep., 2021. [Online]. Available: https://www.nerc.com/comm/RSTC_Reliability_Guidelines
- [7] K. Zhang, H. Zhu, and S. Guo, “Dependency analysis and improved parameter estimation for dynamic composite load modeling,” IEEE Trans. Power Syst., vol. 32, no. 4, 2016.
- [8] G. Chavan, M. Weiss, A. Chakrabortty, S. Bhattacharya, A. Salazar, and F.-H. Ashrafi, “Identification and predictive analysis of a multi-area WECC power system model using synchrophasors,” IEEE Trans. Smart Grid, vol. 8, no. 4, 2016.
- [9] J. W. Pierre, D. J. Trudnowski, and M. K. Donnelly, “Initial results in electromechanical mode identification from ambient data,” IEEE Trans. Power Syst., vol. 12, no. 3, 1997.
- [10] N. Zhou, Z. Huang, L. Dosiek, D. Trudnowski, and J. W. Pierre, “Electromechanical mode shape estimation based on transfer function identification using PMU measurements,” in Proc. IEEE Power & Energy Society General Meeting, 2009.
- [11] J. Ning, S. A. N. Sarmadi, and V. Venkatasubramanian, “Two-level ambient oscillation modal estimation from synchrophasor measurements,” IEEE Trans. Power Syst., vol. 30, no. 6, 2014.
- [12] T. Blalock, B. Cummings, and R. Bauer, “Generator governor frequency response,” NERC, Tech. Rep., 2015. [Online]. Available: https://www.nerc.com/pa/rrm/Webinars\%20DL/Generator_Governor_Frequency_Response_Webinar_April_2015.pdf
- [13] X. Wang, J. W. Bialek, and K. Turitsyn, “PMU-based estimation of dynamic state Jacobian matrix and dynamic system state matrix in ambient conditions,” IEEE Trans. Power Syst., vol. 33, 2017.
- [14] H. Sheng and X. Wang, “Online measurement-based estimation of dynamic system state matrix in ambient conditions,” IEEE Trans. Smart Grid, vol. 11, no. 1, pp. 95–105, 2020.
- [15] Y. Cui, L. Wu, W. Yu, Y. Liu, W. Yao, D. Zhou, and Y. Liu, “Inter-area oscillation statistical analysis of the us eastern interconnection,” the Journal of Engr., vol. 2017, no. 11, pp. 595–605, 2017.
- [16] P. Huynh, H. Zhu, Q. Chen, and A. E. Elbanna, “Data-driven estimation of frequency response from ambient synchrophasor measurements,” IEEE Trans. Power Syst., vol. 33, 2018.
- [17] A. Silverstein and J. Follum, “High-resolution, time-synchronized grid monitoring devices,” NASPI Technical Report, 2020.
- [18] M. Jalali, V. Kekatos, S. Bhela, H. Zhu, and V. Centeno, “Inferring power system dynamics from synchrophasor data using Gaussian processes,” IEEE Trans. Power Syst., 2022, (early access).
- [19] M. Jalali, V. Kekatos, S. Bhela, and H. Zhu, “Inferring power system frequency oscillations using Gaussian processes,” in Proc. IEEE Conf. on Decision and Control, Austin, TX, Dec. 2021, pp. 3670–3676.
- [20] R. B. Arthur and V. Vittal, “Power system analysis,” 2nd ed., London: UK, pp. 532–538, 2000.
- [21] D. Stirzaker and D. Grimmett, Probability and random processes. Clarendon Press, 1992.
- [22] P. N. Markham and Y. Liu, “Electromechanical speed map development using FNET/GridEye frequency measurements,” in 2014 IEEE PES General Meeting. IEEE, 2014.
- [23] A. B. Birchfield, T. Xu, K. M. Gegner, K. S. Shetye, and T. J. Overbye, “Grid structural characteristics as validation criteria for synthetic networks,” IEEE Trans. Power Syst., vol. 32, no. 4, pp. 3258–3265, 2017.
- [24] I. Idehen, W. Jang, and T. J. Overbye, “Large-scale generation and validation of synthetic PMU data,” IEEE Trans. Smart Grid, vol. 11, no. 5, 2020.
- [25] F. Paganini and E. Mallada, “Global analysis of synchronization performance for power systems: Bridging the theory-practice gap,” IEEE Trans. Autom. Contr., vol. 65, no. 7, 2020.
- [26] P. Mackin, R. Daschmans, B. Williams, B. Haney, R. Hung, and J. Ellis, “Dynamic simulation studies of the frequency response of the three U.S. interconnections with increased wind generation,” LBNL, Tech. Rep., 12 2010. [Online]. Available: https://www.osti.gov/biblio/1004165
- [27] G. Strang, Linear algebra and its applications. Belmont, CA: Thomson, Brooks/Cole, 2006.
- [28] C. Arghir, T. Jouini, and F. Dörfler, “Grid-forming control for power converters based on matching of synchronous machines,” Automatica, vol. 95, pp. 273–282, 2018.
- [29] B. K. Poolla, D. Groß, and F. Dörfler, “Placement and implementation of grid-forming and grid-following virtual inertia and fast frequency response,” IEEE Trans. Power Syst., vol. 34, 2019.
- [30] M. Peydayesh and R. Baldick, “Simplified model of ERCOT frequency response validated and tuned using PMUs data,” IEEE Trans. Smart Grid, vol. 9, no. 6, pp. 6666–6673, 2017.
- [31] J. H. Chow, Power system coherency and model reduction. Springer, 2013, vol. 84.
- [32] E. Cotilla-Sanchez, P. D. Hines, C. Barrows, S. Blumsack, and M. Patel, “Multi-attribute partitioning of power networks based on electrical distance,” IEEE Trans. Power Syst., vol. 28, no. 4, pp. 4979–4987, 2013.
- [33] F. Milano, “An open source power system analysis toolbox,” IEEE Trans. Power Syst., vol. 20, no. 3, pp. 1199–1206, 2005.
- [34] L. Meirovitch, Fundamentals of Vibrations, ser. McGraw-Hill higher education. McGraw-Hill, 2001.
- [35] ERCOT, “ERCOT fundamentals training manual,” ERCOT, Tech. Rep., 2016. [Online]. Available: https://www.ercot.com/mp/data-products/services/?id=OPG-160-M
- [36] A. Alharbi and S. You, “A simulation-based education approach for the electromagnetic and electromechanical transient waves in power systems,” arXiv preprint arXiv:2010.12379, 2020.
Acknowledgments
This work has been supported by the US National Science Foundation (NSF) awards ECCS-1802319, 1751085, 2150571, and 2150596. The authors would like to thank Dr. Ikponmwosa Idehen for providing the synthetic Texas system data.