REDISCUSSION OF ECLIPSING BINARIES. PAPER XI.
ZZ URSAE MAJORIS, A SOLAR-TYPE SYSTEM SHOWING TOTAL ECLIPSES AND A RADIUS DISCREPANCY
By John Southworth
Astrophysics Group, Keele University, Staffordshire, ST5 5BG, UK
ZZ UMa is a detached eclipsing binary with an orbital period of 2.299 d that shows total eclipses and starspot activity. We used five sectors of light curves from the Transiting Exoplanet Survey Satellite (TESS) and two published sets of radial velocities to establish the properties of the system to high precision. The primary star has a mass of and a radius of , whilst the secondary component has a mass of and a radius of . The properties of the primary star agree with theoretical predictions for a slightly super-solar metallicity and an age of 5.5 Gyr. The properties of the secondary star disagree with these and all other model predictions: whilst the luminosity is in good agreement with models the radius is too large and the temperature is too low. These are the defining characteristics of the radius discrepancy which has been known for 40 years but remains an active area of research. Starspot activity is evident in the out-of-eclipse portions of the light curve, in systematic changes in the eclipse depths, and in emission at the Ca H and K lines in a medium-resolution spectrum we have obtained of the system. Over the course of the TESS observations the light and surface brightness ratios between the stars change linearly by 20% and 14%, respectively, but the geometric parameters do not. Studies of objects showing spot activity should account for this by using observations over long time periods where possible, and by concentrating on totally-eclipsing systems whose light curves allow more robust measurements of the physical properties of the system.
Introduction
Detached eclipsing binaries (dEBs) are our primary source of measurements of the physical properties of normal stars Torres++10aarv; Me15aspc and have many astrophysical applications Torres++10aarv; Andersen91aarv; Me21univ. dEBs containing stars of similar mass to our Sun are useful in particular in helping to constrain our understanding of stellar theory in the mass regime around the solar fiducial point, for example the amounts of internal mixing and convective core overshooting Spada+13apj; KirkbyKent+16aa; Graczyk+16aa. Solar-type dEBs can also be helpful in studying starspot configurations Jeffers+06mn; Wang+21mn; Wang+22mn and the radius discrepancy whereby low-mass stars are found to be systematically larger and cooler than predicted by theoretical models Spada+13apj; Torres13an; MorrellNaylor19mn.
In this work we determine the physical properties of the dEB ZZ Ursae Majoris based on published radial velocity (RV) measurements and a light curve recently obtained by the Transiting Exoplanet Survey Satellite (TESS). Basic information on ZZ UMa is given in Table I. The and magnitudes come from the Tycho star mapper Hog+00aa on the Hipparcos satellite Hipparcos97, and are the average of 213 measurements well distributed in orbital phase; they agree well with the dedicated observations by Lacy Lacy92aj. The 2MASS magnitudes Cutri+03book are single-epoch and were obtained at orbital phase 0.223.
ZZ UMa was discovered to be a dEB by Kippenhahn Geyer++55kvb; JaniashviliLavrov89ibvs. Photometry and light curve solutions have been reported by multiple authors JaniashviliLavrov89ibvs; Doppner62; LavrovLavrova88atsir; Clement+93iauc; Clement+97aas; Clement+97aas2. Lacy Lacy92aj; Lacy02aj measured its magnitude, and colour indices, and photometric indices in the system.
| Property | Value | Reference |
| Hipparcos designation | HIP 51411 | Hipparcos97 |
| Tycho designation | TYC 4144-400-1 | Hog+00aa |
| Gaia EDR3 designation | 1049087857023628672 | Gaia21aa |
| Gaia EDR3 parallax | mas | Gaia21aa |
| TESS Input Catalog designation | TIC 138505004 | Stassun+19aj |
| magnitude | Hog+00aa | |
| magnitude | Hog+00aa | |
| magnitude | Cutri+03book | |
| magnitude | Cutri+03book | |
| magnitude | Cutri+03book | |
| Spectral type | G0 V + G8 V | Clement+97aas |
Popper Popper96apjs reported obtaining 13 high-resolution spectra which showed double lines, as part of a survey of 76 late-type dEBs. He presented a short discussion and preliminary properties, but no RVs or detailed analysis. Popper Popper95ibvs gave minimum masses of and , where is the orbital inclination, but again no RVs were presented in his short summary paper.
Lacy & Sabby LacySabby99ibvs obtained and measured RVs from 27 high-resolution échelle spectra of ZZ UMa. They combined these with the photometric results from Clement et al. Clement+97aas2 to obtain the first determination of the masses and radii of the component stars. Imbert Imbert02aa presented a spectroscopic orbit of ZZ UMa based on 49 spectra from the Coravel and Élodie instruments. The resulting masses and radii are in reasonable agreement with those from Lacy & Sabby.
In this work we revisit ZZ UMa to determine its physical properties to high precision. We base our analysis on the RVs from Lacy & Sabby LacySabby99ibvs and Imbert Imbert02aa, and on light curves from TESS. A detailed scientific motivation is presented in Paper I of this series Me20obs and a review of the use of space-based photometry for the study of binary systems is given in Ref. Me21univ.
Observational material
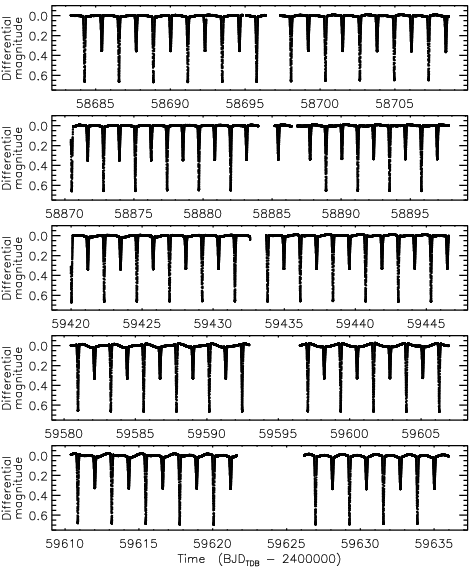
A surfeit of photometry exists for ZZ UMa from the NASA TESS satellite Ricker+15jatis, which observed it in short cadence (120 s sampling rate) in sectors 14 (2019/07/18 to 2019/08/15), 21 (2020/01/21 to 2020/02/18), 41 (2021/07/23 to 2021/08/20) and 47–48 (2021/12/03 to 2022/02/26). The light curves show deep total and annular eclipses plus a smaller-amplitude and longer-timescale variation which changes between and during sectors and can be attributed to starspots.
We downloaded the data for all five sectors from the MAST archive**
*
Mikulski Archive for Space Telescopes,
https://mast.stsci.edu/portal/Mashup/Clients/Mast/Portal.html and converted the fluxes to relative magnitude. We retained observations with a QUALITY flag of zero, yielding a total of 84 764 datapoints. We found the simple aperture photometry (SAP) and pre-search data conditioning SAP (PDCSAP) data Jenkins+16spie to be visually almost indistinguishable, so adopted the SAP data as usual in this series of papers. The light curves are shown in Fig. 1.
Light curve analysis
The light curve shows total eclipses plus a slower variation of lower amplitude due to starspots. Evolution of the starspot pattern is clear both between and during sectors. A detailed analysis of the spot properties of ZZ UMa is not the aim of the current work; we instead view it as a nuisance signal to be removed†† † A model of the starspots and their evolution could be obtained using computer codes such as macula (Kipping Kipping12mn) or soap-T (Oshagh et al. Oshagh+13aa2).. To this end we located every fully-observed eclipse within the TESS light curve and extracted all data within one eclipse duration of the eclipse centre. A straight line was fitted to the data outside eclipse and subtracted from the light curve to normalise it to zero differential magnitude. The result of this was a new dataset containing 26 682 datapoints (31.5% of the original number).
We then fitted this eclipse light curve using version 42 of the jktebop‡‡ ‡ http://www.astro.keele.ac.uk/jkt/codes/jktebop.html code Me++04mn2; Me13aa. We fitted for the orbital period () and time of mid-eclipse (), the sum () and ratio () of the fractional radii, the orbital inclination (), and the central surface brightness ratio of the two stars (). We adopted a quadratic limb darkening (LD) law, fitted for the linear coefficients for each star ( and ) and fixed the quadratic coefficients ( and ) to theoeretical values from Claret Claret17aa. A circular orbit was adopted as we found the orbital eccentricity to be extremely small and consistent with zero. Third light was found to be insignificant and typically slightly below zero so was fixed at zero. We term the star eclipsed at the deeper eclipse star A and its companion star B; star A is hotter, larger and more massive than star B.
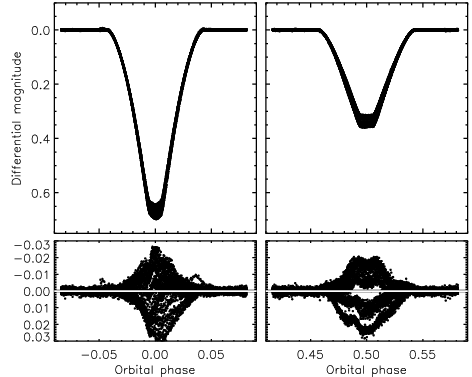
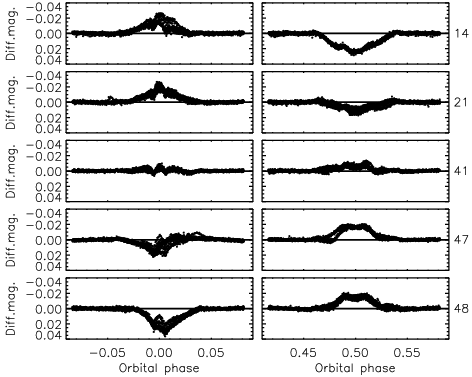
The best fit is shown in Fig. 2 and has a large scatter during the eclipses. We attribute this to spots on the stellar surfaces which affect the surface brightness ratio of the system. The increased scatter during both eclipses is evidence that both components have starspots. A closer inspection of the residuals of the fit shows that their form changes between sectors (Fig. 3) due to evolution of the starspots.
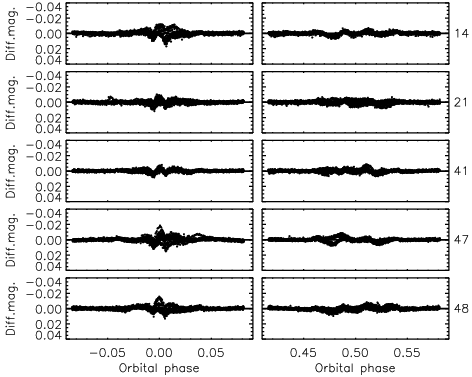
From this we decided that separate fits to subsets of the TESS data are necessary. We therefore modelled the data from each sector individually with the same approach as above, except that was fixed at the value found from the fit to all data near eclipse. The residuals of these fits are shown in Fig. 4, which has been constructed in the same way as Fig. 3 so the two figures may be easily compared. It is obvious that these individual fits give much lower residuals. This can be quantified by the scatter of the datapoints versus the best fit(s), which is 6.5 mmag for the overall fit and between 1.8 and 2.5 mmag for the individual fits. Nevertheless, some structure remains in the residuals in Fig. 4 because the effects of starspots have not been completely removed.
The expectation from the fits to the data from the individual TESS sector was that the fractional radii would be reasonably consistent, as they are well determined by the contact points during the eclipses Russell12apj; Kopal59book, but that the radiative parameters (, , ) would change significantly with time. Such assertions require the availability of errorbars, so we ran 1000 Monte Carlo simulations Me++04mn2; Me08mn to measure the 1 uncertainties in the fitted parameters. We also experimented with further subdividing the data from each sector into two light curves, before and after the mid-sector pause for TESS to downlink data to Earth. The latter results are more informative so were adopted for the following analysis.
The results of this process are shown in Fig. 5, from which three conclusions can be reached. First, there is a clear trend of decreasing surface brightness and light ratio with time indicative of variation in the radiative parameters of one or both stars. Its timescale is a few years or more, but the current data are insufficient to infer this with any precision. Second, the wavelength-independent parameters (, , ) show no clear trend except for a possible variation in and for sectors 47 and 48. This agrees with prior expectations. Third, the errorbars are much smaller than the scatter of the values of individual parameters. This was also expected because they do not allow for the changing radiative parameters of the stars.
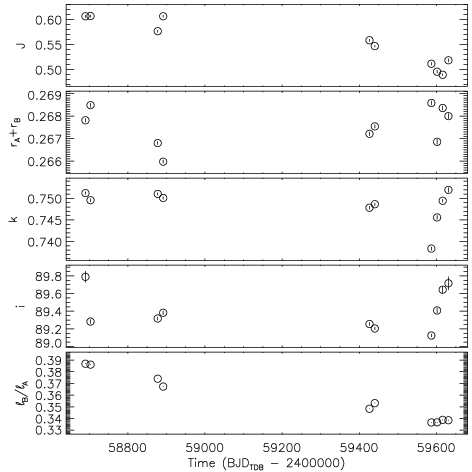
In the absence of an extensive study of the spot evolution properties of the system, we consider it reasonable to adopt the mean and standard deviation of the parameter values as the final values and errorbars. We use the standard deviation rather than the standard error to avoid underestimation of the uncertainties caused by the changing properties of the system. The adopted properties are given in Table II. The good news is that and , the most important parameters here, are measured to 0.4% precision. For completeness, the analysis based on the five light curves from individual sectors returned results in good agreement but with slightly smaller errorbars.
| Parameter | Value |
|---|---|
| Orbital inclination (∘) | |
| Sum of the fractional radii | |
| Ratio of the radii | |
| Central surface brightness ratio | |
| Third light | 0.0 (fixed) |
| Linear LD coefficient for star A | |
| Linear LD coefficient for star B | |
| Quadratic LD coefficient for star A | 0.30 (fixed) |
| Quadratic LD coefficient for star B | 0.23 (fixed) |
| Fractional radius of star A | |
| Fractional radius of star B | |
| Light ratio |
Orbital ephemeris
One drawback of modelling the TESS light curve in multiple short segments is that a precise orbital period does not result. We therefore sought to obtain a precise orbital ephemeris based on data covering a much longer time span. We made no attempt to be exhaustive, as we note that no change in orbital period is apparent in the many timings collected on the TIming DAtabase at Krakow (TIDAK§§ § https://www.as.up.krakow.pl/ephem/) for ZZ UMa¶¶ ¶ https://www.as.up.krakow.pl/minicalc/UMAZZ.HTM. (see Ref. Kreiner++01book). The specific aim was to have an orbital ephemeris that is reliable over the time interval covering the recent TESS observations and the earlier spectroscopic studies in the mid-1990s that will be used below.
We began with the times of primary eclipse obtained from the ten half-sector eclipse light curves. The errorbars from the Monte Carlo analysis were significantly too small so we multiplied them by a factor of 20 to better account for their scatter versus a fitted linear ephemeris. To these we added published times of primary minimum obtained using CCDs or photoelectric photometers, plus the zeropoint of the orbital ephemeris given by Mallama Mallama80apjs. These values were in all cases quoted in HJD, so we converted them to BJD. When a time system was given it was always UTC, so we assumed that all published timings were on the UTC system and converted them to TDB to match those from TESS, using routines from Eastman et al. Eastman++10pasp.
The resulting orbital ephemeris is
| (1) |
where is the cycle number since the reference time and the bracketed quantities indicate the uncertainties in the last digit of the preceding number. The reduced of the fitted ephemeris is so the errorbars in the ephemeris above have been multiplied by to account for this. This excess scatter in the eclipse timings beyond the quoted errorbars can be attributed to the spot activity shown by ZZ UMa. The times of minimum used in this analysis are given in Table III and the residuals of the fit are shown in Fig. 6.
| Orbital | Eclipse time | Uncertainty | Residual | Reference |
| cycle | (BJDTDB) | (d) | (d) | |
| 2441499.59581 | 0.00170 | 0.00042 | Mallama80apjs | |
| 2447967.41436 | 0.00040 | 0.00023 | Hanzl91ibvs | |
| 2447967.41366 | 0.00040 | 0.00093 | Hanzl91ibvs | |
| 2453352.28203 | 0.00010 | 0.00016 | Kim+06ibvs | |
| 2453814.43365 | 0.00010 | 0.00014 | Biro+07ibvs | |
| 2453814.43375 | 0.00040 | 0.00024 | Hubscher++06ibvs | |
| 2454168.51956 | 0.00030 | 0.00003 | Hubscher++09ibvs | |
| 2454191.51216 | 0.00020 | 0.00004 | Hubscher++09ibvs | |
| 2454538.70107 | 0.00020 | 0.00057 | Samolyk08javso | |
| 2454554.79557 | 0.00020 | 0.00025 | Samolyk08javso | |
| 2454499.61323 | 0.00010 | 0.00015 | Brat+08oejv | |
| 2454844.50178 | 0.00030 | 0.00034 | Hubscher+10ibvs | |
| 2454945.66949 | 0.00010 | 0.00009 | Samolyk10javso | |
| 2456725.29687 | 0.00050 | 0.00017 | HubscherLehmann15ibvs | |
| 2456727.59537 | 0.00050 | 0.00093 | HubscherLehmann15ibvs | |
| 2457035.69667 | 0.00040 | 0.00051 | Hubscher15ibvs | |
| 2458688.86544 | 0.00017 | 0.00011 | TESS (this work) | |
| 2458702.66083 | 0.00018 | 0.00006 | TESS (this work) | |
| 2458877.40465 | 0.00014 | 0.00002 | TESS (this work) | |
| 2458891.20006 | 0.00017 | 0.00017 | TESS (this work) | |
| 2459426.92788 | 0.00016 | 0.00000 | TESS (this work) | |
| 2459440.72348 | 0.00015 | 0.00004 | TESS (this work) | |
| 2459585.57636 | 0.00018 | 0.00048 | TESS (this work) | |
| 2459601.67145 | 0.00020 | 0.00021 | TESS (this work) | |
| 2459615.46759 | 0.00017 | 0.00036 | TESS (this work) | |
| 2459631.56230 | 0.00024 | 0.00025 | TESS (this work) |

Radial velocities
Two sets of high-quality spectroscopic orbits for both components of ZZ UMa are available. Lacy & Sabby LacySabby99ibvs obtained 27 high-resolution spectra and measured RVs for both components in each. Imbert Imbert02aa presented 33 RVs for star A, of which 28 were from Coravel Baranne++79va and five from Élodie Baranne+96aas, and 16 RVs for star B, of which 12 were from Coravel and four from Élodie. The Coravel RVs have a greater scatter than those from Lacy & Sabby, whereas the Élodie RVs have a much lower scatter.

We reanalysed both sets of RVs independently, in order to ensure the published velocity amplitudes, and , and uncertainties were reliable. In each case we modelled the RVs of both stars together but fitted for the individual systemtic velocities, and . A circular orbit was assumed and the ephemeris was fixed at that found in the previous section. Informed by our work Me21obs5 on V505 Per we used 1000 Monte Carlo simulations to determine the errorbars for the fitted parameters.
The results for the Lacy & Sabby LacySabby99ibvs RVs are shown in Fig. 7. No data errors were given for the RVs so we weighted them equally for each star. Our results are in good agreement with those from Lacy & Sabby LacySabby99ibvs, and our errorbars are slightly smaller.
The fitted orbits for the Imbert Imbert02aa RVs are shown in Fig. 8. We found that the uncertainties quoted for the Élodie RVs for star A were significantly smaller than the scatter of the RVs themselves so we doubled them for both stars. The RV uncertainties for each star were subsequently scaled to give . We found a slight disagreement in for the Imbert RVs. Investigating this showed that the is sensitive to the value used. We therefore recalculated all the orbits with fitted but fixed. This effect may be due to an inaccurate orbital ephemeris or to errors in the timestamps provided with the Imbert RVs. As the same problem was not found for the Lacy RVs, we suspect the latter.
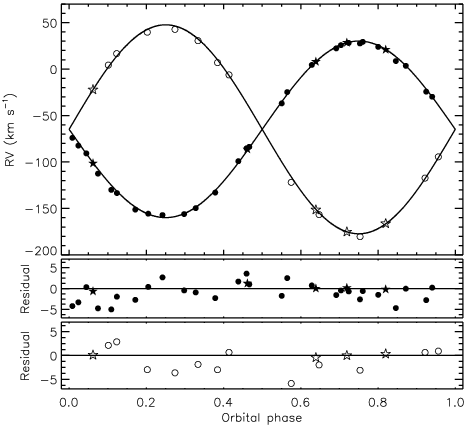
Table IV presents the parameters of the spectroscopic orbits from the literature and found by ourselves. There is excellent consistency between different results. To obtain the final and we calculated the weighted mean of the individual values. The choice of whether to fix or fit has an effect on the final and values smaller than their uncertainties.
| Source | residual | |||||
|---|---|---|---|---|---|---|
| Lacy & Sabby LacySabby99ibvs | 95.1 | 111.8 | 65.7 | 64.8 | ||
| 0.3 | 0.3 | 0.2 | 0.2 | |||
| This work | 95.01 | 111.52 | 65.50 | 64.65 | 0.96, 0.96 | |
| 0.23 | 0.24 | 0.18 | 0.18 | |||
| Imbert Imbert02aa | 94.99 | 112.03 | 65.22 | 1.73, 1.96 | ||
| 0.33 | 0.39 | 0.20 | ||||
| This work | 94.89 | 111.75 | 64.86 | 65.36 | 2.00, 2.05 | |
| 0.18 | 0.27 | 0.14 | 0.23 | |||
| Final values | 94.94 | 111.62 | ||||
| 0.18 | 0.40 |
Chromospheric emission
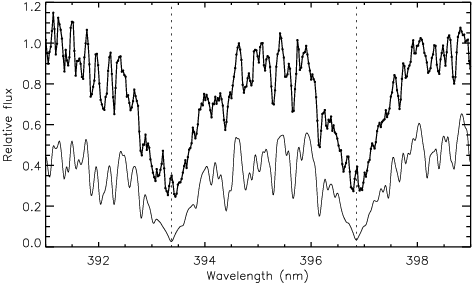
Magnetic fields in low-mass stars cause starspots Hale08apj; ThomasWeiss08book and chromospheric emission in lines such as Ca ii H and K Wilson68apj; Noyes+84apj; Baliunas+95apj. ZZ UMa shows evidence for the former phenomenon, and we had an opportunity to observe the latter. We obtained a single spectrum of ZZ UMa on the night of 2022/06/08 using the Intermediate Dispersion Spectrograph (IDS) at the Cassegrain focus of the Isaac Newton Telescope (INT). Thin cloud was present, which decreased the count rate of the observations. We used the 235 mm camera, H2400B grating, EEV10 CCD and a 1 arcsec slit in order to obtain a resolution of approximately 0.5 Å, the maximum currently available with this spectrograph. A central wavelength setting of 4050 Å yielded a spectrum covering 373–438 nm at a reciprocal dispersion of 0.023 nm px-1. The data were reduced using a pipeline currently being written by the author, which performs bias subtraction, division by a flat-field from a tungsten lamp, aperture extraction, and wavelength calibration using copper-argon and copper-neon arc lamp spectra.
Fig. 9 shows the resulting spectrum in the region of the H and K lines compared to an analogous synthetic spectrum from the BT-Settl model atmospheres Allard+01apj; Allard++12rspta. Emission in the cores of the calcium lines is obvious and confirms that the system shows chromospheric activity. The spectrum was taken at orbital phase 0.9037 where the RV difference between the stars was 117 km s-1 (approximately 3.5 pixels). The emission lines from the two stars overlap so it is not possible to assess the emission strengths from the two stars individually.
Physical properties of ZZ UMa
The physical properties of the system were calculated using the , and from Table II, the orbital period determined above, and the final and values from Table IV. We used standard formulae Hilditch01book and the reference solar values from the IAU Prsa+16aj, as implemented in the jktabsdim code Me++05aa. The results are given in Table V and show good news: the masses are measured to precisions of 0.8% and 0.5%, and the radii to 0.5% and 0.4%. The main limitation is the lower precision of , which is in turn due to the minor disagreement between the two sources of published RVs.
A comparison with the properties measured by Lacy & Sabby LacySabby99ibvs shows excellent agreement for the masses (as expected) but not for the radii: we find values significantly lower than the and given by Lacy & Sabby LacySabby99ibvs. We expect our own radius measurements to be more reliable as they are based on light curves of much better quality and greater quantity than in previous studies.
The effective temperatures (s) of the stars were determined by Lacy & Sabby LacySabby99ibvs based on the intrinsic colour indices of the stars, which come from the combined colour indices, the light ratios in the and light curves from Clement et al. Clement+97aas, and the intrinsic flux calibration by Popper Popper80araa. This approach is at first impression quite outdated, but can be checked using external information. First, we used the surface flux ratio in Table II to determine an approximate ratio of which gives K for a of 5960 K, in acceptable agreement with the from Lacy & Sabby LacySabby99ibvs. This point is only weak evidence because the variation in radiative parameters seen in the TESS light curves means our measurement of the surface brightness ratio may not be representative of its average value. Second, we determined the distance to the system using the method of Southworth et al. Me++05aa which relies on the surface brightness versus calibrations of Kervella et al. Kervella+04aa. The -band measurement gives a distance of pc assuming an interstellar extinction of ; a larger interstellar extinction can be ruled out by requiring the distances found in the bands to be consistent. The Gaia EDR3 parallax Gaia21aa gives a distance of pc by simple inversion. Based on this, we accepted the values from Lacy & Sabby LacySabby99ibvs as reliable.
| Parameter | Star A | Star B | ||
| Mass ratio | ||||
| Semimajor axis of relative orbit () | ||||
| Mass () | 1.1348 | 0.0087 | 0.9652 | 0.0051 |
| Radius () | 1.4367 | 0.0070 | 1.0752 | 0.0046 |
| Surface gravity ([cgs]) | 4.1782 | 0.0041 | 4.3597 | 0.0034 |
| Density () | 0.3826 | 0.0051 | 0.7765 | 0.0089 |
| Synchronous rotational velocity ( km s-1) | 31.61 | 0.15 | 23.66 | 0.10 |
| Effective temperature (K) | 5960 | 70 | 5270 | 90 |
| Luminosity | 0.370 | 0.021 | 0.095 | 0.030 |
| (mag) | 3.814 | 0.052 | 4.978 | 0.075 |
| Distance (pc) | ||||
Comparison with theoretical models
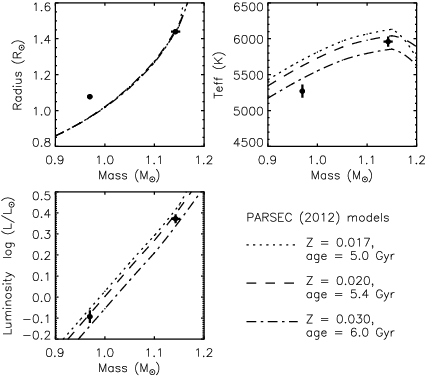
The precise measurement of the properties of the stars, in particular for the slightly-evolved star A, means a comparison with theoretical evolutionary models could be informative. We did this, using tabulations from the parsec models Bressan+12mn, via the mass–radius and mass– diagrams MeClausen07aa; Me22obs4 (Fig. 10). We did not consider any constraints on metallicity as there are no precise determinations available.
The mass, radius and of star A can be matched by a metallicity in the region of or slightly higher, with an age in the region of 5.5 Gyr depending on the adopted . Theoretical models with predict a significantly higher than observed, and models with predict the opposite. We infer that the system has an approximately solar metallicity and that star A does not contradict stellar theory.
The less massive star B, however, causes a problem for the theoretical models. It is not possible to match its properties for any combination of age and metallicity available in the parsec tabulations. It is much too large and cool to match any theoretical predictions simultaneously with star A (see Figure), and the closest we can get is for and an age of 8.5 Gyr, where its radius is well matched but it is still slightly too hot for the models. By comparison to its predicted properties for the same age(s) and metal abundance(s) as star A, it is 0.12 (11%) larger and 330 K (6%) cooler, but these effects cancel to give it the expected luminosity.
A radius discrepancy is known to exist for late-type dwarfs in the sense that they have larger radii and lower s than predicted by stellar theory Spada+13apj; Torres13an; MorrellNaylor19mn; Hoxie73aa; Lacy77apjs. This has been attributed to the inhibition of convection Lopez07apj; Feiden16aa due to magnetic fields and/or starspots. There is evidence that stars in short-period binaries are affected in a qualitatively different way Lopez07apj because tidal effects cause them to rotate more quickly and thus show stronger activity. However, the radius discrepancy has also been found in longer-period binaries Irwin+11apj and single stars Spada+13apj; MorrellNaylor19mn, and there are also examples of stars in short-period binaries that do not show the discepancy Blake+08apj; Feiden++11apj; Maxted+22mn. Recent analyses have found a large scatter in the size of the radius discrepancy between and even within binary systems Kraus+17apj; Parsons+18mn. Under the assumption that the age and metallicity of the ZZ UMa system can be inferred from the properties of star A, the poor agreement between theoretical models and the measured properties of star B make it an excellent candidate for a star showing the radius discrepancy. ZZ UMa B is another example of a star in the region of 1 showing the radius discrepancy.
An updated version of the parsec model grid, denoted 1.2S, has been computed Chen+14mn with a revised temperature vs. optical depth prescription based on sophisticated model atmospheres of low-mass stars Allard+01apj; Allard++12rspta. These provide a better match to the observed properties of low-mass stars. However, they are not useful in the current situation as the modifications cover only masses of 0.7 and lower.
Summary and conclusions
ZZ UMa is a solar-type dEB which shows total eclipses with an orbital period of 2.299 d and evolving starspot activity. We have determined its physical properties based on two high-quality sets of RVs available from the literature and light curves from five sectors of observations with the TESS satellite. The two RV datasets agree with each other very well for the primary star but not quite so well for the secondary star, but do allow mass determinations to 0.8% and 0.6%, respectively.
The light curve of ZZ UMa varies during and between TESS sectors due to starspot evolution, which manifests itself as a slow variation with time (as spots rotate in and out of view), emission in the calcium H and K lines, and changes in the depths of the eclipses. By modelling each TESS half-sector separately, we have found slow variations in the light and surface brightness ratios between the stars indicative of spot-induced changes in their radiative properties. The geometric parameters (, and ) show much smaller changes because they are derived primarily from the contact points during the total and annular eclipses. We were therefore able to measure the radii of the stars to 0.5% precision. Unfortunately, no further observations with TESS are scheduled for this system. It would be interesting to identify a similar dEB in either the TESS continuous viewing zones or that has been observed using the Kepler satellite, for which the spot evolution could be tracked in the same way over a longer and/or better-sampled time period.
The properties of star A match predictions from the parsec models for an age of approximately 5.5 Gyr and a slightly super-solar metal abundance around . Star B does not match these or any other predictions, having too large a radius and too low a to agree with the theoretical models. Its luminosity is consistent with the models because the radius and offsets cancel. Star B therefore is an excellent example of the radius discrepancy well-known to affect low-mass eclipsing binaries, and at 0.97 is one of the most massive stars to clearly show this effect.
An alternative interpretation is that ZZ UMa is younger than we infer from matching star A to the predictions of theoretical models, and that both stars show the radius discrepancy. This could be investigated using dEBs with external constraints on their ages (and chemical compositions), e.g. via membership of an open cluster Me++04mn; Brogaard+11aa; Brogaard+12aa.
Acknowledgements
We thank Drs. Guillermo Torres, Patricia Lampens and Pierre Maxted for comments on draft versions of this work. This paper includes data collected by the TESS mission and obtained from the MAST data archive at the Space Telescope Science Institute (STScI). Funding for the TESS mission is provided by the NASA’s Science Mission Directorate. STScI is operated by the Association of Universities for Research in Astronomy, Inc., under NASA contract NAS 5–26555. The following resources were used in the course of this work: the NASA Astrophysics Data System; the SIMBAD database operated at CDS, Strasbourg, France; and the ariv scientific paper preprint service operated by Cornell University.
References
- 1 G. Torres, J. Andersen & A. Giménez, A&ARv, 18, 67, 2010.
- 2 J. Southworth, in Living Together: Planets, Host Stars and Binaries (S. M. Rucinski, G. Torres & M. Zejda, eds.), 2015, Astronomical Society of the Pacific Conference Series, vol. 496, p. 321.
- 3 J. Andersen, A&ARv, 3, 91, 1991.
- 4 J. Southworth, Universe, 7, 369, 2021.
- 5 F. Spada et al., ApJ, 776, 87, 2013.
- 6 J. A. Kirkby-Kent et al., A&A, 591, A124, 2016.
- 7 D. Graczyk et al., A&A, 594, A92, 2016.
- 8 S. V. Jeffers et al., MNRAS, 366, 667, 2006.
- 9 J. Wang et al., MNRAS, 504, 4302, 2021.
- 10 J. Wang et al., MNRAS, 511, 2285, 2022.
- 11 G. Torres, Astronomische Nachrichten, 334, 4, 2013.
- 12 S. Morrell & T. Naylor, MNRAS, 489, 2615, 2019.
- 13 E. Høg et al., A&A, 355, L27, 2000.
- 14 ESA (ed.), The Hipparcos and Tycho catalogues. Astrometric and photometric star catalogues derived from the ESA Hipparcos space astrometry mission, ESA Special Publication, vol. 1200, 1997.
- 15 C. H. S. Lacy, AJ, 104, 801, 1992.
- 16 R. M. Cutri et al., 2MASS All Sky Catalogue of Point Sources (The IRSA 2MASS All-Sky Point Source Catalogue, NASA/IPAC Infrared Science Archive, Caltech, US), 2003.
- 17 E. Geyer, R. Kippenhahn & W. Strohmeier, Kleine Veröff. Bamburg, 1955.
- 18 E. B. Janiashvili & M. I. Lavrov, IBVS, 3289, 1, 1989.
- 19 M. Döppner, Mitt. Veränd. Sterne, 1962.
- 20 N. V. Lavrova & M. I. Lavrov, Astronomicheskij Tsirkulyar, 1529, 11, 1988.
- 21 R. Clement et al., in IAU Colloq. 137: Inside the Stars (W. W. Weiss & A. Baglin, eds.), 1993, Astronomical Society of the Pacific Conference Series, vol. 40, pp. 386–391.
- 22 R. Clement et al., A&AS, 123, 1, 1997.
- 23 R. Clement et al., A&AS, 125, 529, 1997.
- 24 C. H. S. Lacy, AJ, 124, 1162, 2002.
- 25 Gaia Collaboration, A&A, 649, A1, 2021.
- 26 K. G. Stassun et al., AJ, 158, 138, 2019.
- 27 D. M. Popper, ApJS, 106, 133, 1996.
- 28 D. M. Popper, IBVS, 4185, 1, 1995.
- 29 C. H. S. Lacy & J. A. Sabby, IBVS, 4755, 1, 1999.
- 30 M. Imbert, A&A, 387, 850, 2002.
- 31 J. Southworth, The Observatory, 140, 247, 2020.
- 32 G. R. Ricker et al., Journal of Astronomical Telescopes, Instruments, and Systems, 1, 014003, 2015.
- 33 J. M. Jenkins et al., in Proc. SPIE, 2016, Society of Photo-Optical Instrumentation Engineers (SPIE) Conference Series, vol. 9913, p. 99133E.
- 34 D. M. Kipping, MNRAS, 427, 2487, 2012.
- 35 M. Oshagh et al., A&A, 549, A35, 2013.
- 36 J. Southworth, P. F. L. Maxted & B. Smalley, MNRAS, 351, 1277, 2004.
- 37 J. Southworth, A&A, 557, A119, 2013.
- 38 A. Claret, A&A, 600, A30, 2017.
- 39 H. N. Russell, ApJ, 35, 315, 1912.
- 40 Z. Kopal, Close Binary Systems (The International Astrophysics Series, London: Chapman & Hall), 1959.
- 41 J. Southworth, MNRAS, 386, 1644, 2008.
- 42 J. M. Kreiner, C.-H. Kim & I.-S. Nha, An atlas of O-C diagrams of eclipsing binary stars, 2001.
- 43 A. D. Mallama, ApJS, 44, 241, 1980.
- 44 J. Eastman, R. Siverd & B. S. Gaudi, PASP, 122, 935, 2010.
- 45 D. Hanzl, IBVS, 3615, 1, 1991.
- 46 C.-H. Kim et al., IBVS, 5694, 1, 2006.
- 47 I. B. Biro et al., IBVS, 5753, 1, 2007.
- 48 J. Hubscher, A. Paschke & F. Walter, IBVS, 5731, 1, 2006.
- 49 J. Hubscher, H.-M. Steinbach & F. Walter, IBVS, 5874, 1, 2009.
- 50 G. Samolyk, Journal of the American Association of Variable Star Observers, 36, 186, 2008.
- 51 L. Brát et al., Open European Journal on Variable Stars, 94, 2008.
- 52 J. Hubscher et al., IBVS, 5918, 1, 2010.
- 53 G. Samolyk, Journal of the American Association of Variable Star Observers, 38, 85, 2010.
- 54 J. Hubscher & P. B. Lehmann, IBVS, 6149, 1, 2015.
- 55 J. Hubscher, IBVS, 6152, 1, 2015.
- 56 A. Baranne, M. Mayor & J. L. Poncet, Vistas in Astronomy, 23, 279, 1979.
- 57 A. Baranne et al., A&AS, 119, 373, 1996.
- 58 J. Southworth, The Observatory, 141, 234, 2021.
- 59 G. E. Hale, ApJ, 28, 315, 1908.
- 60 J. H. Thomas & N. O. Weiss, Sunspots and starspots (Cambridge University Press, Cambridge, UK), 2008.
- 61 O. C. Wilson, ApJ, 153, 221, 1968.
- 62 R. W. Noyes et al., ApJ, 279, 763, 1984.
- 63 S. L. Baliunas et al., ApJ, 438, 269, 1995.
- 64 F. Allard et al., ApJ, 556, 357, 2001.
- 65 F. Allard, D. Homeier & B. Freytag, Philosophical Transactions of the Royal Society of London Series A, 370, 2765, 2012.
- 66 R. W. Hilditch, An Introduction to Close Binary Stars (Cambridge University Press, Cambridge, UK), 2001.
- 67 A. Prša et al., AJ, 152, 41, 2016.
- 68 J. Southworth, P. F. L. Maxted & B. Smalley, A&A, 429, 645, 2005.
- 69 D. M. Popper, ARA&A, 18, 115, 1980.
- 70 P. Kervella et al., A&A, 426, 297, 2004.
- 71 A. Bressan et al., MNRAS, 427, 127, 2012.
- 72 J. Southworth & J. V. Clausen, A&A, 461, 1077, 2007.
- 73 J. Southworth & D. M. Bowman, The Observatory, in press, arXiv:2205.08841, 2022.
- 74 D. T. Hoxie, A&A, 26, 437, 1973.
- 75 C. H. Lacy, ApJS, 34, 479, 1977.
- 76 M. López-Morales, ApJ, 660, 732, 2007.
- 77 G. A. Feiden, A&A, 593, A99, 2016.
- 78 J. M. Irwin et al., ApJ, 742, 123, 2011.
- 79 C. H. Blake et al., ApJ, 684, 635, 2008.
- 80 G. A. Feiden, B. Chaboyer & A. Dotter, ApJ, 740, L25, 2011.
- 81 P. F. L. Maxted et al., MNRAS, 513, 6042, 2022.
- 82 A. L. Kraus et al., ApJ, 845, 2017.
- 83 S. G. Parsons et al., MNRAS, 481, 1083, 2018.
- 84 Y. Chen et al., MNRAS, 444, 2525, 2014.
- 85 J. Southworth, P. F. L. Maxted & B. Smalley, MNRAS, 349, 547, 2004.
- 86 K. Brogaard et al., A&A, 525, A2, 2011.
- 87 K. Brogaard et al., A&A, 543, A106, 2012.