Twitter Topic Classification
Abstract
Social media platforms host discussions about a wide variety of topics that arise everyday. Making sense of all the content and organising it into categories is an arduous task. A common way to deal with this issue is relying on topic modeling, but topics discovered using this technique are difficult to interpret and can differ from corpus to corpus. In this paper, we present a new task based on tweet topic classification and release two associated datasets11 1 https://huggingface.co/datasets/cardiffnlp/tweet_topic_single22 2 https://huggingface.co/datasets/cardiffnlp/tweet_topic_multi. Given a wide range of topics covering the most important discussion points in social media, we provide training and testing data from recent time periods that can be used to evaluate tweet classification models. Moreover, we perform a quantitative evaluation and analysis of current general- and domain-specific language models on the task, which provide more insights on the challenges and nature of the task. †† ∗Equal contribution.
1 Introduction
Social media platforms, e.g., Twitter, Snapchat, TikTok and Instagram, provide an environment for content creation and information sharing among people. On social platforms, every individual can express their views about current events or anything that they care about, influencing and guiding discussions among their friends and followers. Social media platforms are highly studied to understand behaviors among users, groups, organizations, or even societies Yang et al. 2021, and in particular to understand opinion of people regarding a variety of topics such as politics Zhuravskaya et al. 2020, diversity and inclusion Chakravarthi 2020, TV shows Wohn and Na 2011, sports events Lim et al. 2015, or finance Hu et al. 2021. However, one of the biggest challenges in understanding this type of user generated content, is the noise and variety of these texts Morgan and Van Keulen 2014; Baldwin et al. 2013. Consequently, identifying topics within social media platforms from their posts is not a trivial task.
Existing solutions can be divided into topic modeling and topic classification. For topic modeling, topics are detected in an unsupervised way with models such as Latent Dirichlet Allocation (LDA) Blei et al. 2003 and subsequent variations Steyvers and Griffiths 2007. Similarly, solutions that use new BERT contextualized embeddings (like BERTopic Grootendorst 2022) have increased in popularity as they offer increased performance. However, these approaches assume that (i) all the topics of interest are represented in the documents included in the study, and (ii) the terms present in these documents are enough to characterize each topic. For these reasons, these methods are usually built as an ad-hoc analysis. Another limitation of these models is interpretability, as it is hard to generalize and label each cluster topic.
On the other hand, topic classification approaches the problem in a supervised manner and assigns multiple topics to each document based on a predefined set of categories. This approach overcomes the issues of interpretability and is not based on assumptions about the vocabulary distribution mentioned above. However, the downside of topic classification is that relies on curated datasets labeled by human annotators, and this can be expensive and time consuming to create.
In this paper, we introduce TweetTopic, a topic classification dataset on Twitter data. To the best of our knowledge, this is the first large-scale topic classification dataset specifically tailored to social media, rather than standard text as news articles Greene and Cunningham 2006 or scientific papers Lazaridou et al. 2021. The dataset consists of a total of 11,267 tweets collected through a time period from September 2019 to August 2021. Each tweet is assigned one or more topics from a predefined set of categories curated by social platform experts. Aiming to test the robustness of our dataset through time and across topics, we perform several classification experiments, both single-label and multi-label, while utilizing state-of-the-art language models.33 3 Tweet classification models associated with TweetTopic have been integrated into TweetNLP Camacho-Collados et al. 2022.
2 Related Work
Social media.
Social media have become an important aspect of the daily life of millions of people, with 81% of adults in the U.S. stating to have used at least one social platform in 2021 Auxier and Anderson 2021 and over 57% of people in EU interacting through social media in 2020 Eurostat 2021. In recent years, an increasing number of corporations seem to dedicate a more significant portion of their marketing funds to advertising on social platforms compared to other more traditional mediums Eid et al. 2020. At the same time, social media has become a political battleground where politicians both debate between them and try to communicate with their voters, Stier et al. 2018; Llewellyn and Cram 2016. Finally, social platforms have been used extensively by their users as a means for almost instantaneous news updates both for day-to-day events Hermida 2012, and human and natural disasters (e.g., the Ukrainian war or the COVID-19 pandemic) Khaldarova and Pantti 2016; Banda et al. 2021.
Therefore, a large volume of content is being generated in social media everyday. Its polymorphism also means that performing any targeted analysis on the data can be a challenging and time-consuming process Weller 2015; Stieglitz et al. 2018. Furthermore, even though there are various existing tools focused on analyzing social media data Batrinca and Treleaven 2015, there is no established way to efficiently identify and filter only relevant and valuable content Nugroho et al. 2020.
Topic modeling.
Topic models are unsupervised methods to identify relevant topics given a text corpus. LDA Blei et al. 2003 is one of the most popular algorithms for topic modeling. However, despite being successful in identifying topics in traditional media Martin and Johnson 2015; El Akrouchi et al. 2021, LDA often struggles when applied to short, unstructured, and constantly evolving texts, such as Twitter data Zhao et al. 2011. It also typically underperforms when compared to other supervised methods Arias et al. 2015. More recently, several variations of LDA have been proposed to address these challenges with social media texts, such as combining author-topic modelling with LDA Rosen-Zvi et al. 2004; Steinskog et al. 2017, frameworks like Twitter-LDA Zhao et al. 2011 where noisy words and author information are taken into account, and SKLDA Tajbakhsh and Bagherzadeh 2019, where semantic relations between words extracted from WordNet are taken into account.
However, LDA-based methods are often not ideal when we need to assign more than one topic to a document. Even though there are approaches to acquire multiple labels for each topic, they are usually based on hierarchical Griffiths et al. 2003 or graph Li and McCallum 2006 architectures which, depending on the use case, make assumptions about relations of the topics that may not be present in a given corpus (i.e. parent/children topics). Furthermore, semi-supervised or supervised variations of LDA, such as PLDA Ramage et al. 2011 and sLDA Mcauliffe and Blei 2007, have been been used on Twitter data Resnik et al. 2015; Ashktorab et al. 2014. While such methods have potential for increased performance they usually require prior labelling or information about the documents and thus remove a major advantage they have compared to supervised approaches.
Finally, as a mainly unsupervised technique, evaluating the results of topic modeling can be a hard task. Metrics such as purity, mutual information and pairwise F-measure are used to evaluate the quality of topics/clusters created by the models Nugroho et al. 2020. On the other hand, qualitative analysis is usually difficult to perform due to the lack of interpretability of topics produced and the difficulty increases with the amount of topic.
In contrast to traditional LDA approaches, techniques such as BERTopic Grootendorst 2022 and Top2Vec Angelov 2020 attempt to make use of existing knowledge from pretrained language models by extracting embedding representations of tweets and using them to perform topic clustering. Both BERTtopic and Top2Vec tend to be easier to use than LDA, without the need for extensive hyper-parameter tuning, and often result in increased performance Egger and Yu 2022. However, they do have disadvantages, namely: not performing well on small datasets Abuzayed and Al-Khalifa 2021, generating a lot of outlier topics Silveira et al. 2021, and requiring existing knowledge. Finally, these approaches suffer similar drawbacks to LDA regarding evaluation and interpretability.
Topic classification.
Given a text as an input, topic classification is the task of associating it with a specific topic (or topics) from a pre-defined set of categories. In what concerns social media, previous work has focused on predicting hashtags as classes Dhingra et al. 2016. However, the dynamic nature of the events discussed in those platforms makes any dataset focused on hashtags quickly become sparse and outdated. Any new model needs to be trained from scratch since the category set will be different based on the relevance of hashtags. Nevertheless, by focusing on higher-level topics like Sports or Arts & Culture, widespread and recurrent in social platforms, the data can be leveraged for more extended periods, and any model trained on it can be easily updated with more data as the label set is fixed. It also improves interpretability since there is a clear semantic meaning to the proposed categories, while hashtags might be ambiguous or require additional interpretation.
In terms of previously released data, existing datasets mainly focus on the news articles domain, e.g., BBC News Greene and Cunningham 2006, Reuter Lewis et al. 2004, 20 Newsgroups Lang 1995, and WMT News Crawl Lazaridou et al. 2021 with few exceptions like scientific (arXiv) Lazaridou et al. 2021 and medical (Ohsumed) Hersh et al. 1994 domains. Therefore, these datasets offer different sets of challenges with respect to social media.
3 Tweet Topic Classification
This section presents the pipeline to construct TweetTopic, our topic classification dataset based on Twitter data. This pipeline is divided into three steps: (i) tweet collection, (ii) data filtering, and (iii) topic annotation. These steps are explained in more detail in the next subsections.
3.1 Tweet collection
Our goal is to collect a set of tweets with a high coverage of diverse topics over time. We fetched the tweets given specific keywords and time periods using the Twitter API. Since the tweets returned by the API are in reverse chronological order, we decided to split the queries into small time windows to make sure that the tweets are distributed over time. In our case, we queried 50 tweets every two hours from September 2019 to October 2021. As the keywords used to create queries, we collected lists of trending topics from Snapchat44 4 Available at https://trends.snapchat.com/. We were not able to access Twitter trends since they are not publicly available through APIs. in each week during the period (e.g. pink super moon, social distancing, and NBA). This step allowed us to collect tweets with a similar distribution to topics in the real world over time. For this step we also added conditions to exclude retweets, replies, quotes, and tweets with media, as well as specifying the language as English only. In the end, we collected a total of 1,264,037 raw tweets from the API.

3.2 Data Filtering
Tweet filtering.
Since the raw tweets may contain irrelevant content, we applied several text filtering techniques to get a cleaner tweets corpus. Our text filtering pipeline consists of two steps as described in Figure 1: pre-filtering and near-deduplication. This filtering fulfilled different goals such as removing abusive content, improving quality and avoiding near-duplicates. In the pre-filtering, we first removed non-English tweets by using a fastText based language identifier55 5 https://fasttext.cc/blog/2017/10/02/blog-post.html Bojanowski et al. 2016. Then, we removed tweets that contained incomplete sentences (e.g., too short or end in the middle of the sentence) or abusing words by using rule-based heuristics. Then, we applied a near-duplication filter to drop duplicated tweets. In particular, we first normalized each tweet, and kept unique tweets only in terms of their normalized form. The normalizer first converted full-width to half-width and removed substrings from the tweet such as emoji, web URLs, punctuation, stopwords, and personally identifiable information (PII).66 6 We detected PII with scrubadub and other components are all based on NLTK. Then, we lemmatized and lowercased each word in the tweets and removed identical tweets after normalization.
Trend filtering.
Given our budget and in order to further reduce the number of tweets to annotate while ensuring diversity, we grouped the tweets by the trending topics used to query the raw tweets in each week, and selected the top 15 most common trends within the week.77 7 More details about this process can be found in the Appendix. We applied the trending topic filtering for every week which resulted in our final dataset, consisting of 28,573 tweets in total. Note that the trends are different every week, so the tweets are diverse across weeks regarding the trends.88 8 In the Appendix we provide a detailed breakdown of the distribution of trends in each week. There, we can confirm that the top trend does not go beyond 20% in most cases, which ensures a diverse set of trends.
3.3 Annotation
To attain topic annotations over the tweets, we conducted a manual annotation on Amazon Mechanical Turk. We randomly sampled 11,374 tweets from the cleaned tweets and each tweet was annotated by five annotators, collecting 56,870 annotations in total. We manually constructed a topic taxonomy that contained 23 initial topics across diverse genres, asked workers to annotate the relevant (possibly multiple) topics to the tweet.99 9 The actual instructions shown to workers are included in the Appendix. The initial list of 23 topics was shared with us by a research team of Snapchat. This list was selected and curated by a team of social media experts from the company over time to ensure a tailored coverage of social media content.
We ensured several quality control mechanisms within the test, including a qualification test. Each tweet was annotated by five turkers and the final budget for the total estimated annotation cost was $4,000. Each single assignment contained 50 tweets to be annotated where each annotation is completed with an interface that we include in the Appendix. As quality control, each assignment contained three qualification tweets and only those who annotated them correctly were accepted. A small number of raters (10) and their respective tweets were also discarded as they displayed unusual behavior selecting on average more than 5 labels for each tweet where the global average was 1.6 labels per tweet. Also, workers were not allowed to work on the assignment more than once.
Post-aggregation.
We followed Mohammad et al. 2018 by assigning a label to a tweet provided that the label was suggested by at least two annotators. We opted out of a majority rule as this way our dataset can be used to develop more robust systems that can handle real-world data, which are rarely straightforward and instead can often contain complex linguistic phenomena Mohammad et al. 2018. Tweets where none of the classes received at least two votes were discarded. The number of tweets in each process is summarized in Table 1.
| Raw | Pre-filter | De-duplication | Trend-filter | Annotated |
| 1,264,037 | 596,028 | 202,604 | 28,573 | 11,267 |
Inter-annotator agreement.
Several metrics can be used to evaluate the quality of an annotation task Artstein and Poesio 2008 and it is often difficult to select the most appropriate one. In our experiment, we utilized Krippendorff’s alpha Krippendorff 2011 with MASI distance Passonneau 2006, which is a common combination when dealing with multi-rater and multi-label tasks Artstein and Poesio 2008. For our task the alpha statistic results in 0.35. As a comparison reference, a completely random annotation would produce a 0 alpha statistic. When considering the percent agreement of each pair of annotators we acquire a value of 0.87 in contrast to 0.62 for random annotation. These inter-annotator agreement results appear to be inline or slightly better then previous similar multi-label annotation tasks Mohammad et al. 2018.
3.4 Settings and temporal split
In order to investigate potential temporal differences in the corpus we split the datasets into two periods: (1) from September 2019 to August 2020 (referred to as training data) and (2) from September 2020 to August 2021 (test data). The motivation behind this temporal split is to make the task more realistic and evaluate the generalizability performance of the classifiers on future data.
We established two classification settings: (1) multi-label and (2) single-label. Sample instances from both settings are displayed in Table 2.1010 10 For readability, tweet examples have been slightly modified within the paper, removing links and usernames which are anonymized in the dataset. With this distinction, we aim to provide flexibility to users, and increase the usability of the dataset for settings and analyses, where a more fine-grained classification of tweets is not required (i.e. single-label).
Tweet Topics Apple Removed More Than 30,000 Apps From The Chinese App Store - bus & ent - news & soc - sci & tech #copreps Football: End of the line for FLHS season sports & games
Multi-label.
By applying a final post-aggregation step to exclude categories that may not be relevant for social media, we removed those categories with fewer than 50 labels overall, leaving a final set of 19 topics.
Single-label.
In an effort to keep the classes relatively balanced, we firstly excluded tweets that were labeled with the most dominant of the classes, i.e., news & social concern (32.82% of total tweets), which is highly cross-category. Following this, the remaining ten most prominent classes were considered. Finally, based on logical assumptions regarding the similarity of the classes and also the overlap between them, several labels were grouped together. More specifically: gaming and sports (35% overlap) were grouped as sports & gaming; music, celebrity & pop culture, and film tv & video (44% and 31% overlap) became pop culture; diaries & daily life and family (54% overlap) were grouped together as daily life. These three new classes along with the original arts & culture, business & entrepreneurs, and science & technology composed the final set of topics. Finally, in this setting, tweets containing more than one of these six labels were dropped.
3.5 Statistics

The final set of annotated tweets is 11,267 and 6,997 for the multi-label and single-label settings, respectively. Figures 2 and 3 display the percentage of tweets that were classified in each topic, for each time period studied, after the aggregation of annotations for multi-label and single-label settings, respectively.1111 11 For the multi-label setting the percentages sum up to more than 100% due to the nature of the annotation. The imbalanced nature that can be observed, e.g., sports consisting of 26% of the 2019/20 multi-label dataset while travel & adventure only 2%, is explained due to the way tweets were collected, where we aimed to mimic the distribution of real-world data on Twitter.

Number of labels.
When considering the multi-label setting, 50% of the tweets are classified with only one label while only 2.7% are given four or more labels, with the maximum amount being six. However, the dataset is diverse enough with 35% and 12% of the tweets having two and three labels respectively. This coder behavior (i.e. preferring to select only one class) can be observed on similar multi-label annotation tasks Véronis 1998; Poesio and Artstein 2005.
Class length punc upp/low # @ emojis mtld count arts & culture 166.9 ±67.5 6.5 ±3.4 0.2 ±0.6 0.8 ±1.4 0.4 ±0.5 0.1 ±0.3 140.9 577 business & entrepreneurs 186.3 ±65.5 6.4 ±3.1 0.1 ±0.2 0.6 ±1.1 0.5 ±0.5 0.0 ±0.2 159.0 554 celebrity & pop culture 155.5 ±67.8 7.4 ±3.7 0.2 ±0.9 0.6 ±1.0 0.8 ±0.7 0.1 ±0.4 145.8 1685 diaries & daily life 168.3 ±68.4 5.4 ±3.3 0.1 ±0.7 0.4 ±0.9 0.4 ±0.5 0.1 ±0.5 132.5 1525 family 165.1 ±68.5 5.2 ±3.2 0.2 ±1.4 0.5 ±1.0 0.4 ±0.5 0.2 ±0.5 112.7 358 fashion & style 147.9 ±55.4 7.8 ±3.1 0.2 ±0.5 1.0 ±1.5 0.6 ±0.5 0.1 ±0.3 98.8 251 film tv & video 157.7 ±66.3 7.5 ±3.7 0.2 ±0.8 0.6 ±1.1 0.7 ±0.6 0.1 ±0.4 145.1 1723 fitness & health 195.4 ±67.1 6.3 ±2.8 0.1 ±0.1 0.5 ±0.9 0.6 ±0.5 0.1 ±0.3 168.5 508 food & dining 165.2 ±64.5 6.1 ±3.1 0.1 ±0.2 0.5 ±1.0 0.4 ±0.5 0.1 ±0.4 154.7 255 gaming 159.6 ±68.9 6.5 ±3.9 0.1 ±0.2 0.5 ±1.0 0.5 ±0.6 0.0 ±0.2 128.4 437 learning & educational 191.8 ±65.8 5.9 ±2.9 0.1 ±0.1 0.6 ±1.0 0.5 ±0.6 0.0 ±0.2 156.7 293 music 143.5 ±64.0 8.4 ±4.4 0.3 ±1.1 0.7 ±1.1 0.8 ±0.7 0.1 ±0.5 119.8 1919 news & social concern 183.1 ±70.5 6.6 ±3.0 0.2 ±1.3 0.4 ±0.8 0.6 ±0.6 0.0 ±0.2 165.1 3698 other hobbies 160.9 ±69.2 6.3 ±3.4 0.2 ±0.7 0.6 ±1.0 0.4 ±0.6 0.1 ±0.4 143.6 568 relationships 162.4 ±70.6 5.3 ±3.5 0.2 ±1.6 0.4 ±0.9 0.5 ±0.6 0.2 ±0.9 111.9 432 science & technology 177.9 ±69.4 6.7 ±2.8 0.1 ±0.5 0.5 ±1.0 0.6 ±0.5 0.0 ±0.1 164.2 542 sports 162.8 ±65.9 6.4 ±3.2 0.2 ±1.4 0.5 ±0.8 0.7 ±0.6 0.1 ±0.3 152.8 2977 travel & adventure 175.2 ±72.3 6.2 ±3.1 0.2 ±1.8 0.5 ±1.0 0.5 ±0.5 0.1 ±0.2 173.1 190 youth & student life 202.0 ±62.4 5.9 ±3.2 0.1 ±0.1 0.5 ±0.9 0.5 ±0.6 0.1 ±0.2 155.6 174
Class distribution across time periods.
We note that the distribution of classes between the two time periods studied remains largely similar in both settings with the largest difference being in the music and news & social concern classes being 3.5% more populous in 2019/20. This observation suggests that our curated topics are broad enough to be relatively robust to temporal trends.
Topic features.
In order to get a better understanding of the data, and to investigate potential significant characteristics, we extract various statistics from the tweets in the multi-label dataset. Table 3 displays the average values of tweet length, number of punctuation symbols, upper to lower case ratio, number of hashtags, number of mentions and number of emojis, along with their standard deviations for each topic. In order to have a fair comparison, all the metrics are normalized based on the tweet length (). The Measure of Textual Lexical Diversity (MTLD) McCarthy and Jarvis 2010 is also reported as an indication on the vocabulary richness of each class, as well as the number of tweets for each class. The topics celebrity & pop culture and music have the highest occurrences of mentions "@" (0.8). This is intuitively due to the fact that a large number of tweets belonging to these classes will mention recognizable users such as artists or athletes. Similarly, tweets belonging to the fashion & style topic tend to include more hashtags (#) on average (1 hashtag per tweet), which can be attributed to the nature of hashtags in Twitter, usually employed to indicate popular and trending topics. Finally, topics that can be considered more accessible to the general public such as fashion & style, family, and relationships achieve a relatively low lexical diversity score (98.8, 112.7, 111.9) while more specialized or advanced topics such as travel & adventure, business & entrepreneurs and fitness & health display higher lexical diversity (173.1, 159.0, 168.5).
4 Evaluation
In this section, we present our experimental results.
4.1 Experimental setting
Datasets. We perform experiments in our tweet classification annotated datasets. In particular, our experiments are based on two settings, single-label and multi-label (see Section 3.4 for details).
Comparison systems. To evaluate our dataset, we first use simple baselines: Majority (most frequent class in training) and Random (uniform probability for each class). As comparison systems, we train a traditional bag of words with SVM and a fastText classifier Bojanowski et al. 2016 that utilizes pretrained embeddings Mikolov et al. 2018. Furthermore, BERT base and large Devlin et al. 2018 and both base and large versions of RoBERTa Liu et al. 2019 are used as comparison systems. As classifiers specialized on social media, i.e. trained on Twitter data, BERTweet Nguyen et al. 2020, TimeLM-19, and TimeLM-21 Loureiro et al. 2022, all based on a RoBERTa architecture, are also utilized. BERTweet is trained on a corpus of 845M tweets mainly from 01/2012 to 08/2019, while also including 5M COVID-19 related tweets from 01/2020 to 03/2020. On the other hand, TimeLM-19 is trained on 95M tweets gathered between 2018 and 2019. For completeness, we also report results of TimeLM-21, trained on 125M tweets from 2018 to 2021, but excluded it from our main analysis given the time overlap with the test set (reminder that one of the motivations of this task is to be able to process tweets in real time). TimeLMs models use the RoBERTa-base model as initial checkpoint, while BERTweet is trained from scratch. The implementations provided by Hugging Face Wolf et al. 2019 are used to train and test all language models.1212 12 More details about the exact hyperparameters are included in the Appendix.
Evaluation metrics. For both settings macro average Precision, Recall and F1, as well as Accuracy, are used to evaluate the models tested. As an alternative metric for the multi-label setting, Jaccard Index (JI) is also utilized, as it can offer useful insights about the models performances Pereira et al. 2018; Tsoumakas et al. 2009. More specifically, the index is calculated for each tweet individually and the final metric is computed as the average over all entries.
4.2 Results
Table 4 displays the results of all comparison system on both settings. While only a number of models were tested, the results suggest that domain-specific knowledge appears to be more important than the size of the model, with Twitter base models outperforming large generic language models. Given the larger number of labels and more challenging setting, multi-label classification appears to be most challenging setting with the best model TimeLM-21, barely achieving 58.8% F1 and 67.6% Jaccard scores, in comparison to 70.1% F1 and 86.8% Accuracy in the single-label setting. However, it is important to note that TimeLM-21 has the unfair advantage of being trained with a more recent corpus and more specifically a corpus from the same time period as the test set. Taking this into consideration, the next best performing model is TimeLM-19 with 57.2% and 70% F1 scores, for the multi-label and single-label settings respectively. Even though the differences in the average F1 scores between the two models is relatively small, 1.6% and 0.1% for multi/single settings, when taking into account their performance in each individually topic, we can identify topics where TimeLM-21 clearly outperforms TimeLM-19 (see Section 5.1 for more details).
Model Multi-label Single-label Pr Rec F1 Acc JI Pr Rec F1 Acc Baselines Random 8.4 48.3 12.6 0 7.9 15 14.2 11.9 15.5 Majority 1.5 5.3 2.3 18.0 22.6 6.7 16.7 9.5 40 SVM 69.4 23.7 30.5 37.1 51.8 73.6 47.4 50.2 75.8 fastText 67.0 18.0 24.0 31.9 43.5 56.0 46.0 48.0 74.0 Language models BERT-base 69.7 42.5 50.1 45.5 63.9 62.4 60.0 58.8 81 BERT-large 64.4 51.5 56.4 44.6 65.1 62.4 61.7 61.7 84.3 RB-base 68.5 49.2 55.8 46.5 66.2 64.8 66.7 65.6 85.9 RB-large 72.2 48.9 56.3 47.9 67.7 66.1 56.2 58.3 84.5 BERTweet 66.9 46.1 52.7 47.1 66.9 64.9 65.6 63.8 85.2 TimeLM-19 71.1 50.4 57.2 47.7 67.5 76.5 68.9 70.0 86.4 TimeLM-21 66.1 54.2 58.8 47.1 67.6 73.9 69.8 70.1 86.8
5 Analysis
In this section, we analyse two important aspects of the TweetTopic dataset, mainly its temporal dimension (Section 5.1) and the errors made by the systems (Section 5.2).
5.1 Temporal analysis
The strong performance of TimeLM-21 provided evidence regarding the importance of an up-to-date training corpus. We continue our investigation by training the same set of models on a random split of the data (i.e., both training and test sets with tweets from 2019 to 2021). To make the results comparable, we created training and test sizes of the same size as the original temporal split.1313 13 While the distribution of labels may naturally be altered, this change is minimal, as we can recall from Figures 2 and 3.
Class Random SVM BERT RB RB-large BERTweet TimeLM-19 TimeLM-21 temp rand temp rand temp rand temp rand temp rand temp rand temp rand temp rand arts & culture 8.6 8.3 3.6 27.7 17.8 35.9 20.9 41.2 28.0 44.0 9.8 28.2 21.3 39.1 35.4 44.8 business & entrepreneurs 8.7 7.4 18.0 28.7 53.3 49.2 56.7 57.1 50.9 56.5 59.7 54.5 58.6 55.3 56.3 54.0 celebrity & pop culture 22.8 22.9 22.3 41.7 34.4 54.3 47.2 52.7 50.5 59.6 43.7 54.9 48.6 47.8 46.4 57.6 diaries & daily life 18.2 21.2 25.8 34.4 45.2 44.0 46.2 50.3 43.5 49.3 44.6 49.9 44.5 51.2 44.7 49.8 family 3.5 6.3 33.9 46.4 47.2 48.3 50.6 56.8 52.8 63.4 46.1 49.1 46.4 55.2 53.1 56.2 fashion & style 4.8 4.1 38.4 57.6 52.8 74.8 66.4 74.1 66.4 77.4 56.0 68.8 66.4 75.2 67.2 75.2 film tv & video 22.8 22.0 47.3 58.6 62.8 68.2 64.4 71.4 64.7 71.3 66.8 69.2 66.1 72.2 65.4 70.6 fitness & health 6.6 9.3 35.7 36.0 53.6 52.2 52.4 53.2 62.4 65.4 48.2 38.7 55.7 42.2 58.6 52.6 food & dining 3.5 4.6 25.0 41.7 70.1 68.2 75.1 75.3 79.3 68.2 74.5 65.7 75.4 70.7 80.4 71.6 gaming 6.9 7.5 31.8 45.0 57.4 61.2 58.4 61.4 63.8 69.1 66.1 67.6 64.6 69.2 64.8 71.2 learning & educational 4.2 4.5 13.0 13.9 38.2 43.2 49.5 48.7 49.8 45.8 42.9 36.2 49.3 47.1 48.9 47.0 music 24.7 25.5 76.1 81.8 83.6 86.0 86.0 87.1 87.4 88.1 86.9 87.2 88.1 87.8 86.9 88.2 news & social concern 39.3 39.9 69.8 76.9 83.8 83.8 83.9 84.6 85.5 85.9 83.5 84.3 84.4 86.2 84.5 85.0 other hobbies 10.5 9.6 4.2 15.0 27.0 23.6 25.0 28.4 31.7 35.4 23.1 21.5 27.7 30.3 31.1 26.2 relationships 6.4 7.3 13.7 36.3 30.8 35.2 37.6 51.8 39.3 56.8 36.8 51.2 35.3 51.6 44.5 54.0 samples avg 13.8 14.3 57.0 63.7 70.3 72.0 73.1 74.2 74.4 76.4 73.8 73.2 74.3 75.2 74.7 75.2 science & technology 8.3 9.3 17.4 35.8 45.9 50.3 54.2 56.4 52.1 59.4 46.9 53.2 50.5 56.0 50.2 52.1 sports 36.6 34.8 82.2 89.1 93.1 93.2 94.8 94.2 94.6 95.4 95.4 94.4 95.6 94.8 95.2 94.8 travel & adventure 2.2 3.5 17.7 9.8 21.7 20.6 41.5 47.7 46.3 59.9 38.5 0.0 57.1 56.0 52.2 54.7 youth & student life 1.7 2.9 2.9 12.4 33.3 44.6 49.2 52.4 21.0 46.0 31.6 35.2 50.4 43.6 50.8 51.0 macro avg 12.6 13.2 30.5 41.5 50.1 54.6 55.8 60.3 56.3 63.0 52.7 53.1 57.2 59.6 58.8 60.9

Table 5 displays the F1 scores, while using a multi-label setting for each class in both the temporal and random splits. Every model tested performs better when trained using information from both time periods, i.e using random split. Taking into account that in both splits the distribution of classes is similar (Figure 2), we can assume that the temporal differences in the data provide useful information. It is worth noting that the "specialized" Twitter models display a more robust performance regarding the training data used. In particular, there are 8, 9 and 4 topics where BERTweet, TimeLM-19, and TimeLM-21 respectively perform better while using the temporal split in contrast to 3 and 1 of RoBERTa base and large respectively (models that have a similar architecture).
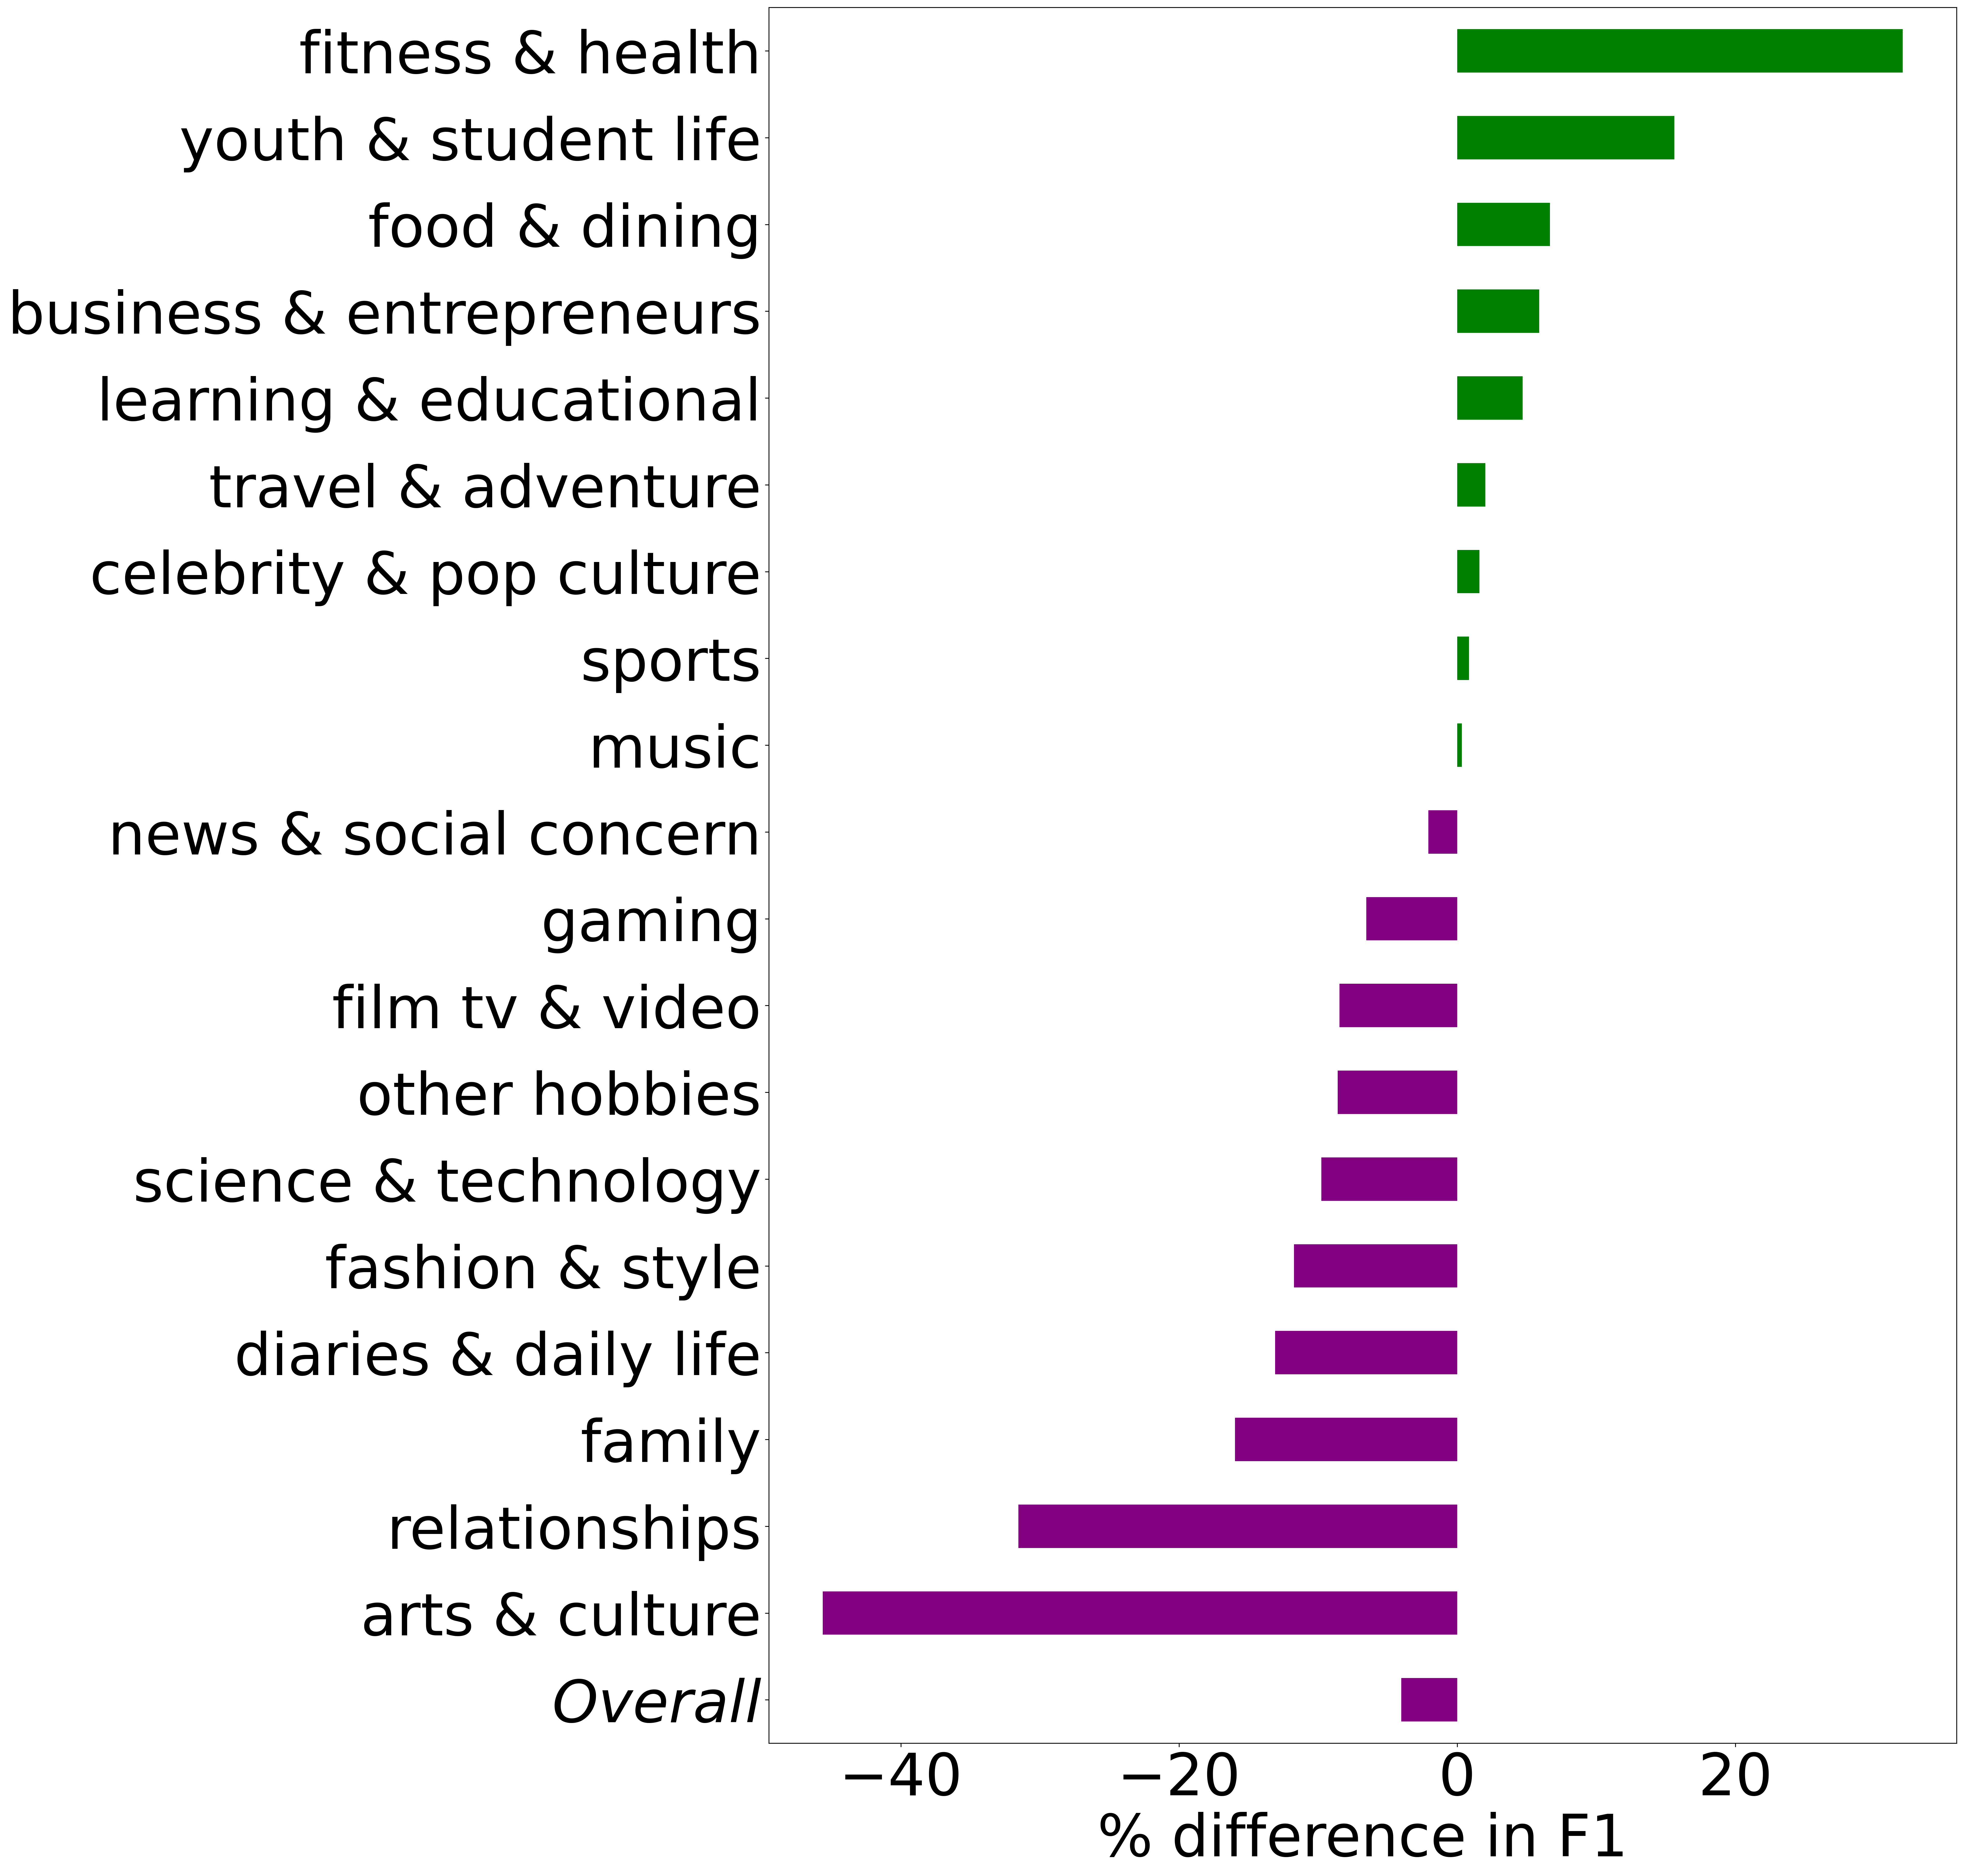
We continue our analysis by investigating in more detail TimeLM-19’s results, which is the best performing model according to the evaluation (Section 4). Figure 4 displays the TimeLM-19 performance differences between the temporal and random splits on the single-label setting. In general, results are overall better in the random split, with an overall relative decrease of 4.3% in Macro-F1 for the temporal split. The largest decrease in performance is observed for the arts & culture topic in both settings, which can be attributed to a fast evolving vocabulary. In contrast, business & entrepreneurs does not see any decreased in performance in both settings, and results are even slightly better on the temporal split.1414 14 In the Appendix we provide a detailed analysis by quarter, in order to better understand the temporal aspect. The results confirm how the performance of arts & culture decreases over time, while for the rest of the topics the trend is unclear.

5.2 Error analysis
To better understand the nature of errors made by language models, Figure 5 shows a confusion matrix for the best-performing TimeLM-19 model in the single-label setting. The model seems to struggle with tweets assigned to the arts & culture topic with 68% of them being misclassified as daily life. These errors include entries such as “Happy Day of the Dead 2020! #GoogleDoodle” or “Gifts of love are the ingredients of a #MerryChristmas Give your loved ones a physical/virtual crypto gift card within the {{USERNAME}} app”. While these tweets revolve around religious/cultural holidays, one might also associate them to daily life events, which also shows the challenging nature of this dataset. Another topic that is frequent misclassified is science & technology, with 41% of the tweets being assigned to the wrong topic. When looking at the errors we identify tweets such as “Bill Gates-Funded Company Releases Genetically Modified Mosquitoes in US”, classified as business & entrepreneurs, and “Monday’s Google Doodle Celebrates Jupiter And Saturn On The Winter Solstice via Forbes”, classified as daily life. In other cases, further investigation would be required to understand the source of the mistakes, e.g., “A year ago we looked at PE10s across the world on URL The latest Weekly Macro Themes takes a look at how the Euro Area stacks up now.” was classified as sports instead business & entrepreneurs. The nature of these types of error, as well as the relatively low performance of models compares to other topic classification datasets, suggest that there is ample room for improvement.
When considering the multi-label setting, there are topics with high percentage of errors such as celebrity & pop culture and diaries & daily life. There are entries like “Anyone else notice {O Shea Jack Nichol son} hasn’t tweeted about the Lakers making the conference finals? Weird. You good man?” where the model correctly classifies it as sports but fails to classify it as celebrity & pop culture, being probably unaware of the celebrity status of the person being mentioned. The diaries & daily life topic seems to be particular confusing for the model and fails to identify it in tweets such as “Lost all my bets on the Kentucky Derby today but scored a tee time at {{USERNAME}} Black course next weekend I’d say I came out a winner.”, and “Faceing difficulty while login to internet banking for the 1st time using Id and password provided in the welcome kit didn t expected this from such a good bank {Canara Bank}”, even though they are correctly assigned the sports and business & entrepreneurs topics, respectively.
6 Conclusions & Future Work
In this paper we presented TweetTopic, the first large-scale dataset for tweet topic classification. Given the prominence of social media in recent times, this dataset can help build supervised models for clustering and organising the online content. The curated set of topics contains a diverse and broad set of categories that cover most topics present in social platform data. This dataset can further motivate research on the evolution of these initial topics on social platforms, i.e., the extension of the existing categorization to new topics or subtopics that will emerge and fade over time due to user engagement. Moreover, TweetTopic has been shown to be relatively resilient to temporal changes, and it offers easily interpretable results. Based on these contributions, we believe that this dataset will be useful for a significant number of researchers and practitioners working on social media, including Computational Social Science and Data Mining experts, given the relevance of the topic for extracting information and understanding online behavior.
Finally, while this first iteration of TweetTopic focuses on English, our aim is to apply the same methodology to other languages, for which our guidelines and process to construct the dataset described in Section 3 can serve as the main basis.
Acknowledgements
Jose Camacho-Collados is supported by a UKRI Future Leaders Fellowship.
References
- Abuzayed and Al-Khalifa (2021) Abeer Abuzayed and Hend Al-Khalifa. 2021. Bert for arabic topic modeling: An experimental study on bertopic technique. Procedia Computer Science, 189:191–194.
- Angelov (2020) Dimo Angelov. 2020. Top2vec: Distributed representations of topics.
- Arias et al. (2015) Andrés Arias, Luis H Martínez, Ricardo A Hincapie, Mauricio Granada, et al. 2015. An ieee xplore database literature review regarding the interaction between electric vehicles and power grids. 2015 IEEE PES Innovative Smart Grid Technologies Latin America (ISGT LATAM), pages 673–678.
- Artstein and Poesio (2008) Ron Artstein and Massimo Poesio. 2008. Inter-coder agreement for computational linguistics. Computational linguistics, 34(4):555–596.
- Ashktorab et al. (2014) Zahra Ashktorab, Christopher Brown, Manojit Nandi, and Aron Culotta. 2014. Tweedr: Mining twitter to inform disaster response. In ISCRAM, pages 269–272. Citeseer.
- Auxier and Anderson (2021) Brooke Auxier and Monica Anderson. 2021. Social media use in 2021. Pew Research Center, 1:1–4.
- Baldwin et al. (2013) Timothy Baldwin, Paul Cook, Marco Lui, Andrew MacKinlay, and Li Wang. 2013. How noisy social media text, how diffrnt social media sources? In Proceedings of the Sixth International Joint Conference on Natural Language Processing, pages 356–364.
- Banda et al. (2021) Juan M Banda, Ramya Tekumalla, Guanyu Wang, Jingyuan Yu, Tuo Liu, Yuning Ding, Ekaterina Artemova, Elena Tutubalina, and Gerardo Chowell. 2021. A large-scale covid-19 twitter chatter dataset for open scientific research—an international collaboration. Epidemiologia, 2(3):315–324.
- Batrinca and Treleaven (2015) Bogdan Batrinca and Philip C Treleaven. 2015. Social media analytics: a survey of techniques, tools and platforms. Ai & Society, 30(1):89–116.
- Blei et al. (2003) David M. Blei, Andrew Y. Ng, and Michael I. Jordan. 2003. Latent dirichlet allocation. J. Mach. Learn. Res., 3(null):993–1022.
- Bojanowski et al. (2016) Piotr Bojanowski, Edouard Grave, Armand Joulin, and Tomas Mikolov. 2016. Enriching word vectors with subword information. arXiv preprint arXiv:1607.04606.
- Camacho-Collados et al. (2022) Jose Camacho-Collados, Kiamehr Rezaee, Talayeh Riahi, Asahi Ushio, Daniel Loureiro, Dimosthenis Antypas, Joanne Boisson, Luis Espinosa-Anke, Fangyu Liu, Eugenio Martínez-Cámara, et al. 2022. Tweetnlp: Cutting-edge natural language processing for social media. arXiv preprint arXiv:2206.14774.
- Chakravarthi (2020) Bharathi Raja Chakravarthi. 2020. Hopeedi: A multilingual hope speech detection dataset for equality, diversity, and inclusion. In Proceedings of the Third Workshop on Computational Modeling of People’s Opinions, Personality, and Emotion’s in Social Media, pages 41–53. Association for Computational Linguistics.
- Devlin et al. (2018) Jacob Devlin, Ming-Wei Chang, Kenton Lee, and Kristina Toutanova. 2018. BERT: pre-training of deep bidirectional transformers for language understanding. CoRR, abs/1810.04805.
- Dhingra et al. (2016) Bhuwan Dhingra, Zhong Zhou, Dylan Fitzpatrick, Michael Muehl, and William Cohen. 2016. Tweet2vec: Character-based distributed representations for social media. In Proceedings of the 54th Annual Meeting of the Association for Computational Linguistics (Volume 2: Short Papers), pages 269–274, Berlin, Germany. Association for Computational Linguistics.
- Egger and Yu (2022) R Egger and J Yu. 2022. A topic modeling comparison between lda, nmf, top2vec, and bertopic to demystify twitter posts. Front. Sociol. 7: 886498. doi: 10.3389/fsoc.
- Eid et al. (2020) M Eid, N Nusairat, Mahmud Alkailani, and H Al-Ghadeer. 2020. Internet users’ attitudes towards social media advertisements: The role of advertisement design and users’ motives. Management Science Letters, 10(10):2361–2370.
- El Akrouchi et al. (2021) Manal El Akrouchi, Houda Benbrahim, and Ismail Kassou. 2021. End-to-end lda-based automatic weak signal detection in web news. Knowledge-Based Systems, 212:106650.
- Eurostat (2021) Eurostat. 2021. Do you participate in social networks?
- Greene and Cunningham (2006) Derek Greene and Pádraig Cunningham. 2006. Practical solutions to the problem of diagonal dominance in kernel document clustering. In Proceedings of the 23rd international conference on Machine learning, pages 377–384.
- Griffiths et al. (2003) Thomas Griffiths, Michael Jordan, Joshua Tenenbaum, and David Blei. 2003. Hierarchical topic models and the nested chinese restaurant process. Advances in neural information processing systems, 16.
- Grootendorst (2022) Maarten Grootendorst. 2022. Bertopic: Neural topic modeling with a class-based tf-idf procedure.
- Hermida (2012) Alfred Hermida. 2012. Social journalism: Exploring how social media is shaping journalism. The handbook of global online journalism, 12:309–328.
- Hersh et al. (1994) William Hersh, Chris Buckley, TJ Leone, and David Hickam. 1994. Ohsumed: An interactive retrieval evaluation and new large test collection for research. In SIGIR’94, pages 192–201. Springer.
- Hu et al. (2021) Danqi Hu, Charles M Jones, Valerie Zhang, and Xiaoyan Zhang. 2021. The rise of reddit: How social media affects retail investors and short-sellers’ roles in price discovery. Available at SSRN 3807655.
- Khaldarova and Pantti (2016) Irina Khaldarova and Mervi Pantti. 2016. Fake news: The narrative battle over the ukrainian conflict. Journalism practice, 10(7):891–901.
- Krippendorff (2011) Klaus Krippendorff. 2011. Computing krippendorff’s alpha-reliability.
- Lang (1995) Ken Lang. 1995. Newsweeder: Learning to filter netnews. In Machine Learning Proceedings 1995, pages 331–339. Elsevier.
- Lazaridou et al. (2021) Angeliki Lazaridou, Adhi Kuncoro, Elena Gribovskaya, Devang Agrawal, Adam Liska, Tayfun Terzi, Mai Gimenez, Cyprien de Masson d’Autume, Tomas Kocisky, Sebastian Ruder, et al. 2021. Mind the gap: Assessing temporal generalization in neural language models. Advances in Neural Information Processing Systems, 34.
- Lewis et al. (2004) David D Lewis, Yiming Yang, Tony Russell-Rose, and Fan Li. 2004. Rcv1: A new benchmark collection for text categorization research. Journal of machine learning research, 5(Apr):361–397.
- Li and McCallum (2006) Wei Li and Andrew McCallum. 2006. Pachinko allocation: Dag-structured mixture models of topic correlations. In Proceedings of the 23rd international conference on Machine learning, pages 577–584.
- Lim et al. (2015) Joon Soo Lim, YoungChan Hwang, Seyun Kim, and Frank A Biocca. 2015. How social media engagement leads to sports channel loyalty: Mediating roles of social presence and channel commitment. Computers in Human Behavior, 46:158–167.
- Liu et al. (2019) Yinhan Liu, Myle Ott, Naman Goyal, Jingfei Du, Mandar Joshi, Danqi Chen, Omer Levy, Mike Lewis, Luke Zettlemoyer, and Veselin Stoyanov. 2019. Roberta: A robustly optimized BERT pretraining approach. CoRR, abs/1907.11692.
- Llewellyn and Cram (2016) Clare Llewellyn and Laura Cram. 2016. Brexit? analyzing opinion on the uk-eu referendum within twitter. In Tenth International AAAI Conference on Web and Social Media.
- Loshchilov and Hutter (2017) Ilya Loshchilov and Frank Hutter. 2017. Decoupled weight decay regularization. arXiv preprint arXiv:1711.05101.
- Loureiro et al. (2022) Daniel Loureiro, Francesco Barbieri, Leonardo Neves, Luis Espinosa Anke, and Jose Camacho-Collados. 2022. Timelms: Diachronic language models from twitter. arXiv preprint arXiv:2202.03829.
- Martin and Johnson (2015) Fiona Martin and Mark Johnson. 2015. More efficient topic modelling through a noun only approach. In Proceedings of the Australasian Language Technology Association Workshop 2015, pages 111–115.
- Mcauliffe and Blei (2007) Jon Mcauliffe and David Blei. 2007. Supervised topic models. Advances in neural information processing systems, 20.
- McCarthy and Jarvis (2010) Philip M McCarthy and Scott Jarvis. 2010. Mtld, vocd-d, and hd-d: A validation study of sophisticated approaches to lexical diversity assessment. Behavior research methods, 42(2):381–392.
- Mikolov et al. (2018) Tomas Mikolov, Edouard Grave, Piotr Bojanowski, Christian Puhrsch, and Armand Joulin. 2018. Advances in pre-training distributed word representations. In Proceedings of the International Conference on Language Resources and Evaluation (LREC 2018).
- Mohammad et al. (2018) Saif Mohammad, Felipe Bravo-Marquez, Mohammad Salameh, and Svetlana Kiritchenko. 2018. Semeval-2018 task 1: Affect in tweets. In Proceedings of the 12th international workshop on semantic evaluation, pages 1–17.
- Morgan and Van Keulen (2014) Mena Badieh Habib Morgan and Maurice Van Keulen. 2014. Information extraction for social media. In Proceedings of the Third Workshop on Semantic Web and Information Extraction, pages 9–16.
- Nguyen et al. (2020) Dat Quoc Nguyen, Thanh Vu, and Anh Tuan Nguyen. 2020. BERTweet: A pre-trained language model for English Tweets. In Proceedings of the 2020 Conference on Empirical Methods in Natural Language Processing: System Demonstrations, pages 9–14.
- Nugroho et al. (2020) Robertus Nugroho, Cecile Paris, Surya Nepal, Jian Yang, and Weiliang Zhao. 2020. A survey of recent methods on deriving topics from twitter: algorithm to evaluation. Knowledge and information systems, 62(7):2485–2519.
- Passonneau (2006) Rebecca Passonneau. 2006. Measuring agreement on set-valued items (masi) for semantic and pragmatic annotation.
- Pereira et al. (2018) Rafael B Pereira, Alexandre Plastino, Bianca Zadrozny, and Luiz HC Merschmann. 2018. Correlation analysis of performance measures for multi-label classification. Information Processing & Management, 54(3):359–369.
- Poesio and Artstein (2005) Massimo Poesio and Ron Artstein. 2005. The reliability of anaphoric annotation, reconsidered: Taking ambiguity into account. In Proceedings of the workshop on frontiers in corpus annotations ii: Pie in the sky, pages 76–83.
- Ramage et al. (2011) Daniel Ramage, Christopher D Manning, and Susan Dumais. 2011. Partially labeled topic models for interpretable text mining. In Proceedings of the 17th ACM SIGKDD international conference on Knowledge discovery and data mining, pages 457–465.
- Resnik et al. (2015) Philip Resnik, William Armstrong, Leonardo Claudino, Thang Nguyen, Viet-An Nguyen, and Jordan Boyd-Graber. 2015. Beyond lda: exploring supervised topic modeling for depression-related language in twitter. In Proceedings of the 2nd workshop on computational linguistics and clinical psychology: from linguistic signal to clinical reality, pages 99–107.
- Rosen-Zvi et al. (2004) Michal Rosen-Zvi, Thomas Griffiths, Mark Steyvers, and Padhraic Smyth. 2004. The author-topic model for authors and documents. In Proceedings of the 20th conference on Uncertainty in artificial intelligence, pages 487–494.
- Silveira et al. (2021) Raquel Silveira, CG Fernandes, João A Monteiro Neto, Vasco Furtado, and José Ernesto Pimentel Filho. 2021. Topic modelling of legal documents via legal-bert. Proceedings http://ceur-ws org ISSN, 1613:0073.
- Steinskog et al. (2017) Asbjørn Steinskog, Jonas Therkelsen, and Björn Gambäck. 2017. Twitter topic modeling by tweet aggregation. In Proceedings of the 21st Nordic Conference on Computational Linguistics, pages 77–86, Gothenburg, Sweden. Association for Computational Linguistics.
- Steyvers and Griffiths (2007) Mark Steyvers and Tom Griffiths. 2007. Probabilistic topic models. Handbook of latent semantic analysis, 427(7):424–440.
- Stieglitz et al. (2018) Stefan Stieglitz, Milad Mirbabaie, Björn Ross, and Christoph Neuberger. 2018. Social media analytics–challenges in topic discovery, data collection, and data preparation. International journal of information management, 39:156–168.
- Stier et al. (2018) Sebastian Stier, Arnim Bleier, Haiko Lietz, and Markus Strohmaier. 2018. Election campaigning on social media: Politicians, audiences, and the mediation of political communication on facebook and twitter. Political communication.
- Tajbakhsh and Bagherzadeh (2019) Mir Saman Tajbakhsh and Jamshid Bagherzadeh. 2019. Semantic knowledge lda with topic vector for recommending hashtags: Twitter use case. Intelligent Data Analysis, 23(3):609–622.
- Tsoumakas et al. (2009) Grigorios Tsoumakas, Ioannis Katakis, and Ioannis Vlahavas. 2009. Mining multi-label data. Data mining and knowledge discovery handbook, pages 667–685.
- Véronis (1998) Jean Véronis. 1998. A study of polysemy judgements and inter-annotator agreement. In Programme and advanced papers of the Senseval workshop, pages 2–4. Citeseer.
- Weller (2015) Katrin Weller. 2015. Accepting the challenges of social media research. Online Information Review.
- Wohn and Na (2011) D Yvette Wohn and Eun-Kyung Na. 2011. Tweeting about tv: Sharing television viewing experiences via social media message streams. First Monday.
- Wolf et al. (2019) Thomas Wolf, Lysandre Debut, Victor Sanh, Julien Chaumond, Clement Delangue, Anthony Moi, Pierric Cistac, Tim Rault, Rémi Louf, Morgan Funtowicz, et al. 2019. Huggingface’s transformers: State-of-the-art natural language processing. arXiv preprint arXiv:1910.03771.
- Yang et al. (2021) Qi Yang, Weinan Wang, Lucas Pierce, Rajan Vaish, Xiaolin Shi, and Neil Shah. 2021. Online communication shifts in the midst of the covid-19 pandemic: A case study on snapchat. Proceedings of the International AAAI Conference on Web and Social Media, 15(1):830–840.
- Zhao et al. (2011) Wayne Xin Zhao, Jing Jiang, Jianshu Weng, Jing He, Ee-Peng Lim, Hongfei Yan, and Xiaoming Li. 2011. Comparing twitter and traditional media using topic models. In European conference on information retrieval, pages 338–349. Springer.
- Zhuravskaya et al. (2020) Ekaterina Zhuravskaya, Maria Petrova, and Ruben Enikolopov. 2020. Political effects of the internet and social media. Annual Review of Economics, 12:415–438.
Appendix A Tweet filtering
Appendix B Annotation Interface
Figure 9 presents our annotation interface. Figure 8 displays the instructions provided to annotators along with a small description of each topic.


Appendix C Evaluation Results
Hyperparameters.
Language models are trained using a batch size of 8 for 20 epochs, while utilizing an Adam optimizer Loshchilov and Hutter 2017 with learning rate and a weight decay of . Furthermore, an early stop callback terminates the training process after 3 epochs without performance improvement. Finally, for the single-label experiments cross entropy loss along with a softmax activation function were used, while for the multi-label setting binary cross entropy loss and a sigmoid activation for each of the 19 topics are used.
Analysis by quarter.
In order to get a better understanding of the evolution of the corpus and identify potential performance decays due to temporal differences we inspect the performance of TimeLM-19 in each quarter (i.e., three months) of the temporal’s split test-set. Figure 10 displays the F1 scores of each class (single-label setting) for each quarter of the time period tested. While most topics do not seem to be greatly affected by time, we can indeed observe a performance drop in arts & culture, which is the topic more affected by the temporal variable. Figure 11 illustrates the relative differences in F1 scores for each class in the multi-label setting, when TimeLM-19 is trained using the temporal split and when trained on the random split.
Confusion matrices.
Figure 12 displays the confusion matrices for TimeLM-19 when trained in the multi-label setting using the temporal split.