AstroSat view of ‘Clocked’ burster GS 1826-238: broad-band spectral nature of persistent and burst emission during soft stateAstroSat view of ‘Clocked’ burster GS 1826-238: broad-band spectral nature of persistent and burst emission during soft state–
Abstract
In this paper, we have carried out a detailed study of the ‘Clocked’ burster GS using 90 ks broad-band (0.7 - 60.0 keV) data obtained with AstroSat observatory. The source was observed during a soft spectral state and traced a ‘banana’ type track in the colour-colour diagram (CCD). We find that a combination of thermal component (multi-colour disc/bbodyrad) and Comptonized component is statistically good description for all the sections of the track in the CCD. The corona becomes optically thick ( increases from 5 to 21) and cooler ( decreases from 4.8 to 2.2 keV) as the source moves up in the ‘banana’ branch. Probably cooling is caused by increase in the supply of soft-seed photons from the disc/boundary-layer. Reflection signature is observed at upper ‘banana’ branch of the source. Two type-I X-ray bursts are detected during the AstroSat observations. During the bursts, hard X-rays increased unlike previous observations where a reduction in hard X-rays is observed during the bursts. Decrease in the electron temperature and increase in the optical depth are observed during the bursts. The PSD (Power Spectral Density) of all the sections of the CCD can be represented by a pure power-law component. The strength of this component increases from 1% to 4.5% as the source moves up in the ‘banana’ track. Search for burst oscillations gave a null result. We discuss the implications of our results in the context of previous findings.
Keywords:
accretion, accretion discs - X-rays: binaries - X-rays: individual: GS1 Introduction
Luminous low mass X-ray binaries (LMXBs) containing an accreting neutron star (NS) are broadly divided in two groups: Atoll and Z-sources. The classification is based on the pattern that they trace in colour-colour diagram (CCD). Z-sources trace a Z-shaped path on the CCD and the Atoll sources trace a fragmented ‘C’ type pattern on the CCD (Hasinger and van der Klis 1989). The fragmented pattern has two distinct parts ‘island’ state and curved ‘banana’ state. Z-sources are persistent sources with luminosity varying in the narrow range of . However, luminosity of Atoll sources varies in the range of .
X-ray spectra of the NS-LMXBs are often modeled as sum of soft and hard spectral components. The soft component is either modelled with a multi-colour disk (MCD) emission or a single temperature blackbody (BB) emission. The hard component is described by Comptonized emission. Therefore, to model the X-ray spectra two approaches exist. In first approach, MCD plus Comptonized emission model is used to fit the X-ray spectra of the NS-LMXBs (Di Salvo et al. 2000a; Di Salvo et al. 2002; Agrawal and Sreekumar 2003; Tarana et al. 2008; Agrawal and Misra 2009) and in the second approach, spectra of these sources are modelled using sum of BB and Comptonized emission (Piraino et al. 2000; Piraino et al. 2007; Di Salvo et al. 2000b; Di Salvo et al. 2001; Barret et al. 2002; Wang et al. 2019). However, it is very difficult to differentiate between MCD and BB models. The Comptonized component of Z-sources has electron temperature in the range of keV and optical depth in the range of (Di Salvo et al. 2001; Di Salvo et al. 2002; Agrawal and Sreekumar 2003; Agrawal and Misra 2009; Agrawal et al. 2020a; Agrawal et al. 2020b). However, Atoll sources exhibit two types of state: soft state and hard state (Barret et al. 2000; Barret et al. 2001; Gierlinkski et al. 2002; Tarana et al. 2008; Wang et al. 2019). The hard state is usually associated with ‘island’ branch and the soft state with ‘banana’ branch. In the hard state, Comptonized corona has temperature in the range of keV and optical depth (Barret et al. 2000; Gierlinkski et al. 2002; Tarana et al. 2007; Tarana et al. 2008). However, in the soft state Atoll sources exhibit spectral characteristics similar to Z-sources (Barret et al. 2000; Barret et al. 2002; Gierlinkski et al. 2002; Tarana et al. 2008; Tarana et al. 2007; Agrawal et al. 2018). The spectral evolution studies have been carried out for many Atoll sources (Barret et al. 2002; Gierlinkski et al. 2002; Tarana et al. 2007; Tarana et al. 2008; Agrawal et al. 2018; Wang et al. 2019) and Z-sources (Di Salvo et al. 2000a; Di Salvo et al. 2002; Agrawal and Sreekumar 2003; Agrawal and Misra 2009; Agrawal et al. 2020a; Agrawal et al. 2020b) in order to understand the origin of the path traced by them in the CCD, dynamics of accretion process and emission mechanisms.
GS is a ‘clocked X-ray burster’, discovered serendipitously during GINGA observations (Makino 1988). Owing to its similarity with Cyg X-1, it was initially classified as blackhole candidate. Later, the detection of the three type-I X-ray bursts with BeppoSAX established that the compact object in this system is a weakly magnetized NS (Ubertini et al. 1997). The source has exhibited regular type-I X-ray bursts since its discovery. The source has remained in the persistent hard spectral state until June 2014 (Del Sordo et al 1999; Cocchi et al. 2011; Asai et al. 2015). The MAXI and Swift-BAT observations revealed transition to the soft spectral state on 2014 June 8 (Asai et al. 2015; Chenevez et al. 2016). The source remained in the soft state for more than 2-months. Chenevez et al. 2016 fitted the joint Swift XRT ( keV) and NuSTAR keV) spectrum during the soft state with a double Comptonization model (Chenevez et al. 2016). The temperature () of soft Comptonized component was found to be 3 keV while of the hard Comptonized component was fixed at 20 keV. The source again made a transition to the soft spectral state in 2015 (MJD 57220 onwards) (see Sanchez-Fernandez et al. 2020).
NS-LMXBs (mainly Atoll sources) also exhibit type-I X-ray bursts, caused by unstable thermonuclear burning of accreted material on the surface of the weakly magnetized neutron stars. During the thermonuclear burning supply of the seed photons from the surface of the NS is expected to increase and cool the Comptonized corona around the NS (Maccarone and Coppi 2003; Ji et al. 2013; Chen et al. 2013; Sanchez-Fernandez et al. 2020). Cooling of the corona during the type-I X-ray bursts has been observed in this source. During the type-1 X-ray bursts, a soft X-ray excess was observed which was modeled with blackbody component (Sanchez-Fernandez et al. 2020). A drop in the hard X-ray flux was also reported during the type-I X-ray burst observed in this source (Ji et al. 2014; Sanchez-Fernandez et al. 2020). Chenevez et al. 2016 detected the Eddington limited type-I X-ray burst and derived the distance of the source to be 5.70.2 kpc, assuming an isotropic emission. The NICER observations of this source revealed mHz oscillations with fractional rms 2% at 6 keV (Strohmayer et al. 2018).
In the present work, we have carried out a detailed broad-band spectral ( keV) study of the source GS using the AstroSat data. The source was in the soft state during our observations and also showed two type-I X-ray bursts during the LAXPC observations. An increase in the hard X-rays was seen during the bursts. Also, reflection feature was observed during AstroSat observations. The remainder of the paper is organized as follows. The details of observations and methods adopted for the data reduction are given in 2. The methodology used for data analysis, modelling of the energy spectra and the power density spectra are presented in 3. The results of analysis are also presented in . Finally, the implications of our results and conclusions are discussed in 4.

| Models | Obs A | Obs B | Remarks |
|---|---|---|---|
| (/dof) | (/dof) | ||
| nthComp | 1146/658 | 449/298 | seed DISKBB |
| nthComp+bbodyrad | 1018/656 | 396/296 | seed DISKBB |
| irefl*nthComp+bbodyrad | 992/655 | 395/295 | seed DISKBB |
| nthComp+diskbb | 1008/656 | 405/296 | seed BBODY |
| irefl*nthComp+diskbb | 997/655 | 401/295 | seed BBODY |
| nthComp+nthComp | 1017/656 | 407/296 | seed DISKBB/BBODYRAD |
| diskbb+bbodyrad | 1045/658 | 697/298 | - |
2 Observations and Data Reduction
The source GS was observed twice, from 2016 March 9 to 2016 March 11 (Obs A) and on 2016 August 17 (Obs B) for a total good time of 90 ks, with AstroSat instruments: Soft X-ray Telescope (SXT) and Large Area X-ray Proportional Counter (LAXPC). SXT consists of a focusing optics and a CCD imager. It provides spectroscopic and temporal measurements in the energy range keV (Singh et al. 2016). LAXPC is a gas proportional counter and operates in the keV energy band (Yadav et al. 2016). There are three LAXPC units: LAXPC10, LAXPC20 and LAXPC30 with combined effective area of 6000 cm2. SXT operates in the photon counting (PC) and the fast window (FW) modes. In the PC mode, data from the entire CCD is read out. Time resolution in this mode is 2.38 s. In the FW mode, the data from the central 150 150 pixels are collected. The read out time in this mode is 278 ms. LAXPC operates in the event analysis and the broad-band counting mode. In the event analysis mode, the arrival time of each photon is tagged with an accuracy of 10 s. In the broad-band counting mode, one can select the binsize from 16 ms to 2048 ms. During our observations, the data from SXT was collected using the PC mode (Obs A) and FW mode (Obs B), and the event analysis mode was used to collect data from the LAXPC (for both Obs A and Obs B).


We use the latest version of LAXPC data analysis software LaxpcSoft11 1 http://www.tifr.res.in/astrosat_laxpc/LaxpcSoft.html, provided by the LAXPC team and follow the data reduction procedure given in the readme file (see also Agrawal et al. 2018; Agrawal et al. 2020b). We reduce level-1 data products to get final LAXPC lightcurves and spectra. XSELECT version 2.4d is used to generate the image, spectra and the lightcurves from the SXT level-2 data. The SXT image in the energy range keV (for Obs A) is shown in the Figure 1. The keV count rate of the source during Obs A exceeded the pileup limit ( 40 cps). Hence, we use an annular region with inner radius of arcmin and an outer radius of . We show the annular extraction region in Figure 1 with two green circles corresponding to inner and outer radius of region of selection. However for FW mode (Obs B), we use a circular region to extract the spectra and lightcurves. The background spectra obtained from the dark sky observations provided by the instrument team were used to subtract the background. The response matrices for both LAXPC and SXT were provided by the instrument team. We create ARF files for SXT using task sxtARFModule22 2 http://www.tifr.res.in/astrosat_sxt/dataanalysis.html.
3 Data Analysis and Modelling
3.1 Lightcurves and CCD
In Figure 2, we show the MAXI (top panel) lightcurve in the energy band keV and Swift-BAT lightcurve in the energy band keV (bottom panel). We also mark the time of AstroSat observations by green (Obs A) and magenta (Obs B) line. The MAXI count rate increased after MJD 57220 (2015 July 17). At the same time, a drop in the keV flux was observed. This suggested that source made hard to soft state transition near MJD 57220. We mark the time of the state transition by blue line. Figure 2 suggests that the AstroSat data are obtained in the soft state of the source. However, during Obs B, keV flux is less compared to Obs A (see Figure 2). We use the LAXPC10 data to create the lightcurves in the energy band keV, keV and keV for Obs A and Obs B. The bin size used is 256 s. We show these lightcurves along with the hardness ratio (the ratio of count rates in the energy bands keV and keV) in Figure 3a and Figure 3b. Two type-I X-ray bursts (B1 during Obs A and B2 during Obs B) were recorded during our observations.
We also create the lightcurves using the SXT data in the energy band keV. One type-I X-ray burst was recorded during Obs B with SXT. The SXT lightcurves are shown in the Figure 4a and 4b. We create LAXPC lightcurves with 256 s binsize in 4 energy bands: keV, keV, keV and keV. These lightcurves are used to create the colour-colour diagram (CCD, see Figure 5). Here, the soft colour is defined as the ratio of count rates in the energy bands keV and keV, and hard colour is the ratio of count rates in the keV and keV band. The pattern traced by the source in the CCD is reminiscent of the English letter ‘C’. We divide the pattern into 6 parts (S1, S2, S3, S4, S5 and S6) to investigate the evolution of broad-band spectral and temporal properties. Figure 6 shows the X-ray bursts (B1 and B2) detected using LAXPC in the energy bands: keV (top panel), keV (second panel) and keV (third panel) for Obs A and Obs B. The hardness ratio, defined as the ratio of the count rates in the energy bands keV and keV is shown in the bottom panels.
The average keV count rate of the persistent emission during Obs A was 400 counts/s and during Obs B was 80 counts/s. During Obs B, the count rate systematically decreased from 160 counts/s to 10 counts/s (see Figure 3). The peak keV count rate of the X-ray burst observed during Obs A was 6200 counts/s and that during Obs B was around 3960 counts/s. We note that bursts are detected in the keV band as well (see Figure 6) and the peak count rate was 86 counts/s for the burst detected during Obs A and it was 55 counts/s for the burst detected during Obs B. Only burst B2 was detected during SXT observations (see Figure 4b). The soft colour varies between 0.5 to 0.8 and the hard colour varies between 0.25 to 0.45 (see Figure 5). The burst B2 was detected at lower soft colour values compared to the burst B1.


 |
 |
 |
 |
| Parameters | S1 | S2 | S3 | S4 | S5 | S6 |
|---|---|---|---|---|---|---|
| 4.0(fix) | 4.00.1 | 4.00.4 | 2.7(fix) | 2.7(fix) | 2.7(fix) | |
| (keV) | 0.670.08 | 0.720.02 | 0.680.02 | 0.960.06 | 0.960.04 | 1.170.02 |
| 360.555.5 | 164.2525.5 | 34551 | 157.526.5 | 143.514.5 | 90.52.6 | |
| 2.620.08 | 2.480.10 | 2.490.07 | 1.890.12 | 1.970.08 | 1.400.3 | |
| (keV) | 4.750.45 | 3.720.45 | 3.320.15 | 2.380.06 | 2.440.04 | 2.160.03 |
| (keV) | 1.12(fix) | 1.080.11 | 1.1(fix) | 0.99 | 0.950.12 | 0.980.10 |
| 0.0240.005 | 0.0150.002 | 0.0250.01 | 0.0450.01 | 0.0600.01 | 0.030.01 | |
| 0.05 | 0.03 | 0.015 | 0.0800.03 | 0.0750.01 | 0.120.02 | |
| 0.3(fix) | 0.3 (fix) | 0.3(fix) | 0.3(fix) | 0.3(fix) | 0.3(fix) | |
| Derived Values | ||||||
| 1.42 | 0.820.04 | 1.610.09 | 2.680.43 | 2.800.21 | 3.680.43 | |
| 0.97 | 0.510.05 | 0.810.06 | 1.670.43 | 2.250.21 | 1.920.22 | |
| 5.180.65 | 6.520.8 | 6.950.51 | 12.201.48 | 11.490.97 | 20.757.5 | |
| 1.020.23 | 1.240.34 | 1.250.18 | 2.770.66 | 2.450.42 | 7.284.35 | |
| (km) | 21.133.55 | 14.352.33 | 20.823.35 | 14.032.20 | 13.450.45 | 10.650.77 |
| (km) | 3.200.22 | 2.800.59 | 3.80.24 | 3.691.80 | 4.480.45 | 2.700.87 |
| 65/87 | 256/223 | 273/180 | 427/377 | 750/606 | 797/626 |
| Parameters | S1 | S2 | S3 | S4 | S5 | S6 |
|---|---|---|---|---|---|---|
| 3.0(fix) | 4.00.02 | 4.50.03 | 0.260.03 | 0.250.02 | 0.260.03 | |
| 2.170.08 | 2.130.06 | 1.950.04 | 0.730.04 | 0.750.03 | 0.800.01 | |
| 0.850.14 | 0.590.09 | 2.150.06 | 23360 | 21480 | 25130 | |
| 2.680.12 | 2.810.13 | 2.850.06 | 2.020.06 | 2.040.05 | 1.820.04 | |
| (keV) | 6.82 | 6.05 | 50.0(fix) | 2.450.06 | 2.480.03 | 2.300.02 |
| (keV) | 0.35(fix) | 0.550.06 | 0.610.02 | 0.620.12 | 0.770.07 | 0.580.06 |
| 0.640.05 | 0.260.02 | 0.470.02 | 0.490.07 | 0.500.04 | 0.490.02 | |
| 0.11 | 0.08 | 0.03 | 0.0850.03 | 0.0950.02 | 0.1350.02 | |
| 0.3(fix) | 0.3(fix) | 0.3(fix) | 0.3(fix) | 0.3(fix) | 0.3(fix) | |
| Derived Values | ||||||
| 0.16 | 0.120.01 | 0.340.04 | 0.960.09 | 0.890.08 | 1.280.11 | |
| 2.65 | 1.650.05 | 1.380.04 | 3.600.25 | 4.580.21 | 4.050.22 | |
| 4.05 | 4.09 | 0.880.07 | 10.920.95 | 10.700.55 | 13.150.65 | |
| 0.87 | 0.79 | 0.300.05 | 2.300.39 | 2.220.21 | 3.150.32 | |
| (km) | 55.0 | 17.2 | 14.971.17 | 14.754.82 | 10.882.07 | 15.882.42 |
| (km) | 0.520.03 | 0.430.03 | 0.830.04 | 8.881.16 | 8.311.52 | 9.050.65 |
| 65/87 | 259/223 | 274/181 | 425/376 | 748/605 | 792/625 |
| Parameters | S1 | S2 | S3 | S4 | S5 | S6 |
|---|---|---|---|---|---|---|
| 2.430.21 | 2.530.11 | 3.330.3 | 1.890.15 | 1.650.20 | 1.750.15 | |
| (keV) | 4.150.25 | 3.800.20 | 5.82 | 2.420.05 | 2.380.03 | 2.300.01 |
| (keV) | 1.260.27 | 1.230.08 | 1.200.08 | 1.030.29 | 1.030.21 | 0.760.05 |
| 6.33 (fix) | 6.22(fix) | 9.2(f) | 7.55(fix) | 6.1(fix) | 8.0(fix) | |
| (keV) | 20(f) | 20(f) | 20(f) | 20(f) | 20 (f) | 20(f) |
| (keV) | 0.30(f) | 0.660.02 | 0.520.02 | 0.920.12 | 1.020.08 | 0.880.04 |
| () | 111.1 | 0.870.1 | 1.720.3 | 3.700.8 | 3.140.9 | 9.851.0 |
| 0.960.05 | 0.250.02 | 0.280.02 | 0.590.01 | 0.620.01 | 0.520.01 | |
| Derived Values | ||||||
| 6.271.12 | 6.260.65 | 3.351.33 | 12.092.12 | 15.024.75 | 14.150.20 | |
| 0.49 | 0.50 | 0.27 | 0.37 | 0.52 | 0.70 | |
| 1.270.23 | 1.160.15 | 0.500.35 | 2.770.97 | 4.202.56 | 3.580.12 | |
| 0.04 | 0.04 | 0.01 | 0.02 | 0.04 | 0.08 | |
| (km) | 2.580.83 | 1.680.21 | 2.580.4 | 3.111.21 | 2.481.12 | 6.820.95 |
| (km) | 71 | 11.951.18 | 22.892.05 | 10.922.95 | 9.861.59 | 11.771.16 |
| 1.3 | 0.470.11 | 0.720.04 | 1.460.33 | 1.230.23 | 2.430.14 | |
| 1.5 | 0.960.1 | 1.330.07 | 2.980.35 | 3.750.14 | 3.060.12 | |
| 62/88 | 258/224 | 274/181 | 427/377 | 762/606 | 810/626 |
3.2 Modelling of X-ray Spectra
3.2.1 Spectral Analysis
We create the source and background spectra for Obs A, Obs B and different sections of the CCD using the top layer data of LAXPC10. We use an annular region to extract source spectra from SXT PC mode data. To extract source spectra from SXT FW mode data, we use a circular region. We use the joint SXT and LAXPC spectra for the spectral analysis. For the spectral fitting, we consider keV energy range for the SXT and keV range for the LAXPC. Since, there is no data with sufficient statistics beyond 25 keV, we restrict our analysis to the energy keV. We use XSPEC version 12.11.1 to carry out the spectral fitting and add 1% systematic error while fitting to account for uncertainty in the spectral response.
We attempt various single and multi-components models to fit the X-ray spectra corresponding to Obs A and Obs B of the source. We begin with an absorbed Comptonization model. To account for Galactic absorption, we use the XSPEC model TBabs (Wilms et al. 2000). We use the Comptonization model nthComp (Zdziarski et al. 1996) of XSPEC which provides choice to select the disc blackbody or blackbody as the seed photon spectrum. We select the shape of the seed photon spectrum as diskbb. The reduced () is given in the Table 1. We find that absorbed Comptonization model provides poor description of the data. Then, we add a or a component to the spectra. It is also worth mentioning that there is a gold edge at 2.41 keV in the SXT spectra. Hence, we add an absorption edge (edge in XSPEC) at 2.41 keV. While fitting the data with model, we choose the shape of seed photon spectrum as and the shape of the seed photon spectrum is taken as for the model . The fit is significantly improved in both cases, however residual is found in the spectral fit of Obs A. We add an ionized reflection component ireflect (Magdziarz and Zdziarski 1995) to both models. Since it was difficult to constrain all the parameters while using the reflection component, we fix the value of the ionization parameter, the disc inclination and disk temperature at the best fit values (, and keV). and models are applied to both spectra (Obs A, Obs B). We find that addition of the reflection component improves the fitting of the spectrum for Obs A (see Table 1). However, for Obs B, an addition of reflection component does not improve the fit significantly and we could set only a upper limit on reflection fraction (). The unfolded spectra of Obs A and Obs B with the best fit models (TBabs*edge*(irefl*nthComp+diskbb) are shown in Figure 7. A double Comptonization model also provides an acceptable fit to the spectra.
We applied these three models to the spectra corresponding to the different sections of the CCD. Note that a combination of diskbb and bbodyrad models gives a poor fit to the spectra (see Table 1). The sections S1, S2 and S3 corresponds to Obs B and S4-S6 corresponds to Obs A. The reflection component is very weak for sections S1-S3 and we could find only an upper limit on reflection fraction. However, reflection component is significant for the CCD sections S4-S6. Errors on the best fit parameters are quoted at 68% confidence level.
We divide the bursts B1 and B2 into four parts: pre-burst (A), peak (B), decay (C) and post-burst (D) phases (see Figure 6). The B1 spectra during these different parts can be completely described by a single component model (TBabs*(nthComp)). An addition of diskbb component to the spectra of the pre-burst, peak, decay and post-burst phases do not improve the fit. The disc component is not observed because low-energy data from the SXT is not available for this burst. For the burst B2, a diskbb component is required during the pre-burst and post-burst phases. However, diskbb or bbodyrad component is not needed during the peak and decay phases. Since the seed photons during the type-I X-ray bursts will mainly arise in the hot surface of neutron star, we assume a blackbody shape for the seed photon spectrum. However, a small contribution of seed photons during the bursts are expected from the accretion disc as well.
Alternatively, we also subtracted the pre-burst spectra from the peak and decay spectra for the bursts B1 and B2. Fitting the resultant spectra with TBabs*bbodyrad model provided a poor fit for the peak ( = 302/90) and decay part ( = 248/90) of the burst B1. Similarly, the above model results into = 134/83 and = 106/83 for the peak and decay part of the burst B2 respectively.
3.2.2 Spectral Evolution of Persistent Emission
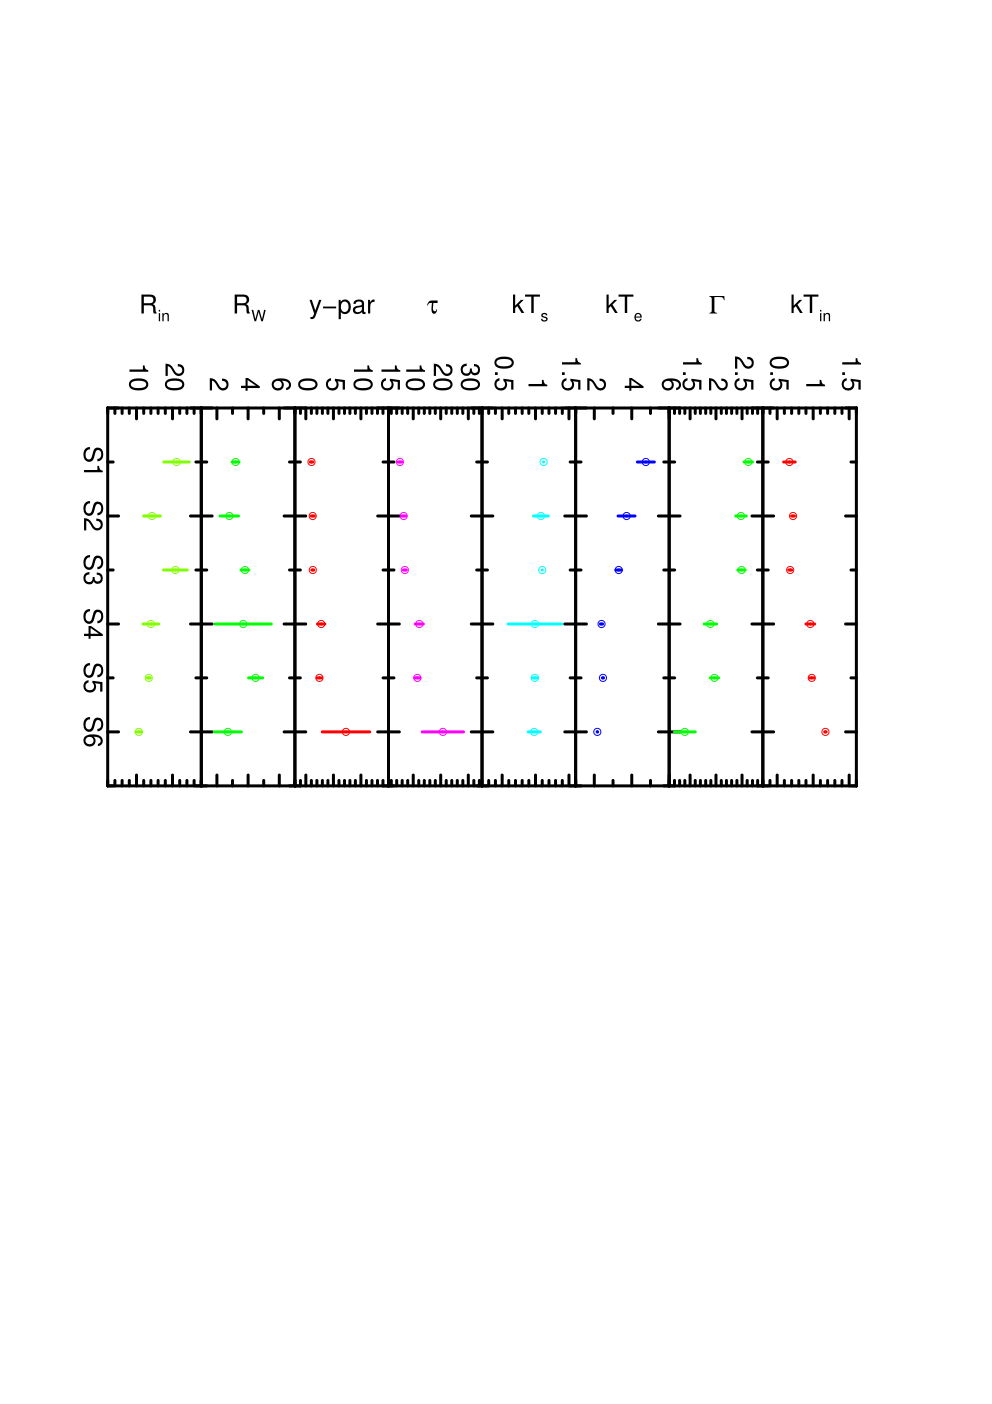
We list the best fit spectral parameters of model TBabs*edge*(irefl*nthComp+diskbb) in Table 2. The unfolded X-ray spectra along with the residual for model TBabs*edge*(irefl*nthComp+diskbb) are shown in Figure 7. We show total spectra for Obs A and Obs B in the top two panels of Figure 7 for a comparison. The spectra of lower ‘banana’ branch (S2) and upper ‘banana’ branch (S5) are shown in the bottom two panels of Figure 7.
The inner disk radius in the diskbb model is given by . We use a source distance of 5.70.2 kpc (Chenevez et al. 2016) and a source inclination of 75∘(Fujimoto 1988) to estimate the values of . We show the evolution of the X-ray spectral parameters in Figure 8. We note that the source shows different spectral behaviour in the lower banana branch (sections S1-S3) compared to upper banana branch (S4-S6). For example temperature of MCD component is lower ( keV) and the inner disc radius is higher ( km) for sections S1-S3 compared to S4-S6 where 1 keV and is km.
We find the evidence of prominent reflection component in the upper ‘banana’ branch (S4-S6) and in the Obs A (see Figure 5). The reflection signature is absent in the lower ‘banana’ branch and the Obs B. We estimated the optical depth () of the corona by inverting the relationship between the spectral index (, optical depth and given in Zdziarski et al. 1996. We also computed the Compton y-parameter using the relation,
| (1) |
We note that decreases from 4.8 keV to 2.2 keV as the source moves from S1 to S6 and at the same time increases from 5 to 21. The Compton y-par also shows a systematic increase as the source moves from S1 to S6. We estimated the Wien radius using formula (see in ’t Zand et al. 1999),
| (2) |
where is the seed photon temperature and is the flux of the Comptonized component in the energy range 0.3 - 50 keV. The Wien radius was found to be in the range of km.
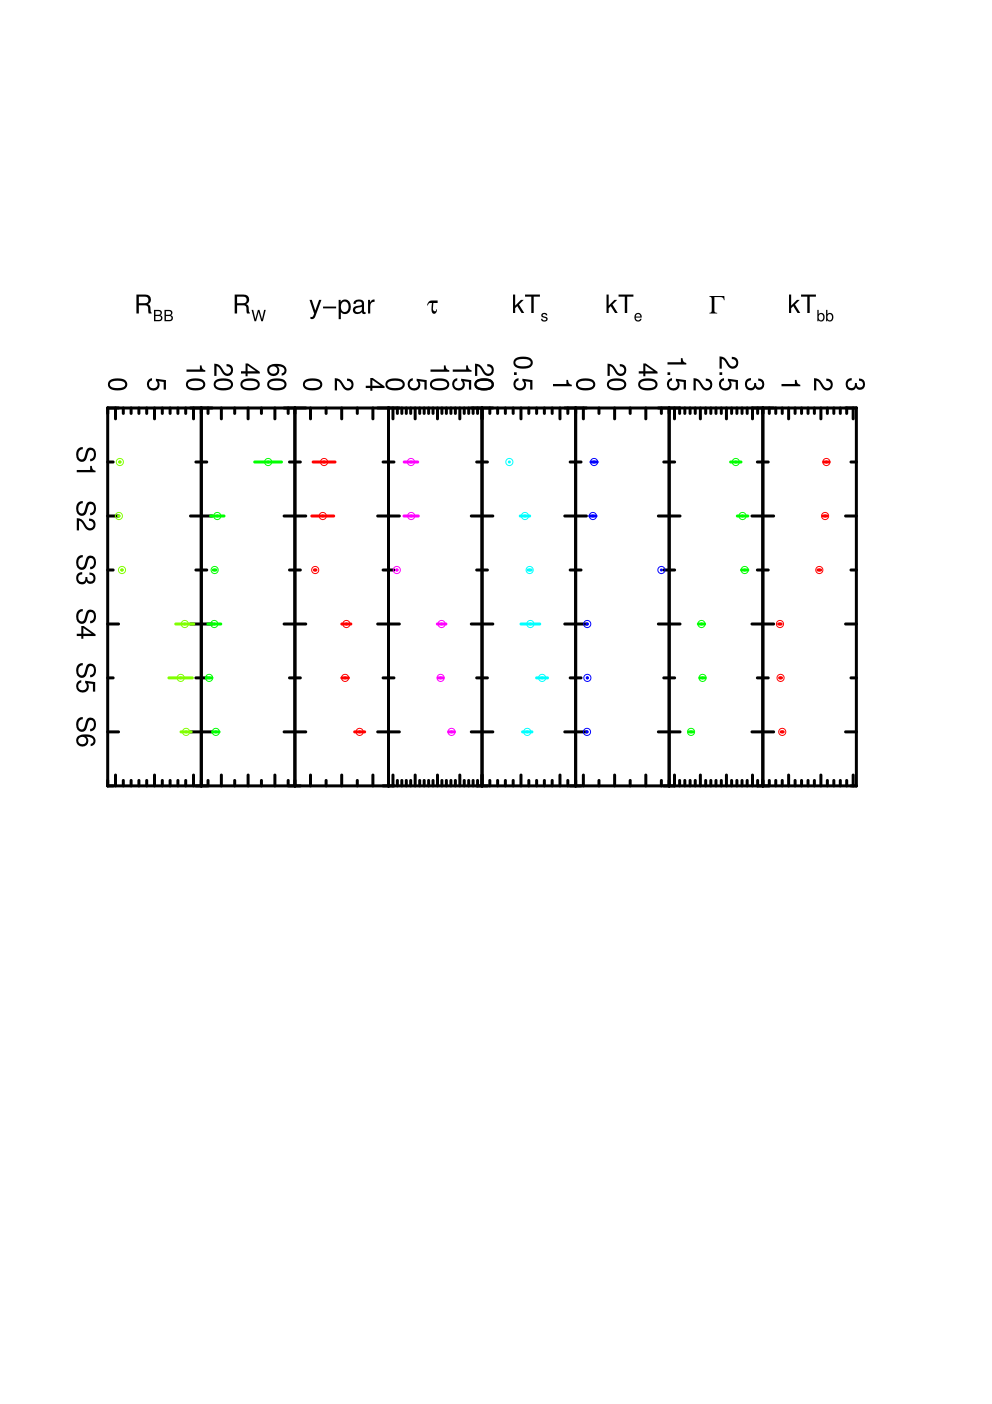
In Table 3, spectral parameters of model TBabs*edge*(irefl*nthComp+bbodyrad) are listed. The evolution of the spectral parameters is shown in Figure 9. The radius of blackbody component is higher for sections S4-S6 compared to that obtained for sections S1-S3. However, blackbody temperature is around 2.0 keV for S1-S3 and is lower ( keV) for S4-S6. It is also noted that temperature of Comptonized component is high and optical depth is low in S1-S3 compared to their values observed in S4-S6. We note that reflection component is weak or absent in lower ‘banana’ branch (S1-S3). However, it is strong in the sections S4-S6 (upper banana branch), where luminosity of the source is higher compared to S1-S3.
In Table 4, we give the best fit spectral parameters of the model TBabs*(nthComp+nthComp). We note that the electron temperature of the first Comptonized component is keV in the S1-S3 sections and 2.4 keV in the S4-S6 sections. The temperature of second Comptonized component was fixed to 20 keV. The photon index of first Comptonized component increases as the source moves from S1 to S3 and then again decreases as the source moves from S3 to S6. The photon index of second Comptonized component is fixed at the best fit values and is found to be in the range of .
| Parameters | B1 | B2 | ||||||
| Pre-burst | Peak | Decay | Post-burst | Pre-burst | Peak | Decay | Post-burst | |
| (76-276s) | (278-285s) | (285-300s) | (315-512s) | (0-180s) | (184-191s) | (191-202s) | (207-407s) | |
| 0.25(f) | 0.25(f) | 0.25(f) | 0.25(f) | 0.30.07 | 0.25(f) | 0.22(f) | 0.440.06 | |
| (keV) | - | - | - | - | 0.770.09 | - | - | 0.830.05 |
| - | - | - | - | 74.641.5 | - | - | 140.663.5 | |
| 2.280.04 | 1.450.01 | 1.750.08 | 2.260.02 | 2.010.11 | 1.310.02 | 1.800.08 | 2.620.27 | |
| (keV) | 2.750.07 | 2.690.02 | 2.560.07 | 2.510.06 | 2.720.21 | 2.480.03 | 1.940.07 | 3.270.91 |
| (keV) | 0.590.03 | 0.53(fix) | 0.990.03 | 0.540.04 | 0.480.08 | 0.38(fix) | 0.75(fix) | 1.4(fix) |
| 0.350.02 | 1.150.02 | 0.370.03 | 0.540.06 | 0.150.06 | 0.480.12 | 0.330.05 | 0.0110.001 | |
| Derived Values | ||||||||
| ( keV) | 3.380.08 | 33.10.38 | 16.590.19 | 3.980.0.04 | 0.360.06 | 21.370.51 | 7.080.86 | 0.610.0.06 |
| ( keV) - | - | - | - | - | 1.340.10 | 22.780.58 | 8.100.80 | 0.840.13 |
| ( keV) | - | - | - | - | 0.150.08 | - | - | 0.270.11 |
| ( keV) | - | - | - | - | 1.020.18 | - | - | 1.380.15 |
| 8.670.38 | 17.690.43 | 13.161.49 | 9.260.30 | 10.371.49 | 22.691.51 | 14.671.61 | 6.251.28 | |
| -par | 1.620.14 | 6.590.32 | 3.460.78 | 1.680.11 | 2.290.65 | 9.951.33 | 3.260.72 | 0.990.23 |
| (km) | 17.651.98 | 40.201.66 | 10.651.20 | 25.314.10 | 8.222.92 | 50.163.5 | 12.41 1.33 | 1.570.2 |
| (km) | - | - | - | - | 9.65.16 | - | - | 13.255.65 |
| 77/89 | 100/89 | 121/89 | 116/89 | 116/112 | 81/81 | 92/81 | 119/113 | |
3.2.3 Spectral Evolution of the Burst Emission
The spectral parameters obtained by fitting the spectra during the X-ray bursts are given in Table 5. The pre-burst, post-burst and the burst spectra of B1 can be completely described by absorbed Comptonization model. This may be due to limited statistics and unavailability of the data in the low energy band (SXT data). For the burst B2, the SXT data were available. The pre-burst and post-burst emission for the burst B2 require an additional diskbb component. However, the disc component vanishes during the peak of the burst and decay part of the burst. The parameters and fluxes for the pre-burst, post-burst, peak of the burst and decay part of the burst are listed in Table 5. The unfolded spectra for different parts of the bursts are shown in Figure 10 (burst B1) and Figure 11 (burst B2). It is observed that the photon index () is lower during the peak and decay part of the bursts B1 and B2 compared to that during the pre-burst and post-burst emission. Also note that is lower during the peak and decay part of the bursts as compared to that during the pre-burst emission. The optical depth () and degree of Comptonization () are also higher during the peak and decay part of the bursts. We also note that the decay spectra are softer compared to the peak spectra. A comparison between decay and peak spectra of burst B2 is shown in Figure 12.
 |
 |
 |
 |
 |
 |
 |
 |

 |
 |
 |
 |
3.3 Temporal Analysis and Modeling
3.3.1 Timing Analysis
We create 1.9 ms lightcurves in the energy range keV to investigate the nature of Power Spectral Density (PSD). We divide the lightcurves in the intervals of 131072 bins or size of 250 s intervals. We rebin the PSD in the frequency range Hz geometrically by a factor of 1.1 in the frequency space. We create an average PSD for a particular section of CCD by averaging the PSD belonging to that section. We subtract the dead time corrected Poisson noise level (Zhang et al. 1995; Agrawal et al. 2018) from the PSD and normalized them to in units of . We find that a simple power-law (AE can describe the PSD for all the sections. The signal strength was very poor for the sections S1 and S2 and we were not be able to constrain the parameters of the fit. Hence, we created combined PSD for these two sections and fit the combined PSD with a power-law function.
3.3.2 Power Spectral Properties
PSD of all the sections of the CCD can be described by a simple power-law function (). Since the signal strength is negligible above 10 Hz, the PSD upto 10 Hz is considered for the fitting. The parameters of the best fit are listed in Table 6. The power-law index () decreases from 1.76 to 1.06 as the source moves from S1 to S4 and then increases as it moves from S4 to S6. The normalization and rms (in the frequency range Hz) values increase as the source moves from S1 to S6. PSDs for different sections of the CCDs are shown in Figure 13.
| Parameters | S1-S2 | S3 | S4 | S5 | S6 |
|---|---|---|---|---|---|
| 1.760.31 | 1.600.22 | 1.060.05 | 1.160.03 | 1.170.02 | |
| ( 10-5) | 0.110.62 | 0.280.12 | 8.352.62 | 10.211.12 | 16.511.31 |
| rms(%) | 1.010.84 | 1.140.73 | 2.880.35 | 3.460.58 | 4.450.47 |
| 42/66 | 40/66 | 34/66 | 54/66 | 63/66 |
4 Discussion
The MAXI and Swift-BAT data revealed that the source has remained in the soft spectral state since 2015 July 17 (see Figure 2). The AstroSat instruments observed this source on two occasions during the soft state. This provided a unique opportunity to study the source behaviour in detail during the soft state using broad-band and fast timing capabilities of AstroSat. The source traced a ‘banana’ type pattern (or a C-type shape) in the CCD and hence we studied the evolution of the broad-band X-ray spectra and power spectral density (PSD) of the source along the track. We also detected two type-I X-ray bursts and investigated their properties in detail.
The persistent spectra of the source can be well described by either a model consisting of multi-colour disc emission and cool Comptonized component (see Figure 7) or a combination of blackbody and Comptonized emission. In both approaches, an ionized reflection component is required at higher flux level (CCD sections S4-S6). However, we can not distinguish between blackbody and MCD component. A double Comptonization model also provides good fit to the X-ray spectra of this source. A double Comptonization model has been previously adopted to fit the X-ray spectra of this source (Thompson et al. 2005; Chenevez et al. 2016). We notice that the photon index of the second Comptonization component could not be constrained for all the sections while temperature was fixed at 20 keV.
We note that TBabs*edge*(irefl*nthcomp+diskbb) and TBabs*edge*(irefl*nthComp+bbodyrad) both models provide equally good description of the data. Fitting the data with above two models suggests the presence of a cool ( keV) and an optically thick () corona. A cool and an optically thick Comptonized emission is generally seen in the soft spectral states of other Atoll sources (Piraino et al. 2000; Barret et al. 2002; Gierlinkski et al. 2002; Tarana et al. 2008; Tarana et al. 2007; Agrawal et al. 2018). The study also shows a systematic evolution of different spectral components along the CCD. The optical depth of the corona increases from S1 to S6. We also note that at the same time corona also becomes cooler. Most probably, due to increase in the supply of the seed photons along the CCD, the corona cools down and becomes compact and more optically thick. This is supported by the fact that supply of seed photons from disc/boundary-layer increases (except at S2) as the source moves along the CCD. Similar variations in the optical depth and the electron temperature have also been observed in other Atoll sources (Gierlinkski et al. 2002; Tarana et al. 2008; Agrawal et al. 2018). We also note that disc moves inwards as the source moves from S1 to S6. Hence, the behaviour of the source may be related with increase in the accretion rate along the CCD. We also note that total flux increases from S2 to S6. However, the flux decreases from S1 to S2.
Reflection signature has been previously reported in Z-sources GX 340+0 (D’Ai et al. 2009), GX 17+2 (Agrawal et al. 2020a) and Atoll sources 4U 1705-44 (Di Salvo et al. 2009; Ludham et al. 2017) and 4U 1636-536 (Ludham et al. 2017). However, in the case of GS 1826-238, we are reporting for the first time the evidence of a reflection component. The source GS 1826-236 is a high inclination () source. In high inclination sources, the reflection component is difficult to observe because outer edge of disc obscure the reflection components. The reflection component has been observed in another high inclination () NS-LMXB 4U 1822-371 (Anitra et al. 2021). The reflection component observed in this source is stronger in the high flux state, when disc extended up to the neutron star surface ( km). The investigations of other Atoll and Z-sources also indicated that disc reflection is stronger when accretion disc extends close to innermost stable circular orbit (ISCO) (Ludham et al. 2017).
In double Comptonization model, one Comptonized emission comes from an optically thick corona and another comes from an optically thin corona. A similar behaviour was observed by Chenevez et al. 2016. The total luminosity of the source in the energy band keV is found to vary in the range of 5.2 10 2.2 1037 ergs/s.
Two type-I X-ray bursts were recorded during the AstroSat observations. The investigation of the energy dependent lightcurves revealed that the increase in the count rate was observed in the hard X-rays ( keV). Such a study has been carried out for other Atoll sources as well and investigation shows that during the bursts hard X-ray flux decreases. A drop in the keV flux was reported during the type-I X-ray bursts observed from Aql X-1 (Maccarone and Coppi 2003). Chen et al. 2013 also reported a shortage of keV flux during type-I bursts from the same source. Ji et al. 2013 reported a shortage of keV flux during the type I X-ray bursts observed from the source 4U 1636-536. A shortage of hard X-ray flux has been reported during the type-I X-ray bursts in the source GS as well (Ji et al. 2014; Sanchez-Fernandez et al. 2020). For the first time, hard X-ray enhancement is seen during the type-I X-ray bursts detected in the period of AstroSat observations. During the AstroSat observations, the source was in the soft state. This suggests that shortage of the hard X-ray flux during the hard state X-ray bursts is caused by an efficient Compton cooling of the corona. However, an additional contribution from the burst emission to the emission of the corona along with flattening of spectra are probably causing a slight increase in the hard X-ray flux during X-ray bursts in the soft state.
We investigated the spectra of burst B2 using model TBabs(diskbb+nthComp) and those of B1 using model TBabs(nthComp) (since the burst was not observed by SXT). We observed the changes in the spectra due to the bursts. We found that photon index of Comptonized emission is flatter during the bursts as compared to the pre-burst and post-burst phases. However, electron temperature is lower during the X-ray bursts. This behaviour can be explained, if during the burst Compton corona is cooling down and increasing its optical depth. Since the corona becomes more optically thick, number of inverse Compton scattering will increase causing flattening of the spectra. Also, the optically thick corona will cool down leading to decrease in electron temperature. We also note that decay part of the spectra is softer compared to the peak part of the spectra (see Figure 12 and Table 5) and disk is absent during the peak and decay part of the bursts. Probably, very high flux from the Comptonized corona has pushed the disk outward. The softening during the decay part can be explained by additional cooling from the disk which is slowly building up. A decrease in the optical depth during the decay part can be explained by the fact that the corona matter settles down on the disc as it cools down. The peak luminosity of the burst B1 is 1.28 1038 ergs/s ( keV) and that during the burst B2 is 0.82 1038 ergs/s ( keV).
We also searched for the burst oscillations in the frequency range Hz during these two bursts. No oscillations during the bursts was observed. Finally, we also study the evolution of the PSD along the CCD. We found that the PSD can be represented by pure power-law (Very Low Frequency Noise) and become stronger as the source moves up along the ‘banana’ state. A detailed timing study of Atoll source 4U 1608-522 using Rossi X-ray Timing Explorer data also revealed that strength of very low frequency noise (VLFN) component increased as the source moved up in the ‘banana’ branch (Van Straaten et al. 2003). They also found narrow QPOs in this branch. The power law index for this source varied in the range of . Similarly, a VLFN component which was absent in the ‘island branch’ appeared in the ‘banana’ branch of Aquila X-1 (Reig et al. 2000). The rms strength of VLFN component in Hz decreased from 3.5 to 1.8% as the source moved up in the ‘banana’ branch. However, rms strength of power-law component in the range Hz remained almost constant (6%). They also found a high frequency noise component in the ‘banana’ branch of the source. The index of VLFN component varied between . A VLFN component and peaked noise were seen in the PSD of 4U 1705-44 (Agrawal et al. 2018) and strength of VLFN component was not correlated with the position on the ‘banana’ branch. The index of VLFN component in GS 1826-238 varied between . Therefore, we conclude that no clear trend for the rms strength and index () of the VLFN is observed in different sources as these move along the ‘banana’ branch of their CCD. Hence, it seems that detailed behaviour of the VLFN component is source dependent.
Acknowledgements
Authors thank the anonymous reviewer for useful and constructive suggestions which improved the quality of the paper.
VKA and AN thank GH, SAG; DD, PDMSA and Director,
URSC for encouragement and continuous support to carry out this research.
This work has used the data from the LAXPC Instruments developed at
TIFR, Mumbai and the LAXPC POC at TIFR is thanked for verifying and
releasing the data via the ISSDC data archive. We thank the AstroSat
Science Support Cell hosted by IUCAA and TIFR for providing the LaxpcSoft
software which we used for LAXPC data analysis. This work has used the
data from the Soft X-ray Telescope (SXT) developed at TIFR, Mumbai,
and the SXT POC at TIFR is thanked for verifying & releasing the
data and providing the necessary software tools.
data availability
Data underlying this article are available at AstroSat-ISSDC website (http://astrobrowse.issdc.gov.in/astro_archive/archive).
References
- Agrawal et al. (2020a) Agrawal V. K., Nandi Anuj, Ramadevi M. C., 2020a, Ap&SS, 365, 41
- Agrawal et al. (2020b) Agrawal V.K. and Nandi Anuj, 2020b, MNRAS
- Agrawal et al. (2018) Agrawal V.K., Nandi Anuj, Girish V., Ramadevi M.C., 2018, MNRAS, 477, 5437
- Agrawal and Misra (2009) Agrawal V.K., Misra R., 2009, MNRAS, 398, 1352
- Agrawal and Sreekumar (2003) Agrawal V.K., Sreekumar P., 2003, MNRAS, 346, 933
- Anitra et al. (2021) Anitra A., Di Salvo T., Iaria R., Burderi L., Gambino A.F., Mazzola S.M., Marino A., Sanna A., Riggio A., 2021, A&A, 654, 160
- Asai et al. (2015) Asai K., 2015, PASJ, 67, 92
- Barret et al. (2000) Barret D. Olive J. F. and Boirin L., 2000, ApJ, 533,329
- Barret et al. (2002) Barret D. and Olive J.F., 2002, ApJ, 576, 391
- Barret et al. (2001) Barret D., 2001, AdSpR, 28, 307
- Chen et al. (2013) Chen Y. P., Zhang S., Zhang S. N. et al., 2013, ApJL, 777, L9
- Chenevez et al. (2016) Chenvez J., Galloway D.K., in ’T Zand J.J.M., Tomsick J.A., Barret D., Chakrabarty D., Furst F., Boggs S.E., et al., 2016, ApJ, 818, 135
- Cocchi et al. (2011) Cocchi M., Farinelli R., A Paizis, 2011, A&A, 529, A155
- D’Ai et al. (2009) D’Ai A., Iaria R., Di Salvo T., Matt G., Robba N. R, 2009, ApJL, 693, 1
- Del Sordo et al (1999) Del Sordo S., Frontera F., Pian E., Piraino S., Oosterbroek T., Harmon B. A, Palazzi E., Tavani M., et al., 1999, ApL&C 38, 125
- Di Salvo et al. (2009) Di Salvo T., D’Ai A., Iaria R., Burderi L., DovciaK M., Karas V., Matt G., Papitto A., Piraino S. et al., 2009, MNRAS 398, 2022
- Di Salvo et al. (2002) Di Salvo T. et al., 2002, A&A, 386, 535
- Di Salvo et al. (2001) Di Salvo T., et al., 2001,ApJ, 554, 49
- Di Salvo et al. (2000a) Di Salvo T., Iaria R., Burderi L. and Robba N. R., 2000a, ApJ, 542, 1034
- Di Salvo et al. (2000b) Di Salvo T., Stella L., Robba N.R., van der Klis M., Burderi L., Israel G.L, Homan J., Compana S. et al., 2000b, ApJ, 544, L119
- Fujimoto (1988) Fujimoto, M. Y., 1988, ApJ, 324, 995
- Gierlinkski et al. (2002) Gierlinski M., Done C., 2002, MNRAS, 337, 1373
- Hasinger and van der Klis (1989) Hasinger G., van der Klis M., 1989, A&A, 225, 79
- in ’t Zand et al. (1999) in ’t Zand, J.J.M., Verbunt F., Strohmayer T.E., Bazzano A., Cocchi M., Heise J., van Kerkwijk M.H., Muller J.M., et al., 1999, A&A, 345, 100
- Ji et al. (2013) Ji L., Zhang S., Chen Y. P. et al., 2013, MNRAS, 432, 2773
- Ji et al. (2014) Ji L., Zhang S., Chen Y.P, Zhang S.N., Torres D.F., Kretschmar P. and Li J.,2014, ApJ, 782, 40
- Ludham et al. (2017) Ludham R.M., Miller J. M., Bachetti M., Barret D., Bostrom A. C., Cackett E. M., Degenaar N., Di Salvo T. et al., 2017, ApJ, 836, 140
- Makino (1988) Makino F., 1988, IAU Circ., 4653
- Maccarone and Coppi (2003) Maccarone T.J. and Coppi P. S., 2003, A&A, 399, 1151
- Magdziarz and Zdziarski (1995) Magdziarz P. and Zdziarski A. A., 1995, MNRAS, 273, 837
- Piraino et al. (2007) Piraino S., Santangelo A., Di Salvo T., Kaaret P., Horns D., Iaria R. and Burderi L., 2007, A&A, 471, L17
- Piraino et al. (2000) Piraino S., Santangelo A., and P. Kaaret, 2000, A&A, 360, L35
- Reig et al. (2000) Reig P., Mendez M., Van der Klis M., Ford E.C., 2000, ApJ, 530, 916
- Sanchez-Fernandez et al. (2020) Sanchez-Fernandez C., et al. 2020, A&A
- Singh et al. (2016) Singh, K.P, Stewart G.C., Chandra S., Mukerjee K., Kotak S., Beardmore, A.P., Chitnis V., Dewangan G.C., et al., 2016, SPIE, 99051E, 10
- Strohmayer et al. (2018) Strohmayer T.E., Gendreau K.C., Altamirano D., Arzoumanian Z., Bult P.M., Chakrabarti D., Chenevez J., 2018, 865,63
- Tarana et al. (2008) Tarana A., Bazzano A., Ubertini P., 2008, ApJ, 688, 1295
- Tarana et al. (2007) Tarana A., Bazzano A., Ubertini P., Zdziarski A. A., 2007, 654, 494
- Thompson et al. (2005) Thompson, T., Rothschild, R., Tomsick, J. A.. et al. 2005, ApJ, 634, 1261
- Ubertini et al. (1997) Ubertini P. et al., 1997, IAU Circ., 6611,1
- Van Straaten et al. (2003) Van Straaten S., Van der Klis M., Mendez Mariano et al. 2003, ApJ, 596,1155
- Wang et al. (2019) Wang Y., Mendez M., Altamirano D., Zhang G., Belloni T.M., Ribeiro E.M., Linares M., Sanna A. et al., 2019, MNRAS, 484, 3004
- Wilms et al. (2000) Wilms J., Allen A., McCray R., 2000, 542, 914
- Yadav et al. (2016) Yadav J.S., Agrawal P.C., Antia H.M., Chauhan Jai Verdhan, Dedhia Dhiraj, Katoch Tilak, Madhwani P., Manchanda R.K, et al., 2016, SPIE, 9905, 15
- Zdziarski et al. (1996) Zdziarski A. A., Johnson W.N., Magdziarz P., 1996, MNRAS, 283, 193
- Zhang et al. (1995) Zhang W., Jahoda K., Swank J.H., Morgan E.H. and Giles A.B., 1995, ApJ, 449, 930