Polarized Blazar X-rays imply particle acceleration in shocks
Most of the light from blazars, active galactic nuclei with jets of magnetized plasma that point nearly along the line of sight, is produced by high-energy particles, up to TeV. Although the jets are known to be ultimately powered by a supermassive black hole, how the particles are accelerated to such high energies has been an unanswered question. The process must be related to the magnetic field, which can be probed by observations of the polarization of light from the jets. Measurements of the radio to optical polarization - the only range available until now - probe extended regions of the jet containing particles that left the acceleration site days to years earlier (Jorstad2005; Marin2018; Blinov2021, e.g.,), and hence do not directly explore the acceleration mechanism, as could X-ray measurements. Here we report the detection of X-ray polarization from the blazar Markarian 501 (Mrk 501). We measure an X-ray linear polarization degree , a factor of higher than the value at optical wavelengths, with a polarization angle parallel to the radio jet. This points to a shock front as the source of particle acceleration, and also implies that the plasma becomes increasingly turbulent with distance from the shock.
In blazars whose lower-energy emission component peaks in the X-ray band like Mrk 501, synchrotron radiation is the dominant emission process from radio to X-rays. Radiation at longer wavelengths likely arises from larger regions in the jet, hence multiwavelength studies probe spatial variations in the magnetic field structure and other physical properties in different locations Marscher1985; Marscher2014. A particularly important diagnostic is the degree of order of the magnetic field and its mean direction relative to the jet axis, which can be determined by measurements of the linear polarization. For example, particle acceleration at a shock front should result in relatively high levels (tens of percent) of X-ray linear polarization along a position angle that is parallel to the jet Tavecchio2018. In contrast, more stochastic acceleration processes involving turbulence or plasma instabilities are expected to lead to weak polarization with random position angles. The optical, infrared, and radio polarization probe the level of order and mean direction of the magnetic field in regions progressively farther from the site of particle acceleration. Simultaneous multiwavelength polarization from X-ray to radio, now possible with the advent of the Imaging X-ray Polarimetry Explorer (IXPE, Weisskopf2022), can therefore provide a more complete picture of the emission region of a blazar jet than has been possible until now.
Variations in the flux of blazars at all wavebands, and in the linear polarization at radio to optical wavelengths, is largely stochastic in nature, which can be interpreted as the result of turbulence Marscher2014; Peirson2018; Tavecchio2018; Peirson2019. Multi-zone emission models, often involving a turbulent magnetic field, can reproduce a number of the observed characteristics of the variable linear polarization. In a turbulent region, roughly modeled as cells, each with a uniform but randomly oriented field, we expect we expect a mean degree of polarization , with the value of exhibiting variability on short time-scales with a standard deviation Marscher2014, as often observed MJ2021. For a turbulent field in the plasma crossing a shock front, particle acceleration should be most efficient in cells whose magnetic field is nearly parallel to the shock normal; this bias leads to a higher value of and more pronounced variability at X-rays compared to lower frequencies Marscher2014. The passage of turbulent cells through the emission region would also cause irregular variations, including some apparent rotations, in Marscher2008; Peirson2018.
On the other hand, some of the observed radio and optical patterns of polarization variability (e.g., the aforementioned rotations) have been found to be inconsistent with purely stochastic processes Kiehlmann2017; Blinov2018. This indicates that there is some coherent ordering of the magnetic field, e.g., by compression or amplification by plasma processes in shocks (Tavecchio2020, e.g.,) or by the presence of a global, perhaps helical, magnetic field component (Lyutikov2005; Hovatta2012; Gabuzda2021, e.g.,). In the commonly used single zone model, the radiating particles are accelerated by an unspecified process to highly relativistic energies while confined within a plasmoid with a partially ordered or helical magnetic field. The global magnetic field structure is expected to produce similar polarization patterns across frequencies, with little variability over time DiGesu2022. If the field is helical, should align with the jet direction for most viewing angles Lyutikov2005. In an alternative scenario, which includes shock acceleration, particles become energized over a limited volume - e.g., at a shock front - and then advect or diffuse away from that region Marscher1985; Angelakis2016; Tavecchio2018. In this process, the electrons lose energy to radiation, and so emit at progressively decreasing frequencies as they travel away from the acceleration site. We refer to this model as “energy-stratified”. If the magnetic field is well ordered over the small volume of the acceleration region and becomes increasingly turbulent farther downstream, will decrease toward longer wavelengths, while can vary with frequency if the mean direction of the magnetic field changes as the volume increases. In Mrk 501, we expect a progressively higher from radio to X-rays. A shock partially orders the magnetic field of the plasma crossing the shock, with the ordered field perpendicular to the shock normal. This causes the net polarization electric vector to be aligned with the jet. In a kink-instability induced magnetic reconnection scenario, where contiguous regions of oppositely-directed magnetic field come into contact, the jet flow is sheared because of transverse velocity gradients Sironi2021. Shearing would stretch the magnetic field along the jet boundary, so that is expected to be transverse to the jet direction. The simultaneous contribution of multiple current sheets will lead to overall lower polarization than in a shock scenario, with similar levels of polarization across frequencies (Tavecchio2021, e.g.,). Our expectations from the different emission models are summarized in Table 1.
The first IXPE observation of Mrk 501 took place during 2022 March 8-10 (100 ksec, MJD 59646-59648) and was accompanied by observations across the electromagnetic spectrum from multiple observatories (see Methods). IXPE measured a polarization degree and an electric vector position angle (measured East of North) over the X-ray energy range of 2-8 keV. Contemporaneous radio-millimeter and optical observations (Extended Data Table 2) measured along and along . A second IXPE observation took place 2022 March 26-28 (86 ksec, MJD 59664-59667) yielding along . Simultaneously to the second observation, the optical polarization was measured as along (Extended Data Table 3). The two observed are consistent within 3. The radio and optical also lie within 3 from each other and . Moreover, the position angle of Mrk 501’s jet has been determined through Very Long Baseline Array (VLBA) imaging at 43 GHz to be Weaver2022. This would suggest that, in both cases, radio-to-X-ray is aligned with the jet axis within uncertainties (Fig. 1). We do not find evidence of polarization variability during either IXPE observation. Compared to the archival multiwavelength observations, we find the flux and polarization of Mrk 501 for both observations to be within one standard deviation of the median of the long-term light curves (Fig. 3). Blazars like Mrk 501 are known to reach as much as an order of magnitude higher X-ray fluxes during outbursts. For the first IXPE observation the measured X-ray flux indicates an average activity state, while during the second observation we find evidence of a slightly elevated X-ray flux state. Compared to the historical maximum X-ray flux, during our observations Mrk 501 was a factor of three and a factor of two fainter, respectively.
| Model | Multiwavelength | X-ray polarization | X-ray polarization |
| polarization | variability† | angle | |
| Single-zone | constant∗ | slow | any |
| Multi-zone | mildly chromatic | high | any |
| Energy stratified | strongly chromatic | slow | along the |
| (shock) | jet axis | ||
| Magnetic reconnection | constant | moderate | perpendicular |
| (kink instability) | to jet axis | ||
| Observed | strongly chromatic | slow | along the |
| jet axis |
∗There is a slight dependence on the slope of the emission spectrum. \tablenotes†Slow variability = a few days to week, moderate variability = days, high variability day.
The polarization measurements reported here reveal an increase in toward higher frequencies, with a degree of X-ray polarization that is more than twice the optical value (Fig. 2). This is in tension with the single-zone, turbulent multi-zone, and magnetic reconnection models discussed above. There is no significant variability within the duration of the individual IXPE observations, contrary to the predicted behaviour if turbulent cells moved in and out of the emission region on time-scales of days. On the other hand, the low () optical and X-ray polarization suggests significant disordering of the local magnetic field, possibly due to the presence of stationary turbulence. The wavelength dependence and lack of variability of , plus constancy of and its alignment with the jet direction, supports the shock-accelerated energy-stratified electron population scenario Marscher1985; Angelakis2016; Tavecchio2021. Previous intensely-sampled measurements of the polarization of Mrk 501 have found variations in by and in by from one night to the next MJ2021. These apparently discrepant results can be reconciled if the turbulence of the plasma flowing through shocks in the jet is only intermittent, as has been found previously in other blazars Webb2021. One would also expect deviations of the observed from the jet axis as one moves further away from the shock front into more turbulent regions of the jet. At present, the large uncertainties prevent us from confirming such behavior. Future observations of Mrk 501 or similar blazars will allow us to explore the jet’s multiwavelength polarization variability. A prediction of the energy-stratified model is that the X-ray polarization angle of blazars whose synchrotron spectral energy distribution peaks at X-ray frequencies, like Mrk 501, will exhibit rotations Blinov2016.
Probing the magnetic environment of the radiating particles site of energization has supplied a new method for discriminating among particle acceleration mechanisms in astrophysical jets. The new X-ray polarization observations, in combination with the previously available radio and optical polarization diagnostics, have provided a discriminating set of evidence. Our results demonstrate how multiwavelength polarization uniquely probes the physical conditions in supermassive black-hole systems. Future monitoring of the time variability of multiwavelength polarization with IXPE and other instruments will define better the range of physical conditions that occur in astrophysical jets.


Acknowledgments
I.L. thanks the Kavli Institute for the Physics and Mathematics of the Universe for their hospitality while this paper was written. The authors thank A. Veledina for discussions that helped improve this work. I.L. was supported by the JSPS postdoctoral short-term fellowship program. The Imaging X ray Polarimetry Explorer (IXPE) is a joint US and Italian mission. The US contribution is supported by the National Aeronautics and Space Administration (NASA) and led and managed by its Marshall Space Flight Center (MSFC), with industry partner Ball Aerospace (contract NNM15AA18C). The Italian contribution is supported by the Italian Space Agency (Agenzia Spaziale Italiana, ASI) through contract ASI-OHBI-2017-12-I.0, agreements ASI-INAF-2017-12-H0 and ASI-INFN-2017.13-H0, and its Space Science Data Center (SSDC) with agreements ASI-INAF-2022-14-HH.0 and ASI-INFN 2021-43-HH.0, and by the Istituto Nazionale di Astrofisica (INAF) and the Istituto Nazionale di Fisica Nucleare (INFN) in Italy. This research used data products provided by the IXPE Team (MSFC, SSDC, INAF, and INFN) and distributed with additional software tools by the High-Energy Astrophysics Science Archive Research Center (HEASARC), at NASA Goddard Space Flight Center (GSFC). Data from the Steward Observatory spectropolarimetric monitoring project were used. This program is supported by Fermi Guest Investigator grants NNX08AW56G, NNX09AU10G, NNX12AO93G, and NNX15AU81G. This research has made use of data from the RoboPol programme, a collaboration between Caltech, the University of Crete, IA-FORTH, IUCAA, the MPIfR, and the Nicolaus Copernicus University, which was conducted at Skinakas Observatory in Crete, Greece. The IAA-CSIC co-authors acknowledge financial support from the Spanish ”Ministerio de Ciencia e Innovacion (MCINN) through the ”Center of Excellence Severo Ochoa” award for the Instituto de Astrofísica de Andalucía-CSIC (SEV-2017-0709). Acquisition and reduction of the POLAMI and MAPCAT data was supported in part by MICINN through grants AYA2016-80889-P and PID2019-107847RB-C44. The POLAMI observations were carried out at the IRAM 30m Telescope. IRAM is supported by INSU/CNRS (France), MPG (Germany) and IGN (Spain). The research at Boston University was supported in part by National Science Foundation grant AST-2108622, NASA Fermi Guest Investigator grant 80NSSC21K1917, and NASA Swift Guest Investigator grant 80NSSC22K0537. This study uses observations conducted with the 1.8 m Perkins Telescope Observatory (PTO) in Arizona (USA), which is owned and operated by Boston University. Based on observations obtained at the Hale Telescope, Palomar Observatory as part of a continuing collaboration between the California Institute of Technology, NASA/JPL, Yale University, and the National Astronomical Observatories of China. This research made use of Photutils, an Astropy package for detection and photometry of astronomical sources (Bradley et al., 2019). GVP acknowledges support by NASA through the NASA Hubble Fellowship grant #HST-HF2-51444.001-A awarded by the Space Telescope Science Institute, which is operated by the Association of Universities for Research in Astronomy, Incorporated, under NASA contract NAS5-26555. Based on observations made with the Nordic Optical Telescope, owned in collaboration by the University of Turku and Aarhus University, and operated jointly by Aarhus University, the University of Turku and the University of Oslo, representing Denmark, Finland and Norway, the University of Iceland and Stockholm University at the Observatorio del Roque de los Muchachos, La Palma, Spain, of the Instituto de Astrofisica de Canarias. The data presented here were obtained [in part] with ALFOSC, which is provided by the Instituto de Astrofisica de Andalucia (IAA) under a joint agreement with the University of Copenhagen and NOT. VK thanks Vilho, Yrjö and Kalle Väisälä Foundation. J.J. was supported by Academy of Finland project 320085. E. L. was supported by Academy of Finland projects 317636 and 320045. Part of the French contributions is supported by the Scientific Research National Center (CNRS) and the French spatial agency (CNES). Based on observations collected at the Observatorio de Sierra Nevada, owned and operated by the Instituto de Astrofísica de Andalucía (IAA-CSIC). Based on observations collected at the Centro Astronómico Hispano-Alemán(CAHA), proposal 22A-2.2-015, operated jointly by Junta de Andalucía and Consejo Superior de Investigaciones Científicas (IAA-CSIC).
Corresponding author
I. Liodakis, JSPS International Research Fellow, yannis.liodakis@utu.fi,
Author contributions
I. Liodakis coordinated the multiwavelength observations, performed the analysis and led the writing of the paper. H. Krawczynski, A. P. Marscher, L. Peirson, P. Petrucci, J. Poutanen, F. Tavecchio, and R. Romani contributed with discussion and parts of the paper. I. Agudo, C. Casadio, J. Escudero, and I. Myserlis contributed with the radio-millimeter polarization data. B. Agís-González, I. Agudo, A. V. Berdyugin, M. Bernardos, G. Bonnoli, V. Casanova, M. G. Comas, C. Husillos, J. Jormanainen, V. Kravtsov, E. Lindfors, I. Liodakis, K. Nilsson, S. S. Savchenko, and A. Sota contributed with the optical polarization data. G. V. Panopoulou contributed the infrared polarization data. A. P. Marscher, G. M. Madejski, R. Middei, L. Pacciani, M. Perri, and S. Puccetti contributed the Swift and NuSTAR data. L. Di Gesu, N. di Lalla, I. Donnarumma, S. R. Ehlert, H. L. Marshall, R. Middei, M. Negro, N. Omodei, A. Paggi, and A. L. Peirson, contributed with the IXPE analysis. The remaining authors are part of the multiwavelength follow-up and IXPE teams whose significant contribution made the multiwavelength polarization observations possible.
Competing interests
Authors declare that they have no competing interests.
Data availability
The data that support the findings of this study are either publicly available at the HEASARC database or available from the corresponding author upon request.
References
- (1) Jorstad, S. G. et al. Polarimetric Observations of 15 Active Galactic Nuclei at High Frequencies: Jet Kinematics from Bimonthly Monitoring with the Very Long Baseline Array. AJ 130, 1418–1465 (2005). .
- (2) Marin, F. A complete disclosure of the hidden type-1 AGN in NGC 1068 thanks to 52 yr of broad-band polarimetric observation. MNRAS 479 (3), 3142–3154 (2018).
- (3) Blinov, D. et al. RoboPol: AGN polarimetric monitoring data. MNRAS 501 (3), 3715–3726 (2021).
- (4) Marscher, A. P. & Gear, W. K. Models for high-frequency radio outbursts in extragalactic sources, with application to the early 1983 millimeter-to-infrared flare of 3C 273. ApJ 298, 114–127 (1985).
- (5) Marscher, A. P. Turbulent, Extreme Multi-zone Model for Simulating Flux and Polarization Variability in Blazars. ApJ 780, 87 (2014).
- (6) Tavecchio, F., Landoni, M., Sironi, L. & Coppi, P. Probing dissipation mechanisms in BL Lac jets through X-ray polarimetry. MNRAS 480 (3), 2872–2880 (2018).
- (7) Weisskopf, M. C. et al. Imaging X-ray Polarimetry Explorer: prelaunch. Journal of Astronomical Telescopes, Instruments, and Systems 8 (2), 1 – 28 (2022).
- (8) Peirson, A. L. & Romani, R. W. The Polarization Behavior of Relativistic Synchrotron Jets. ApJ 864, 140 (2018).
- (9) Peirson, A. L. & Romani, R. W. The Polarization Behavior of Relativistic Synchrotron Self-Compton Jets. ApJ 885 (1), 76 (2019).
- (10) Marscher, A. P. & Jorstad, S. G. Frequency and Time Dependence of Linear Polarization in Turbulent Jets of Blazars. Galaxies 9 (2), 27 (2021).
- (11) Marscher, A. P. et al. The inner jet of an active galactic nucleus as revealed by a radio-to--ray outburst. Nat 452, 966–969 (2008).
- (12) Kiehlmann, S., Blinov, D., Pearson, T. J. & Liodakis, I. Optical EVPA rotations in blazars: testing a stochastic variability model with RoboPol data. MNRAS 472, 3589–3604 (2017).
- (13) Blinov, D. et al. RoboPol: connection between optical polarization plane rotations and gamma-ray flares in blazars. MNRAS 474, 1296–1306 (2018).
- (14) Tavecchio, F., Landoni, M., Sironi, L. & Coppi, P. Probing shock acceleration in BL Lac jets through X-ray polarimetry: the time-dependent view. MNRAS 498 (1), 599–608 (2020).
- (15) Lyutikov, M., Pariev, V. I. & Gabuzda, D. C. Polarization and structure of relativistic parsec-scale AGN jets. MNRAS 360 (3), 869–891 (2005).
- (16) Hovatta, T. et al. MOJAVE: Monitoring of Jets in Active Galactic Nuclei with VLBA Experiments. VIII. Faraday Rotation in Parsec-scale AGN Jets. AJ 144 (4), 105 (2012).
- (17) Gabuzda, D. C. Inherent and Local Magnetic Field Structures in Jets from Active Galactic Nuclei. Galaxies 9 (3), 58 (2021).
- (18) Di Gesu, L. et al. Testing particle acceleration models for BL LAC jets with the Imaging X-ray Polarimetry Explorer. A&A 662, A83 (2022).
- (19) Angelakis, E. et al. RoboPol: the optical polarization of gamma-ray-loud and gamma-ray-quiet blazars. MNRAS 463 (3), 3365–3380 (2016).
- (20) Sironi, L., Rowan, M. E. & Narayan, R. Reconnection-driven Particle Acceleration in Relativistic Shear Flows. ApJL 907 (2), L44 (2021).
- (21) Tavecchio, F. Probing Magnetic Fields and Acceleration Mechanisms in Blazar Jets with X-ray Polarimetry. Galaxies 9 (2), 37 (2021).
- (22) Weaver, Z. R. et al. Kinematics of Parsec-Scale Jets of Gamma-Ray Bright Blazars at 43 GHz during Ten Years of the VLBA-BU-BLAZAR Program. ApJS 260, 12 (2022).
- (23) Webb, J. R. et al. The Nature of Micro-Variability in Blazars. Galaxies 9 (4), 114 (2021).
- (24) Blinov, D. et al. RoboPol: do optical polarization rotations occur in all blazars? MNRAS 462 (2), 1775–1785 (2016).
Methods
X-ray polarization observations
IXPE is a joint mission of the U.S. National Aeronautics and Space Administration and the Italian Space Agency (Agenzia Spaziale Italiana). A description of the spacecraft and of the payload is given by Weisskopf2022; the detector units are described in Soffitta_2021. Mrk 501 was observed with IXPE over an effective exposure time of 100 ksec from 8 to 10 March 2022 (MJD 59646-59648) and again from 26-28 March 2022 (MJD 59664-59666) for 86 ksec. The exposure times were selected based on Liodakis2019, which determined that a 100 ksec exposure would be sufficient to measure polarization in Mrk 501 in a blind survey. At the angular resolution of IXPE, Mrk 501 is essentially a point source.
The IXPE raw (level-1) data were first reduced and corrected for instrumental polarization artifacts as well as boom and spacecraft motion to create level-2 event files (L2). The L2 data were then corrected for the energy scaling of the detector and bad aspect time intervals following standard procedures within the latest version of the ixpeobssim pipeline Pesce-Rollins2019; Baldini2022. The IXPE L2 files contain the polarization information in the form of photon-by-photon Stokes parameters. All the quoted results refer to the average of the three identical IXPE detector units (DU). We selected source photons using xpselect and a circular region with a radius of centered on the source. The polarization degree and angle was determined in the 2-8 keV energy range using three different analysis techniques performed by five independent groups to ensure an unbiased estimation. Those techniques were a model-independent analysis, spectropolarimetric fit in XSPEC, and a maximum likelihood spectropolarimetric (MLS) fit implemented within the MULTINEST algorithm. Although the effect of the photoelectric absorption is negligible over the 2-8 keV energy range of IXPE, the spectropolarimetric fits included photoelectric absorption based on the measured Galactic neutral hydrogen column density toward Mrk 501 of cm-2 Kalberla2005. The model-independent analysis applies the Kislat2015 formalism to a user-defined subset of photons and determines the total Stokes parameters. We have performed both a weighted and unweighted analysis. In the model-independent analysis we do not perform background subtraction. We found that the sky background counts for a region are only 3% of the total counts. We have verified that for a bright blazar such as Mrk 501, the background has a negligible effect on the polarization analysis. For the spectropolarimetric fits, we simultaneously fit 3 I, Q, U spectra (one set from each IXPE – DU). In XSPEC, following the approach of Strohmayer2017, we used an absorbed single power-law component with constant and (CONSTPOL model). For the MLS fit, we used a single power-law spectral component with constant intrinsic Q and U values. Given the exposure time and flux of Mrk 501 at the time of the IXPE observations, the minimum degree of detectable polarization at a 99% confidence level (MDP99) we were able to achieve is 6.6% for the 8-10 March, and 5.2% for the 26-28 March observation. The source was brighter in X-rays during the 26-28 March observation (see below), hence the lower MDP99. The derived and for the different methods are summarized in Extended Data Table 1 for both observations. In both cases, all the measurements through the different analyses are consistent within the uncertainties with the median linear X-ray and of %, and %, respectively. Extended Data Figure 1 shows the Stokes Q/I and Stokes U/I of our observation along with the MDP99. Depending on the emission model, variability time scales are expected to range from sub-day to a few days (DiGesu2022, e.g.,). A 16-day interval between observations allows us to look for variability on a few days time scale which, however, we do not find. We have also searched for variability within the individual IXPE observations. This was done by splitting the IXPE exposures in two and three equal size time-bins. We again do not find evidence for variability within the uncertainties.
Multiwavelength Observations
Here we report on a subset of our contemporaneous multiwavelength campaign from radio to TeV -rays which is summarized in Extended Data Table 2 & 3 and Fig. 2. The complete multiwavelength dataset will be presented in a forthcoming paper.
Millimeter-radio observations
Polarimetric millimeter radio measurements at 3.5 mm (86.24 GHz) and 1.3 mm (230 GHz) were obtained with the 30 m Telescope of the Institut de Radioastronomie Millimétrique (IRAM), located at the Pico Veleta Observatory (Sierra Nevada, Granada, Spain), on 9-10 March 2022 (MJD 59647-59649), within the Polarimetric Monitoring of AGN at Millimeter Wavelengths (POLAMI) program (http://polami.iaa.es/, Agudo2018; Agudo2018-II; Thum2018). Weather related reasons prevented us from obtaining radio observations during the second IXPE exposure. Under the POLAMI observing setup, the four Stokes parameters (I, Q, U, and V) are recorded simultaneously using the XPOL procedure Thum2008. The data reduction, calibration, and managing and flagging procedures used in POLAMI are thoroughly described in Agudo2018. The source was relatively stable in flux during the observations at both 1.3 and 3.5 mm with total flux densities of 0.710.04 Jy and 0.730.04 Jy at 3.5 mm, and 0.410.02 Jy and 0.390.02 Jy at 1.3 mm, on 9 and 10 of March respectively. Also, the polarized flux at 3.5 mm remained stable both in linear polarization degree and angle between the two dates. No polarization above 3.46% (95% confidence upper limit) was detected at 1.3 mm.
Optical and infrared observations
Optical polarization observations were performed using several telescopes across the world: the Nordic Optical Telescope (NOT) on the night of 8-9 March (MJD 59647); the Tohoku 60 cm (T60) telescope at the Haleakala Observatory on 10 March (MJD 59649) and on 28 March (MJD 59667); the 2.2m Calar Alto Observatory and 1.5m Sierra Nevada Observatory telescopes on 8-10 March; the AZT-8 telescope of the Crimean Astrophysical Observatory and the St. Petersburg State University LX-200 telescope during 8-10 March and 25-28 March.
The NOT observations used the Alhambra Faint Object Spectrograph and Camera (ALFOSC) in four bands (BVRI) in the standard polarimetric mode. The data were then analyzed with the semi-automatic pipeline developed at the Tuorla Observatory using standard photometric procedures Hovatta2016; Nilsson2018. Both highly-polarized and unpolarized standard stars were observed during the same night for calibration purposes. The T60 polarimetric measurements were performed using the Dipol-2 polarimeter Piirola2014. Dipol-2 is a remotely operated double-image CCD polarimeter, which is capable of recording polarized images in three (BVR) filters simultaneously Piirola1973; Berdyugin2018; Berdyugin2019; Piirola2021. We obtained 24 individual measurements of the Stokes Q/I and U/I parameters simultaneously in three filters (BVR). Twenty unpolarized and two highly-polarized (HD204827 and HD25443) nearby standard stars were observed for calibration and determination of the polarization angle zero point. The individual measurements were used to compute nightly average values using the “2 sigma-weighting algorithm”. The algorithm iteratively filters out outliers, assigning smaller weights to these measurements. The errors on the Stokes Q/I and U/I parameters were computed as standard errors of the weighted means. These errors were then used to estimate uncertainties on the polarization degree and angle Kosenkov2017; Piirola2021. The Calar Alto Observatory observations were performed in the Johnson Cousins optical band by the Calar Alto Faint Object Spectrograph (CAFOS) in imaging polarimetric mode on the 2.2m Telescope. The data were reduced following standard analysis procedures using both unpolarized and polarized standard stars for calibration purposes. Similarly, Mrk 501 was observed by the 1.5 m telescope at Sierra Nevada Observatory using polarized filters during the three nights. The 70cm AZT-8 telescope and the 40cm LX-200 telescope observations were carried out in the Cousins R band. Both telescopes are equipped with nearly identical imaging photometers-polarimeters based on a ST-7 camera. Two Savart plates rotated by 45 deg relative to each other are swapped to measure the relative Stokes q and u parameters from the two split images of each source in the field. The polarization parameters for each observation are produced by the sum of 1530s consecutive exposures. The data are then corrected for bias, flat field, background level, and calibrated for instrumental and interstellar polarization using the (assumed) unpolarized comparison stars 1, 4, and 6 from Villata1998. The same stars were used to perform differential photometry. During both IXPE observations, all the optical polarization observations are within uncertainties, which suggests no significant variability.
Observations were also obtained with the WIRC+Pol instrument Tinyanont2019a on the 200-inch Palomar Hale telescope in band. WIRC+Pol uses a polarizing grating to disperse the light into four beams that sense the four different components of linear polarization (, , , ), and a half-wave plate for beam swapping to improve polarimetric sensitivity (Tinyanont2019b; Millar-Blanchaer2021). Data reduction made use of the WIRC+Pol Data Reduction Pipeline software (https://github.com/WIRC-Pol/wirc_drp, Tinyanont2019a). The pipeline software averages the measurements over the course of the half-wave plate rotation cycles to account for subtle differences in light paths through the instrument, and reports the degree and angle of polarization in each band. The results were verified with the use of both polarized and unpolarized standard stars. For additional details on the data reduction, see Masiero2022.
The starlight from the host galaxy (assumed to be unpolarized) of Mrk 501 contributes a significant fraction of the optical flux. For this reason, the observed needs to be corrected for the depolarization effect of the host-galaxy. To achieve this, we need to estimate the contribution of the host galaxy (, in mJy) within the aperture used for the analysis of individual observations. The light profile of Mrk 501’s host galaxy has been fully characterized in the R-band in Nilsson2007. This allows us to estimate for each observation separately. We then subtract from the total intensity and estimate the intrinsic polarization degree following Hovatta2016 as . Due to the Dipol-2 instrument layout as well as the lack of a light profile model for the host galaxy in the J-band we are not able to accurately estimate the host-galaxy contribution to the polarization measurements for the T60 and Palomar-Hale telescopes. For this reason, the measurements from T60 and Hale should be treated as lower limits to the intrinsic polarization degree. For the remaining telescopes, we calculate in the R-band for each observation and then estimate a median. We find the median intrinsic polarization degree and its uncertainty to be for the 8-10 March observation and for the 26-28 March observation. Figure 2 shows the multiwavelength polarization degree from radio to X-rays.
X-ray observations
During the IXPE observations we independently measured the X-ray total flux and spectrum with the X-Ray Telescope (XRT, Burrows2005) on the orbiting Neil Gehrels Swift Observatory (Swift) in Window Timing mode (WT, 41 ksec exposures – 21 ksec for each IXPE observation) and with the Nuclear Spectroscopic Telescope Array (NuSTAR, 20 ksec exposure, Harrison2013) during the 8-10 March observation. We extracted the X-ray spectrum from each telescope following standard analysis procedures and the latest calibration data files. For the source regions we used a circular radius of and for Swift and NuSTAR, respectively. To estimate the background for the NuSTAR spectra we used a circular region outside of the region containing significant photon counts from Mrk 501. The background for Swift was extracted using the same size circular region from an available blank sky WT observation from the Swift archive. For the 8-10 March observation, we fit the combined Swift and NuSTAR data in XSPEC with an absorbed log-parabola model , in the 0.3-79 keV energy range. was set to the Galactic value, and the pivot energy was set to 5 keV. This model provides a reasonably good fit to the data () with best-fit parameters and . We also tested a single power-law model, however, there is clear curvature in the spectrum and the fit is statistically worse (). We measure the flux of the source in the 2-8 keV range to be (10.00.5). We do not find evidence for variability during the IXPE observations. For the 26-28 March observation we follow the same procedure using only the available Swift data. The source was in a higher flux state with and and flux in the 2-8 keV range of (21.00.6). The Swift observations show a change from 12 to 14 counts/sec (17% increase) from the beginning until the end of the IXPE observation. The results from our multiwavelength campaign are summarized in Extended Data Table 2 and 3.
Activity state of Mrk 501
Mrk 501 is a BL Lac object at a redshift of , corresponding to a luminosity distance of 141.3 Mpc, assuming a flat CDM cosmological model with =0.27 and H0=71 km/s/Mpc Komatsu2009, and a synchrotron peak frequency Ajello2020. It is among the brightest sources in the sky at very high -ray energies ( Tev), and is well-studied across the electromagnetic spectrum (Quinn1996; Abdo2011; Aleksic2015; Ahnen2017; Arbet-Engels2021-II, e.g.,). We use archival data from Swift (https://www.swift.psu.edu/monitoring/), Steward observatory (http://james.as.arizona.edu/~psmith/Fermi/,Smith2009), the RoboPol program (http://robopol.physics.uoc.gr/, Blinov2021), and the Boston University (BU) blazar monitoring program (https://www.bu.edu/blazars/index.html) to build the long-term light curves of Mrk 501 in optical brightness (R-band magnitude), optical polarization degree, polarization angle, and X-ray flux (Fig. 3). The optical observations cover a range from October 2008 up to June 2021. At R band, the source varied between and , with a median of . The median observed (not corrected for the host-galaxy contribution) was 2.1% with a minimum of 0.07% and a maximum of 5.9%. The typically fluctuates about the jet axis (120) with a median of 136∘, and a minimum and maximum of 65∘ and 171∘ respectively. The X-ray observations cover a range from April 2005 until June 2020. The median X-ray flux in the 0.3-10 keV was 15, with a minimum and maximum at around 3.7 and 76, respectively. At the time of the IXPE observations our multiwavelength campaign finds the flux and polarization of the source within one standard deviation of the median of the respective archival light curve. For the first IXPE observation the X-ray flux of the source seems to correspond to an average state, while in the second observation we find the source in a slightly elevated-flux state.
References
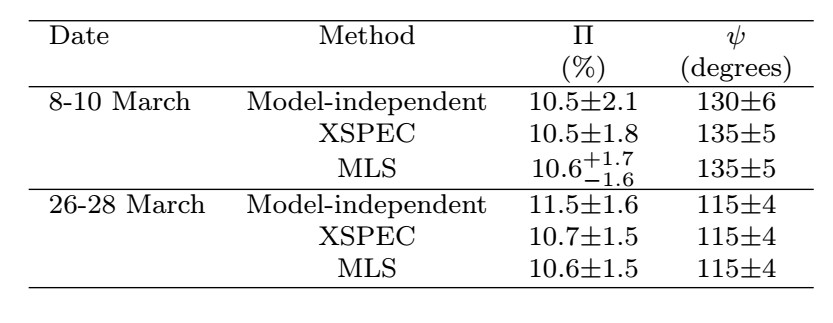
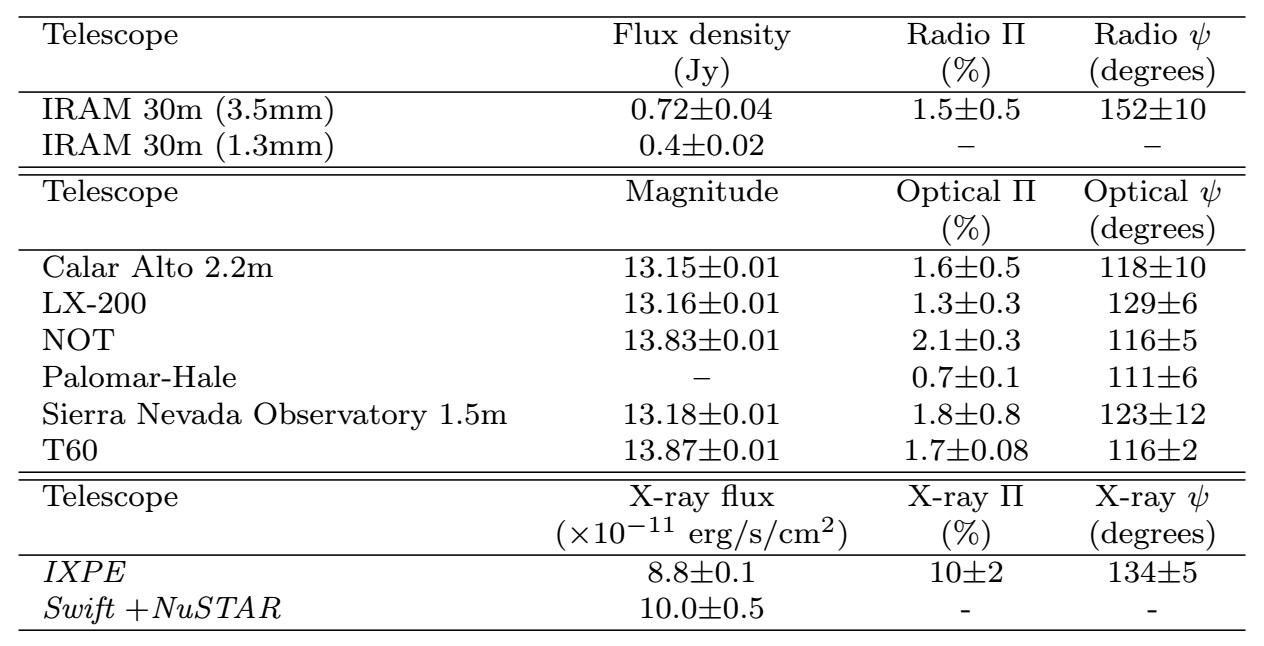
Table comments: The millimeter-radio flux density is in Janskys. For the millimeter-radio and optical observations we report the median estimate of the observations during the IXPE observation. The listed uncertainty is either the standard deviation of the measurements or the median uncertainty, whichever is larger. For the NOT and T60 analysis we used a circular radius aperture. For the data analysis of remaining optical telescopes we used a aperture. The Palomar observations are in the J-band. is given in degrees. The X-ray fluxes are estimated in the 2-8 keV range, and given in units of .
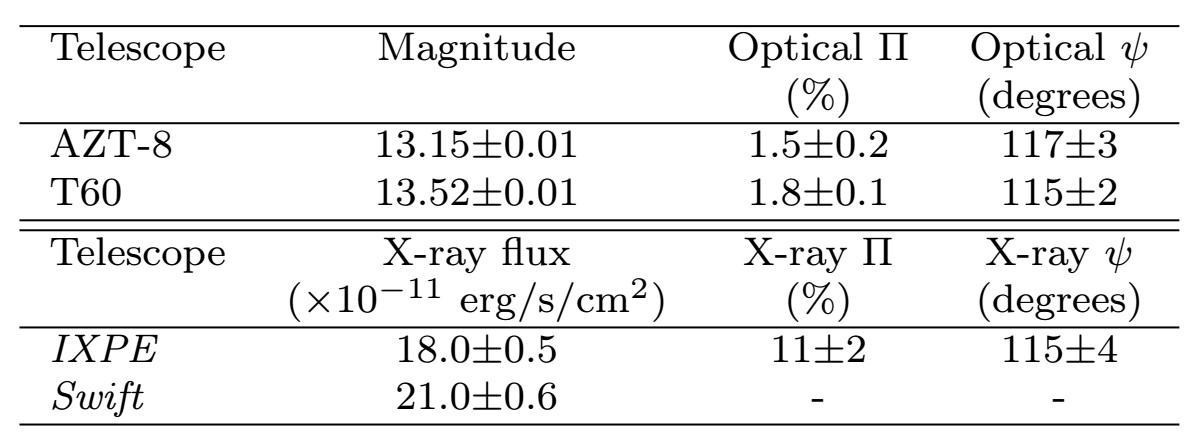
Table comments: Same as in Extended Data Table 2.
