What is wrong with the image charge force of keV ions in insulating nano-capillaries ?
Abstract
In nano-capillaries of large aspect ratio, the attractive image charge force is strong enough to affect the trajectory of ions passing through capillaries and consequently to diminish the fraction of transmitted beam ions. We calculated the theoretically transmitted fraction, using an approached but CPU-friendly expression of the image charge force valid in the case of a static ion and an infinite cylindrical dielectric interface. When comparing the theoretically transmitted fraction to available experimental data for nano-capillaries with an inner diameter of less than 200 nm, we found a surprisingly large disagreement, i.e., the theoretically transmitted fractions were easily an order of magnitude lower than the experimental ones. Noting that the image charge force depends on the velocity of the ion via the frequency dependent relative permittivity of the insulator, we investigated whether the disagreement could be lifted using a velocity depend image charge force. We give the exact expressions of the dynamical image charge force for a plane and cylindrical dielectric interface as a function of the ion velocity. We then re-evaluated the theoretically transmitted fractions in the case of SiO2 and PET dielectric interfaces. Our findings are discussed in the light of the available experimental data.
pacs
34.80.Dp, 34.80.PaI Introduction
Guiding of low-energy ions by insulating capillaries was first reported by Stolterfoht et al. in 2002 for nano-capillaries Stolterfoht_2002 and later by Ikeda et al. Ikeda for macroscopic glass capillaries. Their experimental results showed that even though the capillaries were tilted with respect to the beam axis such as no geometrical transmission was allowed, the beam was steered after an initial charge-up phase through the insulating capillary by self organized charge patches. As a result, a part of the beam could be transmitted, with the ions keeping their initial charge state, indicating that the ions never touched the inner wall. Those pioneering results triggered numerous experimental and theoretical studies to better understand the guiding process of keV ions through insulating capillaries Schiessl05; Sahana_PRA_2006. For an overview, the reader may consider Lemell_2013 and Stolterfoht_2016. By combining available experimental data with theoretical predictions, insulating capillaries become a formidable tool to explore the dynamics of excess charges in insulators in the presence or absence of charge injection. Indeed, the time-evolution of the rate, energy and angular profile of the transmitted ions give indirectly information about the charge injection process by ion-surface collisions and about the relaxation process of excess charge in insulating capillaries.
On the theoretical front, models for the charge dynamics in insulating capillaries were contentiously refined over time in order to improve the description of the charge injection and charge relaxation in insulating capillaries Schiessl07; Stolterfoht13-1; Giglio_PRA_2018; GIGLIO_2020; Niko_atoms_2020; GIGLIO_PRA_2021. In particular, the electric field inside the capillary was calculated precisely by considering appropriate boundary conditions at the inner and outer surface of the capillary GIGLIO_2020. In recent models for glass macro-capillaries, the charge injection at the inner surface term accounts even for secondary electrons emitted by ion-surface collisions and subsequently re-absorbed by the surface GIGLIO_PRA_2021. In nano-capillaries, the bulk and surface currents were even considered to depend non-linearly on the electric field as the electric field in nano-capillaries exceeds easily the keV/mm Niko_atoms_2020. Eventually, the image charge force acting on the beam ions inside nano-capillaries was added to the dynamics to explain the observed beam-shaping of transmitted ions through muscovite mica nano-capillaries with rhombic and rectangular section Zhang_2012; Zhang_2017. Indeed, when an ion approaches a dielectric interface separating two different dielectric media, the induced surface polarization charges attract the ion toward the interface. In nano-capillaries, the attractive image charge force was shown to be strong enough to sensibly affect the trajectory of beam ions and consequently the fraction and angular distribution of transmitted beam ions.
In this work, the author proposes to focus in more detail on the modeling of the image charge force acting on beam ions through cylindrical nano-capillaries. In particular, we want to investigate whether experimentally observed transmission rates through insulating straight nano-capillaries are well reproduced using the expression of the image force inside a cylindrical dielectric. Several experimental studies reported the transmission rates of keV ions through insulating nano-capillaries Sahana_PRA_2006; Niko_PRA_2010; Niko_EPJ_2021; Zhang_2017. Here, we are mostly interested in those cases where a uniform keV ion beam was injected at zero tilt angle and for which the measured transmitted fraction, defined as the transmitted current divided by the injected current, was given. These conditions constitute an ideal setup for which the transmitted fraction can be calculated analytically as the ion trajectories are dominated by the image charge force. Indeed, as will be discussed further in the text, for a uniform beam, aligned with the capillary axis, the charge deposited in the capillary can be assumed axisymmetric, yielding an inner electric field that is negligible compared to the image charge force. As a result, ion beams through zero-tilted nano-capillaries are a formidable tool to investigate the image force of ions moving along a cylindrical dielectric interface.
The paper is organized as follow. In section II, we present and discuss a CPU-friendly expression of the image force acting on a charge inside a cylindrical dielectric interface. We then calculate the theoretical transmitted fraction in the case where the injected beam is aligned with the capillary axis. Next, we highlight the discrepancy between the theoretical and the experimental transmitted fractions found in the literature. That finding made us question the validity of the expression of the image charge force used here. In section III we propose to improve the expression of the image charge force by explicitly taking into account the velocity of the ion and the frequency dependence of the relative permittivity of the capillary. We then calculate the image charge force as a function of the ion velocity and discussed its influence in the case of an arbitrary dielectric response function. In section IV we re-evaluated the theoretical transmitted fractions using this time the velocity depend image charge force, mainly for those cases for which experimental data is available in the literature. We discuss then in how far the velocity dependent image charge force lifts the initially mentioned discrepancy.
II Theoretical and experimental transmitted fractions
In the following, we highlight the apparent disagreement between the theoretical and experimentally observed transmitted fraction and of ions trough nano-capillaries. In a first step we will define the theoretically transmitted fraction of an injected ion beam at zero tilt angle, in the ideal case where the capillary is a straight tube and the uniform, mono-kinetic ion beam has zero divergence. Then, we compare the theoretical transmitted fraction to the one found in former published works and discuss the observed discrepancies.
The ion trajectories through charged capillaries is mainly affected by two fields, the electric field generated by the accumulated charges in the capillary walls and by the image force. For a beam aligned with the capillary axis the deposited charge distribution has axial symmetry, generating an axisymmetric electric potential . Such a potential yields an inner electric field that competes with the image force only if the accumulated charge density in the bulk exceeds a certain amount. But because the insulator cannot withstand an electric field larger than the dielectric strength field, typically kV/mm Dash_2018, without undergoing electrical breakdown and becoming electrically conductive, the accumulated charge in the capillary wall is limited. We performed simulations with our numerical code InCa4D Giglio_PRA_2018 where we followed the trajectories of keV ions through a SiO2 nano-capillary. We monitored the ion transmission for several hours ( see black curve in figure 1) and found that the transmission is stable in time and neither increased or reduced by the deposited self-organized charge. Details of the calculations are presented in Appendix VI.1. Simulations confirm that the effect of the deposited charge on the transmission is negligible and that it is not possible to charge an insulating nano-capillary to the necessary amount to generate an inner electric field that competes with the image force.
We assume thus in the following that the theoretically transmitted fraction depends only on the image force that acts on the ions passing through the capillaries.
II.1 Theoretically transmitted fraction
II.1.1 Image charge force at a cylindrical dielectric interface
Let us assume a translationally invariant cylindrical dielectric interface of radius , separating the inner vacuum from the outer insulating medium of dielectric relative permittivity . A charge is located inside the cylinder at position , where is the distance from the symmetry axis Oz. The modeling of the image force acting on the charge is described in details in Karoly_NIMB_1999; Karoly_PRA_2001 and CUI_2006. The resulting force, expressed in cylindrical coordinates () is purely radial and given as a sum over angular moments and wave-numbers ,
| (1) |
where is the radial unit vector, the modified Bessel function of order and a dimensionless function, accounting for the dielectric permittivity of the capillary. The expression of is given by Eq. . Because of the sum over and , computing the image charge force may be too time consuming in simulations and a simpler, CPU-friendly expression approaching would be welcomed. On the basis of the image charge force of a perfectly conducting cylindrical interface (Eq. 12) given by Kökési et al. Karoly_NIMB_1999; Karoly_PRA_2001, we proposed to approach by the following CPU-friendly expression,
| (2) |
In order to check how well approaches , we compute the ratio as a function of and for various values of . Results are shown in Fig. 2. was evaluated using nm and the sum over was limited to the first 100 angular moments, which was found to be sufficient for an accurate evaluation of (1) up to a radial position . The relative error decreases with increasing , but even for , the ratio is close to unit, with a relative error of about than 10%, meaning that the exact expression is well approached by . In particular, close to the interface, , tends asymptotically to . In our simulations and for the evaluation of the theoretical transmitted fraction, we will thus use instead of the exact but CPU consuming expression (1) to model the image charge force that acts on the ion inside the cylinder.
II.1.2 Ion trajectories and the theoretical transmitted fraction
We assume that a charge of mass and energy enters the cylindrical capillary with an initial radial distance and with an initial velocity , so that at one has . The trajectory of the ion can then be readily computed by solving the differential equation
| (3) |
with the initial values and . Introducing the dimensionless quantities and , equation (3) can be re-written in dimensionless form
| (4) |
with and and where the dimensionless factor
| (5) |
accounts for the length , inner radius and dielectric constant of the capillary as well as the kinetic energy of the charge. Remarkably, the factor tells us that the dimensionless image charge force scales with the square of the capillary length and but with the inverse cube of the capillary radius . This explains why, for nano- and macro-capillaries of same aspect ratio , the force can be neglected in macro-capillaries ( mm) but not in nano-capilleries ( nm). Also note that the force is inversely proportional to the kinetic energy of the ions.
Equation (4) is solved numerically, using a standard 4 order Runge-Kutta method. For a given and for a given initial value the trajectory is uniquely defined. If the trajectory is intercepted by the capillary wall, we reduce the initial value of , otherwise, is increased. Using the bisection method, a good estimate for the largest value of , for which the ion is still transmitted is found. Assuming that the injected current density is uniform, one has and . The ratio
| (6) |
defines the theoretical transmitted fraction of the ion beam in the ideal case where the nano-capillary is a straight cylinder and the ion beam has zero divergence. The fraction depends only on the factor and has to be understood as an upper bound value, obtainable only in ideal conditions, i.e. the injected beam is spatially uniform, mono-kinetic, parallel and the capillary is perfectly cylindrical. In figure 3, we show 3 trajectories for 3 different values of in the case of . We see that only the ions that are injected at a distance less than are transmitted, so that for the transmitted fraction equals 18.6%.

The theoretical transmitted fraction was calculated for a large range of and is shown in Fig. 4. In the case of marco-capillaries, is typically well below , yielding close to 100 %. As expected, this indicates that the effect of the image charge force on the ion trajectory is negligible in macro-capillaries. However, for keV ions through nano-capillaries, is or the order of unit, and the ions transmission is expected to be strongly reduced by the image charge force. For as large as 10, the transmitted fraction falls even below 1%.
II.2 Comparison with experimental data
In experimental works on nano-capillaries, authors usually give the transmitted ion rate through a large number of capillaries rather than the transmitted fraction . Indeed, the injected ion rate has to be deduced from the current density and size of the beam, as well as transparency of the foil containing the capillaries, parameters which are difficult to obtain with sufficient precision. We nevertheless found three experimental studies which give the transmitted fraction at zero tilt angle.
Surprisingly, when comparing the theoretical transmitted fractions to experimental data found in Sahana_PRA_2006; Niko_PRA_2010; Niko_EPJ_2021, we noticed a significant disagreement. In a recent work by Stolterfoht et al. Niko_EPJ_2021, a transmitted fraction of 50% was observed for an 3-keV Ne7+ ion beam through polyethylene terephthalate (PET) nano-capillaries. The latter have a length of m and a diameter of nm, yielding an aspect ratio of . Using for PET a dielectric constant of 3.0 Jin_2006, one has for the parameter a value of 0.55. The theoretical transmitted fraction obtained for is 28%, which is lower than the experimental one by almost a factor 2. In order to recover the experimental transmitted fraction of 50%, the parameter needs to be reduced by a factor 4.
In 2010, Stolterfoht et al. measured the transmission rate of PET nano-capillaries of various diameter , ranging from 100 to 400 nm Niko_PRA_2010. They did not give the transmitted fraction for each diameter but rather the relative transmitted ion yield . They found that at zero tilt angle, is grossly proportional to the section of the capillary,
This trend is shown in figure 5, where the data (red triangles) were extracted from Niko_PRA_2010 and fitted by a function. Obviously, this analysis advocates that, for those measurements, the current density and spot size of the injected ion beam was kept constant. It follows that the injected current was also proportional to the inlet section of the capillaries,
so that the transmitted fraction was found grossly independent from the capillary radius . This is surprising because equation 5 tells us that scales as and thus a strong dependence of the transmitted fraction on the capillary radius is expected, i.e. figure 4. We illustrate this discrepancy in figure 5, where we compare extracted from Niko_PRA_2010, to the theoretical values
| (7) | |||||
for each capillary diameter used in Niko_PRA_2010. For better comparison, the currents are normalized to unit for nm. While the measured transmitted current (red triangles) scales approximately as as indicated by the dashed red curve, our model predicts that the transmitted current decays much faster with decreasing capillary diameter. In particular, for nm, the discrepancy is huge, the theoretical transmitted current being 35 times smaller than the observed one. This discrepancy makes us question the validity of expression (2) for the image charge force acting on a keV ion passing through PET nano-capillaries.
In their work of 2006 on highly ordered SiO2 nano-capillaries, Sahana et al. Sahana_PRA_2006 found that 20% of the Ne7+ ions, entering the capillaries at zero tilt angle, are being transmitted. They used a 7 keV ion beam and the nano-capillaries had a length of m and a diameter about nm, yielding a large aspect ratio of about . Taking for the dielectric constant of amorphous SiO2 a value of 3.9 Kitamura_AO_2007, we get using (5) for the factor a value of . For such a large , our simulations find that only those ions which are injected within an initial distance nm from the symmetry axis are transmitted. The theoretical transmitted fraction calculated with is %, which is by a factor 100 lower than the experimental one. In order to recover the experimental transmitted fraction of 20%, the scaling factor should be reduced here by a factor 14.
The observed transmitted fraction in those three studies Sahana_PRA_2006; Niko_PRA_2010; Niko_EPJ_2021 are systematically significantly larger than those found theoretically in the ideal case. This seems to indicate that the image charge force as given by Eq. 2 is not valid for keV ions through nano-capillaries. We remind that expression (2) was obtained in the electrostatic limit with a static relative permittivity . The experimental data do not corroborate the theoretical scaling of the transmitted fraction with the capillary radius. In particular, the influence of the image charge force in cylindrical capillaries with a diameter smaller the 200 nm seems to be much lower than what is predicted theoretically.
Case of rhombic and rectangular capillaries
Apart from cylindrical nano-capillarie, experimental studies were also done on muscovite mica nano-capillaries with rhombic (long axis 248 nm and short axis 142 nm) and rectangular section (215 450 nm2) Zhang_2012; Zhang_2017. The observed beam-shaping of the transmitted ion was shown to be due to the image charge force, indicating clearly that the image charge force influences dominantly the ion trajectories. In their simulations, the image charge force is a superposition of the image charge force for a plane dielectric surface for each of the 4 plane surfaces. Interestingly, their simulations succeeded to reproduce the observed transmitted fraction of about 1% for 7 keV Ne7+ through the rhombic shaped muscovite mica nano-capillaries. However, in the case of rectangular capillaries, the simulated transmission rate and experimental values differ considerably (the experimental values are lower), but was attributed to size variations inside the channels.
We conclude this section by noting that significant disagreements were found between measured and theoretical transmitted fractions in the case of cylindrical nano-capillaries made in PET and SiO2. Better agreement was noticed in the case of rhombic shaped mica nano-capillaries, but was not further confirmed in nano-capillaries with rectangular sections. Where disagreement was fount, the experimental transmitted fraction was always significantly larger than the theoretical or simulated one.
III Velocity dependent image charge force
The disagreement highlighted in the previous section made us question the validity of expression (2) of the image charge force in the case where keV ions pass through a nanocapillary of large aspect ratio. There are indeed two effects that we ignored in the evaluation of the image charge force . If the inner surface of the capillary is hit by ions, the accumulated charge may modify the dielectric response of the insulator. For example, in pre-charged PET samples, the trapped charge was found to partially inhibit the dipolar polarization, reducing by about 5% the dielectric permittivity with respect to untreated PET Liu_2021. However, except for Liu_2021, which limited their study below the 1MHz domain, no other reference was found. So while the accumulated charge seem indeed to modify the dielectric response, the effect of excess charge on the dielectric response function is hardly documented in the literature and otherwise difficult to estimate by simple considerations. We decide thus for the present study to ignore the effect of the charge on the dielectric response.
The other effect is that the ions are moving and the velocity of the ions influences the induced polarization at the interface. The dynamical effects in the image charge force were already investigated by Harris_1974 in the case of a metal plane interface. They found that dynamical corrections become non-negligible when the velocity of the moving charge approaches the Fermi velocity of electrons in metals. The reason is that the image charge follows the mirror trajectory but is retarded by a distance due to the finite response time, of the electron gas. Similar findings are presented by Tőkési et al. Karoly_PRA_2001 where they studied the dynamical correction of the image force in the case of a cylindrical conducting interface. We will in this section investigate the image charge force for a moving ion approaching a dielectric plane and cylindrical interface and evaluate in how far dynamical corrections modify the static image forge in the case of keV ions.
III.1 Frequency dependent relative permittivity
The relative permittivity of bulk describes the ability to polarize a material subjected to an electrical field. In dielectrics, his polarization originates from a number of sources: electron cloud displaced relative to nucleus, relative displacement of atoms, alignment of dipoles in electric field and accumulation of charge carriers at the interface. These sources have different response times so that the relative permittivity depends on the angular frequency of the external electric field. We assume that the dependence of on the wave vector can be neglected if the spatial extension of the induced dipole moments is small compared to the wavelength , which is the case for frequencies of the electromagnetic field well below optical frequencies Petezlt. The function is a complex quantity and the frequency-dependence of the real and imaginary part of is illustrated in Fig. 6.
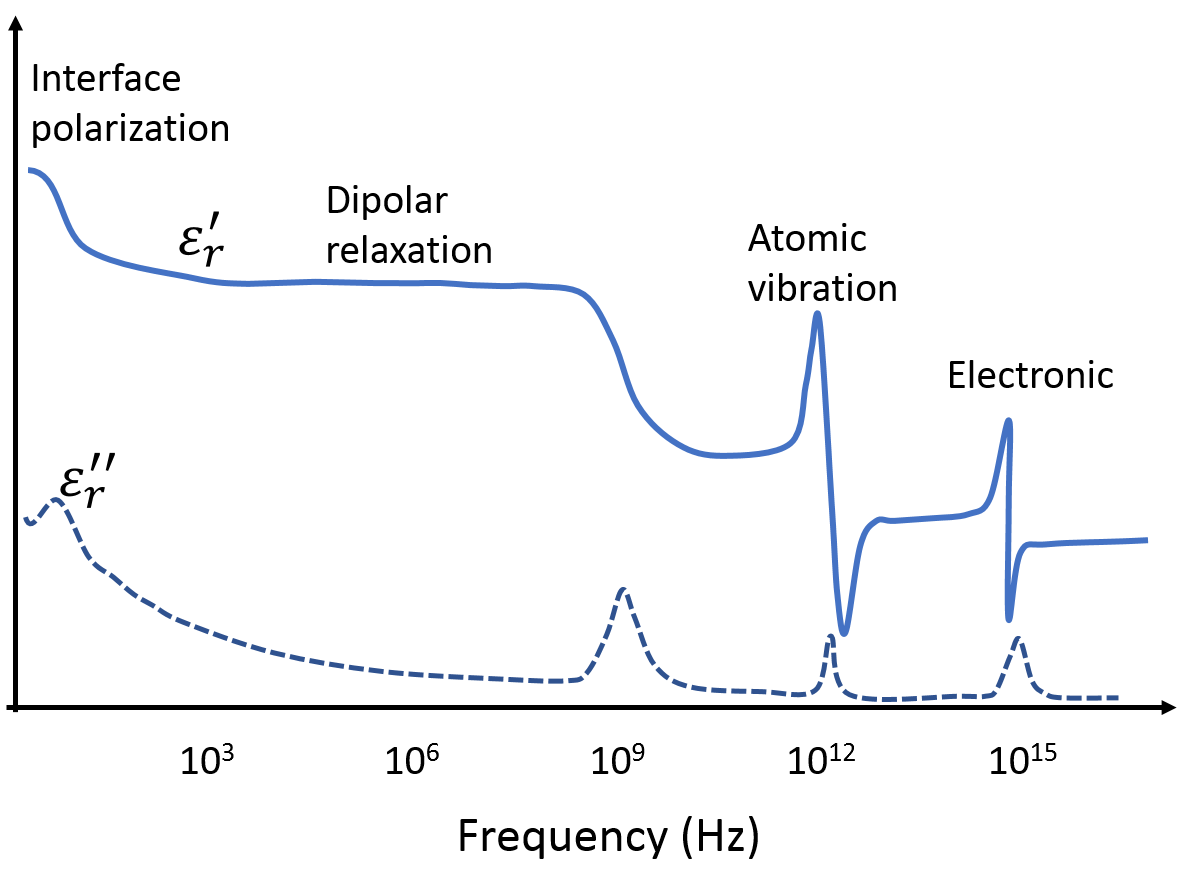
For a keV ion moving along the interface, the electric field generated at a point of the interface may quickly evolve in time. If the response time of the dielectric function is too low, the patch of induced surface charges may trail the ion, which results in a reduction of the image charge force. Only polarization sources that have a sufficiently fast response time will contribute significantly to the image charge force. For a dielectric interface, the image force is thus expected to depend on the velocity of the ion Harris_1974; Karoly_PRA_2001. Considering a keV ion having typically a velocity of about m/s and located 10 nm from the interface, the electric field generated by the ion at a point of the interface has a characteristic frequency of THz, which is well in the infrared domain, where the dielectric response of insulators may vary significantly. In figure 7 we give the real part of the dielectric response of SiO2 and PET insulators in the THz domain. Data were extracted from Cataldo_2016; Zhang_2020; Fedulova and show that the atomic dipole resonances responsible for a large part of the value of are found above 10 THz.
III.2 Velocity dependent image charge force
We will now evaluate the influence of the velocity of a moving charge on the image force. In a first step, we investigate the image force in the case of an infinite plane interface, which yields for the velocity dependent image force a handy expression, facilitating the discussion. Then, we check its effect on in the case of a cylindrical interface.
III.2.1 Case of an infinite plane interface
Let us consider a homogeneous dielectric which fills the region . The region is empty. A projectile of charge is situated at and moves along the Oz coordinate with the velocity . The expression of image charge force acting on a moving ion has been detailed in appendix VI.2 and is given by
| (8) |
The image charge force depends on the velocity of the ion and on the frequency response of the dielectric function . For angular frequencies , the modified Bessel function decreases as , so that the ratio can be regarded as a cut-off angular frequency and only angular frequencies smaller than will contribute significantly to the image charge force. For example, 7 keV Ne7+ ions (as used by Sahana et al. Sahana_PRA_2006) positioned nm from the interface yield a cut-off angular frequency of about radians Hz. The latter is close to the atomic polarization resonances, where the dielectric function varies quickly. Thus, for keV ions, the dielectric response function cannot be assumed constant and the image charge force is expected to depend significantly on the ion velocity.
For much lower ion velocities, the cut-off frequency may fall below 1 Mhz. In this low frequency range, the relative permittivity of insulators is usually constant, interfacial polarization apart. Taking and integrating over yields the well-known image charge force for a plane vacuum-dielectric interface Jackson.
| (9) |
Equation (9) can thus be seen as the adiabatic limit of Eq. (8), i.e. for of vanishing small ion velocities .
The dependence of the image charge force on the ion velocity is shown in figure 8. For better readability, we normalize the latter with respect to the adiabatic () image charge force (Eq. 9), which allows to highlight the influence of the ion velocity on the force. The normalized force is shown for three different distances from the dielectric plane interface, namely = 5, 10 and 20 nm. Here, we used the dielectric response function of SiO2 as shown in Fig. 7, which has a large response in the THz domain, due to the ionic and atomic vibrations of the glassy network.
For a distance nm from the interface, the normalized image charge force is reduced by 40% for ion velocities larger than m/s. The reason is that for m/s, atomic and ionic modes that usually lie in the THz range do not respond quickly enough to the time-varying electric field. Only bound electrons respond quickly enough and contribute to the surface polarization. For even larger velocities , bound electrons are not responding fast enough and the image force tends to zero. With this example we illustrate that the image charge force acting on a charge moving along a cylindrical interface is significantly reduced for velocities above a critical value, which depends on the frequency response of the dielectric function and distance from the dielectric interface.
III.2.2 Case of an infinite cylindrical interface
In the next step, we consider an infinite cylindrical interface of radius having its symmetry axis along . The interface separates the inner vacuum from the outer insulating medium of dielectric permittivity . The latter is assumed complex valued and depending on the frequency. Let a charge move in the xOz plane with the velocity , so that its time-dependent position is given by the vector , with . The expression of the dynamical image force is similar to the static one (Eq. 1) but takes now explicitly into account the dielectric response and depends on the velocity ,
| (10) |
The function and are the modified Bessel functions and is a dimensionless function depending on the dielectric permittivity , evaluated at the pulsation ,
Here and are the partial derivatives of the Bessel functions with respect to . Note that the imaginary part of cancels so that is real valued.
We may highlight the special case of a perfectly conducting interface. For the latter, one has , and the functions tend to, . The expression of the image charge force of a perfectly conducting interface becomes then independent of the ion velocity and can be integrated over and summed over to yield Karoly_PRA_2001
| (12) |
Finallay note that in the adiabatic limit, , the functions are evaluated using for the relative permittivity its static limit, , yielding expression (1).
IV Influence of the ion velocity on the theoretical transmitted fraction
IV.1 Image force for keV ions in SiO2 and PET nano-capillaries
We may now check in how far the velocities of keV ions reduce the image charge force for those cases highlighted in section II.2, namely for 7 keV Ne7+ ions through SiO2 nanocapillaries and 3 keV Ne7+ ions through PET nanocapillaries. The dielectric response functions of SiO2 nano-layers and of a thin samples of PET are pictured in Fig. 7. We compute for each case the image force as a function of and for three different velocities, namely m/s, m/s and m/s. The two latter correspond to Ne7+ at 3 keV, as used by Stolterfoht et al. Niko_PRA_2010; Niko_EPJ_2021 and Ne7+ at 7 keV ions, as used by Sahana et al. Sahana_PRA_2006, respectively. The first smaller velocity, is added for comparison. Expression (10) is evaluated numerically using MATHEMATICA MATHEMATICA for the case of a cylindrical interface of radius nm. The sum over was limited to the 100 first angular multipoles. The results are shown in Fig. 9, where the dynamical image force is normalized with respect to the static one, . In the case of a SIO2 interface and 7 keV Ne7+, (red triangles, upper panel, m/s), the dynamical image force is reduced by up to a factor 3 compared to the adiabatic image force when approaching the interface. Indeed, for such a velocity, the response time of the first Lorentz oscillator with an eigenfrequency about 12 THz is too low to contribute efficiently to image force. This results in a significant decrease of the image force when the ion approaches the interface by about 23 nm or, in the present case of a cylindrical interface of nm, for . On contrary, for a 10 times smaller ion velocity (black squares), all the dipole oscillators follow the ion in phase and the dynamical corrections on the image force are negligible.
For a PET interface, the ratio for a moving charge of is about 0.88 and mainly independent on the radial coordinate . This is due to the fact that the dynamical corrections to the image force come from the finite response time of dipole alignment in PET, as indicated by the small decrease of from 2 to 2.6 in the sub 3 THz domain, as shown in Fig 7 and reported by Fedulova. Also, the first resonance frequency of atomic dipoles in PET lies well above 20 THz and also has a smaller strength than the first resonance in SiO2. As a result, the dynamical image force for charges moving with a velocity up to is only slightly affected when approaching the PET interface. We deduce that for keV ions approaching a PET interface, the dynamical corrections are small and the dielectric permittivity of PET is thus well approached by a dielectric constant .
IV.2 New theoretical transmitted fraction
We may now check to what extend the dynamical corrections to the static image force lift the discrepancy found between the experimentally observed and theoretically evaluated transmitted fraction, as described in section II.2. Again we solve equation 3, but this time using the image force as given in Fig. 9. We look for the largest initial value of for with 7 keV Ne7+ ions are transmitted through SiO2 nanocapillaries, as those used by Sahana et al.. We get a theoretical transmitted fraction of 0.3%, only slightly larger than the 0.2% obtained previously using the static image force, but still well below the observed 20% transmission. Similarly, for 3 keV Ne7+ ions through PET nanocapillaries, as those used by Stolterfoht et al. Niko_PRA_2010; Niko_EPJ_2021, dynamical corrections increase only negligibly the theoretical transmitted fraction. With respect to the one obtained with a static image force, increases from 28% to 28%, which is still almost a factor 2 lower than the observed 50% transmission. We can thus affirm that even if the velocity of the keV ion is taken into account in the evaluation of the image force inside a dielectric cylinder, we are not able to explain the experimentally observed transmission fractions of ions through large aspect nano-capillaries, especially for inner diameters of about 100 nm.
V Conclusion
We evaluated the theoretically transmitted ion beam fraction through straight insulating nano-capillaries by calculating the fraction of ion trajectories that were not intercepted by the capillary wall. The only force acting on the ions was the image charge force due to the induced polarization at the inner dielectric interface of a straight cylindrical capillary. For the calculation of the trajectories we used an CPU-friendly expression of the image force. We verified that the latter approaches well the exact image charge force in the adiabatic limit. The transmitted fraction was evaluated in the ideal case of a mono-kinetic divergence free beam injected at zero tilt angle. When comparing the theoretically transmitted fraction to the three experimental data available in the literature, we found large discrepancies in the transmitted fractions, especially for nano-capillaries with an inner diameter below 200 nm.
As the relative permittivity of a dielectric material depends on the frequency of the applied electric field, the surface polarization induced by a charge moving along the interface depends on the its velocity. We evaluated thus the velocity depend image charge force for a plane and cylindrical SiO2 and PET interface. We found that for keV ions having typically a velocity about m/s, the image charge force is controlled by the near infrared domain (THz) of the dielectric response function. For a SiO2 interface, the velocity of the ions affects notably the image force when the ion is close to the interface. For PET interface, the dynamical effects of the image force are negligible in the chosen keV range.
We then checked in how far the theoretically transmitted fractions are modified when using the velocity dependent image charge force instead of the static (adiabatic) one. The calculations were performed for 7 keV and 3 keV Ne7+ ions. We found that the newly calculated transmitted fractions are only slightly larger than those found previously in the case of adiabatic limit and still disagree with the experimental results. We conclude thus that a velocity dependent image charge force is not able to lift the highlighted disagreement. And because the electric field inside the capillary due to an uniformly charged interface can be neglected for large aspect ratio capillaries, there is still no convincing explanation for why the theoretical transmitted fraction was found well below the observed one, especially for capillaries with inner diameters below 200 nm. With this work we hope to motivate new experimental work on the ion transmission through insulating nano-capillaries of different sections. We think that new data will guide authors to model more accurately the image force of keV ions trough capillaries, shedding new light on the phenomenon.
VI Appendix
VI.1 Electric field of the deposited charges vs image force on ion trajectories
We simulated the trajectories of 7 keV Ne7+ ions through an insulating SiO2 nano-capillary embedded in semi-conducting silicon. The inner radius of the capillary tube is 60 nm, the outer radius is 150 nm and the length is 25 m. The forces acting on the ions are the image force expressed by Eq. 2 and the Coulomb force due to accumulated charges at the inner capillary surface. The beam axis is aligned with the capillary axis and the injected beam intensity is 10 ions per second, thus about A. The outer surface is grounded and accounts for the grounded semi-conducting Si layer. The bulk conductivity of SiO2 is field dependent and given by the non-linear Poole-Frenkel relation Frenkel
| (13) |
The field independent bulk conductivity is set to S/m Srivastava and the critical field is set be V/m, which is the typical range where the conductivity SiO2 becomes non-linear Dash_2018. We show in Fig. 10 the computed ion trajectories. The accumulated charge in the capillary wall is shown by the red curves. It has reached its asymptotic distribution, where the deposited charge per unit time is balanced by the leakage current. The electric field inside the capillary wall is at that time about 30 MV/m. The transmitted beam fraction as a function of time is shown in Fig. 1, where it is compared to the case where the electric field due to the deposited charges is removed, so as to put into evidence the effect of the deposited charge on the transmission.
VI.2 Image charge at plane interface
Let us consider a homogeneous dielectric of relative permittivity which fills the region . The region is empty. A projectile of charge is situated at , and moves along the Oz coordinate with the velocity , . The x-component of the electric field at the interface generated by the moving charge at position reads
| (14) |
Because of the discontinuous jump of the relative permittivity at the interface , the electric field induces at the interface surface charge density . The electric filed generated by the surface charges at the dielectric side is but at , so that the total electric field at each side reads
| (15) |
while in the empty region side, , it reads
| (16) |
In the absence of free surface charges, the x-component of the displacement field is continuous across the interface. The relation between is non-local in time and position and is more comfortably used in the frequency and wave-number domain. The latter relation is more convenient when expressed in the Fourier space, where it simplifies to
| (17) |
Let be the Fourier transform in the frequency domain of the electric field ,
where is the modified Bessel function of order 1.
In the following we assume that the dielectric function is local in space so that . This assumption is valid for , where nm is the typical length of the molecules responsible for the polarization. Using (17) one has at both sides of the interface ,
| (19) | |||||
| (20) |
Using the interface condition
one obtains the expression for
| (21) |
The image charge force acting on the projectile is eventually,
| (22) |
Integration over gives
| (23) |
Noting that
| (24) |
one has
| (25) |
References
- (1) N. Stolterfoht, J.-H. Bremer, V. Hoffmann, R. Hellhammer, D. Fink, A. Petrov, and B. Sulik, Phys. Rev. Lett. 88 133201 (2002)
- (2) T. Ikeda, Y. Kanai, T. M. Kojima, Y. Iwai, T. Kambara, and Y Yamazaki, M. Hoshino, T. Nebiki and T. Narusawa, Appl. Phys. Lett. 89 (2006) 163502
- (3) K. Schiessl, W. Palfinger, K. Tőkési, H. Nowotny, C. Lemell, and J. Burgdörfer, Simulation of guiding of multiply charged projectiles through insulating capillaries, Phys. Rev. A. 72 (2005) 062902
- (4) M. B. Sahana, P. Skog, Gy. Vikor, R. T. Rajendra Kumar, and R. Schuch, Guiding of highly charged ions by highly ordered SiO2 nanocapillaries, Phys. Rev. A 73 040901R (2006)
- (5) C. Lemell. J. Burgdor̈fer and F. Aumayr, Interaction of charged particles with insulating capillary targets - The guiding effect, Progress in Surface Science Vol. 88, Issue 3, 237-278 (2013)
- (6) N. Stolterfoht and Y. Yamazaki, Guiding of charged particlukes through capillaries in insulating materials, Physics Report 629 1-107 (2016)
- (7) N. Stolterfoht, Simulation and analysis of ion guiding through a nanocapillary in insulating polymers, Phys. Rev. A 87 012902 (2013)
- (8) Nikolaus Stolterfoht, Simulations of Ion-Guiding Through Insulating Nanocapillaries of Varying Diameter: Interpretation of Experimental Results, Atoms 2020, 8, 48
- (9) E. Giglio, Charge relaxation rates in insulating straight capillaries, Phys. Rev. A 101, 052707(2020)
- (10) E. Giglio, S. Guillous, A. Cassimi, Phys. Rev. A 98, 052704 (2018)
- (11) E. Giglio and T. Le Cornu, Effect of secondary electrons on the patch formation in insulating capillaries by ion beams, Phys. Rev. A 103, 032825 (2021)
- (12) K. Schiessl, W. Palfinger, K. Tőkési, H. Nowotny, C. Lemell, and J. Burgdörfer, NIMB, Vol. 258, Issue 1, (2007), p 150-154 https://doi.org/10.1016/j.nimb.2006.12.135
- (13) H.Q. Zhang, N. Akram, R. Schuch, NIMB Nuc. Inst. Meth. B 2017
- (14) H.Q. Zhang, N. Akram, P. Skog, I.L. Soroka, C. Trautmann, and R. Schuch, Phys. Rev. Lett. 108 193202 (2012) 10.1103/PhysRevLett.108.193202
- (15) N. Stolterfoht, R. Hellhammer, Z. Juhász, B. Sulik, E. Bodewits, H. M. Dang, and R. Hoekstra, Guided transmission of 3-keV Ne7+ ions through nanocapillaries in insulating polymers: Dependence on the capillary diameter, Phys. Rev. A 82, 052902 (2010)
- (16) N. Stolterfoht, Z. Juhász, P. Herczku, S. T. S. Kovécs, R. Rácz, S. Biri, C. Cserháti, and B. Sulik, Transmission of 3-keV Ne7+ ion through nanocapillaries probing the discharge process, Eur. Phys. J. D (2021) 75:136
- (17) P. Dash, M. Yuan, J. Gao, E. Furman, and M. T. Lanagan, High electric field conduction in low-alkali boroaluminosilicate glass, Journal of Applied Physics 123, 054102 (2018)
- (18) K. Tőkési, L. Wirtz, C. Lemell, and J. Burgdörfer, Phys. Rev. A, 64, 042902 (2001) 10.1103/PhysRevA.64.042902
- (19) K. Tőkési, L. Wirtz, C. Lemell, and J. Burgdörfer, Nucl. Instr. and Meth. Phys. Res. B 154 (1999) page 307 10.1016/S0168-583X(99)00052-X
- (20) S. T. Cui, Electrostatic potential in cylindrical dielectric media using the image charge method, Molecular Physics, 104:19, 2993-3001 (2006), 10.1080/00268970600926647
- (21) Jin YS, Kim GJ, Jeon SG., Terahertz Dielectric Properties of Polymers. Journal of the Korean Physical Society, Vol. 49, No. 2, August 2006, pp. 513 - 517
- (22) Rei Kitamura, Laurent Pilon, and Miroslaw Jonaszn, Optical constants of silica glass from extreme ultraviolet to far infrared at near room temperature, Applied Optics Vol. 46, Issue 33, pp. 8118-8133 (2007)
- (23) Guan-Yu Liu, Wei-Feng Sun, Qing-Quan Lei. Charge Injection and Dielectric Characteristics of Polyethylene Terephthalate Based on Semiconductor Electrodes, Materials 14(6), 1344 (2021)
- (24) J. Petzelt and I. Rychetský, Dielectric function, Encyclopedia of Condensed Matter Physics, page 426 (2005)
- (25) J Harris and R O Jones, Image force for a moving charge, J. Phys. C: Solid State Phys. 7 3751 (1974)
- (26) G. Cataldo, E.J. Wollack, A.D. Brown and K. H. Miller, Infrared dielectric properties of low-stress silicon oxid, Optics Letters Vol. 41, Issue 7, pp. 1364-1367 (2016)
- (27) E. V. Fedulova, M. M. Nazarov, A. A. Angeluts, M. S. Kitai, V. I. Sokolov, and A. P. Shkurinov, ”Studying of dielectric properties of polymers in the terahertz frequency range”, Proc. SPIE 8337, Saratov Fall Meeting 2011: Optical Technologies in Biophysics and Medicine XIII, 83370I (28 February 2012)
- (28) Jin, Yun-Sik, Kim, Geun-Ju and Jeon, Seok-Gy (2006). Terahertz dielectric properties of polymers. Journal of the Korean Physical Society, 49(2), 513-517
- (29) Xiaoning Zhang, Jun Qiu, Junming Zhao, Xingcan Li, Linhua Liu, Complex refractive indices measurements of polymers in infrared bands, Journal of Quantitative Spectroscopy and Radiative Transfer, Vol 252, 107063 (2020)
- (30) J. D. Jackson, Classical electrodynamics 3rd edition, John Wiley and sons, (1999)
- (31) Wolfram Research, Inc., Mathematica, Version 7.0, Champaign, IL (2008)
- (32) Frenkel, J. ”On Pre-Breakdown Phenomena in Insulators and Electronic Semi-Conductors”. Physical Review. American Physical Society (APS). 54 (8): 647-648 (1938)
- (33) J. K. Srivastava, M. Prasad and J. B. Wagner Jr Electrical Conductivity of Silicon Dioxide Thermally Grown on Silicon Journal of The Electrochemical Society, Volume 132, 132 955 (1985)