Predicting Flaky Tests Categories using Few-Shot Learning
Abstract
Flaky tests are tests that yield different outcomes when run on the same version of a program. This non-deterministic behaviour plagues continuous integration with false signals, wasting developers’ time and reducing their trust in test suites. Studies highlighted the importance of keeping tests flakiness-free. Recently, the research community has been pushing forward the detection of flaky tests by suggesting many static and dynamic approaches. While promising, those approaches mainly focus on classifying tests as flaky or not and, even when high performances are reported, it remains challenging to understand the cause of flakiness. This part is crucial for researchers and developers that aim to fix it. To help with the comprehension of a given flaky test, we propose FlakyCat, the first approach for classifying flaky tests based on their root cause category. FlakyCat relies on CodeBERT for code representation and leverages a Siamese network-based Few-Shot learning method to train a multi-class classifier with few data. We train and evaluate FlakyCat on a set of 343 flaky tests collected from open-source Java projects. Our evaluation shows that FlakyCat categorises flaky tests accurately, with a weighted F1 score of 70%. Furthermore, we investigate the performance of our approach for each category, revealing that Async waits, Unordered collections and Time-related flaky tests are accurately classified, while Concurrency-related flaky tests are more challenging to predict. Finally, to facilitate the comprehension of FlakyCat’s predictions, we present a new technique for CodeBERT-based model interpretability that highlights code statements influencing the categorization.
Index Terms:
Software Testing, Flaky Tests, CodeBERT, Few-Shot learning, Siamese Networks.I Introduction
Continuous Integration (CI) plays a key role in nowadays’ software development life cycle [1, 2]. CI ensures the quick application of changes to a main code base by automatically running a variety of tasks. Those changes can be responsible for building the program and its dependencies, performing checks (e.g., static analysis), and running test suites to maintain code integrity and correctness. An important assumption for practitioners is that tasks are deterministic, i.e., regardless of the context of the execution of a same task, results need to be persistent.
Unfortunately, in practice, this is not always the case. Previous research has identified test flakiness as one of the main issues in the application of automated software testing [3, 4]. A flaky test is a test that passes and fails when executed on the same version of a program. Flakiness hinders CI cycles and prevents automatic builds due to false signals, resulting in undesirable delays. Furthermore, surveys [5, 6, 7] show that flakiness affects developers’ productivity as they spend a considerable time and effort investigating the nature and causes of flaky tests.
To alleviate this issue, researchers have proposed tools that help detect flaky tests. In particular, IDFlakies [8] and Shaker [9] detect flakiness in test suites by running tests in different setups. However, rerunning tests, especially for a large number of times, is resource-intensive and might not be a scalable solution. For this reason, researchers recently suggested alternative approaches to detect flaky tests based on features that do not require any test execution [10, 11, 12]. Although promising, these approaches mainly focus on classifying tests as flaky or not without any additional explanation. Unfortunately, the absence of any additional information about the cause of flakiness is insufficient to comprehend and investigate the cause of the (flaky) failures. This means that additional investigation is required to understand the nature of flakiness and identify the culprit code elements that need to be fixed [6].
Another important line of research in the area regards automated approaches that aim at helping to locate the root causes and suggest potential flakiness fixes [13, 14, 15]. However, research on automatically fixing flakiness is still at an early stage: tools often focus on one category of flakiness and with few examples. For instance, iFixFlakies [16] and ODRepair [17] focus only on dealing with test order dependencies, which is one of the main causes of test flakiness. Flex [18] automatically fixes flakiness due to algorithmic randomness in machine learning algorithms.
We believe that both developers and researchers could benefit from additional information that could assist them in gaining a better understanding of flaky tests, once they have been detected. Therefore, we propose FlakyCat, a learning-based flakiness categorization approach that identifies the key reason/category of the test failures. FlakyCat relies on CodeBERT [19] to build appropriate code representations and allow static test flakiness predictions, i.e., predictions based solely on test code.
Another limitation of previous work, relying on supervised learning, regards the need for large volumes of available data. Unfortunately, debugged flaky test data is scarce, inhibiting the application of learning-based methods. To deal with this issue we leverage the Few-Shot learning capabilities of Siamese networks, which we combine with the CodeBERT representations to learn flakiness categories from a limited set of data (flaky tests).
To evaluate FlakyCat, we collect a set of 343 flaky tests from open-source Java projects and categorize them based on flakiness fixing commit messages, that are applied on both tests and projects’ source code. We then use this annotated flaky test set to train and evaluate FlakyCat and compare it with some relevant baselines.
In particular, our empirical evaluation aims at answering the following three research questions:
- •
RQ1: How effective is FlakyCat compared to approaches based on traditional supervised learning?
Findings: Our results show that FlakyCat is capable of predicting flakiness categories with an F1 score of 70%, outperforming classifiers based on traditional supervised machine learning that was used in previous work. - •
RQ2: How effective is FlakyCat in predicting each one of the considered flakiness categories?
Findings: FlakyCat classifies accurately flaky tests related to Async waits, Unordered collection, and Time, with an average F1 score of 70%. However, the approach shows difficulty in classifying Concurrency-related flaky tests, since these cases are related to the interaction of threads and processes and are easily confused with Async waits. - •
RQ3: How do statements of the test code influence the predictions of FlakyCat?
Findings: We found that statements that lead the model to predict the categories of Time and Unordered collections tend to enclose information related to the corresponding flakiness cause. On another hand, it is more challenging to identify a correlation between the statements influencing the categorisation of the Async waits and Concurrency categories.
In summary, our contributions can be summarised as follows:
- •
Dataset We collected 343 flaky tests alongside their category of test flakiness.
- •
Model We present FlakyCat, a new approach based on Few-Shot Learning and CodeBERT to classify flaky tests with regard to their flakiness category.
- •
Interpretability We introduce a technique to explain what information is learnt by models using CodeBERT as code representation.
To enable reproducibility and replicability of our work, we make the dataset used to evaluate FlakyCat and the scripts publicly available in our replication package 11 1 https://anonymous.4open.science/r/FlakyCat-5033/.
The paper is organized as followed: Related works are presented in section II. Section III presents how we designed and implemented FlakyCat. Section IV introduces our interpretability technique. Section V describes how we collected our dataset and evaluated our study. Section VI presents the results of our study. We further discuss different use cases in Section VII. Finally, section VIII gives details about the threats to the validity of this study.
II Related Work
Recently, practitioners from the industry reported struggling with flakiness and highlighted the need to find solutions to the problem[3, 20, 21, 22, 23]. Consequently, researchers from academia started to draw their attention to the matter. Luo et al. presented the first empirical study to understand and categorize the root causes of flakiness, they analyzed 201 flaky tests and identified 10 root causes of flakiness, the top ones being Asynchronous waits, concurrency, and test order dependency. Using the same taxonomy defined by Luo [24], Eck et al. [25] classified 200 flaky tests and identified four new causes of flakiness. Over the years, several surveys were carried on to identify the sources, impacts and existing strategies to mitigate flakiness by interrogating developers and practitioners [5, 6, 7, 26]. Parry et al. presented the state of the art of academic research in another survey[27]. Researchers presented different tools and approaches to detect flaky tests in a more efficient way. Notably, DeFlaker[28], IDFlakies[8], Shaker[9] and NonDex[29] attempt to facilitate the detection of flaky tests compared to exhaustive reruns. Because the cost of running tests is viewed as expensive, researchers also sought to suggest static alternatives for the detection. Different approaches relying on machine learning were introduced. Pinto et al. [30] and following replication studies[31, 32] presented a vocabulary-based model using elements from the test code to classify tests as flaky or not. Others investigated the use of test smells [12] and code metrics [33] for predicting flaky tests. Trying to outperform the performances of existing approaches, others relied on a mix of static and dynamic features, like FlakeFlagger[34] or Flake16[35]. Fixing flakiness is also an aspect that has recently been investigated. Shi et al. introduced iFixFlakies[16] to fix order-dependent flaky tests. At Google, Ziftci et al. suggested using coverage differences, between passing and failing executions of flaky tests to guide developers to understand the underlying problem. Coverage information is also used by FlakyLoc [15], which leverages spectrum-based fault localization to locate the root cause of flakiness in web apps. Logs are also frequently considered to be a useful source of information in understanding root causes of flakiness [14]. Closer to our work, Flakify[36] used CodeBERT[19] as a pre-trained language-based model for their predictor. As their goal is to classify tests as flaky or not, we are the first to focus on predicting the category of flakiness for each test. Few-Shot Learning is widely used in computer vision[37]. In software engineering though, fewer studies used this approach for their task. Notably, studies suggested using this model for vulnerability detection [38] and code clone detection [39], but none were carried out for flakiness. About those pre-trained language models, Wan et al. [40] investigated their ability to capture the syntax structure of source code, and report that they are efficient for code processing tasks.
III FlakyCat

In this section, we present the design and implementation of FlakyCat. Figure 1 presents an overview of the main steps of FlakyCat, code transformation and classification.
III-A Step 1: Test transformation
III-A1 Scope
We rely on the test code to assign flaky tests to different categories. Previous studies showed that flakiness finds its root causes in the test in more than 70% of the cases[24, 41]. Hence, focusing on the test code allows us to capture the nature of flakiness while minimizing the overall cost of FlakyCat. Indeed, considering the code under test would require running the tests and collecting the coverage, which entails additional requirements and costs.
III-A2 Test vectorization
In order to perform a source code classification task, we first need to transform the code into a suitable representation that will be fed to the classification model. Previous flakiness studies relied on predefined features [34, 10], test smells [12, 34], and code vocabulary [11, 31, 32] to transform code into vectors. Test smells convey limited information, i.e., smell presence, and may not be sufficient to capture the nature of flakiness. In the same vein, vocabulary-based approaches do not grasp the semantics of the code [42] and tend to overfit to the vocabulary present in specific projects [12, 31].
Recently, code embeddings from pre-trained language models were also considered for source code representation [36, 43]. Pre-trained language models allow the encoding of code semantics and are intended for general-purpose tasks such as code completion, code search, and code summarization. Considering these benefits, we use the pre-trained language model CodeBERT [44] to generate source code embeddings. CodeBERT can learn the syntax and semantics of the code and doesn’t require any predefined features [40]. It supports both programming language and natural language. It has been developed with a multi-layer transformer architecture [45], and trained on over six million pieces of code involving six programming languages (Java, Python, JavaScript, PHP, Ruby, and Go). In the following, we explain how we used CodeBERT to vectorize the test code.
Inputs
CodeBERT is able to process both source code and natural language, e.g., comments and documentation. In our case, we did not exploit the possibility of using comments, because the input length is limited. The input passed to CodeBERT is the concatenation of two segments with a special separator token, namely:
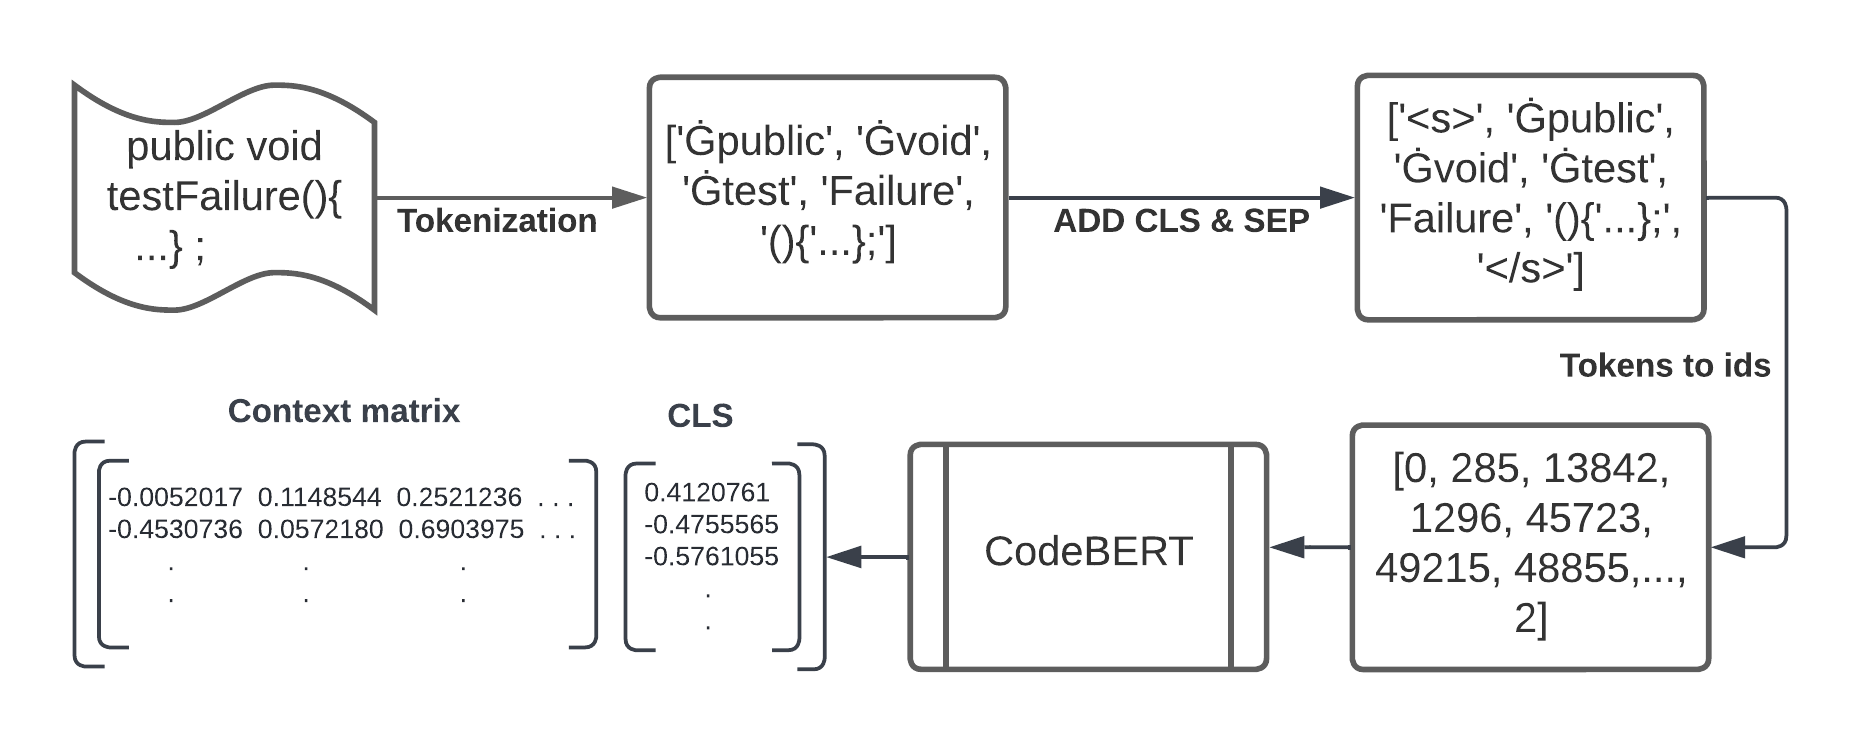
Where Wi is a sequence of natural language text, and Ci is a sequence of code elements. [CLS] is a special token placed in front of the two segments, whose final hidden representation is considered as the representation of the whole sequence, used for the classification. To make the source code of a test case match these expected inputs, we start by filtering it from extra spaces such as line breaks and tabs. Then, we tokenize the sequence and add the special tokens: CLS at the beginning and SEP at the end. We convert the sequence of tokens into IDs as each token is assigned an ID that corresponds to its index in the vocabulary file of CodeBERT. This sequence is passed to the CodeBERT model, which returns a vector representation.
Figure 2 illustrates this process.
Outputs
CodeBERT output includes two representations, the first contains a contextual vector representation of each token in the sequence, and the second is the CLS representation having a size of 768, which is used to represent the whole sequence. In the case of FlakyCat, we are interested in the CLS representation of the test code, which is used as a vector representation of the test cases.
III-B Step 2: Test categorization
Unlike traditional machine learning classifiers that attempt to learn how to match an input to a probability by training the model in a large training dataset and then generalizing to unseen examples, Few-Shot learning (FSL) classifiers learn what makes the elements similar or belonging to the same class from only a few data. Facing the scarcity of data about flaky tests in general, selecting a Few-Shot classifier seems then to be a promising choice. A flaky test can be part of the category Async wait just because it uses only one statement of explicit wait, FSL can focus on this statement and learn that it’s more important than the others for the classification of this category.
In FSL, we call the item we want to classify a query, and the support set is a small set of data containing few examples for each class used to help the model to make classifications based on similarity. To classify flaky tests according to their flakiness category, we compute the similarity between the query and all examples of each flakiness category in our Support Set and assign the label having the maximum similarity with the query. This classification is obviously performed in a space where all elements of the same class are similar or close to each other. This is achieved by a model called Siamese network. Its task is to transform the data and project it into a space where all the elements of a same class are close to each other, and then we can simply classify the elements by computing their similarity.
III-B1 Vector transformation with Siamese networks

The Siamese network has knowledge of the similarity of elements of the same class. It processes two vectors in input and applies transformations that allow minimizing the distance between the two vectors if they share similar characteristics. Figure 3 shows an example of the visualization of flaky test vectors before and after the Siamese network is applied. Since CodeBERT has no knowledge of the characteristics of flaky tests and only generates a general representation of the source code, the vectors produced are all similar. However, the Siamese network learns which characteristics in these vectors are shared by tests of the same class, and thus allows to project vectors into a space that groups tests of the same flakiness category. After this step, it becomes possible to classify them with a simple similarity computation.
Siamese networks training

Siamese networks have two identical sub-networks, each sub-network processes the input vector and performs transformations. Both sub-networks are trained by calculating the similarity between the two inputs and using the similarity difference as a loss function. Accordingly, the weights are adjusted to have a high similarity if the inputs belong to the same class. For the architecture of the sub-networks, we used a dense layer of 512 neurons and a normalization layer as shown in Figure 4. We also performed a linear transformation to keep relations learnt by CodeBERT using attention mechanism introduced in the transformer architecture [46]. This model is trained using a Triplet Loss function, based on the calculation of similarity difference.
Let the Anchor be the reference input (it can be any input), the positive example is an input that has the same class as the Anchor, the negative example is an input that has a different class than the Anchor, is the cosine similarity function, and is a fixed margin. The idea behind the Triplet Loss function is that we maximize the similarity between and , and minimize the similarity between and , so ideally is large and is small. The formula for this loss function is:
is an additional margin as we do not want to be very close to , which would lead to a zero loss.
To train the Siamese network with the triplet loss, we give as input batches of pairs with the same classes, and any other pair of a different class can be used as a negative example. We select the closest negative example to the anchor, such as , which generates the largest loss and constitutes a challenge for the model learning.
IV Interpretability technique
Model interpretability refers to one’s ability to interpret the decisions, recommendations, or in our case the predictions, of a model. Interpretability is a crucial step to increase trust in using a machine learning model. Indeed, it allows model creators to investigate potential biases in the learning processes and better assess the overall performance of their models. On top of that, providing users, who are the developers in this case, with information about how the model came to its prediction can enhance the model adoption [47].
Flakiness prediction approaches often rely on Information Gain to explain what features in the model yield the most information [30, 34, 12]. In the case of tree models, the reported information gain is given by the Gini importance (also known as Mean Decrease in Impurity) [48]. Parry et al. [35] used SHapley Additive explanations (SHAP), which is another popular technique for model interpretability [49].
As FlakyCat uses the CodeBERT representation of tests as input, using the previously mentioned techniques would not give understandable features. Thus, we decide to introduce a new technique to interpret CodeBERT-based models. We aim at understanding what information is learned by FlakyCat.
Our technique is inspired by delta debugging algorithms. Delta debugging can help to isolate failing unit tests [50]. In our case, we are interested in code statements linked with the most influential information for the model’s decision. To achieve this, we classify test cases and select only the ones that were correctly predicted (TP) as they contain information that was useful in the model’s decision. We create new versions of each test. Each version is a copy of the original test minus one statement that was removed. Next, we feed the new versions to FlakyCat. Among all new versions for one test, we keep the one for which the similarity score with the correct category endured the biggest drop. We consider the statement removed in this version as the most influential one. When flakiness categorisation results are presented to developers, the most influential statement can be highlighted to explain the rationale behind the assigned category. We can also envision scenarios where multiple influential statements are highlighted gradually based on their contribution to the classification result.
V Evaluation
In this section, we explain our evaluation setting for FlakyCat. First, we describe our data curation process, then, we present our approach for answering each of the three research questions.
V-A Data curation
V-A1 Collection
For our study, we had to collect a set of flaky tests containing their source code and their flakiness category. We focused our collection efforts on one programming language, as training a classifier using code and tokens from different programming languages is more challenging. For the language choice, we opted for Java, which is the most common language in existing flakiness datasets. Nevertheless, as existing sets do not contain enough data about flakiness categories, we also built a new set of flaky tests from GitHub that we classify manually.
Existing datasets
There is no large public dataset of flaky tests labelled according to their category of flakiness. Most of the existing data are split into flaky and non-flaky tests and are used for binary classification such as FlakeFlagger [34] and DeFlaker [51]. There is also the Illinois’ dataset22 2 https://mir.cs.illinois.edu/flakytests/, which is partially classified into order-dependent and implementation-dependent flaky tests. Regarding the data classified by flakiness categories defined by Luo et al. [24] and Eck et al. [25], there is only limited data available used for analysis in previous empirical studies about flakiness. Luo et al. [24] analyzed 200 commits and classified 135 commits into 10 flakiness categories. Using the same taxonomy, Eck et al. [25] classified 200 tests into 10 categories, including four new categories of flakiness. We retrieved 135 classified tests from the dataset of Luo et al., however, we were not able to access the set of Eck et al.. We also identified a new dataset of classified flaky tests33 3 https://github.com/Test-Flaky/TSE22, from which we recovered 114 tests.
New dataset
To expand our dataset, we explore GitHub projects and search for flakiness-fixing commits that mention a flakiness category in their messages. In this search, we use flakiness-related keywords such as Flaky and Intermit in the commit messages. To ensure that the commit refers to a flakiness category, we further filter commits by specific keywords related to each category: thread, concurrence, deadlock, race condition for Concurrency, time, hour, seconds, date format, local date for Time, port, server, network, http, socket for Network and rand for Random. After the search, we rely on the developers’ explanation in the commit message and on the provided fix to classify tests into the different flakiness categories listed in the literature. This collection allowed us to obtain 214 categorized tests. To ensure the correctness of our manual classification, the first two authors of the paper performed a double-check on the whole dataset to identify.
V-A2 Filtering
The previous step allowed us to collect 214 categorized flaky tests. In this step, we filter out tests that are not adequate for our study. In particular, some data points in the existing datasets were missing attributes necessary for data extraction, such as the name of the test method or the download link. As we were unable to obtain the missing fields, we filtered out these points.
The filtering reduced the number of test cases from 135 to 79 for the dataset of Luo et al., and from 114 to 50 in the new identified dataset. For the data we collected ourselves, we accounted for the filters from the beginning, so we retain the number of 214 successfully collected and extracted test cases, leaving us with a set of 343 categorized flaky tests.
V-A3 Processing
After filling all the necessary attributes: the test case name, flakiness category, test file name, and project URL, we download the code files and extract test methods using the spoon library44 4 https://github.com/INRIA/spoon. At this stage, all comments have been deleted from the source code to restrict CodeBERT to code statements.
V-A4 Data selection
The final dataset contains 343 flaky tests distributed over 10 flakiness categories. Table I illustrates this repartition.
The collected flaky tests are not distributed evenly across categories of flakiness. Just as shown in past empirical studies [24, 52], some categories, such as Async waits, are more prevalent than others. Our approach uses Few-Shot learning to learn from limited datasets. Still, it requires a certain amount of examples to learn common patterns from each category. We decided to have at least 30 tests in a category to consider it. This number is commonly accepted by statisticians as a threshold to have representativeness [53]. Also, we decided to discard the category of Test order dependency as it is a particular case where the flakiness is specific to the order of the test suite. This leaves us with four categories, highlighted in grey in the table: Async waits, Unordered collections, Concurrency, and Time.
V-A5 Data augmentation
Facing the challenge of learning from few data, we over-sampled our dataset in a similar way to SMOTE [54]. We duplicated tests by mutating only the code elements that have no influence on flakiness. This includes variable names and constants such as strings, numbers and booleans. We used the Spoon library for the detection of these elements, and we replaced them with randomly generated significant words. As a result, the total number of tests after data augmentation is 639.
| Class | Data | |
|---|---|---|
| Original | Augmented | |
| Async waits | 89 | 285 |
| Unordered collections | 45 | 136 |
| Concurrency | 36 | 113 |
| Time | 35 | 105 |
| Test order dependency | 33 | 99 |
| Network | 16 | 51 |
| Randomness | 13 | 40 |
| Test case timeout | 9 | 29 |
| Resource leak | 5 | 17 |
| Platform dependency | 2 | 7 |
| Too restrictive range | 2 | 7 |
| I/O | 2 | 6 |
V-B Experimental design
V-B1 Baseline
The automatic classification of flaky tests according to their category is a task that has not already been performed automatically. Previous studies analyzing the categories of flakiness relied on a manual classification of tests. Hence, as a baseline, we compare FlakyCat with existing approaches used to classify tests as flaky or not, including the vocabulary-based approach [11], and the smell-based approach [12]. Our motivation is to determine whether it is possible to make this classification based on limited data, and which classifier and code representation are the most suitable for flakiness classification.
More specifically, we compare our FSL-based approach with traditional classifiers from the Scikit-learn library [55] used by previous studies on flakiness prediction [11, 12, 32]: Random Forest (RF), Support Vector Machine (SVM), Decision Tree (DT), K-Nearest Neighbour (KNN). We also compare the code representation used in our classification approach with the different source code representations used in the context of flaky tests, in particular test smells and vocabulary.
For the classification based on test smells, we use the 21 smells detected by tsDetect [56], to generate vectors indicating the presence of each smell detected by the tool, in the same way as in the study of Camara et al. [12]. As for the vocabulary-based classification, we use token occurrence vectors, as in the article by Pinto et al. [11]. We tokenize the code and apply standard pre-processing like stemming, then calculate occurrences of each token.
We use a 4-fold stratified cross-validation to assess the predictive performances of our model. FlakyCat relies on a Siamese network. It is trained with combinations of data by indicating whether these data are similar or not so that the model can learn what makes them similar. Since we train with combined data, the balancing of data is not required, because it is automatically over-sampled.
As the augmented samples in our dataset are very similar to the original ones, it was important to keep them in the same sets for training, so that no augmented samples are leaked in the test set. For the support set used for classification, we select the most centred examples to represent each class.
V-B2 Parameters
For FlakyCat, we select the parameters by testing combinations of the most important parameters that have a direct impact on the model performance, which include the similarity margin used in the triplet loss function and the number of data pairs used to train the Siamese model. As shown in Figure 5, we choose a margin of 0.3 and we fix the number of data pairs at 10,000. We select the standard value for the learning rate. The change of this value had no impact on the results. For baseline classifiers, we keep the standard values used by previous works. We varied the number of trees in the Random Forest classifier, we tested values from 100 to 1000 with a step of 100. We observed that this does not make much difference regarding the F1 score (¡1%), and we identified 200 as the number giving the best results.
V-B3 Evaluation metrics
We use the standard evaluation metrics to compare between classifiers, including precision, recall, Matthews correlation coefficient (MCC), F1-score, and Area under the ROC curve (AUC). These metrics have been used to evaluate the performance of classifiers, including binary classification of flaky tests [11, 12, 36].

V-C RQ1: How effective is FlakyCat compared to approaches based on traditional supervised learning?
This question aims to evaluate FlakyCat and compare it to relevant baselines. In the following, we explain the choice of these baselines and our selection of parameters and evaluation metrics.
V-D RQ2: How effective is FlakyCat in predicting each one of the considered flakiness categories?
This question aims to evaluate FlakyCat’s ability to classify the different categories of flakiness. To perform this, we split the dataset into four sets following the categories: Async waits, Unordered collections, Concurrency, and Time. Then, we use the same settings as for RQ1 to tune the Siamese network, train it, and evaluate it for each category.
V-E RQ3: How do statements of the test code influence the predictions of FlakyCat?
We applied the technique we proposed in section IV for CodeBERT-based model interpretability to FlakyCat. We collected the most influential statement for each flaky test correctly classified. We then proceed to investigate those statements. First, we regroup statements by category of flakiness (according to the test they belong to). Then, we want to give details on what type of statements FlakyCat found useful. To do so, we look through the list of statements and attempt to identify recurring code statements and categorise them. The process of identifying statement types is subjective and inspired by qualitative research. The idea is to find statement types of interest for our specific case of flakiness classification. We identified 8 types of statements that are related to some aspects of flakiness in each category:
- •
Control flow: Groups statements of loops and conditions.
- •
Asserts: All types of assertions in tests.
- •
Threads: All thread control statements.
- •
Constants: Constant values of numbers, strings, and booleans.
- •
Waits: All explicit wait statement.
- •
Time-related: Statements that perform operations on time values, dates.
- •
External/API calls: Groups network / API calls, and manipulation of external resources such as files and databases.
- •
New instances: Statements creating new instances or objects.
In this question, we investigate the prevalence of these statement types in each flakiness category.
VI Results
VI-A RQ1: How effective is FlakyCat compared to approaches based on traditional supervised learning?
Following the outlined experimental design, we trained and tested FlakyCat and the four traditional classifiers, using the three source code representations, the vectors obtained from CodeBERT, the vectors based on vocabulary, and the ones on tests smells. The obtained results are presented in Table II. The results show that FlakyCat achieves the best performance for all evaluation metrics. It obtained an average weighted F1 score of 70% and a precision of 71%. We get an MCC of 0.58 (bounds for this metric are between -1 and 1), being close to 1 means a perfect classification. We have an AUC of 0.78, which shows that the model is highly distinguishing between classes.
Representation effect
Regarding the three code representations, CodeBERT achieves the best performance among all classifiers, with an F1 score between 0.45 and 0.7 for the five classifiers. By using the vocabulary vectors, all classifiers do not exceed an F1 score of 0.6. The representation based on test smells yields the worst result, with the best F1 score being 0.26. This means that CodeBERT is able to learn more information about the code and the flaky test behaviours.
Classifier effect
Regarding the choice of classifier, we find that the Few-Shot classifier based on similarity achieves the best performance using the representations based on CodeBERT and vocabulary. Among traditional classifiers, Random Forest obtains the best results, as reported in previous flaky test classification studies [30, 31]. While for the smells-based representation, none of the classifiers showed promising results. Using this code representation, the SVM classifier turned out to achieve the best F1 score: 0.26. We conclude that the information present in the test smells was not helpful to learn how to predict flaky tests category.
| Model | Smells-based | Vocabulary-based | CodeBERT-based | ||||||||||||
| Precision | Recall | MCC | F1 | AUC | Precision | Recall | MCC | F1 | AUC | Precision | Recall | MCC | F1 | AUC | |
| SVM | 0.19 | 0.44 | 0.00 | 0.26 | 0.50 | 0.48 | 0.47 | 0.18 | 0.35 | 0.54 | 0.19 | 0.43 | 0.00 | 0.26 | 0.50 |
| KNN | 0.10 | 0.2 | 0.0 1 | 0.10 | 0.51 | 0.44 | 0.43 | 0.12 | 0.37 | 0.55 | 0.50 | 0.50 | 0.23 | 0.45 | 0.59 |
| DT | 0.17 | 0.36 | -0.07 | 0.22 | 0.46 | 0.43 | 0.47 | 0.24 | 0.45 | 0.62 | 0.51 | 0.49 | 0.28 | 0.49 | 0.64 |
| RF | 0.15 | 0.31 | -0.08 | 0.20 | 0.45 | 0.62 | 0.6 | 0.42 | 0.53 | 0.66 | 0.63 | 0.63 | 0.46 | 0.59 | 0.70 |
| FSL | 0.11 | 0.31 | -0.01 | 0.16 | 0.50 | 0.63 | 0.63 | 0.46 | 0.60 | 0.71 | 0.71 | 0.70 | 0.58 | 0.70 | 0.78 |
VI-B RQ2: How effective is FlakyCat in predicting each one of the considered flakiness categories?
Table III shows performances achieved by FlakyCat for each of the four flakiness categories that we have selected. Figure 6 shows that the category Unordered collections is the easiest for the model to classify, with a precision of 0.84 and an F1 score of 0.85 (average across folds). The category Async waits and Time respectively have a precision of 0.73 and 0.65. Concurrency performances are lower with a precision of 0.48.
We suspect that concurrency issues happen in many cases in the code under test. As FlakyCat only relies on the test source code, this would indeed explain why performances are lower in this case. Another supposition is that concurrency issues and asynchronous waits are sometimes closely related. For example, a thread incorrectly waiting for another one to finish might be considered both a concurrency issue and an asynchronous wait.

| Category | Precision | Recall | Weighted F1-score |
|---|---|---|---|
| Async waits | 0.73 | 0.75 | 0.74 |
| Concurrency | 0.48 | 0.48 | 0.46 |
| Time | 0.65 | 0.68 | 0.66 |
| Unordered collections | 0.84 | 0.80 | 0.85 |
VI-C RQ3: How do statements of the test code influence the predictions of FlakyCat?
Table IV reports the prevalence (%) of the different types of statements among all influential statements per flakiness category, e.g., 100% Asserts in the time category would mean that all influential statements for the time category contain assert statements.
The results in Table IV show that the Control flow, Constants, and New instances statements are almost evenly distributed. We conclude that those statement types are not correlated to the specificity of flakiness categories under study. Compared to other flakiness categories, the percentage of assertions in the influential statements of Time and Unordered collections is high, 55% and 50% respectively. Based on our analysis, this includes in particular assertions that perform exact comparisons, such as assertEquals(), between constant values and collection items, or dates for example. 43% of influential statements in the Concurrency category include some thread manipulation, and 17% for the Async Waits category, while the rest of the categories have none. Statements containing explicit waits represent respectively 17% and 25% for Async Waits and Concurrency categories, but zero for the others. Statements containing time values are most common in the Time category with 85%. We note that they appear as well in a small proportion, 12.8% and 12.5% respectively, for Async Waits and Concurrency. Statements from the external/API calls group are mainly found in the Async waits and Concurrency categories, this includes network calls and manipulation of external resources.
The results show that FlakyCat is able to differentiate between the features that are important to each flakiness category by considering the correlation between the types of statements and flakiness categories. This also suggests that CodeBERT is able to grasp some semantics from the test code.
| NB statements | Control flow | Asserts | Threads | Constants | Waits | Time Related | External/API calls | New instance | |
|---|---|---|---|---|---|---|---|---|---|
| Async Waits | 47 | 2.1% | 17.0 % | 17.0 % | 66.0 % | 17.0 % | 12.8% | 23.4% | 8.5% |
| Concurrency | 16 | 0,0% | 6,3% | 43,8% | 56,3% | 25,0% | 12,5% | 31,3% | 12,5% |
| Time | 20 | 10,0% | 55,0% | 0% | 60,0% | 0% | 85,0% | 5,0% | 15,0% |
| Unordered collections | 36 | 8,3% | 50,0% | 0% | 66,7% | 0% | 0% | 8,3% | 13,9% |
VII Discussion
VII-A The effect of adding additional categories
Our results showed that flakiness categories can be classified automatically. We carried out our main experiments with four categories of flakiness for which we had a reasonable number of tests. Still, we believe that one interesting aspect of our study is understanding the impact of adding other categories to FlakyCat. For this, we investigate the performance of FlakyCat in each category (similarly to RQ2), but we consider two more categories, Network and Random. These are the next two categories with the most samples in our dataset with 16 and 13 flaky tests, respectively. The F1 scores and the accuracy obtained for each category are presented in figure 7.
Compared to the results previously reported in Table III, we observe that the performances of each category are slightly impacted. The Async waits category is the most impacted one. Indeed, after adding two categories, we get an overall F1 score of 0.57, where the added categories get the worst results. This performance drop is caused by multiple factors. The first one is the increase in the number of classes for the classifier from 4 to 6. The discrimination between four classes is much easier than six. Indeed, the top four categories become more difficult to distinguish, which means that the added categories have common characteristics with them. Secondly, the overall F1 score is affected by the poor performances observed in the new two categories. These performances can be a result of the number of examples in these categories (less than 30), which does not allow the classifier to learn the similarities between tests in these categories, and even if it learns, the features are still not mineralizable.

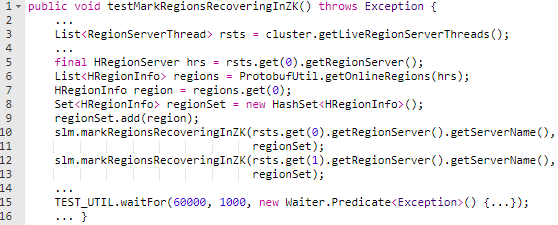
To further understand these results, we inspect a test that was misclassified by FlakyCat. The test is presented in the listing 855 5 https://github.com/apache/hbase/commit/e89712d29dd91be4. Based on the dataset of Luo et al. [24], the original flakiness label of this test is Network, because the test fails intermittently due to a lack of online dependency. However, FlakyCat assigns it first to the category Concurrency, then the second label is Async waits, and the third one is Network. Analyzing the whole test, we can notice that it uses multiple threads, unordered collections, and asynchronous wait for a fixed time, so the test may be flaky for other reasons. Hence, statically multiple categories of flakiness can be assigned to it. In this case, the model can’t make much of a distinction, because it works with similarities, and the test is similar to more than one category.
VII-B Correlation between the statements influencing FlakyCat and flakiness causes
The results of RQ3 highlight the type of code statements on which our model relies to make predictions. Looking at these results, we can notice that, according to the model, Async waits and Concurrency categories have similar types of statements behind them. These statements are related to the use of threads, wait statements with fixed time values, constants and external calls. This means that the two categories have common characteristics. Moreover, external calls, including network calls which constitute a separate flakiness category, are also frequent in the Async waits and Concurrency categories. In addition, time-related statements, which are mainly present in the Time flakiness category, occur also in the Async waits and Concurrency categories. This implies that several defined flakiness categories can intersect (or be included in one another). The results may also draw our attention to the fact that even some elements of the code that may seem important when debugging flakiness problems may be part of the problem. As table IV shows, constants and asserts are among the important elements for the classification of the categories Time and Unordered collection. This is because flaky tests that are caused by unordered collection try to assert that elements of an unordered collection are exactly equal to constant values with a fixed order. The same issue occurs in the Time category as tests compare time values with different precision. This means that developers and tools should be careful with exact equality assertions to avoid these categories of flakiness.
Future research studies may further investigate the precise causes of flakiness and make clear distinctions between categories. The application of machine learning to determine the causes of flakiness is promising and should receive attention while considering that different categories of flakiness may be included in a single test.
VIII Threats to validity
Internal validity
One threat to the internal validity is related to the dataset we used in our study. Flaky tests were gathered from different sources, as explained in section V-A. It is possible that flaky tests were assigned to the wrong label, which would impact the training and evaluation of our model. Certifying the category based on the test source code is complex and can as well be subjective. To ensure the quality of the data, the first two authors reviewed the collected flaky tests and confirmed their belonging to the assigned category.
Similarly, the identification of statement types in RQ3 required a manual analysis of the most influential statements. Hence, the identified types can be subjective and the assignment of statements is prone to human errors. To mitigate this risk, we kept the statement types factual, e.g., control flow and asserts. This allows us to avoid assignment ambiguities and intersections between the different statement types.
External validity
The first threat to external validity is the generalizability of our approach. In this study, we train a model to recognize flaky tests from four of the most prevalent categories, but we are not sure of the performances in other categories. We discussed the addition of two categories (Network and Randomness), and retrieved that the number of examples is one of the influencing factors.
Construct validity
One potential threat to construct validity regards the metrics used for the evaluation study. To alleviate this threat, we report MCC, F1-score, and AUC metrics in addition to the commonly-used precision and recall. As our data is not evenly distributed across the different categories, we report the weighted F1 score.
IX Conclusion
Test flakiness is considered as a major issue in software testing as it disrupts CI pipelines and breaks trust in regression testing. Detecting flaky tests is resourceful as it can require many reruns to reproduce failures. To facilitate the detection, more and more studies suggest static and dynamic approaches to predict if a test is flaky or not. However, detecting flaky tests constitutes only a part of the challenge since it remains difficult for developers to understand the root causes of flakiness. Such understanding is vital for addressing the problem, i.e., fixing the cause of flakiness. At the same time, researchers would gain more insights based on this information. So far, only a few automated fixing approaches were suggested and these are focusing on one category of flakiness. Knowing the category of flakiness for a given flaky test is thus a key information.
With our work, we propose a new approach to this problem that aims at classifying previously identified flaky tests in their corresponding category. We present FlakyCat, a Siamese network-based multi-class classifier that relies on CodeBERT’s code representation. FlakyCat addresses the problem of data scarcity in the field of flakiness by leveraging the Few-Shot learning capabilities of Siamese networks to allow the learning of flakiness categories from small sets of flaky tests. As part of our evaluation of FlakyCat, we collect and make available a dataset of 343 flaky tests with information about their category of flakiness.
Our empirical evaluation shows that FlakyCat performs the best compared to other code representations and traditional classification models used by previous flakiness prediction studies. In particular, we reach a weighted F1 score of 70%. We also analysed the performances with respect to each category of flakiness. We found that flaky tests belonging to Async waits, Unordered collections and Time are the easiest to classify, whereas flaky tests from the Concurrency category are more challenging to predict. Finally, we present a new technique to explain CodeBERT-based machine learning models which is inspired by delta-debugging. This technique helps in explaining what code elements are learnt by models and could give useful information to developers who wish to understand flakiness’s root causes.
References
- [1] M. Shahin, M. A. Babar, and L. Zhu, “Continuous integration, delivery and deployment: a systematic review on approaches, tools, challenges and practices,” IEEE Access, vol. 5, pp. 3909–3943, 2017.
- [2] M. Rehkopf, “What is continuous integration — atlassian,” https://www.atlassian.com/continuous-delivery/continuous-integration, (Accessed on 01/12/2021).
- [3] J. Micco, “The State of Continuous Integration Testing Google,” 2017.
- [4] A. Memon, Z. Gao, B. Nguyen, S. Dhanda, E. Nickell, R. Siemborski, and J. Micco, “Taming google-scale continuous testing,” in 2017 IEEE/ACM 39th International Conference on Software Engineering: Software Engineering in Practice Track (ICSE-SEIP). IEEE, 2017, pp. 233–242.
- [5] S. Habchi, G. Haben, M. Papadakis, M. Cordy, and Y. L. Traon, “A qualitative study on the sources, impacts, and mitigation strategies of flaky tests,” International Conference on Software Testing (ICST), 2022.
- [6] M. Eck, M. Castelluccio, F. Palomba, and A. Bacchelli, “Understanding Flaky Tests: The Developer’s Perspective,” arXiv, pp. 830–840, 2019.
- [7] M. Gruber and G. Fraser, “A survey on how test flakiness affects developers and what support they need to address it,” in Proceedings of the 15th IEEE International Conference on Software Testing, Verification and Validation, ser. ICST ’22, 2022.
- [8] W. Lam, R. Oei, A. Shi, D. Marinov, and T. Xie, “IDFlakies: A framework for detecting and partially classifying flaky tests,” Proceedings - 2019 IEEE 12th International Conference on Software Testing, Verification and Validation, ICST 2019, pp. 312–322, 2019.
- [9] D. Silva, L. Teixeira, and M. D’Amorim, “Shake It! Detecting Flaky Tests Caused by Concurrency with Shaker,” Proceedings - 2020 IEEE International Conference on Software Maintenance and Evolution, ICSME 2020, pp. 301–311, 2020.
- [10] T. M. King, D. Santiago, J. Phillips, and P. J. Clarke, “Towards a Bayesian Network Model for Predicting Flaky Automated Tests,” 2018 IEEE International Conference on Software Quality, Reliability and Security Companion (QRS-C), pp. 100–107, 2018.
- [11] G. Pinto, B. Miranda, S. Dissanayake, M. d’Amorim, C. Treude, and A. Bertolino, “What is the vocabulary of flaky tests?” in Proceedings of the 17th International Conference on Mining Software Repositories, 2020, pp. 492–502.
- [12] B. Camara, M. Silva, A. Endo, and S. Vergilio, “On the use of test smells for prediction of flaky tests,” in Brazilian Symposium on Systematic and Automated Software Testing, 2021, pp. 46–54.
- [13] C. Ziftci and D. Cavalcanti, “De-flake your tests : Automatically locating root causes of flaky tests in code at google,” in 2020 IEEE International Conference on Software Maintenance and Evolution (ICSME), 2020, pp. 736–745.
- [14] W. Lam, P. Godefroid, S. Nath, A. Santhiar, and S. Thummalapenta, “Root Causing Flaky Tests in a Large-Scale Industrial Setting,” in Proceedings ofthe 28th ACM SIGSOFT International Symposium on Software Testing and Analysis (ISSTA ’19). Beijing, China: ACM Press, 2019, pp. 101–111.
- [15] J. Morán, C. Augusto, A. Bertolino, C. de la Riva, and J. Tuya, “Flakyloc: Flakiness localization for reliable test suites in web applications,” J. Web Eng., vol. 19, no. 2, pp. 267–296, 2020. [Online]. Available: https://doi.org/10.13052/jwe1540-9589.1927
- [16] A. Shi, W. Lam, R. Oei, T. Xie, and D. Marinov, “iFixFlakies : A Framework for Automatically Fixing Order-Dependent Flaky Tests,” in 27th ACM Joint European Software Engineering Conference and Symposium on the Foundations ofSoftware Engineering (ESEC/FSE ’19), 2019.
- [17] C. Li, C. Zhu, W. Wang, and A. Shi, “Repairing order-dependent flaky tests via test generation,” in Proceedings of the 44th International Conference on Software Engineering - ICSE ’22. ICSE, 2022.
- [18] S. Dutta, A. Shi, R. Choudhary, Z. Zhang, A. Jain, and S. Misailovic, “Detecting flaky tests in probabilistic and machine learning applications,” ISSTA 2020 - Proceedings of the 29th ACM SIGSOFT International Symposium on Software Testing and Analysis, pp. 211–224, 2020.
- [19] Z. Feng, D. Guo, D. Tang, N. Duan, X. Feng, M. Gong, L. Shou, B. Qin, T. Liu, D. Jiang et al., “Codebert: A pre-trained model for programming and natural languages,” arXiv preprint arXiv:2002.08155, 2020.
- [20] H. Jiang, X. Li, Z. Yang, and J. Xuan, “What causes my test alarm? automatic cause analysis for test alarms in system and integration testing,” in Proceedings of the 39th International Conference on Software Engineering, ser. ICSE ’17. IEEE Press, 2017, p. 712–723. [Online]. Available: https://doi.org/10.1109/ICSE.2017.71
- [21] M. contributors, “Test verification - mozilla — mdn,” https://developer.mozilla.org/en-US/docs/Mozilla/QA/Test_Verification, March 2019, (Accessed on 01/12/2021).
- [22] M. Harman and P. O’Hearn, “From Start-ups to Scale-ups: Opportunities and Open Problems for Static and Dynamic Program Analysis,” in 2018 IEEE 18th International Working Conference on Source Code Analysis and Manipulation (SCAM). IEEE, sep 2018, pp. 1–23. [Online]. Available: https://ieeexplore.ieee.org/document/8530713/
- [23] J. Palmer, “Test flakiness – methods for identifying and dealing with flaky tests : Spotify engineering,” https://engineering.atspotify.com/2019/11/18/test-flakiness-methods-for-identifying-and-dealing-with-flaky-tests/, November 2019, (Accessed on 01/12/2021).
- [24] Q. Luo, F. Hariri, L. Eloussi, and D. Marinov, “An empirical analysis of flaky tests,” in Proceedings of the ACM SIGSOFT Symposium on the Foundations of Software Engineering, vol. 16-21-November-2014, nov 2014, pp. 643–653.
- [25] M. Eck, F. Palomba, M. Castelluccio, and A. Bacchelli, “Understanding flaky tests: The developer’s perspective,” in Proceedings of the 2019 27th ACM Joint Meeting on European Software Engineering Conference and Symposium on the Foundations of Software Engineering, ser. ESEC/FSE 2019. New York, NY, USA: Association for Computing Machinery, 2019, p. 830–840. [Online]. Available: https://doi-org.sndl1.arn.dz/10.1145/3338906.3338945
- [26] O. Parry, G. M. Kapfhammer, M. Hilton, and P. McMinn, “Surveying the developer experience of flaky tests,” in Proceedings of the International Conference on Software Engineering: Software Engineering in Practice (ICSE-SEIP), 2022.
- [27] O. Parry, “A Survey of Flaky Tests,” ACM transactions on software engineering and methodology, vol. 31, no. 1, 2021.
- [28] J. Bell, O. Legunsen, M. Hilton, L. Eloussi, T. Yung, and D. Marinov, “DeFlaker: Automatically Detecting Flaky Tests,” in Proceedings of the 40th International Conference on Software Engineering - ICSE ’18. New York, New York, USA: ACM Press, 2018, pp. 433–444. [Online]. Available: http://dl.acm.org/citation.cfm?doid=3180155.3180164
- [29] A. Gyori, B. Lambeth, A. Shi, O. Legunsen, and D. Marinov, “Nondex: A tool for detecting and debugging wrong assumptions on java api specifications,” in Proceedings of the 2016 24th ACM SIGSOFT International Symposium on Foundations of Software Engineering, 2016, pp. 993–997.
- [30] G. Pinto, B. Miranda, S. Dissanayake, M. D’Amorim, C. Treude, and A. Bertolino, “What is the Vocabulary of Flaky Tests?” Proceedings - 2020 IEEE/ACM 17th International Conference on Mining Software Repositories, MSR 2020, pp. 492–502, 2020.
- [31] G. Haben, S. Habchi, M. Papadakis, M. Cordy, and Y. Le Traon, “A Replication Study on the Usability of Code Vocabulary in Predicting Flaky Tests,” Proceedings of the International Conference on Mining Software Repositories (MSR), 2021.
- [32] B. Camara, M. Silva, A. T. Endo, and S. Vergilio, “What is the vocabulary of flaky tests? an extended replication,” in 2021 2021 IEEE/ACM 29th International Conference on Program Comprehension (ICPC) (ICPC). Los Alamitos, CA, USA: IEEE Computer Society, may 2021, pp. 444–454. [Online]. Available: https://doi.ieeecomputersociety.org/10.1109/ICPC52881.2021.00052
- [33] V. Pontillo, F. Palomba, and F. Ferrucci, “Toward static test flakiness prediction: A feasibility study,” in Proceedings of the 5th International Workshop on Machine Learning Techniques for Software Quality Evolution, 2021, pp. 19–24.
- [34] A. Alshammari, C. Morris, M. Hilton, and J. Bell, “Flakeflagger: Predicting flakiness without rerunning tests,” in 2021 IEEE/ACM 43rd International Conference on Software Engineering (ICSE), 2021, pp. 1572–1584.
- [35] O. Parry, G. M. Kapfhammer, M. Hilton, and P. McMinn, “Evaluating features for machine learning detection of order-and non-order-dependent flaky tests,” in 2022 IEEE Conference on Software Testing, Verification and Validation (ICST). IEEE, 2022, pp. 93–104.
- [36] S. Fatima, T. A. Ghaleb, and L. Briand, “Flakify: A Black-Box, Language Model-based Predictor for Flaky Tests,” arXiv preprint arXiv:2112.12331, pp. 1–12, 2021. [Online]. Available: http://arxiv.org/abs/2112.12331
- [37] X. Sun, B. Wang, Z. Wang, H. Li, H. Li, and K. Fu, “Research progress on few-shot learning for remote sensing image interpretation,” IEEE Journal of Selected Topics in Applied Earth Observations and Remote Sensing, vol. 14, pp. 2387–2402, 2021.
- [38] M. Khajezade, F. H. Fard, and M. S. Shehata, “Evaluating few shot and contrastive learning methods for code clone detection,” arXiv preprint arXiv:2204.07501, 2022.
- [39] Y. He, W. Wang, H. Sun, and Y. Zhang, “Vul-mirror: a few-shot learning method for discovering vulnerable code clone,” EAI Endorsed Transactions on Security and Safety, vol. 7, no. 23, p. e4, 2020.
- [40] Y. Wan, W. Zhao, H. Zhang, Y. Sui, G. Xu, and H. Jin, “What do they capture?–a structural analysis of pre-trained language models for source code,” arXiv preprint arXiv:2202.06840, 2022.
- [41] W. Lam, K. Muşlu, H. Sajnani, and S. Thummalapenta, “A study on the lifecycle of flaky tests,” in Proceedings of the ACM/IEEE 42nd International Conference on Software Engineering, ser. ICSE ’20. New York, NY, USA: Association for Computing Machinery, 2020, p. 1471–1482. [Online]. Available: https://doi.org/10.1145/3377811.3381749
- [42] S. Chakraborty, R. Krishna, Y. Ding, and B. Ray, “Deep learning based vulnerability detection: Are we there yet,” IEEE Transactions on Software Engineering, 2021.
- [43] X. Zhou, D. Han, and D. Lo, “Assessing generalizability of codebert,” in 2021 IEEE International Conference on Software Maintenance and Evolution (ICSME). IEEE, 2021, pp. 425–436.
- [44] Z. Feng, D. Guo, D. Tang, N. Duan, X. Feng, M. Gong, L. Shou, B. Qin, T. Liu, D. Jiang, and M. Zhou, “CodeBERT: A pre-trained model for programming and natural languages,” in Findings of the Association for Computational Linguistics: EMNLP 2020. Online: Association for Computational Linguistics, Nov. 2020, pp. 1536–1547. [Online]. Available: https://aclanthology.org/2020.findings-emnlp.139
- [45] A. Vaswani, N. Shazeer, N. Parmar, J. Uszkoreit, L. Jones, A. N. Gomez, Ł. Kaiser, and I. Polosukhin, “Attention is all you need,” Advances in neural information processing systems, vol. 30, 2017.
- [46] ——, “Attention is all you need,” Advances in neural information processing systems, vol. 30, 2017.
- [47] D. V. Carvalho, E. M. Pereira, and J. S. Cardoso, “Machine learning interpretability: A survey on methods and metrics,” Electronics, vol. 8, no. 8, p. 832, 2019.
- [48] “Feature importances with a forest of trees — scikit-learn 1.1.1 documentation,” https://scikit-learn.org/stable/auto_examples/ensemble/plot_forest_importances.html, (Accessed on 06/24/2022).
- [49] S. Lundberg, “Shap documentation,” https://shap.readthedocs.io/, 2018, (Accessed on 06/23/2022).
- [50] A. Zeller and R. Hildebrandt, “Simplifying and isolating failure-inducing input,” IEEE Transactions on Software Engineering, vol. 28, no. 2, pp. 183–200, 2002.
- [51] J. Bell, O. Legunsen, M. Hilton, L. Eloussi, T. Yung, and D. Marinov, “Deflaker: Automatically detecting flaky tests,” in 2018 IEEE/ACM 40th International Conference on Software Engineering (ICSE), 2018, pp. 433–444.
- [52] M. Gruber, S. Lukasczyk, F. Krois, and G. Fraser, “An Empirical Study of Flaky Tests in Python,” Proceedings - 2021 IEEE 14th International Conference on Software Testing, Verification and Validation, ICST 2021, pp. 148–158, 2021.
- [53] R. V. Krejcie and D. W. Morgan, “Determining sample size for research activities,” Educational and psychological measurement, vol. 30, no. 3, pp. 607–610, 1970.
- [54] N. V. Chawla, K. W. Bowyer, L. O. Hall, and W. P. Kegelmeyer, “Smote: synthetic minority over-sampling technique,” Journal of artificial intelligence research, vol. 16, pp. 321–357, 2002.
- [55] F. Pedregosa, G. Varoquaux, A. Gramfort, V. Michel, B. Thirion, O. Grisel, M. Blondel, P. Prettenhofer, R. Weiss, V. Dubourg et al., “Scikit-learn: Machine learning in python,” the Journal of machine Learning research, vol. 12, pp. 2825–2830, 2011.
- [56] A. Peruma, K. Almalki, C. D. Newman, M. W. Mkaouer, A. Ouni, and F. Palomba, “Tsdetect: An open source test smells detection tool,” in Proceedings of the 28th ACM Joint Meeting on European Software Engineering Conference and Symposium on the Foundations of Software Engineering, ser. ESEC/FSE 2020. New York, NY, USA: Association for Computing Machinery, 2020, p. 1650–1654. [Online]. Available: https://doi.org/10.1145/3368089.3417921