Circumplanetary disk ices
Abstract
Context. The large icy moons of Jupiter formed in a circumplanetary disk (CPD). CPDs are fed by vertically infalling circumstellar gas and dust which may be shock-heated upon accretion. Accreted material is then either incorporated into moons, falls into the planet, or is lost beyond the disk edge on relatively short timescales. If ices are sublimated during accretion onto the CPD we know there must be sufficient time for them to recondense or moons such as Ganymede or Callisto could not form. The chemical timescale to form sufficiently icy solids places a novel constraint on the dynamical behaviour and properties of CPDs.
Aims. We aim to explore the process of ice formation in CPDs to constrain which disk properties (such as the mass, viscosity, and dust-to-gas ratio) are consistent with the formation of an icy moon system.
Methods. We use the radiation thermochemical code ProDiMo (Protoplanetary Disk Model) to analyze how the radial ice abundance evolves in CPDs. We consider different initial chemical conditions of the disk to explore the consequences of infalling material being inherited from the circumstellar disk or being reset to atomic conditions by shock-heating. We contrast the timescales of ice formation with disk viscous timescales and radial dust drift.
Results. We have derived the radial ice abundance and rate of ice formation in a small grid of model CPDs. Water ice can form very efficiently in the CPD from initially atomic conditions, as a significant fraction is efficiently re-deposited on dust grains within ¡ 1 yr. Radial grain drift timescales are in general longer than those of ice formation on grains. Icy grains of size mm retain their icy mantles while crossing an optically thin circumstellar disk gap at 5 au for L⊙.
Conclusions. Three-body reactions play an important role in water formation in the dense midplane condition of CPDs. The CPD midplane must be depleted in dust relative to the circumstellar disk by a factor 10-50 to produce solids with the ice to rock ratio of the icy Galilean satellites. The CPD snowline is not erased by radial grain drift, which is consistent with the compositional gradient of the Galilean satellites being primordial.
Key Words.
Planets and satellites: formation – Planets and satellites: composition – Accretion, accretion disks, – Protoplanetary disks, – Planets and satellites: individual: Jupiter – Methods: numerical1 Introduction
A general feature of regular satellite formation theory is that the circumplanetary disk (CPD) consists of circumstellar material accreted from within the vicinity of the planet (Lubow et al. 1999; Canup & Ward 2002; Alibert et al. 2005; Shibaike et al. 2019; Ronnet & Johansen 2020). If the planet is massive enough to open a gap in the circumstellar disk, material continues to flow into the gap (Kley 1999; Teague et al. 2019) and falls nearly vertically onto the CPD (Tanigawa et al. 2012; Morbidelli et al. 2014a). The CPD achieves a steady-state mass when this inflow is balanced by outflow where gas either spirals into the planet or is decreted beyond the Hill sphere (Canup & Ward 2002; Batygin & Morbidelli 2020). Independently of disk viscosity, stellar tides induce spiral waves in the CPD which transport angular momentum and promote accretion onto the planet at a rate on the order MJ yr-1 (Rivier et al. 2012), suggesting that for a CPD of mass MJ (D’Angelo et al. 2002; Gressel et al. 2013; Szulágyi et al. 2014) infalling gas spends only a limited time inside the CPD before being lost (Canup & Ward 2002).
The timescale of radial dust drift in small disks is also predicted to be short (Pinilla et al. 2013; Shibaike et al. 2017; Rab et al. 2019). A CPD could lose mm-size grains within 102-103 yr to aerodynamic drag against highly sub-Keplerian gas due to a very steep radial pressure gradient (Zhu et al. 2018). The CPD is thus a very dynamical system, potentially with both inwards and outwards radial transport of both gas and dust on very short timescales.
The amount of time which gas and dust spend within the CPD becomes highly relevant if a chemical “reset” occurs. The infalling circumstellar material may pass through one or more accretion shocks (Lubow et al. 1999; Tanigawa et al. 2012; Zhu 2015; Szulágyi et al. 2016; Schulik et al. 2020) and can be heated K during accretion onto the CPD (Szulágyi 2017; Szulágyi & Mordasini 2017; Aoyama et al. 2018). For pre-shock velocities in excess of 90 km s-1 the shock can be sufficiently hot to leave most of the infalling gas atomic or ionized (Aoyama et al. 2018). The shock may also desorb the icy mantles of grains via sputtering and thermal desorption, which for pre-shock velocities in excess of 8-10 km s-1 can effectively strip a grain of H2O ice (Woitke et al. 1993; Aota et al. 2015; Tielens 2021). Small icy grains passing through the gap may also lose their volatile contents to photodesorption prior to shock-heating (Turner et al. 2012). We refer to a ”reset” scenario if shock-heating or photodesorption effectively destroys molecules in the accretion flow to the CPD. In a reset scenario, the re-formation of ices in the CPD must compete with viscous accretion and decretion of gas and radial drift of dust. Alternatively, if circumstellar disk ices survive incorporation into the CPD, we refer to an “inheritance” scenario.
The Galilean satellites characteristically exhibit a radial compositional gradient of decreasing density with increasing distance from Jupiter. The inner moon Io is ice-free, while Europa has an ice mass fraction of -9 (Schubert et al. 2004; Kuskov & Kronrod 2005) and Ganymede and Callisto have ice mass fractions of 40-55 (McKinnon 1997; Schubert et al. 2004; Sohl et al. 2002). Theoretically it appears challenging to reproduce the compositional gradient by tidal heating (Bierson & Steinbrügge 2021) or impact-driven escape of volatiles (Dwyer et al. 2013). Previously it has been proposed that the gradient was imprinted during the formation of the moons by a radial temperature gradient in the CPD (Lunine & Stevenson 1982), but the relevant chemical timescales have rarely been taken into account (Mousis & Alibert 2006). It is an open question whether the gradient can be produced primordially if the chemistry of infalling gas and dust is reset. By analyzing the composition and abundance of ices that are able to form within the relevant timescales we can place a lower bound on how efficiently angular momentum is transported within the CPD.
In this work we investigated the balance of the competing timescales of ice formation, dust grain drift, and gas viscous flow to seek constraints on properties of the CPD such as viscosity, ice mass fraction, and dust-to-gas ratio. We considered the two opposing extreme cases of full chemical inheritance and reset in chemically evolving disk models utilizing a rate-based modeling approach. In Sect. 2 we describe our modeling set-up and the assumptions that we make. In Sect. 3 we analyze the CPD time-dependent ice abundances for both the reset and inheritance cases, and place novel constraints on the properties of CPDs. In Sect. 4 we discuss the implications of the these constraints and place them in the context of solar system formation. We consider also the role that radial grain drift has in competing with ice adsorption and desorption. In Sect. 5 we summarize our key findings.
2 Methods
We considered two opposing scenarios; one in which the molecular gas-phase and ice chemistry of the circumstellar disk is preserved during accretion onto the CPD (inherit) and one in which it is lost (reset). In the former case the CPD is initially populated with gas and ices extracted from the circumstellar disk. In the latter case the disk is initially populated by a fully atomic gas and dust is free of ice. We followed the build-up of ices in the CPD over time in a thermochemical disk model (see Sect. 2.1) and extracted the molecular ice abundance and composition as a function of time.
The net inflow and outflow rate of gas and solids from and to the CPD is assumed to be zero, and that the disk mass is in steady-state. The rate of gas outflow then sets an upper limit on the applicable chemical evolutionary timescales. Hereafter we refer to this as the viscous timescale, defined as
| (1) |
where is the mass of the CPD and is the infall rate of circumstellar material onto the CPD. The relatively short considered in this work (see Sect. 2.1.2) may cause reactions with high activation energies to be kinetically inhibited, although it has been noted that the relatively high densities characteristic of CPDs may allow these reactions to proceed to equilibrium (de Pater & Lissauer 2010). Nevertheless we contrast the time-dependent results with the assumption of steady-state chemistry. In steady-state chemistry the disk is allowed to evolve for an indefinite time period until the rate of formation for every gas and ice species is balanced by the corresponding rate of destruction.
2.1 Disk modeling code
We used the radiation thermochemical disk modeling code ProDiMo 11 1 https://www.astro.rug.nl/ prodimo/ (Protoplanetary Disk Model) (Woitke et al. 2009a; Woitke et al. 2016a; Kamp et al. 2010; Kamp et al. 2017; Thi et al. 2011; Thi et al. 2018; Thi et al. 2020a) to explore the formation rates and resulting abundances of various ices in CPDs. ProDiMo uses a rate equation based approach to compute the gas chemistry using either a time-dependent or steady-state solver. The model represents a 2D slice through an axisymmetric disk, extending radially in distance from the planet and vertically in distance from the disk midplane . Our chemical network contains 13 elements and 235 atomic and molecular species. Where not explicitly specified we used the “large DIANA chemical standard” network as described in Kamp et al. 2017. Reaction rates are mainly selected from the UMIST2012 database (McElroy et al. 2013). Important three-body collider reactions are adopted from the UMIST2006 rate file (Woodall et al. 2007). Gas-phase reactions within the CPD produce molecular species which can then freeze-out on grain surfaces. The rate of ice formation is determined by the available grain surface area, dust temperature, and the rates of thermal, photo-, and cosmic-ray desorption (see Sect. 2.1.1 for a detailed description of ice formation).
We made the simplifying assumption that the chemical composition of the infalling material is distributed instantaneously and homogeneously throughout the disk (see appendix E for a discussion of the potential impact of the rate of vertical gas mixing). We assumed that the CPD inherits micrometer to mm-sized dust grains directly from the circumstellar disk. The vertical dust stratification is calculated according to the method of Dubrulle et al. 1995 and kept fixed prior to the calculation of chemical evolution. The timescales of radial dust drift are calculated in a post-processing step described in 2.2. The temperature and radiation structure of the CPD is solved in steady-state and then kept fixed during chemical evolution of inherited or reset infalling material.
In Sect. 3.2 we considered the implications of including grain-surface chemistry reactions. With surface chemistry ProDiMo models explicitly the formation of H2 in the CPD for which the inclusion of additional chemical species such as hydrogenated PAH is necessitated (Thi et al. 2020b; Thi et al. 2020a). The selection of the additional species and reactions in the surface chemistry network and their role in the eventual composition of the ices will be discussed in an accompanying work focused on the composition of the ices (Oberg et al. in prep.).
2.1.1 Ice formation
Where conditions in the disk are appropriate, ices can condense onto the grains in successive layers by physical van der Waals bonding (physisorption). The adsorption rate of species onto a physisorption sites is
| (2) |
where 4 is a dust grain surface area, is the grain radius, v is the thermal speed (, is the Boltzmann constant, is the gas temperature, is the mass of the gas-phase species, is the dust number density, and is the sticking coefficient. The ice adsorption rate coefficients are then
| (3) |
where is the number density of the gas-phase species.
Physisorbed species can desorb thermally, photodesorb, or desorb after a cosmic ray impact deposits energy in the grain. For physisorption there is no desorption barrier and the desorption energy is equal to the binding energy E. The Arrhenius formulation for the rate of thermal desorption is then
| (4) |
where the pre-exponential (frequency) factor is
| (5) |
is the density of surface binding sites 1.5 cm-2 (Hasegawa et al. 1992), and is the dust temperature. Adsorption energies of major volatile species are listed in Appendix B.
The photodesorption rate is computed using the UV field strength calculated by the radiative transfer and photodissociation cross-sections. The photodesorption rate for species is
| (6) |
where is the photodesorption yield, is the concentration of the species in the active layers,
| (7) | |||||
The number of physisorbed layers = and is the total number of the physisorbed species, is the number of binding sites per layer, and is the number of chemically active layers. is a measure of the local UV energy density from the 2D continuum radiative transfer (Woitke et al. 2009a). The rate of cosmic-ray induced desorption is calculated according to the method of (Hasegawa & Herbst 1993). The total desorption rate is the sum of the thermal, photo- and cosmic ray induced desorption rates ++. The desorption rate of the physisorbed species is then
| (8) |

2.1.2 Properties of the Disk Models
| Parameter | Symbol | Value | Unit |
| Stellar Mass | 1.0 | M⊙ | |
| Stellar Luminosity | 0.84 | L⊙ | |
| Effective Temperature | 4395 | K | |
| UV Luminosity | 0.01 | L⊙ | |
| X-ray Luminosity | 1030 | erg s-1 | |
| Disk Mass | 0.001 | M⊙ | |
| Disk Inner Radius | 0.1 | au | |
| Disk Outer Radius | 100 | au | |
| Column Density Power Ind. | 1.5 | - | |
| Reference Scale Height | H10au | 1 | au |
| Flaring Index | 1.15 | - | |
| Minimum dust size | 0.05 | µm | |
| Maximum dust size | 3000 | µm | |
| Dust size power law index | 3.5 | - | |
| Dust-to-Gas ratio | - | ||
| Dust composition: | |||
| Mg0.7Fe0.3SiO3 | |||
| Amorphous carbon | |||
| Vacuum |
The Circumstellar Disk
To generate the chemical abundances for our “inheritance” scenario we considered the properties of the surrounding circumstellar disk from which material is accreted onto the CPD. We used a two-step approach to model the chemistry in our circumstellar disk. As a first step, the initial conditions are derived from a zero-dimensional “molecular cloud” model, the parameters of which are listed in Table 6. This stage represents 1.7 yr (the estimated lifetime of the Taurus Molecular Cloud TMC-1) of chemical evolution in a pre-collapse molecular cloud state (McElroy et al. 2013). The resulting chemical abundances of the majority of the most common species agree within a factor 10 with the observed abundances in TMC-1(see Fig. 16). These abundances are then used as initial conditions for the 2D grid of cells in the circumstellar disk model in the second step.
In the second step the circumstellar disk model is evolved for an additional 4 Myr to be consistent with the formation timeline of Jupiter proposed to account for the distinct isotopic population of meteorites found in the solar system wherein Jupiter undergoes runaway accretion 3.46 Myr after the formation of calcium-aluminium rich refractory inclusions (Kruijer et al. 2017; Weiss & Bottke 2021). The surface density power law and physical extent of the circumstellar disk is based on a modified “Minimum Mass Solar Nebula” (MMSN) (Hayashi 1981). A parameteric gap has been introduced which reduces the dust and gas density at 5.2 au centered on the location of Jupiter. The gap dimensions are parameterized by an analytical gap scaling relation derived from hydrodynamical simulations and are consistent with a circumstellar disk viscosity of and disk age of 4 Myr (Kanagawa et al. 2016). A detailed description of the circumstellar disk model and gap structure methodology can be found in (Oberg et al. 2020). The relevant circumstellar disk model parameters can be found in Table 1. The dust temperature, surface density profile, and UV field strength in and around the circumstellar disk gap can be seen in Fig. 1.
Finally we extract the chemical abundances from the circumstellar disk model at the outer edge of the gap at a radius of 8.2 au. The gap edge is defined as the radius at which the perturbed surface density profile reaches 50 of the unperturbed profile. As material flows into the gap from above one pressure scale height (Morbidelli et al. 2014b), we extract our initial conditions for the CPD model at = ( = 0.5 au at au). The ambient conditions at this point are listed in Table 2. The extracted abundances are then used as the initial chemical composition for our “inheritance” scenario CPD.
Throughout this work we quantify the iciness of solids with the ice mass fraction,
| (9) |
where is the ice mass and is the total rock (in this case, dust) mass. The of solids in the inherited circumstellar material is 0.48. At a single pressure scale height ( = ) there is a factor 20 reduction of the initial, global dust-to-gas ratio due to settling which is calculated according to the method of Dubrulle et al. 1995 with such that the dust-to-gas ratio at one scale height d/gz=H = 10-3.2. Nevertheless we test a range of different values for the CPDs both above and below this value (-).
| Parameter | Symbol | Value | Unit |
|---|---|---|---|
| Hydrogen density | cm-3 | ||
| Optical Extinction | AV,in | 1.01 | - |
| Dust-to-gas ratio | - | ||
| Dust Temperature | 57.0 | K | |
| Gas Temperature | 57.3 | K | |
| Ice Mass Fraction | fice,in | 0.48 | - |
Survival of icy grains passing through the gap

Icy grains must orbit within the optically thin gap for an unknown amount of time prior to being accreted onto the CPD. We considered whether ices on grains can survive against thermal- or photodesorption while crossing through the circumstellar disk gap. The dust and gas temperatures in the gap are not closely coupled as a consequence of the low densities. While the gas temperature extracted from the model at the midplane is 200 K, the corresponding dust temperature is 48 K. Given that pressures in the gap range from 10-12-10-10 bar, water ice is stable on the relevant timescales in the absence of irradiation (Lodders 2003). However, the actual ice abundance at the gap midplane is negligible in steady-state. Despite the presence of a shadowing inner disk, ice within the gap are sublimated as a result of the significant stellar background radiation scattered into the gap.
To assess the longevity of ices crossing through the gap we populated the gap region with the “inheritance” chemical abundances found exterior to the gap and produce snapshots at regular intervals. The resulting decline in ice abundance as a function of time is shown in Fig. 2 for various stellar luminosities. The differing luminosities correspond to expected properties of the sun for a stellar age of 0.1, 0.5, 1 and 4 Myr (Siess et al. 2000b). Turner et al. 2012 suggests that grains entering the gap are accreted generally within a single orbital period or 10 yr. We find that for a moon formation time ¿ 1 Myr after CAI formation (LL⊙), grains retain of their volatile content during gap-crossing if they reach the vicinity of the planet within 10 yr. A ”full” inheritance scenario is thus not excluded by conditions within the gap, but would instead rely on shock-heating at the CPD surface.
The circumplanetary disks
The CPD is an actively-fed accretion disk with a steady-state mass proportional to its viscosity and mass infall rate. We considered an optically thick CPD of mass M⊙ as well as a lower mass CPD ( M⊙) which is optically thin everywhere outside the orbit of Callisto ( ¿ 0.03 RH where RH = 0.34 au is the Hill radius). For a Jovian-mass planet these represent planet-disk mass ratios of and respectively. The CPDs are thus of the ”gas-starved” type, and do not instantaneously contain the mass required to form a moon system as massive as the Galilean one.
The outer radius of the CPD is set as the planetary Hill radius RH, however an exponential decline in the surface density profile is parameterized to begin at RH/3 corresponding to the outermost stable orbit set by tidal interaction and angular momentum considerations (tidal truncation radius) (Quillen & Trilling 1998; Ayliffe & Bate 2009; Martin & Lubow 2011). An empty inner magnetospheric cavity is assumed to exist as the result of magnetic interaction with the planet (Takata & Stevenson 1996; Shibaike et al. 2019; Batygin 2018). The parameterized radial surface density profiles of the high- and low-mass CPDs can be found in Fig.4 together with the resulting optical extinction profiles derived from the continuum radiative transfer.
The small parameter variation grid of models exploring possible CPD mass and viscosity can be found in Table 4 along with the model id’s. The format of the id is (-) where is related to the CPD mass by 10-x M⊙ and to the mass infall rate (and thus viscosity) by 10-y M⊙ yr-1. The list of parameters which are common between the reference CPDs can be found in Table 3.
CPD viscosity
While the mechanism that produces angular momentum transport in accretion disks is not well understood, it is known that molecular viscosity alone is far too weak to explain observations (Shakura & Sunyaev 1973; Pringle 1981). The efficiency of angular momentum transport is parameterized by the dimensionless -viscosity (Shakura & Sunyaev 1973) which for a circumstellar disk may have a broad distribution ranging from (Rafikov 2017; Ansdell et al. 2018; Villenave et al. 2022).

Disk gas with a sufficiently high ionization fraction couples to the stellar or planetary magnetic field such that the magnetorotational instability (MRI) induced turbulence may provide the source of the effective viscosity and produce (Balbus & Hawley 1991; Hawley et al. 1995; Balbus 2003). In the case of a CPD, MRI induced-turbulence may be inhibited by the short orbital periods and presence of magnetic dead-zones, limiting gas transport to a thin surface layer (Fujii et al. 2014). Even if the CPD were effectively inviscid, tidal interaction with the star may promote a minimum rate of angular momentum transport through the excitation of spiral waves (Rivier et al. 2012). In our ProDiMo model the -viscosity of the disk is not explicitly specified. Instead, a mass accretion rate is specified which controls the heating rate of the disk through viscous dissipation.
The disk mass, accretion rate, and viscosity are highly degenerate properties. 3D hydrodynamical modeling of gas delivery into the vicinity of a Jupiter mass planet at 5 au suggest M⊙ yr-1 of gas (Szulágyi et al. 2022). Stellar tidal perturbation may produce a minimum accretion rate M⊙ yr-1 (Rivier et al. 2012). In the PDS 70 system, two massive planets are observed to be accreting gas in a large dust cavity (Wagner et al. 2018; Keppler et al. 2018; Haffert et al. 2019). K-band observations of PDS 70 b with the VLT are consistent with M⊙ yr-1 (Christiaens et al. 2019) with similar values estimated for PDS 70 c (Thanathibodee et al. 2019). HST UV and H imaging of the protoplanet PDS 70 b suggest M⊙ yr-1 (Zhou et al. 2021). Based on these observational and theoretical constraints we adopt M⊙ yr-1 (with a heating rate corresponding to ) and M⊙ yr-1 () for the high-mass CPD, representing viscous timescales of and years, respectively, over which the majority of the CPD mass is replaced by freshly accreted material (see Eq.(1)). For the low-mass CPD we adopt M⊙ yr-1 and M⊙ yr-1 to represent the same -viscosities and .
The viscous heating is determined according to the method of D’Alessio et al. 1998. The half-column heating rate is
| (10) |
where is the gravitational constant, is the planet mass, is the distance to the planet, and is the planetary radius. We convert the surface-heating to a heating rate per volume as
| (11) |
where is the mass density of the dust at radius and height . The heating is applied directly to the dust. The resulting midplane dust temperature profile of the CPDs can be found in Fig.3. The temperature profiles have been calculated using a new diffusion-approximation radiative transfer solver which is described in appendix A.

Sources of CPD external irradiation
The rate of photodesorption plays an important role in determining the ice abundance in the outer optically-thin region of the CPDs. Potential sources of radiation include the planet, the star, and nearby massive cluster stars. For the planet we assume the runaway gas accretion phase has ended and that the luminosity has correspondingly declined to L⊙ with a surface temperature of 1000 K where it remains relatively constant for 10 Myr (Hubickyj et al. 2005; Marley et al. 2007; Spiegel & Burrows 2012).
We parameterize the isotropic background radiation intensity with the dimensionless parameter . The background intensity is then the sum of a diluted 20000 K blackbody field and the cosmic microwave background,
| (12) |
where the dilution factor = such that a value of corresponds to the quiescent interstellar background, or ”unit Draine field” (Draine & Bertoldi 1996; Röllig et al. 2007; Woitke et al. 2009a). Irradiation by the young sun provides a minimum at 5 au (see Fig.1) despite partial shadowing by an inner disk (Oberg et al. 2020). We adopted the same value for the strength of the FUV irradiation in the midplane at Jupiter’s location although it is contingent on our assumptions regarding the stellar UV luminosity and geometry of the inner circumstellar disk. Independently of these factors, Oberg et al. 2020 find that interstellar radiation results in a mean of O(3) in the gap, as the Sun is believed to have formed in a relatively dense stellar cluster (Adams 2010; Portegies Zwart 2019) containing massive OB stars (Pfalzner 2013). External irradiation heats dust and gas on the surface and in the outer regions of the optically-thin CPD midplane. 3D dust radiative transfer modelling of gap-embedded CPDs suggests scattered stellar radiation can be the dominant heating source in the outer regions of a CPD (Portilla-Revelo et al. 2022). We assumed that the outer edge of the CPD is in thermal equilibrium with the surroundings and set a CPD background temperature lower limit of 50 K equal to that of dust in the circumstellar disk gap (see Fig. 1).
CPD dust mass and grain size population
The dust-to-gas ratio is a key parameter that regulates the eventual ratio of ice to rock in the CPD. Planet-induced pressure bumps at the gap edges of the circumstellar disk may filter out dust particles above 100 µm in size (Rice et al. 2006; Zhu et al. 2012). For a dust grain size population power law exponent of -3.5, minimum grain size amin 0.05 µm, maximum grain size amax 3000 µm, a filtering of grains larger than 100 µm would be reduced the mass of dust entering the gap by a factor . As an opposing view Szulágyi et al. 2022 find that a planet within the gap can stir dust at the circumstellar disk midplane and produce a very high rate of dust delivery to the CPD, such that the dust-to-gas ratio can even be enhanced in the CPD to for a Jupiter mass planet at 5 au.
The dust population within the CPD may also rapidly evolve. It is possible that mm-sized grains are quickly lost to radial drift in yr (Zhu et al. 2018). Similarly Rab et al. 2019 used the dust evolution code two-pop-py (Birnstiel et al. 2012) to show that for an isolated CPD onto which new material does not accrete, an initial dust-to-gas ratio of can in only yr be reduced to and in yr to . However, larger dust grains may become trapped in CPDs (Drążkowska & Szulágyi 2018; Batygin & Morbidelli 2020). Additionally, we expected that in an embedded, actively-accreting CPD the dust will continually be replenished and that a higher steady-state dust-to-gas ratio will be achieved. Given these considerations we tested various possible dust to gas ratios ranging from in Appendix H.
| Parameter | Symbol | Value | Unit |
|---|---|---|---|
| Planet Mass | 1.0 | MJ | |
| Planetary Luminosity | L⊙ | ||
| Effective Temperature | 1000 | K | |
| UV Luminosity | 0.01 | Lp | |
| Background UV Field | - | ||
| Background Temperature | 50 | K | |
| Disk Inner Radius | 0.0015 | au | |
| Taper Radius | 0.12 | au | |
| Disk Outer Radius | 0.35 | au | |
| Column Density Power Ind. | 1.0 | - | |
| Flaring Index | 1.15 | - | |
| Reference Scale Height | 0.01 | au | |
| Maximum dust size | 3000 | m | |
| Dust-to-Gas Ratio | - |
| model id | [M⊙] | [M⊙yr-1] | [yr] | |
|---|---|---|---|---|
| (7-10) | ||||
| (7-11) | ||||
| (8-11) | ||||
| (8-12) |
2.2 Dust grain drift within the CPD
In ProDiMo the chemistry is solved for each grid cell without accounting for radial dust or gas transport. Instead we used properties of the ProDiMo model output to inform the radial dust drift calculations in a post-processing step to compare timescales of chemical evolution vs. dust drift. Disk gas which is pressure-supported orbits at sub-Keplerian velocities such that larger grains feel a headwind and rapidly drift inwards (Weidenschilling 1977). In a circumstellar disk the degree of sub-Keplerianity can be while in a CPD it could be as high as 20-80 due to significant gas pressure support (Armitage 2007; Drążkowska & Szulágyi 2018). We considered whether the timescale of grain drift can compete with the processes that shape grain composition In the Epstein regime the radial grain drift velocity can be approximated as
| (13) |
where is the radial velocity of the gas, is the dimensionless stopping time of a grain,
| (14) |
where is the stopping time, is the Keplerian orbital velocity, and is the radius in the CPD. The stopping time is
| (15) |
where is the grain size, is the gas density, is the material density of the dust grains, and is the thermal velocity of the gas: (8/ where is the speed of sound. The parameter is
| (16) |
and is the power law exponent of the radial pressure gradient (Armitage 2010). We extract the gas density , sound speed , and pressure gradient from our disk models to consistently determine the grain drift velocities for a grain material density g cm-3. The Epstein regime is valid where the dust particle size where is the mean free path of the gas particles. In the inner CPD the gas density is sufficiently high that this condition can be violated. For the high-mass CPD this occurs inside of the orbit of Callisto and for the low-mass CPD inside of the orbit of Europa for grains less than 1 cm in size, in which case we transition to the Stokes regime and calculate the drift velocities accordingly (Weidenschilling 1977).
We adopted several simplifying assumptions regarding the radial velocity structure of the gas. The centrifugal radius of the CPD is the orbital radius at which the specific angular momentum is equal to the average of the infalling material and where solid material is accreted onto the CPD (Canup & Ward 2002; Sasaki et al. 2010). In the case of a Jupiter-mass planet this lies near the orbit of Callisto. Rather than accreting at precisely this radius infalling matter have some intrinsic spread in angular momentum (Machida et al. 2008). We adopted the prescription of Mitchell & Stewart 2011 that material will accrete between 16-28 RJ. The gas falling onto the CPD at will viscously spread radially away from where it is accreted (Pringle 1981). Hence interior to gas flows towards the planet and exterior to it will flow outwards. Recently it has been proposed that to effectively trap dust and allow for planetesimal growth within the CPD, gas may indeed need to flow predominantly away from the planet and thus form a decretion disk (Batygin & Morbidelli 2020).
In our high viscosity models, a parcel of gas that accretes onto the CPD near and flows outwards must travel au within yr to be consistent with and thus has a mean outwards radial velocity on the order of 1 m s-1. For our low viscosity case m s-1.
3 Results
In our reference model grid (Table 4) we considered the case of a higher mass, optically thick CPD ( M⊙), and lower mass, optically thin CPD ( M⊙) both with . For each unique mass we considered viscous timescales of and yr. For each of the four resulting CPDs we tested two initial compositions: of chemical inheritance and reset, for a total of eight models.
3.1 Timescales of ice formation
In the following section we discuss by which pathways and at what rate water (ice) formation occurs in a chemically reset CPD. Thereafter we contrast these results with that of the CPDs which inherit an initial chemical composition from the circumstellar disk.
3.1.1 Reset

In our “reset” scenario the species initially present are exclusively atomic (with the exception of PAHs) and singly or doubly ionized. All hydrogen is initially present in the form of H+. The reset case is characterized by the formation of ice where it is stable against desorption. Ice formation is suppressed in the innermost region of the CPD due to dust temperatures in excess of 160-180 K. In the outer region of the CPD ice formation is suppressed by the low optical depths and correspondingly high intensity of background radiation which causes ices to photodesorb. Between these two boundaries ices begin to form
The freeze-out occurs step-wise, with two characteristic timescales on which ice formation proceeds. The rate of water ice formation at different disk radii as a function of time is shown in Fig. 5. Within yr the first step is completed. This initial, rapid water formation occurs primarily via a path that begins with a three-body recombination reaction important at temperatures below 2800 K (Hidaka et al. 1982; Tsang & Hampson 1986),
| (17) |
where the third body M = H, H2, or He, and to a lesser extent by H + O OH + photon. The water then forms by radiative association of the OH with free hydrogen;
| (18) |
after which it adsorbs to a grain. Water formation via the reactions 17 and 18 remains proportional to the declining abundance of free H and ends when it is depleted around yr. Typically half of the maximum possible amount of water ice that could form is produced during this stage.
The first stage of water ice formation proceeds inside-out as a result of the strong density-dependence of the collider reaction. The second stage proceeds outside-in due to the pathway’s dependence on intermediate species produced by photo-reactions. This can be seen in Fig. 5 where the inner disk formation rate (red lines) is initially higher while later the outer disk rate (blue lines) is relatively higher. At this lower rate of formation the total mass of water ice doubles at the midplane within Myr, approximately half of which forms by
| (19) |
near the snowline. The second stage of ice formation also involves the freezing-out of NH3 and other more volatiles species. We find that the relatively unstable NH2 exists in abundance at such high densities ( cm-3) due to the three-body reaction N + H2 + M NH2 + M. Although the reaction rate has been experimentally determined = 10-26 cm6 s-1 (Avramenko & Krasnen’kov 1966), it has been noted as being in need of revisiting due to its importance in water formation via NH2 + O NH + OH (Kamp et al. 2017). We have adopted a rate more typical of collider reactions (10-30 cm6 s-1), which still produces enough NH2 for this path to play an important role. The other half of water ice is formed via the more “classical” route
| (20) |
and in the outermost part of the disk where water ice is stable via
| (21) |
In the high-mass CPDs water ice formation is typically still ongoing by the end of the viscous timescale, and so the midplane ice abundance is not able to converge to the level seen in steady-state within the viscous timescale.
3.1.2 Inheritance
The evolution of the inheritance case is characterized by the desorption of ices in regions where they are not stable against thermal or photo-desorption. Where water ice is stable very little additional water formation occurs within the viscous timescale.
Icy grains interior to the snowline sublimate typically within yr, and a “snowline” (water iceline) is clearly established. In some cases the snowline can take longer to stabilize, shifting outwards over time, and sometimes continues to evolve radially for up to yr. This is notable in the (8-11) CPD where the snowline moves from 0.01 RH at yr to 0.03 RH after yr. In practice this implies that there exists a radial span in which the composition of radially drifting icy grains does not immediately begin to reflect the ambient conditions. This is discussed in Sect. 4.2.
In the outer optically thin region of the CPDs, ices are also lost to photodesorption although the process is slower than the thermal desorption occurring in the inner disk. Desorption in this area is typically complete within yr and has not always reached steady-state by the end of the viscous timescale.


3.2 The midplane ice mass fraction
While water ice can form efficiently in chemically reset CPDs, the final of the solids depends strongly on the total dust mass in the midplane. We explore the role of the global ratio in the reset and inheritance cases in Appendix H, Fig. 17. A canonical dust-to-gas ratio of produces at most grains with an ice mass fraction of and is nowhere consistent with the composition of the icy Galilean satellites. In contrast a dust-to-gas ratio of results in solids with both above and below the maximum Galilean for the high and low-mass CPDs, respectively. Hereafter the global dust-to-gas ratio of is considered in discussions of the four reference CPDs.
We show the state of the radial ice mass fraction for the CPDs with on their respective viscous timescales to allow for direct comparison between the inheritance and reset cases in Fig.6. For completeness we include the results where grain-surface chemical reactions are utilized.
The midplane is also dependent on the degree of dust sedimentation (settling). A general feature of the profiles is an inner maximal peak at the snowline followed by a decline towards the outer edge of the disk. As dust settling is more efficient at larger radii, reduces accordingly with increasing radius. Settling of dust to the midplane is counteracted by stochastic advection by turbulent eddies in the gas. We assume that the value of turbulent- used to determine the degree of settling is equal to the global viscous used to determine the heating rate by viscous dissipation. In the low viscosity CPDs (7-11) and (8-12) dust settling towards the midplane is thus proportionally enhanced. In the low-viscosity cases the dust density is enhanced in the midplane minimally by a factor over the global d/g, increasing to a factor 20 at R. As the degree of settling is also dependent on the adopted surface density power law exponent we explore the impact of deviation from the assumed in Appendix C. Given that we have no reason to believe this value will depart significantly from the range 1.0-1.3, the resulting in the inner disk should differ from our reference result by no more than 25-30 interior to the ammonia iceline at 70 K.
In general the high-mass chemically reset CPDs (7-10) and (7-11) are not able to converge entirely towards a steady-state ice abundance in either the “fast” ( yr) or “slow” ( yr) viscous timescales as gas-phase CO is more stable and contains a relatively larger fraction of the total oxygen budget for longer. As a result chemically reset CPDs contain on average less water ice than those which inherit their ices from the circumstellar disk. In contrast, the low-mass chemically reset CPDs (8-11) and (8-12) are able to converge towards the ice abundances seen in the inheritance cases within 100 yr.

The role of surface chemistry
The duration of the initial stage in which water formation is rapid is dependent on the availability of atomic H. When H2 formation is complete this stage ends. The formation of H2 is treated differently with the inclusion of grain surface chemistry. When the chemistry is limited to gas-phase reactions and direct adsorption/desorption only, H2 formation proceeds via the analytic rate determined by Cazaux & Tielens 2002. When surface chemistry is included H2 formation is instead modeled explicitly via reactions involving hydrogenated PAHs (H-PAH) (Boschman et al. 2012; Thi et al. 2020a).
A chemical reset poses a scenario in which H2 and H2O formation occur simultaneously. The analytic rate of Cazaux & Tielens 2002 presupposes that chemisorbed H plays a role in H2 formation on silicate or carbonaceous surfaces, in which H goes through an intermediate stage of being chemically, rather than physically, bound to the grain surface. We find that prior to atomic H depletion several (¿3) monolayers of H2O have formed on the average sized grain. The formation of H2 via chemisorbed H should thus be suppressed in these regions as the water layers prevent H atoms from chemisorbing to the grain surface (Wakelam et al. 2017). In the absence of chemisorbed H, H2 formation on dust is strongly reduced and H2 formation proceeds primarily via H-PAH. The H2 formation rate under these conditions is less efficient than the analytic rate from (Cazaux & Tielens 2002) near the inner edge of the snowline at 150-170 K. The relatively slower formation of H2 and the resulting prolonged availability of atomic H results in a increase in water ice abundance interior to the NH3 iceline prior to and hence narrows the gap between the inheritance and reset cases in this region. Water ice formation in the inner disk is further enhanced by the inclusion of O2H in the surface chemistry network. Gas-phase three-body reactions with O2 produce O2H which in turn lead to early OH formation. The gas-phase O2 reservoir is thus depleted and efficiently converted via OH into H2O via the three-body reaction
| (22) |
with rates adopted from UMIST2006 Atkinson et al. 2004; Woodall et al. 2007, which is highly efficient at the densities in the CPD, and thereafter
| (23) |
| (24) |
In the outer disk the ice mass fraction can be enhanced relative to the gas-phase chemical network as the freezing-out of more volatile species is facilitated by grain surface reactions. CO2 ice is readily formed on the surface via OH + CO CO2 + H (Oba et al. 2010; Liu & Sander 2015) for which we adopt an effective barrier of 150 K (Fulle et al. 1996; Ruaud et al. 2016). The formation of carbon bearing ices begins to significantly influence the of the chemically reset CPDs only after 103 yr and hence the effect on the high-viscosity CPDs with yr is less pronounced. The formation and composition of these ice impurities will be discussed in detail in an accompanying work (Oberg et al. in prep).


3.3 Grain drift vs. adsorption and desorption
We calculated the velocity of radially drifting grains in the four reference CPDs and showcase the results for the high-mass high-viscosity CPD (7-10) in Fig. 7. We solved for the total time it takes grains of several sizes to reach the inner disk edge. The resulting timescale of grain drift can be seen in Fig. 8 which shows the time for a grain deposited at radius to reach the CPD inner edge. Grains which become trapped are not included in Fig. 8, as they do not reach the disk inner edge. The regions where thermal desorption, ice formation, and photodesorption predominantly shape grain mantle composition, as well as their respective timescales, are indicated in the figure. These are the timescales with which grain drift competes.
The regions have been defined as follows: the “thermal desorption region” is found interior to the snowline where inherited, initially icy grains lose their icy mantles within the viscous timescale. The “snow border” is the region where the reset and inheritance cases are not able to converge towards a common snowline within yr. Grains here are able to retain their icy mantles but no significant additional ice adsorption occurs. The “ice formation region” is where water begins to adsorb to grains after the CPD has been chemically reset. The “photodesorption region” is the optically thin region exterior to the snowline where inherited grains eventually lose their icy mantles within yr at most.
We focus on grains of size mm as the adsorption and desorption timescales derived in Sect. 3.1 have only been derived with the thermochemical disk model for grains up to this size. In most cases the grain drift timescale is longer than the timescales of thermal desorption and the timescale of rapid ice formation. The composition of grains will thus correspond to the profiles derived in Sect. 3 except in the case of the low-mass, high-viscosity CPD (8-11). In this CPD icy grains can cross into the ”thermal desorption region” but only begin desorbing once they approach the position of Europa.
Dust traps
It is clear from Fig.7 that in a decreting CPD dust traps are present. Grains deposited near the centrifugal radius drift outwards with the gas until the force of radial advection is balanced by the loss of orbital energy from drag against gas orbiting at sub-Keplerian velocity. Trapped grains thus become radially segregated by size, with smaller grains drifting to the outer edge of the trap and larger grains remaining near the inner edge. In the high-mass high-viscosity CPD (7-10) grains 0.1-1 mm in size become trapped near 0.1-0.2 RH. Grains smaller than 0.05 mm advect with the gas and are able to reach the outermost stable orbit at R where they would be eventually lost to e.g. tidal stripping.
In general the dust traps are spatially coincident with the ice formation region and in the lower-mass CPDs also partially with the photodesorption region. Hence continued ice deposition on trapped grains could facilitate grain growth. This phenomena is discussed further in appendix Sect. F.
4 Discussion
We set out to explore the process of ice formation in CPDs with relatively short viscous timescales to constrain their physical, chemical, and dynamical properties. We find that even if infalling gas and ice is fully atomized, re-freezing proceeds quickly in the CPD and solids reach an by for an appropriate midplane dust-to-gas ratio. The midplane ice abundance at is generally insensitive to the initial chemical conditions. Only in the inner disk ( RH) of the high-mass CPDs is ice formation too slow for the reset and inheritance cases to converge. With our standard chemical network the efficiency of water production in this region is closely tied to the availability of atomic H and thus to the H2 formation rate, which is not well constrained in these conditions. The three-body reaction H + O + M OH + M is also critical to the process. For this reaction we have adopted the rate coefficients listed in UMIST2006 (Woodall et al. 2007), the value of which originates from a recommendation of Tsang & Hampson 1986 who noted that literature values represented only rough estimates and suggested a factor 10 uncertainty (Baulch 1972; Day et al. 1973). More recent estimates of this rate at high temperatures (¿ 3000 K) suggest this value is accurate to within 40 (Javoy et al. 2003), but modern low temperature measurements remain desirable. In our expanded grain-surface chemical network, gas-phase O2H plays an important role in accelerating OH formation in the inner disk, diverting atomic oxygen into water rather than O2.
4.1 Constraints on CPD properties
For reasonable assumptions regarding the properties of the CPD the snowline can fall very near the present-day position of Europa. The CPD with mass M⊙ ( MJ), and matches best the compositional gradient of the Galilean moons at their present-day orbits. While this seems like a promising outcome, we emphasize that both inwards gas-driven migration (Canup & Ward 2002; Madeira et al. 2021) and long-term outwards tidally-driven migration (Yoder 1979; Tittemore 1990; Showman & Malhotra 1997; Lari et al. 2020) have potentially played a role in repositioning the satellites both during and post-formation. Other regions of the CPD parameter space are equally capable of producing solids with , but vary in the position of their snowline. In any case, we believe that it is more meaningful to determine whether a particular CPD can form enough ice on the relevant viscous timescale, rather than at precisely which radii a particular abundance of ice can be found.
To produce solids with a minimum the global dust-to-gas ratio of the CPD must be and does not need to be . We suggest that this does not represent a minimum limit as imperfect accretion (Dwyer et al. 2013), (hydrodynamic) proto-atmospheric escape (Kuramoto & Matsui 1994; Bierson & Nimmo 2020), impact-vaporization (Nimmo & Korycansky 2012), or tidal heating (Canup & Ward 2009) may all have played a role in reducing the volatile mass of the satellites either during or post-accretion. A minimum is instead implied by the minimum time required to accrete the solid total mass of the Galilean satellites ( M⊙) into the CPD. We consider the lifetime of the gaseous circumstellar disk ( Myr) to be the maximum time over which the CPD can continue to accrete gas. Assuming Jupiter’s runaway accretion ended Myr after CAI formation (Weiss & Bottke 2021) and that moon formation only began at this stage, this leaves 6 Myr to accrete the refractory material for the moons. We emphasize that this limit is very approximate, as it is possible that circumstellar gas disk lifetimes regularly exceed 10 Myr (Pfalzner et al. 2014). Conversely an even shorter lifetime ( Myr after CAI formation) has been proposed for the solar nebula on the basis of paleomagnetic measurements (Weiss & Bottke 2021).
The midplane dust-to-gas ratio and thus the in the CPD will differ from what has been derived from our models if the grain size distribution is significantly altered in some way. The circumstellar disk gap edge may filter out larger grains from the accretion flow (Rice et al. 2006; Zhu et al. 2012). Grains larger than 100 µm, which settle efficiently, are those primarily responsible for enhancement of the dust mass at the CPD midplane. Massive planets may however vertically stir circumstellar disk midplane dust outside the gap (Binkert et al. 2021). Szulágyi et al. 2022 found that significant vertical stirring of large grains occurs at the gap outer wall in the presence of planets with mass above that of Saturn, resulting in a substantial delivery of mm-sized grains to the CPD. The high-mass tail of the dust distribution could alternatively be depleted by the more rapid inwards drift of these grains in the CPD. We have shown that grains larger than mm no longer advect with the gas in the CPD. The steady-state dust grain size distribution will thus likely be truncated. In the absence of these grains the limits we have derived on the CPD mass are revised upwards by a factor .
4.2 Does grain drift erase the radial distribution of ices?
We have tested only the ”gas-starved” disk paradigm in which a CPD must over time accrete the solids to form large moons. The sequential formation, episodic growth, and potential loss of migrating moons is a characteristic of this theory (Canup & Ward 2002). In such a dynamical environment the relevancy of the instantaneous radial distribution of icy grains remains to be established. The simplest way in which the chemical properties of dust in the CPD could be imprinted on the final satellite system would be through in-situ formation: the satellites accrete the bulk of their material at fixed radial positions in the CPD (Ronnet et al. 2017). This might occur if the innermost proto-moon were prevented from migrating into Jupiter by the presence of a gas-free magnetically-truncated inner cavity (Takata & Stevenson 1996; Batygin 2018; Shibaike et al. 2019). Additional proto-satellites could then pile-up in a resonant chain and be stabilized against further migration by the proto-moon anchored at the disk inner edge (Ogihara & Ida 2009; Sasaki et al. 2010; Izidoro et al. 2017; Madeira et al. 2021). Drifting grains would still be free to cross the orbit of proto-moons as accretion efficiency remains low when the proto-moons are only a fraction of their final mass (Shibaike et al. 2019). In this paradigm proto-moons at relatively fixed positions, continually accreting grains that drift into their feeding-zone (Ronnet & Johansen 2020). We find that the ice fraction of small (¡ 1 cm) drifting grains in the inner disk will almost always reflect ambient conditions (Sect. 3.3) independently of whether the gas in the CPD flows radially inwards or outwards (the fate of trapped grains is discussed in Appendix F). If the proto-moons (resonantly anchored at fixed radii within the CPD) accrete the majority of their total mass from these drifting grains, their bulk ice fraction would reflect the temperature gradient of the CPD.
5 Conclusions
Circumplanetary disks represent a unique chemical environment characterized by high-densities and a relatively short timescale on which gas and dust are viscously or aerodynamically lost. We aimed to explore the process of ice formation in this environment from sharply contrasting initial chemical conditions, knowing that solids with ice/rock must be able to form within the viscous timescale of a Jovian CPD. We tested the paradigm in which solids are delivered directly from the circumstellar disk in the form of small grains (¡ 1 cm) to a ”gas-starved”, relatively low-mass CPD. We highlight our key conclusions as follows:
If infalling material is chemically reset:
- 1.
High densities in the CPD facilitate three-body “collider” reactions that lead to rapid water ice formation. Roughly half of the water ice is formed within a single year by the hydrogenation of OH.
- 2.
Solids with the ice fraction of Ganymede or Callisto are produced within for if the midplane is depleted in dust by a factor 20-50 relative to the canonical .
If chemical inheritance occurs:
- 1.
Ices near the planet efficiently sublimate and establish a snowline at a similar location to that of the reset case within . Additional ice formation is minimal.
In either case:
- 1.
Icy circumstellar dust grains preserve the majority of their volatile content during gap-crossing if accreted onto the CPD within 100 yr unless the stellar luminosity is L⊙.
- 2.
The compositional imprint of the CPD temperature profile is not erased by radial dust drift for grains of size cm.
- 3.
Only the “high-mass” CPDs ( = 10-4 MJ) are sensitive to the initial chemical conditions: water ice formation in the inner disk is less efficient if a chemical reset occurs as oxygen tends to remain locked in the gas-phase CO.
In our solar system icy moons are common. No matter whether or not ices sublimate upon incorporation into the CPD, we have demonstrated that ices can be efficiently re-deposited onto dust grains and enable the general ubiquity of icy moons.
Acknowledgements.
The research of N.O. and I.K. is supported by grants from the Netherlands Organization for Scientific Research (NWO, grant number 614.001.552) and the Netherlands Research School for Astronomy (NOVA). ”This research has made use of NASA’s Astrophysics Data System Bibliographic Services. This research has made extensive use of Numpy (Harris et al. 2020), Matplotlib (Hunter 2007), scipy (Virtanen et al. 2020), and prodimopy https://gitlab.astro.rug.nl/prodimo/prodimopy. The authors would like to thank the anonymous referee for comments that contributed to the accuracy, clarity, and focus of this work.References
- Adams (2010) Adams, F. C. 2010, Annual Review of Astronomy and Astrophysics, 48, 47
- Alibert et al. (2005) Alibert, Y., Mousis, O., & Benz, W. 2005, A&A, 439, 1205
- Ansdell et al. (2018) Ansdell, M., Williams, J. P., Trapman, L., et al. 2018, ApJ, 859, 21
- Aota et al. (2015) Aota, T., Inoue, T., & Aikawa, Y. 2015, ApJ, 799, 141
- Aoyama et al. (2018) Aoyama, Y., Ikoma, M., & Tanigawa, T. 2018, ApJ, 866, 84
- Armitage (2007) Armitage, P. J. 2007, arXiv e-prints, astro
- Armitage (2010) Armitage, P. J. 2010, Astrophysics of Planet Formation
- Atkinson et al. (2004) Atkinson, R., Baulch, D. L., Cox, R. A., et al. 2004, Atmospheric Chemistry and Physics, 4, 1461
- Auer (1984) Auer, L. 1984, in Numerical Radiative Transfer, ed. W. Kalkhofen (Cambridge Univ. Press, Cambridge), 101
- Avramenko & Krasnen’kov (1966) Avramenko, L. I. & Krasnen’kov, V. M. 1966, Bulletin of the Academy of Sciences of the USSR, Division of chemical science, 15, 394
- Ayliffe & Bate (2009) Ayliffe, B. A. & Bate, M. R. 2009, Monthly Notices of the Royal Astronomical Society, 397, 657
- Balbus (2003) Balbus, S. A. 2003, ARA&A, 41, 555
- Balbus & Hawley (1991) Balbus, S. A. & Hawley, J. F. 1991, ApJ, 376, 214
- Batygin (2018) Batygin, K. 2018, AJ, 155, 178
- Batygin & Morbidelli (2020) Batygin, K. & Morbidelli, A. 2020, ApJ, 894, 143
- Baulch (1972) Baulch, D. L. 1972, Evaluated kinetic data for high temperature reactions
- Bierson & Nimmo (2020) Bierson, C. J. & Nimmo, F. 2020, The Astrophysical Journal, 897, L43
- Bierson & Steinbrügge (2021) Bierson, C. J. & Steinbrügge, G. 2021, The Planetary Science Journal, 2, 89
- Binkert et al. (2021) Binkert, F., Szulágyi, J., & Birnstiel, T. 2021, Monthly Notices of the Royal Astronomical Society, 506, 5969
- Birnstiel et al. (2012) Birnstiel, T., Klahr, H., & Ercolano, B. 2012, A&A, 539, A148
- Boschman et al. (2012) Boschman, L., Reitsma, G., Cazaux, S., et al. 2012, ApJ, 761, L33
- Bosman et al. (2019) Bosman, A. D., Cridland, A. J., & Miguel, Y. 2019, A&A, 632, L11
- Brown & Bolina (2006) Brown, W. A. & Bolina, A. S. 2006, Monthly Notices of the Royal Astronomical Society, 374, 1006
- Canup & Ward (2002) Canup, R. M. & Ward, W. R. 2002, AJ, 124, 3404
- Canup & Ward (2009) Canup, R. M. & Ward, W. R. 2009, Origin of Europa and the Galilean Satellites, ed. R. T. Pappalardo, W. B. McKinnon, & K. K. Khurana, 59
- Cazaux & Tielens (2002) Cazaux, S. & Tielens, A. G. G. M. 2002, ApJ, 575, L29
- Christiaens et al. (2019) Christiaens, V., Cantalloube, F., Casassus, S., et al. 2019, ApJ, 877, L33
- Collings et al. (2004) Collings, M. P., Anderson, M. A., Chen, R., et al. 2004, Monthly Notices of the Royal Astronomical Society, 354, 1133
- D’Alessio et al. (1998) D’Alessio, P., Cantö, J., Calvet, N., & Lizano, S. 1998, ApJ, 500, 411
- D’Angelo et al. (2002) D’Angelo, G., Henning, T., & Kley, W. 2002, A&A, 385, 647
- Day et al. (1973) Day, M., Thompson, K., & Dixon-Lewis, G. 1973, Symposium (International) on Combustion, 14, 47
- de Pater & Lissauer (2010) de Pater, I. & Lissauer, J. J. 2010, Planetary Sciences
- Draine & Bertoldi (1996) Draine, B. T. & Bertoldi, F. 1996, ApJ, 468, 269
- Drążkowska & Szulágyi (2018) Drążkowska, J. & Szulágyi, J. 2018, ApJ, 866, 142
- Dubrulle et al. (1995) Dubrulle, B., Morfill, G., & Sterzik, M. 1995, Icarus, 114, 237
- Dwyer et al. (2013) Dwyer, C. A., Nimmo, F., Ogihara, M., & Ida, S. 2013, Icarus, 225, 390
- Fujii et al. (2014) Fujii, Y. I., Okuzumi, S., Tanigawa, T., & Inutsuka, S.-i. 2014, ApJ, 785, 101
- Fulle et al. (1996) Fulle, D., Hamann, H. F., Hippler, H., & Troe, J. 1996, The Journal of Chemical Physics, 105, 983
- Garrod & Herbst (2006) Garrod, R. T. & Herbst, E. 2006, A&A, 457, 927
- Gressel et al. (2013) Gressel, O., Nelson, R. P., Turner, N. J., & Ziegler, U. 2013, ApJ, 779, 59
- Haffert et al. (2019) Haffert, S. Y., Bohn, A. J., de Boer, J., et al. 2019, Nature Astronomy, 3, 749
- Harris et al. (2020) Harris, C. R., Millman, K. J., van der Walt, S. J., et al. 2020, Nature, 585, 357
- Hasegawa & Herbst (1993) Hasegawa, T. I. & Herbst, E. 1993, MNRAS, 261, 83
- Hasegawa et al. (1992) Hasegawa, T. I., Herbst, E., & Leung, C. M. 1992, ApJS, 82, 167
- Hawley et al. (1995) Hawley, J. F., Gammie, C. F., & Balbus, S. A. 1995, ApJ, 440, 742
- Hayashi (1981) Hayashi, C. 1981, Progress of Theoretical Physics Supplement, 70, 35
- Heinzeller et al. (2011) Heinzeller, D., Nomura, H., Walsh, C., & Millar, T. J. 2011, The Astrophysical Journal, 731, 115
- Helling et al. (2014) Helling, C., Woitke, P., Rimmer, P. B., et al. 2014, Life, 4, 142
- Hidaka et al. (1982) Hidaka, Y., Takahashi, S., Kawano, H., Suga, M., & Gardiner, W. C. 1982, The Journal of Physical Chemistry, 86, 1429
- Hubickyj et al. (2005) Hubickyj, O., Bodenheimer, P., & Lissauer, J. J. 2005, Icarus, 179, 415
- Hunter (2007) Hunter, J. D. 2007, Computing in Science & Engineering, 9, 90
- Izidoro et al. (2017) Izidoro, A., Ogihara, M., Raymond, S. N., et al. 2017, MNRAS, 470, 1750
- Javoy et al. (2003) Javoy, S., Naudet, V., Abid, S., & Paillard, C. 2003, Experimental Thermal and Fluid Science, 27, 371
- Kamp et al. (2017) Kamp, I., Thi, W. F., Woitke, P., et al. 2017, A&A, 607, A41
- Kamp et al. (2010) Kamp, I., Tilling, I., Woitke, P., Thi, W. F., & Hogerheijde, M. 2010, Astronomy and Astrophysics, 510, A18
- Kanagawa et al. (2016) Kanagawa, K. D., Muto, T., Tanaka, H., et al. 2016, PASJ, 68, 43
- Keppler et al. (2018) Keppler, M., Benisty, M., Müller, A., et al. 2018, A&A, 617, A44
- Kley (1999) Kley, W. 1999, MNRAS, 303, 696
- Kruijer et al. (2017) Kruijer, T. S., Burkhardt, C., Budde, G., & Kleine, T. 2017, Proceedings of the National Academy of Sciences, 114, 6712
- Kuramoto & Matsui (1994) Kuramoto, K. & Matsui, T. 1994, Journal of Geophysical Research: Planets, 99, 21183
- Kuskov & Kronrod (2005) Kuskov, O. L. & Kronrod, V. A. 2005, Icarus, 177, 550
- Lari et al. (2020) Lari, G., Saillenfest, M., & Fenucci, M. 2020, A&A, 639, A40
- Liu & Sander (2015) Liu, Y. & Sander, S. 2015, The journal of physical chemistry. A, 119
- Lodders (2003) Lodders, K. 2003, The Astrophysical Journal, 591, 1220
- Lubow et al. (1999) Lubow, S. H., Seibert, M., & Artymowicz, P. 1999, ApJ, 526, 1001
- Lunine & Stevenson (1982) Lunine, J. I. & Stevenson, D. J. 1982, Icarus, 52, 14
- Machida et al. (2008) Machida, M. N., Kokubo, E., Inutsuka, S.-i., & Matsumoto, T. 2008, ApJ, 685, 1220
- Madeira et al. (2021) Madeira, G., Izidoro, A., & Giuliatti Winter, S. M. 2021, MNRAS, 504, 1854
- Marley et al. (2007) Marley, M. S., Fortney, J. J., Hubickyj, O., Bodenheimer, P., & Lissauer, J. J. 2007, ApJ, 655, 541
- Martin & Lubow (2011) Martin, R. G. & Lubow, S. H. 2011, MNRAS, 413, 1447
- McElroy et al. (2013) McElroy, D., Walsh, C., Markwick, A. J., et al. 2013, A&A, 550, A36
- McKinnon (1997) McKinnon, W. B. 1997, Icarus, 130, 540
- Min et al. (2011) Min, M., Dullemond, C. P., Kama, M., & Dominik, C. 2011, Icarus, 212, 416
- Mitchell & Stewart (2011) Mitchell, T. R. & Stewart, G. R. 2011, AJ, 142, 168
- Morbidelli et al. (2014a) Morbidelli, A., Szulágyi, J., Crida, A., et al. 2014a, Icarus, 232, 266
- Morbidelli et al. (2014b) Morbidelli, A., Szulágyi, J., Crida, A., et al. 2014b, Icarus, 232, 266
- Mousis & Alibert (2006) Mousis, O. & Alibert, Y. 2006, A&A, 448, 771
- Nimmo & Korycansky (2012) Nimmo, F. & Korycansky, D. 2012, Icarus, 219, 508
- Oba et al. (2010) Oba, Y., Watanabe, N., Kouchi, A., Hama, T., & Pirronello, V. 2010, The Astrophysical Journal, 712, L174
- Öberg et al. (2009) Öberg, K. I., Garrod, R. T., van Dishoeck, E. F., & Linnartz, H. 2009, A&A, 504, 891
- Öberg & Wordsworth (2019) Öberg, K. I. & Wordsworth, R. 2019, AJ, 158, 194
- Oberg et al. (2020) Oberg, N., Kamp, I., Cazaux, S., & Rab, C. 2020, A&A, 638, A135
- Ogihara & Ida (2009) Ogihara, M. & Ida, S. 2009, ApJ, 699, 824
- Pfalzner (2013) Pfalzner, S. 2013, A&A, 549, A82
- Pfalzner et al. (2014) Pfalzner, S., Steinhausen, M., & Menten, K. 2014, ApJ, 793, L34
- Pinilla et al. (2013) Pinilla, P., Birnstiel, T., Benisty, M., et al. 2013, A&A, 554, A95
- Pinte et al. (2009) Pinte, C., Harries, T. J., Min, M., et al. 2009, A&A, 498, 967
- Portegies Zwart (2019) Portegies Zwart, S. 2019, A&A, 622, A69
- Portilla-Revelo et al. (2022) Portilla-Revelo, B., Kamp, I., Rab, C., et al. 2022, A&A, 658, A89
- Pringle (1981) Pringle, J. E. 1981, ARA&A, 19, 137
- Quillen & Trilling (1998) Quillen, A. C. & Trilling, D. E. 1998, ApJ, 508, 707
- Rab et al. (2019) Rab, C., Kamp, I., Ginski, C., et al. 2019, A&A, 624, A16
- Rafikov (2017) Rafikov, R. R. 2017, ApJ, 837, 163
- Rice et al. (2006) Rice, W. K. M., Armitage, P. J., Wood, K., & Lodato, G. 2006, MNRAS, 373, 1619
- Rivier et al. (2012) Rivier, G., Crida, A., Morbidelli, A., & Brouet, Y. 2012, A&A, 548, A116
- Röllig et al. (2007) Röllig, M., Abel, N. P., Bell, T., et al. 2007, A&A, 467, 187
- Ronnet & Johansen (2020) Ronnet, T. & Johansen, A. 2020, A&A, 633, A93
- Ronnet et al. (2017) Ronnet, T., Mousis, O., & Vernazza, P. 2017, ApJ, 845, 92
- Ruaud et al. (2016) Ruaud, M., Wakelam, V., & Hersant, F. 2016, MNRAS, 459, 3756
- Ruffle et al. (1999) Ruffle, D. P., Hartquist, T. W., Caselli, P., & Williams, D. A. 1999, MNRAS, 306, 691
- Sakai et al. (2010) Sakai, N., Saruwatari, O., Sakai, T., Takano, S., & Yamamoto, S. 2010, A&A, 512, A31
- Sasaki et al. (2010) Sasaki, T., Stewart, G. R., & Ida, S. 2010, ApJ, 714, 1052
- Schubert et al. (2004) Schubert, G., Anderson, J. D., Spohn, T., & McKinnon, W. B. 2004, Interior composition, structure and dynamics of the Galilean satellites, ed. F. Bagenal, T. E. Dowling, & W. B. McKinnon, 281–306
- Schulik et al. (2020) Schulik, M., Johansen, A., Bitsch, B., Lega, E., & Lambrechts, M. 2020, A&A, 642, A187
- Shakura & Sunyaev (1973) Shakura, N. I. & Sunyaev, R. A. 1973, A&A, 24, 337
- Shibaike et al. (2017) Shibaike, Y., Okuzumi, S., Sasaki, T., & Ida, S. 2017, ApJ, 846, 81
- Shibaike et al. (2019) Shibaike, Y., Ormel, C. W., Ida, S., Okuzumi, S., & Sasaki, T. 2019, ApJ, 885, 79
- Showman & Malhotra (1997) Showman, A. P. & Malhotra, R. 1997, Icarus, 127, 93
- Siess et al. (2000a) Siess, L., Dufour, E., & Forestini, M. 2000a, A&A, 358, 593
- Siess et al. (2000b) Siess, L., Dufour, E., & Forestini, M. 2000b, A&A, 358, 593
- Smith et al. (2004) Smith, I. W. M., Herbst, E., & Chang, Q. 2004, Monthly Notices of the Royal Astronomical Society, 350, 323
- Sohl et al. (2002) Sohl, F., Spohn, T., Breuer, D., & Nagel, K. 2002, Icarus, 157, 104
- Spiegel & Burrows (2012) Spiegel, D. S. & Burrows, A. 2012, ApJ, 745, 174
- Suutarinen et al. (2011) Suutarinen, A., Geppert, W. D., Harju, J., et al. 2011, A&A, 531, A121
- Szulágyi (2017) Szulágyi, J. 2017, The Astrophysical Journal, 842, 103
- Szulágyi et al. (2022) Szulágyi, J., Binkert, F., & Surville, C. 2022, ApJ, 924, 1
- Szulágyi et al. (2016) Szulágyi, J., Masset, F., Lega, E., et al. 2016, MNRAS, 460, 2853
- Szulágyi et al. (2014) Szulágyi, J., Morbidelli, A., Crida, A., & Masset, F. 2014, ApJ, 782, 65
- Szulágyi & Mordasini (2017) Szulágyi, J. & Mordasini, C. 2017, MNRAS, 465, L64
- Takata & Stevenson (1996) Takata, T. & Stevenson, D. J. 1996, Icarus, 123, 404
- Tanigawa et al. (2012) Tanigawa, T., Ohtsuki, K., & Machida, M. N. 2012, ApJ, 747, 47
- Teague et al. (2019) Teague, R., Bae, J., & Bergin, E. A. 2019, Nature, 574, 378
- Thanathibodee et al. (2019) Thanathibodee, T., Calvet, N., Bae, J., Muzerolle, J., & Hernández, R. F. 2019, ApJ, 885, 94
- Thi et al. (2018) Thi, W. F., Hocuk, S., Kamp, I., et al. 2018, arXiv e-prints, arXiv:1812.06730
- Thi et al. (2020a) Thi, W. F., Hocuk, S., Kamp, I., et al. 2020a, A&A, 634, A42
- Thi et al. (2020b) Thi, W. F., Hocuk, S., Kamp, I., et al. 2020b, A&A, 635, A16
- Thi et al. (2011) Thi, W. F., Woitke, P., & Kamp, I. 2011, Monthly Notices of the Royal Astronomical Society, 412, 711
- Tielens (2021) Tielens, A. 2021, Molecular Astrophysics (Cambridge University Press)
- Tittemore (1990) Tittemore, W. C. 1990, Science, 250, 263
- Tsang & Hampson (1986) Tsang, W. & Hampson, R. F. 1986, Journal of Physical and Chemical Reference Data, 15, 1087
- Turner et al. (2012) Turner, N. J., Choukroun, M., Castillo-Rogez, J., & Bryden, G. 2012, ApJ, 748, 92
- Villenave et al. (2022) Villenave, M., Stapelfeldt, K. R., Duchêne, G., et al. 2022, ApJ, 930, 11
- Virtanen et al. (2020) Virtanen, P., Gommers, R., Oliphant, T. E., et al. 2020, Nature Methods, 17, 261
- Wagner et al. (2018) Wagner, K., Follete, K. B., Close, L. M., et al. 2018, ApJ, 863, L8
- Wakelam et al. (2017) Wakelam, V., Bron, E., Cazaux, S., et al. 2017, Molecular Astrophysics, 9, 1
- Walsh et al. (2009) Walsh, C., Harada, N., Herbst, E., & Millar, T. J. 2009, ApJ, 700, 752
- Weidenschilling (1977) Weidenschilling, S. J. 1977, MNRAS, 180, 57
- Weiss & Bottke (2021) Weiss, B. P. & Bottke, W. F. 2021, AGU Advances, 2
- Woitke et al. (1993) Woitke, P., Dominik, C., & Sedlmayr, E. 1993, A&A, 274, 451
- Woitke et al. (2009a) Woitke, P., Kamp, I., & Thi, W. 2009a, A&A, 501, 383
- Woitke et al. (2009b) Woitke, P., Kamp, I., & Thi, W.-F. 2009b, A&A, 501, 383
- Woitke et al. (2016a) Woitke, P., Min, M., Pinte, C., et al. 2016a, A&A, 586, A103
- Woitke et al. (2016b) Woitke, P., Min, M., Pinte, C., et al. 2016b, A&A, 586, A103
- Woodall et al. (2007) Woodall, J., Agúndez, M., Markwick-Kemper, A. J., & Millar, T. J. 2007, A&A, 466, 1197
- Yoder (1979) Yoder, C. F. 1979, Nature, 279, 767
- Zangi & Mark (2003) Zangi, R. & Mark, A. E. 2003, Phys. Rev. Lett., 91, 025502
- Zhou et al. (2021) Zhou, Y., Bowler, B. P., Wagner, K. R., et al. 2021, AJ, 161, 244
- Zhu (2015) Zhu, Z. 2015, ApJ, 799, 16
- Zhu et al. (2018) Zhu, Z., Andrews, S. M., & Isella, A. 2018, MNRAS, 479, 1850
- Zhu et al. (2012) Zhu, Z., Nelson, R. P., Dong, R., Espaillat, C., & Hartmann, L. 2012, ApJ, 755, 6
Appendix A The RT diffusion solver
ProDiMo solves the radiative transfer equation (Woitke et al. 2009a, see Eq. (12) in) together with the condition of radiative energy conservation, which in general can be written as
| (25) |
where is the bolometric radiation flux vector and is the non-radiative heating rate per volume. In the viscous case, we use , see Eq. (10) with stellar mass and stellar radius instead of and for circumstellar discs. The additional non-radiative heating leads to a surplus emission of photon energy according to
| (26) |
where is the dust absorption coefficient at frequency , the Planck function, and the mean intensity. For passive discs, we have , in which case Eq. (26) simplifies to the ordinary condition of radiative equilibrium.
The numerical solution method for the radiative transfer (RT) in ProDiMo involves iterations where formal solutions with isotropic scattering are computed along multiple rays to cover the full solid angle as seen from every point in the disc, see Sect. 4 in Woitke et al. 2009b. A formal solution results in new which are used to update the dust temperatures and source functions. The convergence of this -iteration is accelerated by the Ng-method (Auer 1984, see). However, despite this acceleration, the convergence is still slow in the midplane, which is a serious problem for all radiative transfer codes for discs, including the Monte-Carlo codes, see Pinte et al. 2009.
Here we describe a method how to avoid this problem. In the diffusion approximation, the bolometric radiation flux
| (27) |
is given by the gradient of the bolometric mean intensity . The Rosseland-mean and Planck-mean opacities are defined as
| (28) | ||||
| (29) |
where is the extinction coefficient and the dust temperature at position in the disk.
At the beginning of a new RT iteration, the Rosseland and Planck opacities are calculated based on the frequency-dependent disk opacity structure and the current . Next, we compute radial and vertical Rosseland optical depths from every point. When the radial inward, radial outward and vertical upward Rosseland optical depths from that point are all larger than a threshold value (we use a value of 10 here), the point is flagged as being optically thick, and added to the subset of optically thick points
| (30) |
where and are the 2D-indices of a grid point at radius and height . The following method only updates the mean intensities and dust temperatures on the optically thick grid points , whereas all other points are regarded as fixed boundary conditions for this problem. To pick up the bolometric mean intensities on the boundary points, we integrate Eq. (26) assuming that is close to a Planckian, hence
| (31) |
where is the frequency-integrated Planck function. Integration of Eq. (25) over the volume associated with grid point as sketched in Fig. 9 results in the following numerical equation
| (32) | ||||
where we note that the vertical fluxes through the cell boundaries involve a scalar product with the slanted normal vector of the surface area, hence is the cell’s horizontal area after projection onto the vertical direction. The following abbreviations are used for the distances, vertical and horizontal areas, and the volume. They are given by the geometry of the ProDiMo grid points, which are aligned on radial rays on which is constant
| (33) | ||||
| (34) | ||||
| (35) | ||||
| (36) | ||||
| (37) | ||||
| (38) | ||||
| (39) | ||||
| (40) | ||||
| (41) | ||||
| (42) | ||||
| (43) | ||||
| (44) | ||||
| (45) | ||||
| (46) |
The radiative diffusion coefficients are defined as
| (47) | ||||
| (48) | ||||
| (49) | ||||
| (50) | ||||
| (51) |
Equation (32) states a system of linear equations for the unknown bolometric mean intensities on the optically thick points of the form
| (52) |
where all quantities in Eqs. (33) to (51) are constants forming the matrix , and the volumes and heating rates are constants forming the rest vector . The unknowns at the optically thick points constitute the solution vector . All terms in Eq. (32) that involve the other on the adjacent points are also included into . The matrix equation to solve (Eq. 52) has a typical dimension of a few hundred to a few thousand, depending on disk mass, geometry, and dust parameters.
This way we can solve the 2D radiative diffusion problem for the unknown mean intensities in the optically thick region as a linear boundary value problem in one go, where there is one layer of points surrounding the optically thick regions which sets the boundary values. Our method calculates how the disk transports the photon energy through the optically thick core inside of the boundary layer. It is applicable to both cases, passive discs without viscous heating and active discs with .
Once the on have been determined, we revert the process described by Eq (31)
| (53) | ||||
| (54) |
and multiply the frequency-dependent mean intensities , as they were determined prior to the application of the diffusion solver, by a constant factor to make Eq. (26) valid again, thereby keeping the previously calculated frequency distribution of .
After having modified and this way on all grid points , the normal RT solution method resumes, which begins by calculating the source functions on all grid points and continues by performing a formal solution.
Figure 10 shows a benchmark test against the Monte Carlo radiative transfer program MCMax (Min et al. 2011). We consider the disk model that is described in detail by Woitke et al. 2016a, see their table 3. The central star is a 2 Myr old T Tauri star with a mass of 0.7 and a luminosity of 1 , the disk has a mass of 0.01 , with a gas/dust ratio of 100. The dust is composed of 60% silicate, 15% amorphous carbon and 25% porosity. The dust grains have sizes between 0.05 m and 3 mm, with an unsettled powerlaw size-distribution of index -3.5. The dust is settled according to the prescription of Dubrulle et al. 1995 with . In contrast to this standard passive T Tauri model, we use here a mass accretion rate of to set the viscous heating of the disk according to Eq. (10). We use radial vertical grid points, and 40 wavelength bins. Figure 10 shows good agreement.
Figure 10 reveals a number of interesting features in the disk temperature structure:
- •
The dust temperature at the inner rim is not much affected by viscous heating.
- •
From top to midplane, the temperature first decreases in the disk shadow, but then the trend is reversed and the temperature re-increases towards the midplane as the viscous heat pumped into the disk needs to flow outward, that is mostly upward, which according to the diffusion approximation requires a negative temperature gradient.
- •
There is little effect of viscous heating on outside of the optically thick region which extends outward to about 10 au and upward to about in this model.
- •
The temperature profile across the midplane beyond the tapering radius (Woitke et al. 2016a, au, see) shows a deep minimum around the midplane . This is because of the extreme dust settling that occurs in these diluted outer disk regions, creating more optical thickness along the midplane, which brings down the midplane temperature to only 6 K in this model.
Figure 11 compares the calculated midplane temperatures between ProDiMo and MCMax, which reveals dust temperatures as high as 2800 K, which is of course questionable because at such temperatures, the dust grains are expected to sublimate.
Figure 12 shows the convergence of the RT method, achieving residual relative temperature changes smaller than after about 150 RT iterations. The maximums occuring each 5th iteration are due to the Ng-acceleration algorithm.
Appendix B Adsorption energies
| Ice | Eads [K] | ref. |
|---|---|---|
| H2O | 4800 | a |
| NH3 | 5534 | b |
| NH2 | 3956 | b |
| C2H6 | 2300 | c |
| C2H4 | 3487 | b |
| C2H2 | 2587 | d |
| CO2 | 2990 | e |
| CH3OH | 5534 | a |
| OH | 2850 | b |
(a) (Brown & Bolina 2006)
(b) (Garrod & Herbst 2006)
(c) (Öberg et al. 2009)
(d) (Collings et al. 2004)
(e) (McElroy et al. 2013)
The adsorption energies of our most common ices and their respective references are listed in Table 5.
Appendix C Surface density slope
Our reference CPDs have a surface density powerlaw exponent . The steady-state solution for a constant- decretion -disk is (Batygin & Morbidelli 2020). The midplane ice mass fraction for a variety of possible values of is shown in Fig. 13. For a higher the NH3 iceline responsible for the “bump” in the profile at 0.07 RH moves outwards only negligibly. In the inner disk however the ice mass fraction increases due to a combination of the lower midplane dust-to-gas and more efficient H2O formation.

Appendix D Background temperature
Throughout this work we have assumed that the CPD is embedded in a radiation field in which the equilibrium dust temperature is 50 K. The midplane dust temperature at the gap center within the circumstellar disk is 50 K, for a solar luminosity 0.83 L⊙, gap AV = 0.008, and heliocentric distance 5.2 au. For earlier formation times with correspondingly higher solar luminosities (2.34-13.6 L⊙), we find gap midplane dust temperatures ranging from 70-120 K at 5.2 au.
We have assumed that the final stage of Jupiter’s accretion and moon formation occured at a radial distance from the sun of 5.2 au. Volatile enrichment in Jupiter’s atmosphere indicates it may have formed further out at circumstellar disk temperatures ¡ 25 K or at radii ¿ 30 au (Öberg & Wordsworth 2019). The Nitrogen abundance of Jupiter, approximately 4 solar, may suggest additional N2 was accreted from the solar nebula near the N2 iceline (Bosman et al. 2019). In light of this possibility we consider also lower background temperatures down to 20 K. The midplane for the reference (7-11) CPD can be seen in Fig.14. Inside the optically thick region of the CPD the influence of the background temperature is marginal for temperatures 70 K. Above 70 K the more volatile NH3 and CO2 are unstable as ices and only water ice remains. Below 40 K the outer disk is able to retain ices at radii where A as the photodesorption timescale is in excess of the viscous timescale.

Appendix E Vertical mixing
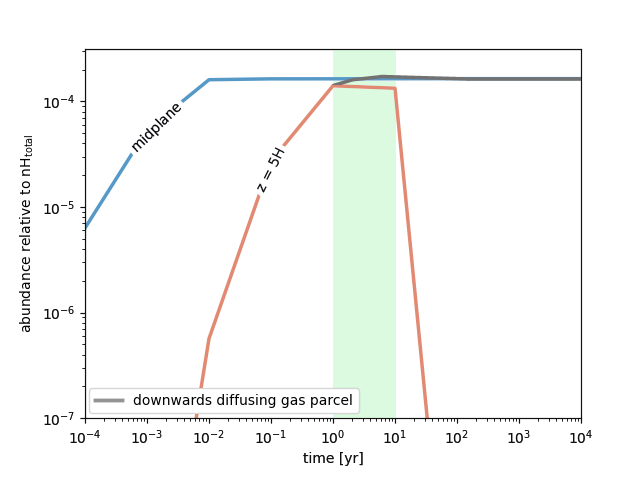
We have made the simplifying assumption that material which accretes onto the CPD is instantaneously distributed vertically throughout the disk. The shock front may be found at a few () scale heights above the CPD midplane (Tanigawa et al. 2012). At 5 scale heights above the centrifugal radius the dust temperature = 123 K (relative to 89.5 K at the midplane), and optical extinction AV=0.004 (16.4 at the midplane). The velocity of vertical mixing by turbulent diffusion can be estimated as where is the local speed of sound (Heinzeller et al. 2011). We find m s-1 in this region for the high-viscosity CPDs, assuming that the magnitude of the turbulence is constant from the midplane up to . The resulting vertical diffusion mixing timescale is (10-100 yr). We perform a test in the (7-11) CPD in which a parcel of gas is accreted at and iteratively evolve its chemistry in steps as it diffuses towards the midplane over 10 yr to understand the impact of more tenuous and high temperature conditions in the initial stages of ice formation (see Fig. 15). By the end of the stage of rapid formation of water (1-2 yr), the ice abundance has equalized to the fiducial case at the midplane.
Appendix F Continued ice deposition on trapped grains
In each of the reference CPDs grains of a certain size range remain trapped within the CPD if we assume that gas actively decretes via the outer edge of the disk. A trapped grain will increase physically in size as ice adsorbs onto its surface and thus alter its aerodynamic properties. Batygin & Morbidelli 2020 proposes that grain growth and sublimation could play a role in trapping and radial cycling of grains with size 0.1-10 mm. The size range of trapped grains is mm in our high-mass CPDs and mm in the low-mass CPDs, representing 2.5 and 0.1 of the infalling dust mass that reaches the midplane, respectively. A modal icy grain is typically coated in no more than 4000 monolayers of water ice. Assuming a monolayer thickness nm (Zangi & Mark 2003) and compact morphology, an icy mantle no more than 1 µm thick will form. A grain of size 0.05 µm can thus increase in size by a factor 20 and have a density corresponding more closely to water ice rather than silicate. For a 1 µm thick mantle the aerodynamic effect of increased cross-section is negated by the corresponding reduction in grain density. If the trapped grain icy mantles continue to grow mantles beyond several 1000 monolayers, the new equilibrium trap radius drifts inwards. Realistically only a fraction (0.01-0.1) of the total CPD gas mass is accreted per year. Mantle growth for a trapped grain will thus not exceed nm yr-1 on average. The time for a grain to grow an icy mantle that allows it to drift to the trap inner edge is then yr (high-mass CPD) or yr (low-mass CPD) assuming a compact grain structure. Ice deposition is thus unlikely to allow grains to escape traps. This estimate does not take into consideration grain growth by coagulation or fragmentation by collision.
Appendix G Chemical abundances of the 0D ”molecular cloud” model
The input parameters of the 0D molecular cloud model can be found in Table 6. A comparison between the model column densities of several common species with observations of TMC-1 can be found in Fig. 16. While most of the common species column density agrees relatively well with observations, the abundance of S-bearing species hinge on the uncertainties regarding the S elemental abundance (Ruffle et al. 1999).
| Parameter | Value | Unit |
|---|---|---|
| Hydrogen density | cm-3 | |
| Gas temperature | 10.0 | K |
| Dust temperature | 10.0 | K |
| Optical extinction | 10.0 | - |
| Mean grain radius | 0.1 | µm |
| Cloud Lifetime | yr |

Appendix H CPD dust-to-gas ratio


In Fig. 17 we explore the resulting midplane ice mass fraction for possible values of the global dust-to-gas ratio from the canonical down to . The maximum grain size and dust population size distribution is kept constant. A global dust-to-gas ratio of 10-3.3 results in maximum midplane values most consistent with the Galilean satellite bulk compositions and hence is adopted as the reference value throughout this work.