Scholastic: Graphical Human-AI Collaboration
for Inductive and Interpretive Text AnalysisConference: The 35th Annual ACM Symposium on User Interface Software and Technology; October 29-November 2, 2022; Bend, OR, USAThe 35th Annual ACM Symposium on User Interface Software and Technology (UIST ’22), October 29-November 2, 2022, Bend, OR, USADOI: 10.1145/3526113.3545681ISBN: 978-1-4503-9320-1/22/106474CCS: Computing methodologies Natural language processingCCS: Human-centered computing Visual analyticsCCS: Human-centered computing Collaborative and social computing systems and tools

Abstract.
Interpretive scholars generate knowledge from text corpora by manually sampling documents, applying codes, and refining and collating codes into categories until meaningful themes emerge. Given a large corpus, machine learning could help scale this data sampling and analysis, but prior research shows that experts are generally concerned about algorithms potentially disrupting or driving interpretive scholarship. We take a human-centered design approach to addressing concerns around machine-assisted interpretive research to build Scholastic, which incorporates a machine-in-the-loop clustering algorithm to scaffold interpretive text analysis. As a scholar applies codes to documents and refines them, the resulting coding schema serves as structured metadata which constrains hierarchical document and word clusters inferred from the corpus. Interactive visualizations of these clusters can help scholars strategically sample documents further toward insights. Scholastic demonstrates how human-centered algorithm design and visualizations employing familiar metaphors can support inductive and interpretive research methodologies through interactive topic modeling and document clustering.
Keywords:
qualitative research, interpretive research methods, interactive topic modeling, interactive document clustering, human-AI collaboration, visual analytics, text data1. Introduction
Modern social science depends heavily on analyzing text data, such as interviews, written logs, or social media archives. Researchers may infer patterns from raw texts using statistical topic modeling (Blei et al. 2003). Alternatively, researchers may employ interpretive methods, clustering texts based on an in-depth reading of the data to apply codes and group codes into categories, which are then iteratively refined until meaningful themes emerge (Braun and Clarke 2006). The two approaches represent trade-offs between efficiency and efficacy. The labor-intensive interpretive methods may not scale to a large corpus (e.g., collections of online blog posts or tweets), requiring researchers to only examine (an often random) sample of texts (Gauthier and Wallace 2022). While statistical models can rapidly process a large corpus, their reliance on purely statistical patterns in the absence of expert knowledge can sacrifice semantics for scale, leading to findings that may insufficiently address critical research questions (Chen et al. 2018).
Visualizing topic models and document clusters could help interpretive scholars explore both the breadth and depth of content in a corpus (Baumer et al. 2020). However, our prior interview studies (Jiang et al. 2021; Feuston and Brubaker 2021) discovered that interpretive scholars were largely skeptical about using machine learning to support their analyses, raising concerns about algorithms driving or replacing human expertise and biasing the analysis process (§3). Recent human-AI collaboration tools can capture expert knowledge as input to refine statistical text models (El-Assady et al. 2020). However, using these tools would require interpretive scholars to work outside of typical workflows where they freely and iteratively apply codes to documents. In this work, we introduce Scholastic, a visual analytics tool that instead explores a machine-in-the-loop (Green and Chen 2019a; Green and Chen 2019b) approach to interpretive research, where scholars analyze text to generate codes and categories that also serve as goal-oriented user input to models that scaffold, rather than replace, human sensemaking. Scholastic aims to build on the strengths of interactive topic modeling and document clustering for helping organize text data at scale while minimizing disruptions to a focused qualitative analysis workflow.
When scholars sample documents to examine and apply codes to a passage within a document, the code label becomes both a meaningful unit of information as well as an organizational tool for re-examining relevant passages from the corpus (Miles et al. 2013) to refine the scholar’s coding schema. We consider two additional conceptualizations of codes as: 1) meaningful human input for the text model to learn from (§5.1), and 2) interactive filters to visualize the distribution of emerging knowledge across clusters (§6). Hierarchical document and word clusters generated by an interactive topic modeling algorithm are depicted using interactive geographical treemaps (Auber et al. 2011) and indented trees (Kim et al. 2020), drawing on familiar visual metaphors while supporting evolving strategies for information foraging. Scholars can apply and iterate on individual codes using the raw text, moving freely between clusters and text as their analysis develops.
Scholastic is the result of a multi-phase co-design process with interpretive scholars, machine learning researchers, and visualization scientists. Our prototype provides preliminary insight into the vision of incorporating interactive ML within the data sampling and sensemaking loops of a qualitative analysis workflow given a large corpus (e.g., online blog posts). Our primary contribution, Scholastic, is a visual analytics tool that supports interpretive data analysis at scale, which comprises:
- •
An interactive word and document clustering algorithm that incorporates evolving codes and categories as model constraints,
- •
Reading, coding, and categorization tools familiar to interpretive scholars,
- •
Interactive cluster visualizations that support both breadth-first exploration of and depth-first search for relevant documents, and
- •
A characterization of the design needs for graphical tools supporting qualitative analysis workflows.
We conducted a formative user study of the tool (§7), focusing on its usability for sampling and coding processes.
2. Background
2.1. Inductive and Interpretive Text Analysis
Interpretive research methods for making sense of text data include thematic analysis (Braun and Clarke 2006) and grounded theory analysis (Corbin and Strauss 1990). One shared thread between these approaches is a principled method for data collection (or sampling items when given an existing corpus) given a research question. Given the collected (or sampled) dataset and in the absence of prior relevant knowledge about a population under study (‘data-driven’ as opposed to ‘theory-driven’ analysis (Braun and Clarke 2006)), the process of applying codes to texts and iteratively categorizing those codes (Miles et al. 2013) is the central process of inductively modeling meaningful patterns (‘surfacing themes’) within interpretive analysis.
The deluge of data available has in some ways made data collection easier, but data items must still be sampled from a corpus, and applying codes can be laborious for even small sets of interviews or ethnographic data (Muller et al. 2016). Popular tools like MaxQDA11 1 maxqda.com or NVivo22 2 qsrinternational.com provide environments in which analysts can manage texts and codes, but these tools can only produce basic summary statistics like code counts. The visualization features in our system prototype are designed to support the data sampling process for interpretive analysis, but also provide coding and categorization functionalities to 1) provide scholars an effective algorithmic support tool to think with and 2) collect user input for an interactive ML algorithm.
2.2. Using Topic Models for Qualitative Research
Epistemological discussions surrounding how machine learning could be leveraged for interpretive research (Baumer et al. 2017; Chuang et al. 2015) have noted similarities between coding in qualitative analysis and topic modeling: both approaches share the goal of iteratively inferring models without prior labels. Topic models such as Latent Dirichlet Allocation (LDA) (Blei et al. 2003) output probabilistic clusters of words based on their co-occurrence patterns within documents. One application of topic models is to facilitate document clustering (Xie and Xing 2013). Boyd-Graber et al. (Boyd-Graber et al. 2017) review the use of topic models across digital humanities and social sciences. These works focus on refining topic models (e.g., by introducing new random variables (Paul and Girju 2010)) and statistically validating them (e.g., using posterior predictive checks (Mimno and Blei 2011)) to output best-fitting statistical models summarizing text corpora.
On the other hand, the high probability words in each topic may also be read as ‘themes’ that provide an overview of a text corpus (Baumer et al. 2017). When interpreted this way, topic models can sometimes suggest overlooked codes and categories or open up paths to other meaningful documents. For example, through human interpretation and sampling via topic models, Nelson (Nelson 2020) analyzed suffrage and feminism movements in New York City and Chicago to characterize how these two local movements differed in their guiding political principles. Although refining and validating topic models may appeal to qualitative scholars for their statistical power, our research team and the qualitative scholars we interviewed (Jiang and Brubaker 2018; Feuston and Brubaker 2021) agree with the views of Nelson and Grimmer & Stewart (Grimmer and Stewart 2013) that topic models can be a tool for assisting—but not superceding—human induction when conducting data-driven interpretive analysis. Still, how models should be integrated into human-AI collaborative workflows remains an open question within interpretive scholarship.
2.3. Interfacing with Text Models
Text models can be interpreted and refined using graphical tools. Termite (Chuang et al. 2012) represents the probability distributions of topic models with matrix-based representations. Topicalizer (Baumer et al. 2020), TOME (Klein et al. 2015), and Serendip (Alexander et al. 2015) follow a more human-centered design approach for presenting topic models for qualitative research or digital humanities. UTOPIAN (Choo et al. 2013) and ArchiText (Kim et al. 2020) allow users to improve topic models using various interactions, including merging and splitting topics and removing words from topics. Lee et al. (Lee et al. 2017) surveyed and evaluated these strategies, recommending eight useful interactions for topic refinement. In contrast, our algorithm design is closest to Yang et al. (Yang et al. 2015) who incorporated expert knowledge as ‘must-link’ or ‘cannot-link’ constraints for LDA via factor graphs.
Visual analytics approaches also enable users to understand how their interactions change clustering outputs. For example, iVisClustering (Lee et al. 2012) allows users to see how adjusting topic models impacts document clustering outputs. Endert et al. (Endert et al. 2012) introduces semantic interaction for directly updating document embeddings. Semantic Concept Spaces (El-Assady et al. 2020) helps analysts incorporate expert knowledge about data semantics into topic models through direct manipulation. Our algorithm design takes the goal of incorporating data semantics further by gathering user input given clear research objectives and methodologies while surfacing codes and categories. Related tools for coding documents include Overview (Brehmer et al. 2014), an investigative journalism tool for sampling and categorizing documents given hierarchical clusters. Aeonium (Drouhard et al. 2017) is a collaborative coding tool that helps identify disagreements between scholars via an SVM classifier. Chandrasegaran, et al. (Chandrasegaran et al. 2017) leverages NLP to highlight keywords across documents to support sensemaking within interpretive scholarship. Our tool provides a contrasting view on supporting interpretive scholarship with visual analytics by focusing on document sampling and interactive modeling in inductive qualitative workflows.
3. Design Objectives
We characterized four key design considerations for interpretive analysis based on recent interview studies conducted by the research team (Jiang et al. 2021; Feuston and Brubaker 2021) as well as internal discussions with experts throughout the design process. Popular methodologies such as thematic analysis and grounded theory analysis share several common components. Most notably, they define processes for selecting or collecting data, inferring codes or categories from that data, and organizing and refining those codes to build knowledge.
On the other hand, researchers across fields have different ways of framing the interpretive analysis process. To resolve potential ambiguities in terminology, we refer to an individual document as a data item, a collection of documents as a data sample, and the entire collection of documents as a corpus. Coding is the act of applying labels to text passages, and categorizing is the act of collating codes. Memoing is recording notes (Miles et al. 2013) to later recall reasons for coding passages or to log additional expert insights.
3.1. Consideration 1: Supporting Serendipity
Interviews from Jiang et al. (Jiang et al. 2021) stressed that machines should not lead data sensemaking in interpretive analysis. Scholars felt that traditional algorithms that output potentially immutable data summaries could bias knowledge generation. For example, they felt that traditional algorithmic approaches could overly constrain how analysts see the data (e.g., by asserting an algorithmic definition of the most “meaningful” patterns in data or creating anchoring biases), bias interpretation by dictating the most “important” terms associated with document clusters prior to analysis (e.g., by labeling clusters according to the most frequent or highest probability terms), and put the algorithm in control of the data analysis workflow (e.g., by limiting how analysts can compare documents across clusters). They also felt that “maybe [the machine] could make suggestions, but even then I don’t know if I want it because it doesn’t know what my research questions are." From the interpretivist view, text data has inherent ambiguities related to semantics, and experts wanted to resolve those ambiguities themselves to support their own knowledge generation: “It’s really satisfying … it’s those kinds of exciting Eureka moments that make research kind of worth it.”
AI could instead support serendipitous moments where the human analysts resolve ambiguities about the data to foster moments of insight. Therefore, our goal was to support curiosity about the data by scaffolding data sampling with a mixed-initiative visual analytics tool. Muller et al. (Muller et al. 2016) also previously suggested that cluster models can provide human scholars with alternative representations of data with which to refine codes. While past approaches have used NLP algorithms to identify important segments across texts to explicitly drive insight generation within qualitative analysis (Chandrasegaran et al. 2017), researchers we spoke with felt this approach shifted too much analytical power to the algorithm to the detriment of the analysis process.
3.2. Consideration 2: Right Place, Right Time
Feuston & Brubaker (Feuston and Brubaker 2021) described various computational subsampling strategies used by scholars, including simple random sampling. While reticent to use automation in coding or categorization, scholars were willing to delegate data sampling to algorithms often as a matter of practicality: corpora are often too large to code all data items. One scholar had used cluster overview visualizations from semantic network analysis alone to sample data items; another used classifiers grounded in keywords related to categories they had developed to identify similar data items. While both approaches illustrate algorithmic sampling strategies, the latter approach combines human expertise with automation.
Many scholars felt that AI was only appropriate after they had made some analytic progress, as in the second analyst’s keyword-based approach. Cluster models often rely on word-document co-occurrence matrices that privilege frequently occurring words (Steyvers and Griffiths 2010). Frequency is not necessarily integral to qualitative methodologies. Data patterns of interest can be sparsely scattered, so if text models are used at all, they should incorporate human inputs in addition to co-occurrence information. The updated clusters can then be used to guide further sampling (adhering to the constant comparative method in grounded theory). We note the potential caveat that human selection bias also poses a challenge to generalizability within qualitative research (Collier and Mahoney 1996).
3.3. Consideration 3: Using Familiar Paradigms
Qualitative researchers often only rely on the most basic features of software (Wiedemann 2013). Scholars interviewed by Jiang et al. (Jiang et al. 2021) attributed this to the overall difficulty of using complex qualitative analysis tools like MaxQDA or NVivo: “[qualitative analysis tools should not be] like the NVivo type, where I have to really learn a lot of it." Such complexity was perceived as getting in the way of their analysis. Many scholars used Google Docs or post-it notes to manage codes. Sensemaking about computational tools can inadvertently hinder or misguide sensemaking about data using those tools: “Using any tools, I think it gets in the way of the analysis… I think the focus then inevitably becomes on the tool and how I can manipulate and push data in order to make it appropriate for the tool." Building on these observations, interpretive analysis tools should, whenever possible, leverage familiar visual and interaction paradigms to help analysts retain their focus on the data rather than on navigating the tool.
3.4. Consideration 4: Overlaying Visualizations With Codes and Categories
Scholars interviewed by Feuston & Brubaker (Feuston and Brubaker 2021) described how “it might be interesting to compare and contrast" the analyst-inferred codes with machine-inferred clusters to help refine codes and categories. This desire was echoed by scholars in Jiang et al. (Jiang et al. 2021) who frequently requested visualization features that allowed comparisons across clusters and codes: “I want to be able to say, okay, all the people I’ve talked to who identify as queer, how did they feel about capitalism? I want to be able to do a cross-sectional analysis on multiple codes and domains.” This comparison may be accomplished by incorporating visual overlays of the applied codes and categories onto cluster visualizations, situating both human-induced and machine-inferred models in the same space.
These comparisons also could foster collaborative interaction between human and automated analyses. For example, once a machine has learned from human input, the visualizations could guide the user toward sets of related documents or codes. An expert in Jiang et al. (Jiang and Brubaker 2018) indicated that it would be useful “if there was some sort of learning algorithm, for example, that would suggest… other quotes that were similar to that one."
3.5. Summary of Design Objectives
The above considerations indicate a need for human-AI collaboration in qualitative analysis, such that AI is embedded within an interpretive research workflow and adapts to evolving codes and categories. System features should support:
- (1)
Insight Generation and Retention: We aim to develop an interface for memoing, developing codes and categories, and revisiting coded documents to help people generate knowledge by creating, applying, and refining their coding schema with intelligent and transparent system support.
- (2)
Random Sampling: We aim to enable a random subselection of documents in the absence of human codes to gather initial insights about the dataset.
- (3)
Strategic Cluster-Based Sampling: We aim to incorporate cluster model visualizations that enable both breath-first exploration of the corpus or depth-first search for potentially meaningful data items. Overlaying codes and categories onto the cluster visualizations will allow scholars to compare the model outputs with their own coding schema.
- (4)
Familiar Metaphors for Interactive Visualizations: We aim to leverage familiar visual metaphors for representing text models such that sensemaking about the tool does not inhibit sensemaking about the data.
- (5)
Interactive Models that Incorporate Expert Input: We introduce an interactive clustering algorithm that can learn from parsimonious human input without disrupting their analysis by using codes and categories as additional data for the model.
4. Implementation
Scholastic is a web-based application built using Python and JavaScript. Interactive machine learning is implemented through the Python packages spacy, graph-tool, NumPy, and SciPy. The backend interface utilizes Flask, pandas, and the Google Sheets API. As requested by experts, user inputs (codes, categories, passages, keywords, and memos) are saved to Google Sheets to support the integration of their analysis into existing external processes. The frontend interface is implemented through the Svelte, Carbon Design, TopoJSON, and D3.js packages.

5. Algorithm Design

We adapt the hSBM approach to probabilistic word and document clustering by Gerlach et al. (Gerlach et al. 2018) which uses a stochastic block model to detect communities in complex bipartite networks formed by text data. A stochastic block model (Holland et al. 1983) generates a random graph whose adjacency matrix representation is with probability , where elements in the vector represent block membership assignments. In the context of text, each represents the number of times a word occurs in a document , and and represent individual word and document blocks respectively. Given the marginal likelihood function defined in Gerlach et al. (Gerlach et al. 2018), the posterior distribution can be efficiently approximated using Markov Chain Monte Carlo (MCMC), which is then equilibriated to avoid local optima (Peixoto 2019).
The informative priors on hSBM produce more heterogeneous mixtures than LDA while being completely non-parametric (Gerlach et al. 2018). Notably, the mixed-membership (‘overlapping’) version of hSBM, which outputs ‘soft’ clusters of words (‘topics’), significantly outperforms LDA topic models even on synthetic Dirichlet mixtures. Additionally, even in the absence of stop-word removal, hSBM automatically detects clusters of stop-words which frequently occur across the corpus; it will also infer the number of word and document clusters directly by sampling from the posterior distribution rather than requiring either the developer or researcher to specify a target number of clusters a priori.
In this work, we utilize the non-overlapping variant of hSBM. Non-overlapping blocks partition the text data deterministically (e.g., if word node belongs in a word cluster in level and otherwise). In contrast to LDA, this forgoes the need for the system or its users to set a minimum probability threshold to obtain ‘hard’ clusters from topic models. 33 3 This partly motivates our avoidance in this paper toward referring to probabilistic word clusters as ‘topics’; interpretive scholars may also find the concept of ‘topics’ difficult to disassociate from ‘themes.’ Given this bipartite model structure, hSBM infers hierarchical word and document block assignments and simultaneously.
5.1. Incorporating Codes and Categories
as Metadata
Adapting the multilayer hSBM introduced by Hyland et al. (Hyland et al. 2021), Scholastic pairs word-document co-occurrence matrices with analyst-induced coding schema, adjusting clusters to reflect ongoing expert analyses. To formulate these coding schema as constraints to cluster outputs, we re-frame the data types which characterize interpretive text analysis as follows:
- Documents:
-
A corpus of document nodes .
- Words:
-
A vocabulary of word nodes .
- Codes:
-
Each in is classified by a code in .
- Categories:
-
Each code in is classified by a category tag in .
We represent these variables as an undirected multilayer network (Kivelä et al. 2014) with parallel edges (Figure 3), whose clusters can then be inferred using stochastic block models. Our network includes two layers: a Text layer to capture co-occurrence patterns in text and a Metadata layer for codes and categories generated by the human scholar. The Text layer is a bipartite network with parallel edges between and . The Metadata layer is a disconnected, tripartite network of words, codes, and category tags where parallel edges hierarchically partition words.
When applied to multilayer networks, hSBM will simultaneously infer clusters across all layers. Since the same occurs in both the Text and Metadata layers, how words are clustered together will be identical across both layers (Hyland et al. 2021). Thus, the partitioned nature of the Metadata layer enforces a constraint that keywords applied the same code must always be clustered together. However, the relationships of these keywords to other words in the Text layer allows sets of keywords to be clustered with other non-keywords or with other keyword clusters.
The edges between words and codes is inferred from passage highlighting and subsequent ‘in vivo’ keyword selection used to apply codes to raw texts, as described in §6.2. Note that every word in the corpus is always adjacent to a unique code. If a word has not been coded, it remains by default adjacent to the non-keyword code. After a scholar produces codes and categories, they can update the model on demand using a button in the interface (see §6). The Metadata layer is then remodeled and clusters reinferred with the new constraints that reflect the current analysis state.
6. Interface Design
To incorporate the above algorithm within a machine-in-the-loop interpretive scholarship workflow, our system prototype Scholastic has three views:
- (1)
The Document Map (Figure 4), which supports both random and breadth-first sampling as well as model comparisons;
- (2)
The Document Reader (Figure 5), which supports coding, memoing, and keyword selection for the algorithm; and
- (3)
The Code Examiner (Figure 6), which supports categorization, depth-first search for similar documents related to codes, and subsequent code refinement.
This design embodies qualitative analysts’ workflows for manually applying codes and categories through inductive interpretivist methods while allowing the system to collect metadata (via keyword selection for each applied code) to refine the outputs of our hSBM algorithm. The analyst can navigate between these views using the navigation bar (Figure 4.1) or by sampling documents. Code filters within the navigation bar filter overlay pins on the Document Map: pins appear above documents if codes have been applied to passages within those documents. The navigation bar also contains a button to update the cluster models on demand. The scholar can continue working on their analysis during this model update, which given our study dataset (Appendix A) and hardware (32GB RAM with an Intel 6-Core i7 processor) took approximately 11 minutes. Lastly, the navigation bar also allows a scholar to switch between color themes (light mode by default and dark mode for focused reading) using radio buttons.
6.1. Breadth-First Sampling: Document Map
The Document Map serves two main functionalities: corpus exploration and model comparisons. The central visual element is a geographical treemap (Auber et al. 2011) representing the hierarchical document clusters as spatial regions. The analyst controls the granularity of the hierarchical clusters with a step slider (Figure 4.2), which determines the lowest level cluster boundaries shown.
Each document is represented with a hexagonal tile (Figure 4.3). Hovering over individual hexagons on the map dynamically displays the corresponding document title on the preview component at the bottom right. Right-clicking a hexagon expands this preview component to show the first 1000 characters of a document without entering the Document Reader; left-clicking a hexagon opens the document in the Document Reader (§6.2) to begin coding. If the scholar chooses not to use the geographical map for document sampling, the Document Map allows them to randomly sample a subset of documents from the corpus, where the sample size can be specified by the scholar (Figure 4.4).
We used a geographical treemap to draw a familiar visual metaphor between hierarchical document clusters and maps to allow analysts to easily explore the hierarchical clusters. We intentionally do not impose a priori cluster keywords or filters on this map to avoid biasing an interpretive scholar’s attention toward any specific cluster. We also do not provide information extracted from the model (e.g., common words, topic names, word probabilities) beyond cluster boundaries to avoid bias in cluster interpretation. By design, the Document Map requires the user to demand details about data items first by hovering over or sampling an item, then build up their own filters and relations between documents (codes and categories), constructing an overview through their own sensemaking process.

We display a location pin above a hexagon tile if a code has been applied to the document. Each pin is colored according to the category of the applied code. In cases where multiple codes have been applied to a document, the number of unique categories is initially shown above the text item. Analysts can choose to show all codes associated with each document or a subset of codes using the code filters on the navigation bar (Figure 4.5). The pins are intended to support diverse and adaptive search strategies to explore related (i.e., depth-first) and unrelated (i.e., breadth-first) documents based on the user’s ongoing analysis. They also allow the scholar to compare their evolving coding schema with the document cluster output. Once the hSBM has output an updated cluster model on the scholar’s demand, they can also make comparisons across the model outputs (using a step slider on the left sidebar) to assess how their inputs affected the distribution of codes across clusters.
6.2. Applying Codes: Document Reader
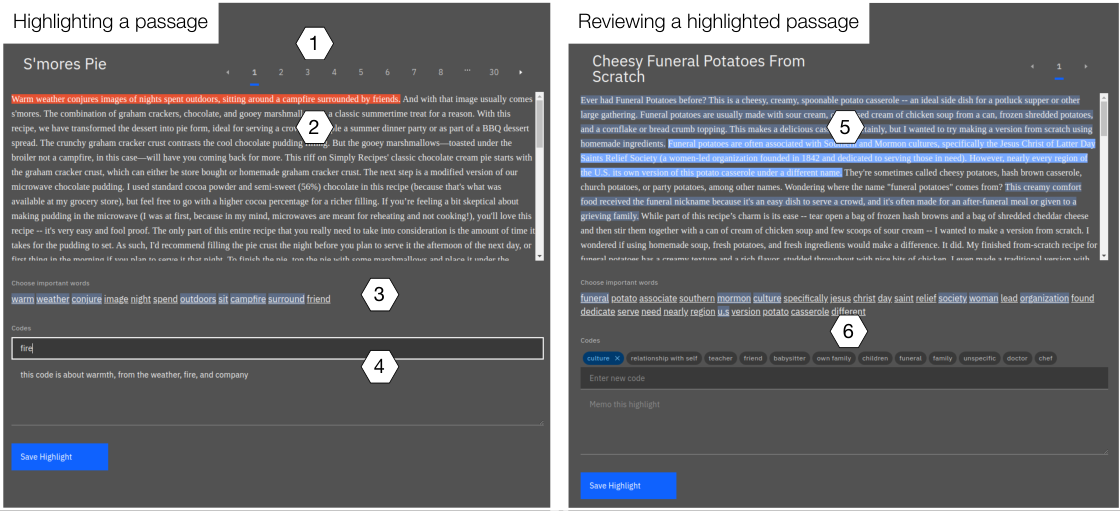
A scholar accesses the Document Reader (Figure 5) from either the Document Map (when conducting a breadth-first sampling from the corpus) or the Code Examiner (when revisiting a document given a target code or when conducting a depth-first sampling using the indented tree; see §6.3). When multiple documents have been sampled (e.g., through the indented tree or random sampling), the scholar can scroll through them using the pagination component (Figure 5.1). The Document Reader first displays the selected document’s title and content. The scholar can click-and-drag (i.e., highlight) a passage to apply a code (Figure 5.2). As soon as the drag is released, the coding footer component appears (Figure 5.4).
The coding footer component allows the analyst to apply a new code by typing in a code label or apply existing codes by clicking on existing code tags. It also displays a stemmed subset of words from the highlighted passage (minus stopwords) from which the scholar can choose relevant keywords for the multilayer hSBM (Figure 5.3). This parsimonious input operation is similar to in vivo coding and allows the scholar to characterize semantically meaningful relationships between keywords. Highlighted passages are then visualized as clickable tagged text (Alexander et al. 2015), persisting throughout the analysis. When revisiting a document, the scholar can click on a previously highlighted passage—which auto-fills the code, keywords, and memos in the coding footer—to allow reflection and refinement (Figure 5.5, 5.6).
6.3. Categorization and Depth-First Search:
Code Examiner
After applying codes, the Code Examiner (Figure 6) allows scholars to compare, refine, and categorize them. Selecting a pair of codes from drop-down menus populates the interface with each code’s label, memos, and the passages containing that code (Figure 6.4). Researchers can create a new category for a code by typing in a category label under the code label drop-down. If category labels already exist, this text field also doubles as a drop-down menu to assign an existing category to a code. These text segments highlight important keywords selected by the analyst using tagged text (Alexander et al. 2015). Clicking on a passage will navigate the scholar back to the corresponding document in the Document Reader (§6.2) for reflection and refinement.
When codes are selected from the dropdown menus, the Code Examiner displays a pruned tree representation of the hierarchical word clusters generated by the hSBM model (Figure 6.2). The indented word tree representation of these clusters—similar to ArchiText (Kim et al. 2020)—and the simple form-based interface build on familiar metaphors from digital filing systems. At the overview level, the tree only displays keywords from the coded passages to reduce complexity, but hovering over each cluster will display the top ten words within it. The analyst can click on a word cluster at various depth levels in the hierarchy to sample 30 documents associated with the selected cluster. These 30 documents are selected and displayed in a paginated list (see Figure 5.1), sorted according to the probability of the selected word cluster occurring in each document . This algorithmic sampling and sorting allows scholars to identify candidate documents depth-first through their code labels and preview the documents in the list view to quickly find those that are most relevant for their current analysis.
7. Evaluation
We evaluated Scholastic in an interview study with two interpretive researchers. The study consisted of three phases: a brief introduction to the study goals, a think-aloud analysis of 2,615 recipe blog posts using Scholastic (Appendix A), and an exit interview to capture additional feedback. Both participants were trained and published in interpretive research using text data.
Scholastic integrates a constraint-based interactive ML algorithm with both the data sampling and sensemaking loops of qualitative analysis. Our design considerations took into account that an effective human-AI collaboration tool should support: 1) serendipitous insightful moments during data sampling and sensemaking, and 2) incorporating human input into cluster models (see §3). Therefore, our evaluation sought evidence of following:
- •
A range of sampling strategies within the Document Map and the Code Examiner, and
- •
Indications that the interactive ML-related functionalities would not disrupt a scholar’s focused analysis within the Document Reader.
First, a short introduction was given describing how we wished to examine the ways an interpretive scholar might use our system to analyze a large corpus in order to gather feedback on its design. We then obtain informed consent to participate and basic demographic information. Finally, we introduced the target dataset and a relevant research question with the following script:
“You have collected 2615 online recipe blog posts. You are interested in examining how certain foods elicit stories about certain interpersonal relationships as bloggers build narratives around food. Due to the amount of data, you will try a new system designed to support the qualitative analysis of large datasets. The first thing you want to do is to familiarize yourself with your dataset. You open up the system. Talk aloud while you use this screen—as well as the interactions it supports—to examine the dataset.”
We devised three simple, open-ended tasks to help scaffold the interview such that scholars were able to navigate all system features. These task instructions were devised to ensure task coverage, avoid a prescriptive workflow, and minimize researcher bias. We did not provide participants with tutorials on system functionalities, instead allowing participants to independently learn through their interactions. By providing an example dataset, we also intended to mitigate biases that may arise from familiarity with the underlying information. Each interview took 90 minutes.
7.1. Task 1: You open up the system.
What do you do first?
Our first task captured initial interactions with the Document Map (§6.1), which served as a frontispiece for the tool. P1 described the geographical treemap as “pleasing,” “so wholesome,” and that one cluster was “a very pleasing shape.” They appreciated the connection to familiar geographic maps and board games (e.g. Dungeons & Dragons, Settlers of Catan). They started exploring documents by hovering over items, which dynamically displayed each item’s title on the right sidebar. Their interactions focused on items at the cluster boundaries, leading them to wonder: “Is there a reason this cell is bordered off in this section?”
Although the geographical treemap did not communicate visual content summaries, the dynamic details-on-demand interactions with document titles still allowed P1 to conceptualize clusters in a creative way. They remembered each cluster by its shape and position, developing light-hearted yet memorable names for the regions (e.g., ‘Grandma’s Cookie Empire’, ‘Meat-topia’). When adjusting the granularity of the hierarchical document clusters, they talked about how the first and second levels were manageable, but the third level was too granular, saying they might as well be going through the documents manually on their computer.
Similarly, P2 was drawn to the hover interactions on the geographical treemap, which they described as ‘techy’ and ‘aesthetic.’ They noted that although one region seemed to only include pasta recipes, another region seemed to combine drinks and desserts, prompting them to wonder why those recipes were clustered together. P2 described the process of foraging for documents with the map as akin to finding “little treats.” P2 heavily relied on the right-click preview feature, which retrieves the first 1,000 characters of the document, to make more detailed sense of each item within the clusters. Although P2 did not verbally conceptualize the regions as P1 did, when asked to recall where the pasta and drinks regions were at the end of the interview, P2 located them by their shapes and positions.
7.2. Task 2: Sample document items
and apply codes.
How participants sampled documents were left to their preferences. P1 chose to select documents via click interactions on the map, whereas P2 sampled ten random documents. With the Document Reader (§6.3) shown, participants were then instructed to begin applying codes. P1’s coding process started with ‘meme’ codes (e.g., ‘veggie tales,’ ‘boil em mash em’) that they later refined. Neither participants had guidance for why the keyword selection feature was present, but immediately speculated that keywords might be used to help update the cluster outputs, as P1 noted: “The machine will operate better if I give it more input, is what I’m assuming there.” P2 also recognized that the keywords could benefit collaboration with the machine: “so when we see this in other documents, [the system is] going to assign more weight to that in some way.” To this point, they speculated about what would happen if they trained the model incorrectly: “I feel like it’s basically the garbage in, garbage out principle.”
P1 appreciated that the keyword selection features in the Document Reader were automatically stemmed and stripped of stopwords, but noted that stopwords may be useful for in-depth sociolinguistic analysis. For P2, on the other hand, keyword selection became a redundant feature because they began by coding short chunks of texts with one to three words (in vivo coding). However, when they started highlighting larger passages, they commented how selecting keywords within these chunks, in combination with memoing, could potentially aid in their self-reflection on the meaning of a highlighted passage. Lastly, both experts noticed a few missing features for coding: notably, the ability to apply multiple codes to a single highlighted passage or to simultaneously highlight two passages and apply a single code to both.
7.3. Task 3: Now that you have codes,
organize them into categories.
Upon being given this instruction, participants intuitively navigated to the Code Examiner (§6.3) using the navigation bar to reflect and categorize the codes they applied in the Document Reader. On the Code Examiner, P1 selected a code (‘meat-lovers’) and saw the hierarchical word clusters, pruned to include only clusters with associated code keywords. Clicking into one of the clusters prompted the sampling of 30 documents, ordered by the likelihood of containing the clicked word cluster. P1 could not immediately make sense of why these documents were sampled, since some documents did not contain the keyword, instead containing other words related to them based on the clustering output. Also, interesting passages within recipe blog posts may be sparsely scattered, only serving as a transition from the introduction to the recipe body. However, their reaction then was to code “more of this [document] with like, people’s declaration of love to meat,” since they developed an understanding that the document was sampled due to its relationship to their keywords from the combined visualizations and raw text.
When P2 started categorizing codes, they noticed that the colored code tags in the navigation bar (Figure 4.5) made it easy to see how the categories were emerging as well as which codes were uncategorized. In exploring the word cluster list, P2 clicked into a leaf cluster containing the keyword ‘friend.’ They used Ctrl-F to find occurrences of the word “friend” from the word cluster, which was present in the second document but not the first. They noted that the cluster levels seemed to get “more filtered” down the hierarchy. For example, they noticed the associated words at the lower two cluster levels started with the word ‘friend,’ (Figure 6.3) but words at the top level cluster began with ‘salt.’ They then felt more certain about the function of the indented tree when working with their “culture” code: “Let’s see what’s in the Southern cluster. So on the first level, it’s ‘Southern,’ ‘biscuits,’ ‘health’; on the second level, it’s ‘cake,’ ‘Southern’; and on the third, it’s ‘roll,’ ‘dough,’ ‘filling,’ etc. Again, I do feel this is grabbing all the documents that have ‘Southern.’ or maybe something like that.”
Due to time constraints, only P2 was able to explore the document and word clusters updated based on their codes and categories. After the model update (which took around 11 minutes), they interacted with the Document Map with the color-categorized code filters, doing this with several codes to see where the coded documents now appeared. They contrasted the document cluster partitions with the positions of colored code pins, discussing how it was interesting that documents with the same codes still appeared across different clusters. They had expected that documents sharing codes would instead be clustered together by the update. Upon being asked what they would do next, they responded that they would keep coding to see if more concrete patterns might emerge when contrasting the document cluster partitions with the positions of colored code pins.
8. Discussion
Scholastic is a human-AI collaboration tool for interpretive scholarship co-designed with experts. The system represents preliminary steps towards the vision of supporting scalable qualitative analysis with large text corpora scaffolded by algorithmic and visualization tools. We took a human-centered approach to enabling this epistemic practice, grounding our design objectives in our team’s earlier user interviews (Jiang et al. 2021; Feuston and Brubaker 2021) and design iterations between the interpretive scholars and visualization researchers on our team. Our discussions revealed the importance of designing for agency: tools should enhance analysts’ natural workflows rather than enforcing alternative practices. On the algorithmic side, models should adapt to human input from the scholar’s analysis; on the visualization side, the visualization should evolve to incorporate human-inferred codes and categories. Here, we summarize preliminary outcomes from the implementation and evaluation of Scholastic to inform future work on forging effective human-AI collaboration for inductive and interpretive text analysis.
8.1. Outcome 1. Supporting Serendipity
Most cluster visualizations follow the visual information-seeking mantra, starting with descriptive visual summaries of the data (overviews) that are interactively adjusted (filter, relate), and information about individual data points is available on-demand. The goal of these techniques is to better provide quantitative summaries of cluster contents at-a-glance. In contrast, our geographical treemap communicated only the size and hierarchical containment of each cluster: Scholastic does not impose a priori cluster keywords or filters to avoid biasing an interpretive and inductive researcher’s attention toward any specific cluster. By design, the Document Map requires the user to demand details first, then build up their own filters and relations (i.e., codes and categories), constructing an overview through their own sensemaking process. This reversal of the information-seeking mantra allows the analyst to either implicitly develop their own mental model of a cluster’s meaning or explicitly code documents and allow the interactive machine learning algorithm to match their outputs more closely to codes and categories identified by analysts.
However, the analyst’s curiosity about emergent features on the geographical treemap became an entry point for interpretation. Their use and interpretation of these features naturally shifted toward data sensemaking. They appeared to be able to integrate both text and shape to construct a better mental model of the space of documents (Tversky 1991), to efficiently sample data items, avoiding data items from the same cluster or sampling data items from a cluster of interest. For P1, naming regions (e.g., “meatopia”) provided a way to remember what documents had been sampled and to revisit similar documents later (e.g., “maybe I should go look at what’s in Meatopia”). They called the regions by names related to their shape or the document content: “And then there’s this little cell here, that’s like the country on the African continent, that’s like the little donut hole…”). Although P2 initially expressed confusion over some document clusters, their ability to vocalize their uncertainty (e.g., “why does [this cluster] contain both drinks and desserts?”) also reflected curiosity-driven exploration by both verbal and spatial conceptualization of the map (Dickson et al. 1988).
8.2. Outcome 2. Right Place, Right Time
By incorporating evolving human codes and categories into Scholastic’s interfaces and algorithms, we supported both random and strategic sampling with visualizations that increasingly reflect the knowledge built by the user rather than by the raw text models. The participants in our evaluation each chose a different strategy for sampling. Supporting diverse strategies gives the researchers the agency to choose the right tools for the right data, scenarios, and times. Although P2 chose not to use the map for sampling initially, in our post-study interview they appreciated that the document clusters helped them familiarize themselves with the breadth of the dataset before coding.
P2 noticed that keyword selection for the interactive ML algorithm could help them analyze a passage in more depth. They mentioned that coding individual keywords would be “the kind of thing I would probably be memoing about,” as identifying keywords within codes allows analysts to focus on why a particular code might be appropriate for a given passage. In this sense, both participants saw the tool as a collaborator, where the ML features helped the analyst, but the analyst also helped the model evolve. P1 in many ways personified the system as they would a research assistant. They remarked when there was a lag in saving a highlight that “He’s keeping up in the back there.” P1 noted that if the keyword selection appeared beneficial for the model, they would be pleased “because it’s designed to help me. It is my helper.” P2 noted that seeing how the document cluster outputs had changed based on input made the model more trustworthy, because it was able to adapt to their own interpretations.
9. Limitations and Future Work
Scholastic’s design focused on capturing the core components of qualitative analysis workflows without necessarily supporting any individual methodology (e.g., grounded theory or thematic analysis). In our evaluation with qualitative experts, analysts wanted several additional features to tailor the tool for specific interpretive approaches. For example, P1 appreciated that the keyword selection features in the Document Reader were automatically stemmed and stripped of stopwords within the context of their preferred methods (thematic analysis). However, both participants noted that stopwords may be useful for in-depth sociolinguistic analyses. Future work should explore extensible frameworks that tailor analysis support to individual methodological or disciplinary needs.
We note that our tool does not aim to incorporate all of the coding features present in commercial tools like MaxQDA that primarily support code management. Analysts’ coding practices vary widely: for example, P1 would have preferred to code titles of documents in addition to their body texts. Analysts may desire to highlight multiple disjoint segments with a single code or to assign multiple unique codes to a single highlight. The latter practice—while frequently requested—requires further algorithmic development since our algorithm assumes that each keyword maps to a single code. If a user wishes to apply multiple codes to the same passage of text in our current implementation, the text must be segmented into unique keywords for each code to avoid overlapping assignments. For interpretive scholarship, assigning multiple codes to a single passage for approaches treating text data as a bag-of-words input will require novel algorithmic support, unless the word tokens can be separated according to additional metadata such as semantics and syntax as in Griffiths et al. (Griffiths et al. 2005).
Engagement played a significant role in analysts’ desire to use a given visualization for sampling data items. For example, P1 noted that the directory-like nature of the indented tree visualization lacked the engaging, more organic features that had emerged on the Document Map. This difference impacted how willing they were to sample documents with the indented tree visualization. Our future work will study how visual features emerging in cluster visualizations may play a role in learning and memory for qualitative data. For example, even in the absence of explicit visual summaries, people were able to leverage details-on-demand interactions and emergent shapes of the geographical treemap to conceptualize and remember the information contained within clusters and guide their exploration. Future work should explore if this behavior has a capacity limit (e.g., number of clusters) or is mediated by the visualization technique used (e.g., geographical treemaps vs. scatterplots).
Our evaluation studies focused on the system’s usability with two researchers. An extended, longitudinal evaluation could better demonstrate analytical insights generated using Scholastic. We intend to deploy this system as part of a future longitudinal study on the impact of mixed-initiative tools on qualitative analysis outcomes. This comparative study may investigate the varying efficiency and efficacy of these tools over a lengthy collaborative and interpretive text analysis (e.g., by analyzing subjective evaluations of confidence and trust in analysts’ knowledge work and comparing research outcomes across users).
10. Conclusion
Statistical models are powerful tools for analyzing text data. However, there is no consensus within the interpretivist research community regarding what the role of machine learning should be within their practices (DiMaggio et al. 2013; Nelson 2020). Our co-design process with experts took a human-centered approach to implement an interface and algorithm for supporting key phases of interpretive and inductive text analysis workflows (Baumer 2017). Scholastic embodies the goals of designing for various sampling strategies given a corpus, letting the AI model adapt to on-going knowledge development, and allowing human sensemaking to drive interpretive text analysis, enabling familiar and non-disruptive interactions with the AI mediated by visualizations. Given the popularity of qualitative methods for analyzing text data within human-computer interaction (McDonald et al. 2019) and visual analytics (Diehl et al. 2022), we hope that our work will build a foundation for future mixed-initiative systems scaffolding interpretive scholarship.
Acknowledgements.
The authors would like to thank Kandrea Wade and Casey Fiesler for their input at the conceptualization stages, students and faculty at the ATLAS Institute, CU Boulder during the design, development, and writing stages, and Matteo Abrate (https://bl.ocks.org/nitaku) for his valuable examples of geographical treemaps. This work was supported by NSF awards #1764092 & #2046725.References
- (1)
- Alexander et al. (2015) Eric Alexander, Joe Kohlmann, Robin Valenza, Michael Witmore, and Michael Gleicher. 2015. Serendip: Topic model-driven visual exploration of text corpora. In 2014 IEEE Conference on Visual Analytics Science and Technology, VAST 2014 - Proceedings. 173–182. https://doi.org/10.1109/VAST.2014.7042493
- Auber et al. (2011) D Auber, C Huet, A Lambert, and A Sallaberry. 2011. Geographical treemaps. Not yet published March (2011). http://www.labri.fr/perso/auber/download/paper{_}TVCG/docPourTVCG/InfoVisVersion.pdf
- Baumer (2017) Eric P S Baumer. 2017. Toward human-centered algorithm design. Big Data & Society 4, 2 (2017), 205395171771885. https://doi.org/10.1177/2053951717718854
- Baumer et al. (2017) Eric P S Baumer, David Mimno, Shion Guha, Emily Quan, and Geri K Gay. 2017. Comparing grounded theory and topic modeling: Extreme divergence or unlikely convergence? Journal of the Association for Information Science and Technology 68, 6 (2017), 1397–1410. https://doi.org/10.1002/asi.23786
- Baumer et al. (2020) Eric P S Baumer, Drew Siedel, Lena Mcdonnell, Jiayun Zhong, Patricia Sittikul, and Micki Mcgee. 2020. Topicalizer: reframing core concepts in machine learning visualization by co-designing for interpretivist scholarship. Human–Computer Interaction (2020), 1–29. https://doi.org/10.1080/07370024.2020.1734460
- Blei et al. (2003) David M Blei, Andrew Y Ng, and Michael I Jordan. 2003. Latent Dirichlet Allocation. Technical Report. 993–1022 pages.
- Boyd-Graber et al. (2017) Jordan Boyd-Graber, Yuening Hu, and David Mimno. 2017. Applications of Topic Models. Applications of Topic Models XX, Xx (2017), 1–154. https://doi.org/10.1561/9781680833096
- Braun and Clarke (2006) Virginia Braun and Victoria Clarke. 2006. Using thematic analysis in psychology. Qualitative Research in Psychology 3, 2 (2006), 77–101. https://doi.org/10.1191/1478088706qp063oa
- Brehmer et al. (2014) Matthew Brehmer, Stephen Ingram, Jonathan Stray, and Tamara Munzner. 2014. Overview: The Design, Adoption, and Analysis of a Visual Document Mining Tool for Investigative Journalists. IEEE Transactions on Visualization and Computer Graphics 20, 12 (2014), 2271–2280. https://doi.org/10.1109/tvcg.2014.2346431
- Chandrasegaran et al. (2017) Senthil Chandrasegaran, Sriram Karthik Badam, Lorraine Kisselburgh, Karthik Ramani, and Niklas Elmqvist. 2017. Integrating Visual Analytics Support for Grounded Theory Practice in Qualitative Text Analysis. Computer Graphics Forum 36, 3 (jun 2017), 201–212. https://doi.org/10.1111/cgf.13180
- Chen et al. (2018) Nan-Chen Chen, Margaret Drouhard, Rafal Kocielnik, Jina Suh, and Cecilia R Aragon. 2018. Using Machine Learning to Support Qualitative Coding in Social Science. ACM Transactions on Interactive Intelligent Systems 8, 2 (2018), 1–20. https://doi.org/10.1145/3185515
- Choo et al. (2013) Jaegul Choo, Changhyun Lee, Chandan K Reddy, and Haesun Park. 2013. UTOPIAN: User-Driven Topic Modeling Based on Interactive Nonnegative Matrix Factorization. IEEE Transactions on Visualization and Computer Graphics 19, 12 (2013), 1992–2001. https://doi.org/10.1109/tvcg.2013.212
- Chuang et al. (2012) Jason Chuang, Christopher D. Manning, and Jeffrey Heer. 2012. Termite: Visualization techniques for assessing textual topic models. Proceedings of the Workshop on Advanced Visual Interfaces AVI (2012), 74–77. https://doi.org/10.1145/2254556.2254572
- Chuang et al. (2015) Jason Chuang, John D Wilkerson, Brandon M Stewart, and Margaret E Roberts. 2015. Computer-Assisted Content Analysis : Topic Models for Exploring Multiple Subjective Interpretations. NIPS Workshop on Human-Propelled Machine Learnin (2015), 1–9.
- Collier and Mahoney (1996) David Collier and James Mahoney. 1996. Insights and Pitfalls: Selection Bias in Qualitative Research. World Politics 49, 1 (1996), 56–91. https://doi.org/10.1353/wp.1996.0023
- Corbin and Strauss (1990) Juliet M. Corbin and Anselm Strauss. 1990. Grounded theory research: Procedures, canons, and evaluative criteria. Qualitative Sociology 13, 1 (1990), 3–21. https://doi.org/10.1007/BF00988593
- Dickson et al. (1988) Lou Ann S. Dickson, Philipp S. Schrankel, and Raymond W. Kulhavy. 1988. Verbal and spatial encoding of text. Instructional Science 17, 2 (1988), 145–157. https://doi.org/10.1007/BF00052700
- Diehl et al. (2022) Alexandra Diehl, Alfie Abdul-Rahman, Benjamin Bach, Mennatallah El-Assady, Matthias Kraus, Robert S. Laramee, and Min Chen. 2022. Characterizing Grounded Theory Approaches in Visualization. 41, 3 (2022). arXiv:2203.01777 http://arxiv.org/abs/2203.01777
- DiMaggio et al. (2013) Paul DiMaggio, Manish Nag, and David Blei. 2013. Exploiting affinities between topic modeling and the sociological perspective on culture: Application to newspaper coverage of US government arts funding. Poetics 41, 6 (2013), 570–606.
- Drouhard et al. (2017) Margaret Drouhard, Nan-Chen Chen, Jina Suh, Rafal Kocielnik, Vanessa Pena-Araya, Keting Cen, Xiangyi Zheng, and Cecilia R Aragon. 2017. Aeonium: Visual analytics to support collaborative qualitative coding. In 2017 IEEE Pacific Visualization Symposium (PacificVis). IEEE. https://doi.org/10.1109/pacificvis.2017.8031598
- El-Assady et al. (2020) Mennatallah El-Assady, Rebecca Kehlbeck, Christopher Collins, Daniel Keim, and Oliver Deussen. 2020. Semantic concept spaces: Guided topic model refinement using word-embedding projections. IEEE Transactions on Visualization and Computer Graphics 26, 1 (2020), 1001–1011. https://doi.org/10.1109/TVCG.2019.2934654 arXiv:1908.00475
- Endert et al. (2012) Alex Endert, Patrick Fiaux, and Chris North. 2012. Semantic interaction for sensemaking: Inferring analytical reasoning for model steering. IEEE Transactions on Visualization and Computer Graphics 18, 12 (2012), 2879–2889. https://doi.org/10.1109/TVCG.2012.260
- Feuston and Brubaker (2021) Jessica L. Feuston and Jed R. Brubaker. 2021. Putting Tools in Their Place: The Role of Time and Perspective in Human-AI Collaboration for Qualitative Analysis. Proceedings of the ACM on Human-Computer Interaction 5, CSCW2 (2021). https://doi.org/10.1145/3479856
- Gauthier and Wallace (2022) Robert P. Gauthier and James R. Wallace. 2022. The Computational Thematic Analysis Toolkit. Proceedings of the ACM on Human-Computer Interaction 6, GROUP (2022), 1–15. https://doi.org/10.1145/3492844
- Gerlach et al. (2018) Martin Gerlach, Tiago P Peixoto, and Eduardo G Altmann. 2018. A network approach to topic models. Science Advances 4, 7 (2018), eaaq1360. https://doi.org/10.1126/sciadv.aaq1360
- Green and Chen (2019a) Ben Green and Yiling Chen. 2019a. Disparate interactions: An algorithm-in-the-loop analysis of fairness in risk assessments. In Proceedings of the conference on fairness, accountability, and transparency. 90–99.
- Green and Chen (2019b) Ben Green and Yiling Chen. 2019b. The principles and limits of algorithm-in-the-loop decision making. Proceedings of the ACM on Human-Computer Interaction 3, CSCW (2019), 1–24.
- Griffiths et al. (2005) Thomas L. Griffiths, Mark Steyvers, David M. Blei, and Joshua B. Tenenbaum. 2005. Integrating topics and syntax. Advances in Neural Information Processing Systems (2005).
- Grimmer and Stewart (2013) Justin Grimmer and Brandon M. Stewart. 2013. Text as data: The promise and pitfalls of automatic content analysis methods for political texts. Political Analysis 21, 3 (2013), 267–297. https://doi.org/10.1093/pan/mps028
- Holland et al. (1983) Paul W. Holland, Kathryn Blackmond Laskey, and Samuel Leinhardt. 1983. Stochastic blockmodels: First steps. Social Networks 5, 2 (1983), 109–137. https://doi.org/10.1016/0378-8733(83)90021-7
- Hyland et al. (2021) Charles C Hyland, Yuanming Tao, Lamiae Azizi, Martin Gerlach, Tiago P Peixoto, and Eduardo G Altmann. 2021. Multilayer networks for text analysis with multiple data types. EPJ Data Science 10, 1 (2021). https://doi.org/10.1140/epjds/s13688-021-00288-5
- Jiang and Brubaker (2018) Jialun "Aaron" Jiang and Jed R. Brubaker. 2018. Tending Unmarked Graves. Proceedings of the ACM on Human-Computer Interaction 2, CSCW (nov 2018), 1–19. https://doi.org/10.1145/3274350
- Jiang et al. (2021) Jialun Aaron Jiang, Kandrea Wade, Casey Fiesler, and Jed R. Brubaker. 2021. Supporting Serendipity: Opportunities and Challenges for Human-AI Collaboration in Qualitative Analysis. Proc. ACM Hum.-Comput. Interact. 5, CSCW1, Article 94 (apr 2021), 23 pages. https://doi.org/10.1145/3449168
- Kim et al. (2020) Hannah Kim, Barry Drake, Alex Endert, and Haesun Park. 2020. ArchiText: Interactive Hierarchical Topic Modeling. IEEE Transactions on Visualization and Computer Graphics 2626, c (2020). https://doi.org/10.1109/TVCG.2020.2981456
- Kivelä et al. (2014) Mikko Kivelä, Alex Arenas, Marc Barthelemy, James P. Gleeson, Yamir Moreno, and Mason A. Porter. 2014. Multilayer networks. Journal of Complex Networks 2, 3 (2014), 203–271. https://doi.org/10.1093/comnet/cnu016 arXiv:1309.7233
- Klein et al. (2015) Lauren F. Klein, Jacob Eisenstein, and Iris Sun. 2015. Exploratory thematic analysis for digitized archival collections. Digital Scholarship in the Humanities 30, October (2015), i130–i141. https://doi.org/10.1093/llc/fqv052
- Lee et al. (2012) Hanseung Lee, Jaeyeon Kihm, Jaegul Choo, John Stasko, and Haesun Park. 2012. iVisClustering: An Interactive Visual Document Clustering via Topic Modeling. Computer Graphics Forum 31, 3pt3 (2012), 1155–1164. https://doi.org/10.1111/j.1467-8659.2012.03108.x
- Lee et al. (2017) Tak Yeon Lee, Alison Smith, Kevin Seppi, Niklas Elmqvist, Jordan Boyd-Graber, and Leah Findlater. 2017. The human touch: How non-expert users perceive, interpret, and fix topic models. International Journal of Human-Computer Studies 105 (2017), 28–42. https://doi.org/10.1016/j.ijhcs.2017.03.007
- McDonald et al. (2019) Nora McDonald, Sarita Schoenebeck, and Andrea Forte. 2019. Reliability and Inter-rater Reliability in Qualitative Research. Proceedings of the ACM on Human-Computer Interaction 3, CSCW (2019), 1–23. https://doi.org/10.1145/3359174
- Miles et al. (2013) M.B. Miles, A.M. Huberman, and J. Saldana. 2013. Qualitative Data Analysis: A Methods Sourcebook. SAGE Publications. https://books.google.com/books?id=p0wXBAAAQBAJ
- Mimno and Blei (2011) David Mimno and David Blei. 2011. Bayesian checking for topic models. EMNLP 2011 - Conference on Empirical Methods in Natural Language Processing, Proceedings of the Conference (2011), 227–237.
- Muller et al. (2016) Michael Muller, Shion Guha, Eric P.S. Baumer, David Mimno, and N Sadat Shami. 2016. Machine Learning and Grounded Theory Method. In Proceedings of the 19th International Conference on Supporting Group Work. ACM, New York, NY, USA, 3–8. https://doi.org/10.1145/2957276.2957280
- Nelson (2020) Laura K. Nelson. 2020. Computational Grounded Theory: A Methodological Framework. Sociological Methods and Research 49, 1 (2020), 3–42. https://doi.org/10.1177/0049124117729703
- Paul and Girju (2010) Michael Paul and Roxana Girju. 2010. A two-dimensional Topic-Aspect Model for discovering multi-faceted topics. Proceedings of the National Conference on Artificial Intelligence 1 (2010), 545–550.
- Peixoto (2019) Tiago P. Peixoto. 2019. Bayesian stochastic blockmodeling. Advances in Network Clustering and Blockmodeling (2019), 289–332. https://doi.org/10.1002/9781119483298.ch11 arXiv:1705.10225
- Steyvers and Griffiths (2010) M Steyvers and T Griffiths. 2010. Probalistic Topic Models. Latent Semantic Analysis: A Road To Meaning 3, 3 (2010), 993–1022. arXiv:1111.6189v1 http://www.sciencedirect.com/science/article/pii/S0140366413001047{%}5Cnhttp://ceas.cc/2004/167.pdf{%}5Cnhttp://doi.acm.org/10.1145/1806338.1806450{%}5Cnhttp://eprints.soton.ac.uk/272254/{%}5Cnhttp://ieeexplore.ieee.org/lpdocs/epic03/wrapper.htm?arnumber=7033160{%}25
- Tversky (1991) Barbara Tversky. 1991. Spatial mental models. Psychology of Learning and Motivation 27 (1991), 109–145.
- Wiedemann (2013) Gregor Wiedemann. 2013. Opening up to big data: Computer-assisted analysis of textual data in social sciences. Historical Social Research/Historische Sozialforschung (2013), 332–357.
- Xie and Xing (2013) Pengtao Xie and Eric P. Xing. 2013. Integrating document clustering and topic modeling. Uncertainty in Artificial Intelligence - Proceedings of the 29th Conference, UAI 2013 (2013), 694–703. arXiv:1309.6874
- Yang et al. (2015) Yi Yang, Doug Downey, and Jordan Boyd-Graber. 2015. Efficient methods for incorporating knowledge into topic models. In Conference Proceedings - EMNLP 2015: Conference on Empirical Methods in Natural Language Processing. Association for Computational Linguistics, 308–317. https://doi.org/10.18653/v1/d15-1037
Appendix A Recipes Dataset
All recipe posts on Simply Recipes (https://www.simplyrecipes.com) were crawled and retrieved on November 8th, 2021. The corpus consists of 2,615 recipes with 14,343 unique words after lemmatization and removal of all words (using the spacy package) except content words (proper nouns, adjectives, adverbs, nouns, verbs). This resulted in 720,292 total edges in the Text layer, with the average document length (node-degree) of 275.45.