Characterizing the Daytime Sextantids Meteor Shower and Unveiling the Nature of the Phaethon-Geminid Stream Complex2021Characterizing the Daytime Sextantids Meteor Shower and Unveiling the Nature of the Phaethon-Geminid Stream Complex–Characterizing the Daytime Sextantids Meteor Shower and Unveiling the Nature of the Phaethon-Geminid Stream Complex
Abstract
The Daytime Sextantids meteor shower, part of the Phaethon-Geminid Stream Complex (PGC), is closely related to the Geminids, currently the strongest meteor shower visible at the Earth. The DSX share a similar orbit to asteroid 2005 UD, but the nature of the association remains unclear. From optical data we find that DSX meteors ablate similarly to Geminids, suggesting that they are also high density and consistent with a common origin. From radar data we have isolated 19,007 DSX orbits through application of a novel convex hull approach to determine stream membership. We find at the peak the mean semi-major axis is near 1 AU, eccentricity is 0.86 and that both decrease as a function of solar longitude. The inclination averages 25 degrees at the peak but increases over time. Noticeable DSX activity extends from solar longitude 173-196∘ with a flux plateau between 186 - 189∘. The peak flux is km-2 hr-1, equivalent to a ZHR of 20. We estimate a true differential mass index for the shower of at the time of peak and an average of for days surrounding the peak. The mass of the DSX stream is estimated to be g, the same order as 2005 UD, suggesting the stream is too massive to have been created by recent meteoroid production from 2005 UD. We propose that the DSX and 2005 UD were created in the same break-up event that created 3200 Phaethon.
Keywords:
meteorites, meteors, meteoroids1 Introduction
The strongest meteor shower currently visible on Earth is the Geminids. Occurring every December, the shower regularly produces in excess of 100 visual meteors per hour at its peak (Rendtel 2014). The Geminids share a close orbital affinity with 3200 Phaethon, suggesting it is its immediate parent (Gustafson 1989; Williams & Wu 1993; Ryabova et al. 2019). Complicating this simple picture, however, is the stream’s dynamical association with several other showers, notably the Daytime Sextantids and Canis Minorids (Babadzhanov 1991).
The discovery of 2005 UD (Ohtsuka et al. 2006) on a near-identical orbit to the Daytime Sextantids and the possible association of Phaethon and 2005 UD with 1999 YC has led to suggestions of the existence of a Phaethon-Geminid Stream complex (PGC) (Jewitt & Hsieh 2006a). Additional puzzles concerning the origin of the PGC include the role of the unusually low perihelion orbit of Phaethon in stream formation, Phaethon’s non-comet-like reflectance spectrum (Licandro et al. 2007) and the comparatively high strength of Geminid meteoroids relative to other meteor showers (Spurný 1993; Borovička 2006).
The Geminid shower’s unusual orbit (high eccentricity, high inclination, and low perihelion distance) is suggestive that Phaethon (or its progenitor) may have originated in the Main Belt (De Leon et al. 2010). An asteroidal origin for Phaethon comes with its own problems, namely the difficulty in forming a stream as massive as the Geminids (Ryabova 2017) from a parent generating minimal ejected dust. While Phaethon has been observed to eject small dust as it undergoes thermal heating at its closest approach of the Sun, this debris is, by orders of magnitude, inadequate to explain the mass of the Geminids (Jewitt et al. 2015).
The Geminids and Phaethon have been studied extensively, but the debate over the cometary vs. asteroidal origin for the Geminids and the existence/origin of the PGC remains unsettled (Ryabova et al. 2019). Due to the recent close approach of Phaeton in 2017, there has been renewed focus on the physical characterization of both Phaethon (Jewitt & Li 2010; Ye et al. 2018; Tabeshian et al. 2019; Huang et al. 2021) and 2005 UD (Kinoshita et al. 2007; Huang et al. 2021; Ishiguro et al. 2022) as well as their relationship to each other (MacLennan et al. 2021; Devogèle et al. 2020; Kareta et al. 2021). However, a major component of the PGC, namely the Daytime Sextantids (DSX), is comparatively unstudied. Few modern measurements of the DSX exist, and no physical properties of the associated meteoroids have been published. The goal of this work is to provide measurements of the DSX orbital parameters, their variation with solar longitude, the shower flux, mass distribution, and physical properties of the DSX meteoroids. Our aim is to contribute constraints to future models of the PGC and estimate the mass of the stream.
The Daytime Sextantids is a moderate-strength annual meteor shower that occurs in late September and early October. This stream is linked to the Geminids through precession, being the pre-perihelion daylight twin of the Geminids (Babadzhanov 1991). The two streams have similar unusual orbits with high eccentricities, inclinations, and small perihelion distances. As with the Geminids and Phaethon, the probable parent body of the Daytime Sextantids stream, 2005 UD, has an unclear origin (Ishiguro et al. 2022). From its discovery, 2005 UD has been linked to the Daytime Sextantids stream on the basis of their orbital similarities and a small orbital evolutionary time lag of years (Ohtsuka et al. 2006).
Some authors have suggested that 2005 UD is a split nucleus of Phaethon. One line of evidence supporting this association is through backward and forward orbital integrations performed by Ohtsuka et al. 2006, which demonstrated that Phaethon and 2005 UD have similar orbital evolution with a time lag of years.
Another line of evidence connecting the two bodies is their similar reflectance spectra (Jewitt & Hsieh 2006a). Both Phaethon and 2005 UD have blue reflectance spectra in the visible, which is rarely found in asteroids. However, Kareta et al. 2021 recently presented the first measurement of 2005 UD in the near-infrared and found that it was not similar to Pheathon’s near-infrared spectrum. Kareta et al. 2021 did not find a suitable alternative mechanism that could explain how the asteroids could have similar orbits and visible-light reflectance spectra and yet have dissimilar near-infrared spectra. More measurements of 2005 UD and Phaethon are needed to clarify the relationship between the two asteroids and their associated meteor streams.
The close orbital and physical relationship suggests that the nature of 2005 UD is intricately linked to Phaethon. Thus in studying 2005 UD via the Daytime Sextantids, we expand our understanding of the nature of Phaethon and the PGC more broadly.
While the Daytime Sextantids’ physical characteristics have yet to be measured, the shower and its orbital properties have been observed for more than 60 years. The first detection of the Daytime Sextantids was made in 1957 by Weiss 1960, who conducted a two-year radio survey. Weiss originally called the DSX the Sextantids-Leonids shower. Unfortunately, only one part of the radar was in service during the main DSX shower activity period, so the DSX radiant measured by Weiss contained significant biases.
The Daytime Sextantids were initially thought to be periodic in nature. There was no evidence of the DSX before Weiss’ study, and a meteor survey in 1960 by Kashcheyev & Lebedinets 1967 did not detect the shower. It was not until 1961 that the Daytime Sextantids were detected again by Nilsson 1964 during a radio survey in the southern hemisphere. Nilsson suggested the seemingly periodic nature of the DSX, referencing the fact that it was not detected in earlier surveys made in both hemispheres. Nilsson was also the first to connect the Daytime Sextantids stream to the Geminids due to their orbital similarities.
The stream was again detected during the Harvard Radio Meteor project survey (Sekanina 1976), as one of a total of 275 streams reported during the 1968-1969 survey. The next DSX detections were not made until almost three decades later by the Advanced Meteor Orbit Radar (AMOR) (Galligan 2003). More recently, radar measurements of the stream have also been reported by Brown et al. 2008; Brown et al. 2010 using the Canadian Meteor Orbit Radar (CMOR), by Younger et al. 2009 using Southern hemisphere meteor wind radars, and by Pokorný et al. 2017 using the Southern Argentina Agile Meteor Radar (SAAMER).
Despite being a daytime shower with a radiant only 30∘ from the Sun, some optical meteors of the shower are detectable in the hour before local sunrise near the peak time. Some optical DSX orbits have been reported by the Cameras for All-Sky Surveillance project (CAMS) (Jenniskens et al. 2016b), by the SonotaCo network (Sonotaco 2009), and by the Global Meteor Network (Vida et al. 2021), among others. Rudawska et al. 2015 identified ten DSX meteors in the EDMOND database using a D-criterion approach.
Here we examine the flux profile, radiant drift, and orbital element variation with solar longitude together with the mass index of the DSX using CMOR radar observations. Additionally, we measure the apparent bulk strength of DSX meteoroids relative to the Geminids using optical data collected by the GMN.
Table A1 and A2, found in Appendix A in the supplementary materials, summarize literature measurements of the radiant and orbital elements of the Daytime Sextantids meteor shower both from radar and optical instruments. Our measurements (described later) are also shown for comparison.
The present study of the DSX is particularly timely as the Japan Aerospace Exploration Agency (JAXA) will launch the DESTINY+ mission in 2024 to rendezvous with Phaethon and (possibly) 2005 UD. This mission aims to provide a deeper understanding of the Phaethon-Geminid complex. It is vitally important that all components of the complex: the Geminids, Phaethon, 2005 UD, and the Daytime Sextantids, are measured and as fully characterized as possible to aid in the analysis of the data measured by DESTINY+. Of these components, the Daytime Sextantid meteor shower is by far the least characterized and therefore the focus of our study.
2 Equipment
2.1 The Canadian Meteor Orbit Radar (CMOR)
Our radar data is derived from CMOR (the Canadian Meteor Orbit Radar), which is comprised of three five-element interferometric backscatter radars located in Tavistock, Ontario. The three radar systems are synchronized in transmission and receiving and operate using three different frequencies: 17.45 and 38.15 MHz with a peak power of 6 kW, and 29.85 MHz with a peak power of 15 kW. CMOR is an all-sky radar able to detected echoes in virtually all directions except for meteors located lower than 20∘ above the horizon, which are rejected due to higher measurement errors. A detailed description of the CMOR system is provided in Jones et al. 2005, Brown et al. 2008, and Brown et al. 2010. Here we provide a brief overview of CMOR pertinent to the DSX data collection.
CMOR uses SKiYMET software to calculate the time of occurrence, interferometric position in the sky, range, height, decay time, and maximum amplitude of meteor echoes (Hocking et al. 2001). Additionally, the 29.85 MHz radar system has five remote outlying stations. The interferometry from the main site, coupled with the measured time delays from the remote sites, allows the velocity vector to be calculated. This velocity calculation is referred to as the time-of-flight (TOF) method. CMOR’s 29.85 MHz system uses the velocity vector to calculate the meteor’s orbit, and this calculation can be applied to meteors with magnitudes as low as , which roughly corresponds to a mass of kg at DSX in-atmosphere speeds of 35 km/s.
This study calculates the radiant and orbital parameters of the Daytime Sextantids shower using data collected from the multi-station 29.85 MHz system. The DSX mass index and flux calculations require the inclusion of low amplitude meteors, making the use of the single-station station meteor echoes more appropriate. For single station echoes velocities cannot be computed; instead we use the pre-t0 speed technique (Mazur et al. 2020), where the meteor echoes rate of change of phase is used to calculate the speed to help select shower members.
2.2 Optical Instruments
For optical measurements of the DSX we make use of the distributed stations of the Global Meteor Network, described in Vida et al. 2021. The GMN is a citizen science project made up of a collection of CMOS video meteor cameras owned and operated by members of the public. Meteor trajectories are computed by correlating common observations and applying a strict set of quality filters which allow this procedure to be automated, and orbits are computed using the method of Vida et al. 2020a.
The GMN uses consumer-grade Internet Protocol (IP) cameras based on inexpensive low-light Starvis Sony CMOS sensors paired with Raspberry Pi single-board computers which perform data collection and processing. Typical GMN cameras have fields of view of order 50∘-90∘, limiting stellar magnitudes around +6 and operate at 25 frames per second. Currently, the GMN has over 600 cameras in 35 countries which allow 24/7 meteor monitoring in both hemispheres.
3 Observational Results : Radar
3.1 Wavelet Measurement of the DSX Radiant
To isolate the DSX radiant from the background of meteor radiants detected by CMOR, we first use a three-dimensional wavelet transform, following the process in Brown et al. 2008. In practice, the radiant of a meteor shower at a particular time is an overdensity in the local number of individual radiants in three dimensions: Sun-centered geocentric ecliptic longitude (), latitude , and the geocentric speed of the shower . The use of this coordinate system minimizes the drift in the radiant as it accounts for the movement of the Earth around the Sun.
A three-dimensional wavelet transform applied in one-degree time windows of solar longitude on CMOR-measured meteor radiants has been found to be effective at discerning meteor shower radiants from the sporadic background (Brown et al. 2010). When the wavelet is applied across the radiant distribution, regions where there is a higher concentration of meteor radiants are easily isolated as given by the location of the maximum wavelet coefficient (Galligan 2000).
The mother wavelet function that is best suited for meteor shower radiant searches is the Ricker wavelet:
| (1) |
where is the wavelet coefficient, is the velocity probe size measured in km s-1, is the angular probe size measured in degrees, is the geocentric velocity, and and are the spatial coordinates, and , respectively.
The raw wavelet coefficient indicates the relative local concentration of radiants, but this is affected by the relative density of the local sporadic meteor radiant background. To more robustly define the strength of the shower relative to the general sporadic background, the excursion of the wavelet coefficient in units of standard deviations () above the median average wavelet value at the same sun-centred radiant location across the entire year is used (Brown et al. 2008), a value termed xsig or .
The signal strength produced by the wavelet transform is dependent on defining the characteristic scales, and , for each dimension of the wavelet. The size of the probes should reflect both the natural spread of the actual radiant distribution and the spread caused by the instrumental uncertainty in the radiant measurements. Hence, to optimize the wavelet analysis requires some a priori knowledge of these characteristic scales. For this reason, we perform the wavelet analysis in a two step process. This is done by first establishing the approximate radiant location for the shower and then computing the optimal probe sizes for the shower of interest at the time of maximum.
3.2 Optimizing the Velocity and Angular Probe Size
The CMOR radiant measurements being used in this study were collected between the years 2011 and 2019 and comprise 19.6M orbits. For this application, we aim to maximize the shower signal, so following the original approach of Galligan 2000, all years are combined and binned temporally into one-degree solar longitude windows, producing a stacked "virtual year."
In the first stage, an initial run of the three-dimensional wavelet transform using the Ricker wavelet equation is applied to the stacked virtual year. The wavelet probe sizes were fixed to a default velocity probe size of 10% of the velocity and an angular separation probe size of 4∘. These probe sizes have been empirically found to provide reasonable results for most meteor shower radiants as determined in Brown et al. 2008.
From this initial wavelet analysis, the radiant location of the shower and its approximate time of peak activity is determined, following the approach described by Bruzzone et al. 2015. In the next stage, the wavelet probe sizes are optimized specifically for the DSX. To accomplish this optimization, the velocity and angular probes sizes at the radiant location at the time of shower maximum are incremented in small steps to determine which combination of probe sizes produces the best signal-to-noise ratio for the shower as defined by the maximum xsig value.
Figure 1 and Figure 2 show the variation in wavelet coefficient and xsig as a function of probe size, respectively. From Figure 2 a best estimate for the optimal angular probe size for the DSX is 3.10∘ while the optimal velocity probe size is 0.16Vg. We use these values for all later wavelet analysis.
Using these optimal probe sizes, the wavelet coefficients vs. solar longitude at the sun-centred radiant location of the DSX at its time of maximum activity is shown in Figure 3 while Figure 4 shows a plot of the corresponding xsig values.


3.3 Wavelet Radiant-drift
Using our optimal probe sizes, we applied the wavelet transform on the subset of CMOR radiants measured between 2011-2020 near the time of DSX activity in a large region around the sun-centred radiant. Specifically, we examined the solar longitude interval from 159-205∘ to search for localized radiant maxima in the radiant interval , and in the velocity range .
We applied the three-dimensional wavelet transform on the DSX meteor distribution and found the local maximum per degree solar longitude in ecliptic longitude, latitude, and geocentric velocity. We were then able to link these maxima together and associate them with the DSX shower, based on the radiant ephemeris as given in Brown et al. 2010. The final wavelet-based radiant ephemeris is shown in Figure 5. There is a distinct inflection in the drift near =193∘, suggesting either possible confusion with a background source or significant change in the stream properties in the latter part of its activity window.
 |
 |
 |
3.4 A New Meteor Radiant Selection Methodology applied to the DSX
The wavelet approach is a good statistical estimate of the mean shower radiant, but it does not permit direct association of any single meteor radiant to a shower.
As a result, contamination from sporadic meteors complicates the wavelet-based analysis of meteor showers. The difficulty in removing the sporadic meteors from the meteor shower radiant distribution lies in how well the meteor shower radiant space is defined. Ideally, such a radiant space should objectively define which individual meteors are members of the meteor shower and which are not at some confidence level.
A common technique is to use an orbital dissimilarity criterion, such as the D-criterion, to serially associate members of a stream (Williams et al. 2019). This approach is dependent on defining an acceptance threshold, which often is subjective and frequently does not account for the local background population near a shower radiant (Neslušan & Hajduková 2017).
Another approach to defining a meteor shower is to select an acceptable range in each of the observed radiant parameters (), , and . These ranges are used to enclose the shower radiant such that the meteors contained within all three parameter ranges are considered to share the same radiant with the meteor shower. In practice, this traditional method assumes that the radiant space of a meteor shower can be roughly modeled as a rectangular prism, as defined by the acceptable parameter ranges, which are usually chosen subjectively. Ideally, we would define this radiant space as being statistically more populated than the background.
The radiant space of a shower is generally ellipsoid-shaped, as can be seen in the clustering of meteor radiants in Figure 6. The issue with the traditional method is that it assumes that the dimensions of the parameter space are linearly independent. However, the geocentric velocity directly depends on the radiant angular distance from the apex (Vida et al. 2020b), a measure derived from the other two angular coordinates. Furthermore, by defining the cuts independently, the chosen shower radiant space may not match the actual clustering of the radiant distribution and may cause the introduction of sporadic contamination by radiants located in the edges of the rectangular-prism-shaped radiant space. The measurement of the radiant space of a meteor shower can be improved to better select only the shower meteors if no assumptions about its shape and dimensional independence are made. Instead, a threshold for radiant density as set by the background levels is a better measure of shower spread. We can then define the radiant space with varying degrees of statistical significance.
3.4.1 The Convex Hull Radiant Space Method
To identify specific radiants for a particular shower, we present a new meteor selection method to objectively define the radiant space of a meteor shower. This method (termed the convex hull approach) finds radiants within a shower radiant space determined to be members with a confidence level of 95% relative to the background population. This new method relies on a sufficiently large dataset to define the sporadic background contamination, improving the accuracy of the meteor shower radiant identification. The convex hull approach uses a series of statistical steps to remove the contamination of sporadic meteors to better isolate the shower population.
The meteor radiant distribution is defined in the three dimensions of (), , and . An example of such a radiant distribution for solar longitude 189∘ (near the DSX activity peak) is shown in Figure 6. Each point in the figure represents the radiant of an individual meteor echo detected by CMOR. Lower-quality meteor echo observations, with radiant uncertainties greater than one degree, have been removed from the distribution. This distribution is then converted into a 3D number density matrix by dividing the three-dimensional space into 888 cubes called voxels. Each voxel approximately covers a range in sun-centered ecliptic longitude and latitude of 3.75∘ and 4.38∘, respectively, and a geocentric velocity range of 2.88 km/s. The number of meteor radiants contained within each cube of radiant space is then measured.
An example voxel plot for the DSX is shown in Figure 7 for solar longitude 189∘. Each voxel represents one of the cubes in the divided 888 meteor distribution, and both the color and transparency of each voxel represent the number of meteors contained within it. Voxels that contain no meteors are transparent. Note that the goal of the Convex Hull approach is to isolate the edges of the shower radiant, not to precisely identify the core location (which is done well with the wavelet approach). As a result relatively large voxels are used to improve statistics.


The average sporadic background density matrix must first be calculated before the DSX meteors can be separated from the sporadic meteors. The average of multiple background days is used to provide good number statistics. The background meteor radiant distribution is created by combining all meteor observations made in five solar longitude bins before the beginning of the DSX shower (160∘-164∘) and five solar longitude bins after the end of the DSX shower (210∘-214∘). We assume the sporadic radiant distribution is constant within our chosen radiant space window in sun-centred coordinates over the entire 54 day interval .
In the first step of sporadic contamination removal, we subtract the DSX number density matrix from the average background number density matrix. After subtraction, we take the background matrix’s standard deviation and remove any DSX voxel less than three standard deviations above the number of meteors in the corresponding background voxel. Only voxels that contain more than four meteors are kept. This additional requirement was chosen to improve the isolation of the shower core. After this removal step, the voxels which remain are shown in Figure 8 for solar longitude 189∘.

To further separate the DSX meteors from the sporadic background meteors, we take the remaining voxels and extract the set of meteors with radiants contained within them. Next, we compare those meteor radiants with the wavelet-generated radiant. For each meteor to remain as a possible DSX member, its radiant must be within three standard deviations of each of the (), , and distributions, centered on the wavelet-generated radiant, where the standard deviation is calculated from the total meteor radiant distribution. The remaining radiants are considered members of the Daytime Sextantids, with a confidence level of 95%.
The convex hull approach defines the DSX radiant in three-dimensional space, properly accounting for the dimensional dependence of the parameters. We calculate the smallest convex shape that contains all the DSX meteor radiants in the three-dimensional space to accomplish this. This shape, called the convex hull, can be used to identify DSX meteor radiants in other surveys which have similar measurement accuracy. The convex hull for the DSX shower for solar longitude 189∘ is shown in Figure 9. Figure 10 shows the convex hull overlaid on top of the total meteor radiant distribution to demonstrate how the convex hull captures the core of the shower. The convex hull method detected the DSX shower from solar longitude 173∘ to 196∘. A complete set of convex hull diagrams as a function of solar longitude for the duration of the DSX shower is given in Appendix B in supplementary materials.


The 888 number density size was chosen empirically by repeating this process using different number density sizes. This size was found to produce the most stable convex hull volumes per solar longitude and so was chosen as a suitable size for our dataset.
It is important to note that the convex hull method fails when the strength of the shower approaches the relative strength of the average sporadic background, which typically occurs near the wings of the meteor shower. This breakdown occurs because there are not enough meteors that pass the 95% confidence limit when the shower strength is weak. The convex hull method performs best during the peak of the meteor shower when the strength of the shower is significantly greater than the strength of the average sporadic background.
We also investigated an alternative, more robust convex hull calculation. The convex hull method explored in this section models meteor radiants as discrete points in radiant space. However, radiants contain measurement uncertainties and are more realistically modeled as three-dimensional probability distributions in radiant space. We explored the effect that this change makes on the convex hull results and found no significant difference in the results. We conclude that the more computationally simple convex hull method models the meteors well, and the alternative convex hull method is not a necessary change. A more in-depth discussion of the alternative convex hull method and a comparison of the results can be found in the Supplementary Materials.
3.4.2 Comparing the convex hull to the 3D wavelet approach
This section will explore the differences between how the wavelet and convex hull approaches define the radiant of a meteor shower and how these differences affect the kind of information we can extract.
The wavelet transformation searches through a complicated meteor distribution and identifies the region of the highest meteor density. The radiant of a meteor shower is defined as a single set of numbers in ecliptic longitude, latitude, and geocentric velocity space. However, in representing the radiant as a single set of numbers, much of the information about the clustering of radiants that make up the shower is lost.
The convex hull approach aims to capture as much information about the shower’s radiant as possible. The convex hull uses the wavelet approach first to identify the location of the shower. Then it expands on the information gained by the wavelet approach by identifying the three-dimensional geometric extent of the shower radiant in ((), , ) space. In doing so, the convex hull can determine the shower association for individual meteor radiants, a feature unique to the convex hull approach. This radiant identification isolates the shower meteors and reduces the amount of sporadic contamination in subsequent calculations.
Both methods produce similar orbital elements and radiants of the meteor shower stream, but the convex hull approach can take the 3D spread of the shower radiant into consideration when calculating the uncertainty of the average stream orbit, unlike the wavelet approach. Figures 11 and 12 show a comparison between the average stream orbits calculated by the wavelet and convex hull for each solar longitude of the meteor shower. Note that part of the difference in the mean elements is a small difference in the deceleration correction used between the wavelet data and the single radiants in the convex hull approach, though this systematic difference is within the uncertainty of the convex hull distribution.


 |
 |
 |
 |
3.5 The DSX Mass Index
In addition to a shower’s variation of orbital elements with solar longitude, another diagnostic shower characteristics which is important in understanding a stream’s origin and evolution is its mass distribution.
As the Daytime Sextantids meteor shower occurs primarily during the day, observations are made primarily using radar rather than optical cameras. An indirect measurement of the size distribution of meteoroids in the DSX stream can be made using radar by calculating the mass index of the shower from the distribution of shower echo amplitudes. This quantity is also needed to calculate other fundamental shower properties, such as flux.
The physical significance of the mass index can be illustrated by comparing the mass index of the shower and sporadic meteor populations. The mass contained in meteor shower streams tends to be more concentrated in larger particles, which corresponds to shower populations having a differential mass index below 2. In contrast, the mass distribution of the sporadic meteor population tends to be distributed more heavily in smaller particles rather than larger particles. This size distribution corresponds to a mass index greater than 2. For example, Blaauw et al. 2011 found that the average mass index for sporadic meteors is 2.17 0.07. Meteor populations with a mass index of exactly 2 would have equal proportions of mass distributed in both large and small particles.
Meteor observations made with radar cannot be used to measure a meteoroid’s mass directly. However, it is possible to use the amplitude of the returned meteor echo as a proxy for meteoroid mass, as discussed in Blaauw et al. 2011. With this approximation we can compute the mass index of the Daytime Sextantids. Here we follow the process introduced in Pokorný, P. & Brown, P. G. 2016.
The mass distribution of a meteoroid population is normally assumed to follow a power law of the form:
| (2) |
where is the cumulative number of meteoroids with mass greater than , and is the differential mass index. The power-law nature of the mass distribution allows us to use the logarithmic plot of the cumulative number distribution vs. amplitude to determine the mass index of the meteor population. For the underdense region of the plot, the slope is equal to and can be identified in Figure 14 as the straight portion of the plotted values.
For underdense meteors, the amplitude of the returned echo is proportional to the electron line density of the meteor trail, which is in turn proportional to the mass of the meteor (Ceplecha et al. 1998, ;). For overdense meteors the power received is proportional to q0.5. In Figure 14, the region of overdense echoes is located to the right of the underdense region where the amplitude distribution shows a steep roll-off since , with a transition region between the underdense and overdense regions. The left side of the plot shows a rollover from the straight underdense region as the limiting sensitivity of the radar is approached and echoes missed.
In practice, measuring the mass index of a shower from radar amplitude distributions involves isolating individual echoes belonging to the shower and then applying an algorithm to measure the straight-line portion of the resulting cumulative number - amplitude plot. However, how the boundaries of this straight portion are chosen can significantly affect the calculated slope value. For example, if the start and endpoints of the straight region are chosen by hand, different slopes are found by different analysts for the same data.
A demonstrated solution to this issue is to use the Multinest algorithm (Pokorný, P. & Brown, P. G. 2016). Multinest is a Bayesian inference tool that determines the ideal boundaries of the straight region of such a plot. It can be used to objectively calculate mass index and uncertainty. Although, it should be noted that an assumption incorporated into Multinest is that the sporadic population before and after the shower can be used to approximate the sporadic background throughout the shower duration. The mass index calculations which follow for the Daytime Sextantids use the implementation of the Multinest program as discussed in Dewsnap & Campbell-Brown 2021.
A challenge, even using Multinest, in calculating the mass index of a meteor shower is that there must be a good straight line in the logarithmic plot of the cumulative count vs. amplitude, as shown in Figure 14. However, CMOR’s multi-station orbital data system requires a good signal on several remote stations and, for this reason, is biased against detecting the weakest and smallest echoes. This filtering causes the range in mass between the limiting mass of the orbital data observations and the overdense roll-off to be too small to obtain a meaningful straight line fit.
Unlike multi-station data, single station 29.85 MHz CMOR data contains observations of weaker echoes, although these detections cannot be used for orbital data. The single station CMOR data also contains a larger number of echoes. For example, the number of single-station echoes made between 2011-2020 at solar longitude 189∘ is 143,576, but the number of these with multi-station observations is only 43,554.
Single-station CMOR meteor echo observations do not contain unique radiant measurements, but do contain the direction to each echo obtained through interferometry. They also contain speed estimates through measurement of the phase change prior to the specular point, termed pre-t0 speeds. Here we use the algorithm described in Mazur et al. 2020 to estimate pre-t0 speed. Because of the specular reflection condition for backscatter echoes, the radiant is known to be located in a band of sky 90∘ from the observed echo direction (Jones & Jones 2006). Because of this, the shower meteors cannot be filtered using the new meteor selection method described in detail earlier, which requires exact radiant information. Instead, we determine which meteors are potential members of a meteor shower using echo location and selecting those which are at right angles to the apparent radiant as estimated from the wavelet-generated ephemeris and which fall within a speed window about the nominal shower value.
The velocity filter used to calculate the DSX mass index is 8%, meaning that only meteors with velocities within 8% of the wavelet-generated velocity of the peak shower day pass through this filter. The angular separation filter is 3.5∘, meaning that only meteors with observed directions within 3.5∘ of right angles to the shower radiant pass through this filter. The latter value is chosen to account for measurement error in the interferometry for weaker echoes. Individual meteors must pass through both the velocity and angular separation filter to be considered members of the meteor shower. Section 3.6 provides an in-depth discussion on how these filters have been chosen.
At this stage, the single station meteor echo dataset contains only the possible shower meteors determined by the velocity and angular separation filters. Next, we analyze this dataset using the Multinest implementation described in (Dewsnap & Campbell-Brown 2021). We use only the solar longitude range 185∘ - 190∘ surrounding the peak of the DSX due to the higher level of sporadic contamination in the wings of the shower. This contamination effect can be seen in Figure 13, where the outer wings of the shower have higher mass indices, characteristic of the sporadic meteor population. The outer wings also have lower number of shower meteors. The Multinest fit around the peak is shown in Figure 15 and the Multinest fit over the entire duration of the shower is shown in Figure 14.


3.5.1 Mass Index Refinement Using a Mixing Model
The meteor filtering method used to separate shower meteors from sporadic meteors is not stringent, and thus it allows a considerable number of sporadic meteors to contaminate the final mass index calculation of the meteor shower. This contamination tends to cause the calculated mass index of the shower to be artificially raised from its actual value because sporadic meteors tend to have higher mass indices than showers. To address this problem, we have developed a mixing-model method to minimize the effect of sporadic contamination using the Multinest mass index calculation approach.
Prior to the Multinest analysis, the sporadic meteor population undergoes the same filtering process as the shower. For the DSX analysis, the average number of single station sporadic meteor echoes that pass the filtering per solar longitude day is 285 meteors between solar longitudes 165∘-170∘ and 200∘-202∘. Assuming no time variation of the sporadic sources, we suppose that a similar number of sporadic meteors per day are "mixed" with the filtered DSX meteor population.
The mixing model simulated two meteor populations using the equation . The first simulated population represents the sporadic meteor population, which contains an average of 285 meteors per solar longitude day. The simulated sporadic population is given a mass index equal to the sporadic mass index calculated by Multinest, which approximates the sporadic background using the solar longitudes 165∘-170∘ and 200∘-202∘. The second meteor population is an ideal shower population, containing only shower meteors and with no sporadic contamination. The number of meteors in the idealized meteor population is equal to the number of shower meteors that pass the filters in the Multinest analysis minus the average number of sporadic meteors. The mass index of the simulated shower population is iterated from 1.5 to 2.5 in steps of 0.1. For each iteration, this shower population is combined with the simulated sporadic population, and Multinest is used to calculate the mass index of the combined population. An example of the populations used in the mixing model is shown in Figure 16, where the shower population has a mass index of 1.70, as an example.
Next, we take the observed mass index during the DSX shower, calculated by Multinest, and we determine which mass index of the idealized simulated meteor shower produces the measured DSX mass index when mixed with the known sporadic mass index. The mass index of the best fit shower population is then taken to be the true mass index of the DSX shower, corrected for sporadic contamination. Using the mixing model, we calculated a contamination-corrected mass index of at the peak of the DSX, with an average of measured over solar longitudes .
3.5.2 Mixing Model Uncertainty
While multinest outputs formal uncertainty values for fits of the mass index, application of the mixing model introduces another source of uncertainty. To account for this we calculate the associated uncertainty using a Monte Carlo approach.
Our method is to first generate a simulated shower meteor population modeled as a Gaussian distribution in , using the Multinest-calculated mass index as the mean of the distribution and the averaged uncertainty of the Multinest output as the standard deviation. The same process is done to generate a sporadic population. These Gaussian distributions represent the spread of the individual populations extracted from the Multinest calculation uncertainty.
Next, 1000 realizations are performed where a random value is sampled from both the shower and sporadic Gaussian distributions. These are then normalized to the number of shower and average number of sporadic meteors that pass filtering. The final aggregate distribution then has a combined Multinest-calculated mass index and uncertainty produced. The standard deviation of the resulting set of 1000 contamination-corrected mass indices is taken as the total uncertainty in the mixing model mass index calculation.
 |
 |
3.5.3 Defining When the Mixing Model Can Be Applied
The mixing model is sensitive to the ratio of shower to sporadic meteors. It is most useful when there are many more shower meteors than sporadics as is generally the case around a shower’s peak. The mixing model assumes that we can approximate the sporadic background by averaging the meteor population before and after the shower, when shower contamination to the sporadic background is minimal. This assumption is valid only when the strength of the shower is much less than the strength of the sporadic background. Additionally, we expect small variations in the sporadic mass index during the time of the shower so any mixing model estimate that is very sensitive to the absolute mass index of the sporadic background is more prone to systematic uncertainty.
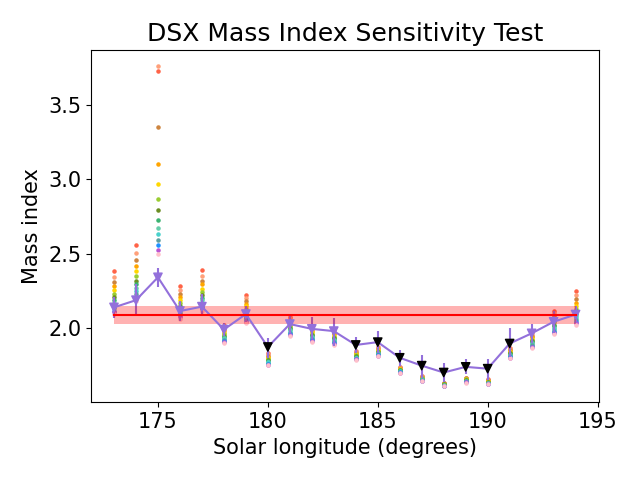
To quantify the validity range of the assumption of constant sporadic mass index, a sensitivity analysis was performed across the activity period of the DSX. The goal of the sensitivity test is to determine time intervals when the corrected mass index is particularly sensitive to small changes in the sporadic background. We repeated the mixing model Monte Carlo runs using different mass indices for the sporadic background, ranging from the largest observed value, 2.23, to the lowest observed value, 2.10, of the sporadic background days before and after the shower. DSX solar longitude days that do not show much variation in the final resulting shower mass index values are chosen as appropriate candidates for the mixing model.
We chose a variation limit of 0.1, as this is the size of the variance in mass index observed in the sporadic background by CMOR over the time interval of the shower (Pokorný, P. & Brown, P. G. 2016). Any day showing more variation than 0.1 in the mixing model interpreted shower mass index is considered an unsuitable candidate for the mixing model. For those days, the mixing model cannot be reliably corrected for sporadic contamination. A plot of the sensitivity test results is shown in Figure 17. We found the solar longitude days from 184 - 191 produced reliable mass indices for the Daytime Sextantids based on this criteria and using the mixing model corrections.
 |
 |
3.6 Optimizing Single Station Echo Filters for the DSX Shower
The usual shower filtering for CMOR uses a default value of for the radiant filter and 10% for the velocity filter in selecting single station echoes associated with a meteor shower (Brown et al. 2008). We now investigate how different choices of these filters affect the mass index of the DSX and introduce a more robust method for determining which filter is appropriate for a given shower.
Choosing an appropriate filter is challenging. Small filters are more stringent and remove a significant number of sporadics but at the expense of many meteors that are members of the shower. Larger filters increase the total number of meteors, leading to good Multinest fits, but at the expense of increased sporadic contamination. The optimal filter choice should maximize the shower/sporadic ratio.
To define this optimal filter, we first investigated how different filters affect the calculated mass index of the shower. To do this, we varied the radiant filter from 1∘ to 8∘ and the velocity filter from 5% to 20%. Velocity filters below 5% resulted in too few echoes and caused an error in the Multinest code and were therefore not used in this investigation. The mass index, corrected using the mixing model described in Section 3.5.1, is calculated for each possible filter combination. Additionally, the same filters were used to calculate the mass index of the sporadic background, and the solar longitudes before and after the shower were used.
The mass index of the sporadic background is taken from mass index fits of all echoes. Figure 18 shows the mass index resulting from different radiant and velocity filters. The colored regions in the contour plot represent the calculated shower mass index value using the mixing model. The labelled dark contour lines represent the mass index of the sporadic background computed using the same radiant/velocity filters.

From Figure 18, the mass index of the DSX shower is lower for smaller filters and higher for less stringent filters, as expected, since the larger filters allow more sporadic meteors to contaminate the sample and raise the mass index. At radiant filters less than 3∘, the mass index value of the sporadic background shows large variances and has larger mass index values. This is likely due to the small number statistics and poor Multinest fits.
The filters in the lower-left corner of Figure 18 produce the smallest DSX mass indices. However, these filters are so stringent that many DSX meteors are rejected along with the sporadic meteors, leading to poor Multinest fits. To evaluate which filters reject the most sporadic meteors without removing too many DSX meteors, we do a chi-square test on the Multinest fits of each radiant and velocity filter combination. For each filter combination, the Multinest-fitted straight line is compared to the actual data and the fit is evaluated using a chi-square test. A contour plot of the chi-square test results is shown in Figure 19. Figure 20 shows a contour plot of the Multinest uncertainties, which can be used as a rough measure of the quality of the Multinest fit.


From Figures 18 we see that the shower mass index changes relatively slowly as a function of the filter size at mid range values (3∘-6∘ and 0.08-0.15 %) where the measured mass index difference is of order 0.1 or less. The DSX shower radiant has some extent, and therefore the radiant filter must accommodate that natural spread.
To estimate this spread, Figure 12 shows the ecliptic latitude and longitude values per solar longitude calculated using the convex hull method. The uncertainty in the radiant values is around 2∘, including observational uncertainty and physical spread, so the radiant filter best suited for the DSX shower should also be larger than 2∘. Looking at Figures 18, 19, and 20, the filter which combines the lowest mass index, Multinest chi-square result, and Multinest uncertainty, and which is also above the uncertainty limits from the convex hull and interferometry error, is a velocity filter of 8% and a radiant filter of 3.5∘. This filter combination rejects the most sporadic meteors without rejecting so many DSX meteors that number statistics are compromised.
It is important to note that although this filter combination selection method provides a more robust approach, the final mass index values for each solar longitude does not vary significantly when slightly different filters are used. Figure 18 demonstrates the mass index changes for each filter combination; note the variation is within the uncertainty ranges.
Our initial filter choice of 5∘ and a velocity filter of 10% in fact produces very similar values to our optimal filters. After determining which filter best suits the DSX meteor shower, we redid the mass index and flux calculations using this new filter of 3.5∘ for the radiant filter and 8% for the velocity filter. All results discussed in this paper have been made with this new filter.
3.7 Average DSX Flux
Accurate measurement of the mass distribution of a meteor shower is a critical first step to estimating the flux of shower meteors. The flux calculation requires the inclusion of low-amplitude meteors, so we use the single station observations from the 38 MHz system instead of the orbital observations from 29 MHz. CMOR’s 38 MHz system is more stable than the other systems, as determined by Campbell-Brown 2019, because the equipment has not undergone any upgrades, and it is not subject to terrestrial noise which affects the 17 MHz system. To estimate an average DSX flux we include single station meteor observations recorded by the 38 MHz system between the years 2002 to 2021.
We calculated the flux of the Daytime Sextantids using the best estimate of the mass index of the DSX from our mixing model approach as discussed in Section 3.5.1. This produces an average mass index of for the DSX peak between solar longitudes 180∘-190∘. We follow the process described in Dewsnap & Campbell-Brown 2021 to calculate the average flux and activity profile of the DSX shower.
However, we have modified one aspect of the process of Dewsnap & Campbell-Brown 2021 to allow us to incorporate the results of the convex hull meteor selection method, described in Section 3.4.1. The radiant of a meteor shower drifts throughout the duration of the shower. To account for this, the flux code used in Dewsnap & Campbell-Brown 2021 updates the radiant location but applies a linear radiant drift model, calculated by fitting the wavelet radiant values. The convex hull method calculates the new radiant of the DSX for each solar longitude of the shower. Instead of updating the radiant location with the wavelet-calculated radiant drift, we use the convex hull radiant positions, which have a confidence level of 95%, for each solar longitude day. The flux profile for the Daytime Sextantids is shown in Figure 21, using data from the 38.15 MHz radar.
Note that our resulting DSX fluxes have the sporadic background subtracted. The peak flux of 20.0510-3 meteoroids km-2hour-1 is reached at solar longitude 187∘-188∘ and results in an equivalent ZHR of 205 for our measured mass index. This is to a limiting radar magnitude of +6.5 which, at DSX speeds using the mass-magnitude-velocity relation of Verniani 1973, is 210-7 kg. This corresponding to meteoroids with diameter of approximately 0.5 mm. A density of was used to estimate the diameter and a spherical shape was assumed.
Adopting a logarithmic model for the flux profile fit to the shower activity as first proposed by (Jenniskens 1994), the DSX activity curve without background subtraction has a B+ slope of 0.06 before the peak and a B- slope of 0.11 after the peak. For comparison, the B+ and B- slopes measured in Moorhead et al. 2019 are 0.063 and 0.167 respectively.


4 Results: Optical
As the radiant of the Daytime Sextantids is located near the sporadic Helion source, the vast majority of DSX meteors occur in daytime. However, a small number of DSX meteors have been observed just before sunrise and thus may be detected with optical instruments.
As the main motivation of our study is to better understand the broader Phaethon-Geminid Stream Complex through characterization of its least studied member, the Daytime Sextantids, comparison to the associated but much better studied Geminid meteor shower is desirable. Optical DSX meteor observations allow us to directly compare the GEM and DSX optical ablation parameters and make comparisons about the relative physical characteristics of the two meteor showers, such as their bulk strength. This comparison can be used to better define the relationship between the GEM and DSX meteor showers in a way that has not been done before.
The optical DSX meteor data we use were recorded by cameras belonging to the Global Meteor Network (GMN). From GMN observations between 2019-2021, we identified a total of 38 DSX meteors. The initial association with the DSX shower was made following the shower association procedure described in Vida et al. 2021. To confirm that these meteors are members of the DSX shower, we took the radiant of every meteor in the GMN database during the DSX shower duration and checked if it was located within the radiant space inside the convex hull for the corresponding solar longitude day as determined earlier from CMOR measurements. Of the original 38 meteors identified as DSX by the GMN, two additional shower members were added, and seven were rejected, leaving 33 that were taken to be real DSX members. Of these 33 DSX meteors captured by the GMN, 13 meteors qualify as good candidates for optical analysis as they had complete lightcurves. These 13 fully observed DSX meteors are used for our subsequent analysis of ablation characteristics.
To perform the optical analysis each multi-station meteor observation was manually analyzed using the SkyFit program (Vida et al. 2018). SkyFit allowed astrometric and photometric calibrations to be done for all cameras. After each calibration we extracted the apparent light curve and position of the leading edge of the meteor from the video frames. The trajectories were computed using the method of Vida et al. 2020b.
4.1 The and parameters
Meteor light curves depend on the physical properties of each meteoroid as well as meteoroid entry speed and angle. In general, a meteor is optically visible only after it has absorbed enough energy to begin thermal ablation in the atmosphere. The height at which ablation begins depends on factors such as the atmospheric density, speed, entry angle, and the composition of the meteoroid. Typically, higher atmospheric density, higher speed, shallower entry angle, and a weaker/more volatile composition lead to higher begin heights.
Using this information a value can be defined that characterizes the amount of energy required to begin ablation. Two such parameters have been proposed in the past, namely the and the parameter.
Ceplecha 1967 first proposed the parameter as:
| (3) |
where is the air mass density at the begin height in g cm-3, is the initial velocity in km/s, and is the zenith angle. The equation implies that the meteoroid surface temperature has a dependence.
The parameter can be used to associate different meteoroid populations with stronger/weaker material properties (Ceplecha et al. 1998). Unlike the parameter, the criterion (Jenniskens et al. 2016a) follows a meteoroid surface temperature dependence and is parameterized as:
| (4) |
where is the beginning height in km and is the initial velocity in km/s.
A complication to the interpretation of meteoroid properties using these parameters is that the observed beginning height depends on specific camera system sensitivity. This difference in detection height made by different systems affects the absolute value of calculated and values. However, we may use the relative value of these parameters to compare the bulk strength between meteoroids from different showers, provided the same camera systems observe both.
For this reason, we chose to compare the Geminid (GEM) and DSX showers using meteor observations made by the same type of camera system, the GMN. It has been proposed, based on dynamical arguments, that the GEM and DSX are related, and if this is the case we expect their associated meteoroids to have similar ablation behaviour.
The radiant of the Daytime Sextantid meteor shower is located near the Helion source, so the optical meteors that occur before sunrise enter the atmosphere with shallow entry angles. From the GMN database, we analyzed a random sample of 13 GEM meteors with shallow entry angles within one standard deviation of the mean optical DSX entry angle to maximize similarity in entry geometry between the two comparison datasets.
For the DSX meteors, we find an average value of 7.44 0.17 and a value of 97.31 1.81. Table 1 contains detailed information about each of the DSX optical meteors in our sample. For comparison the GEM meteor dataset have an average of 7.45 0.21 and a of 96.71 2.66.
This direct comparison using both the and parameters demonstrates that the GEM and DSX optical meteors have the same relative bulk strength within uncertainties and are consistent with a common origin and/or similar evolution.
| Time (UTC) | Shower | ||
| 2019-09-28 11:14:28 | DSX | 7.54 | 98.29 |
| 2019-10-03 11:58:37 | DSX | 7.65 | 93.77 |
| 2021-09-28 16:50:33 | DSX | 7.15 | 95.84 |
| 2021-09-29 04:35:04 | DSX | 7.65 | 98.82 |
| 2021-09-30 12:22:06 | DSX | 7.22 | 97.44 |
| 2021-10-01 03:48:48 | DSX | 7.56 | 95.71 |
| 2021-10-01 04:41:16 | DSX | 7.63 | 99.15 |
| 2021-10-01 12:16:03 | DSX | 7.27 | 98.44 |
| 2021-10-02 01:41:41 | DSX | 7.29 | 97.91 |
| 2021-10-02 11:43:31 | DSX | 7.47 | 95.42 |
| 2021-10-02 11:55:25 | DSX | 7.37 | 99.03 |
| 2021-10-04 05:03:19 | DSX | 7.36 | 95.28 |
| 2021-10-02 11:59:52 | DSX | 7.37 | 99.87 |
| 2020-12-14 02:54:44 | GEM | 7.33 | 97.36 |
| 2020-12-13 17:31:10 | GEM | 7.36 | 99.23 |
| 2020-12-14 02:33:39 | GEM | 7.28 | 98.64 |
| 2019-12-14 17:06:07 | GEM | 7.40 | 98.29 |
| 2019-12-14 17:50:47 | GEM | 7.07 | 101.07 |
| 2019-12-14 18:08:00 | GEM | 7.54 | 94.50 |
| 2019-12-15 02:20:12 | GEM | 7.60 | 95.28 |
| 2020-12-12 02:29:53 | GEM | 7.61 | 94.50 |
| 2020-12-14 02:25:50 | GEM | 7.37 | 97.95 |
| 2019-12-14 17:41:47 | GEM | 7.33 | 98.00 |
| 2020-12-11 17:46:30 | GEM | 7.43 | 96.91 |
| 2020-12-13 17:45:54 | GEM | 7.22 | 94.46 |
| 2020-12-14 02:58:56 | GEM | 7.49 | 99.59 |
5 Discussion
Our radar analysis of the Daytime Sextantids shows them to have a roughly two week period of significant activity, with peak ZHRs of order 20, peak flux of 20.0510-3 meteoroids km-2hour-1 at a peak solar longitude of 187-188 and a low mass index of . The very low mass index indicates a predominance of larger meteoroids at the time of maximum. From our activity profile and mass index we can compute an approximate value for the total mass of the stream and compare to the estimated total mass of the parent, 2005UD.
5.1 The mass of the DSX stream
Following the meteor stream mass calculation methodology of Hughes & McBride 1989, we calculated the mass of the Daytime Sextantids stream to be grams. We have verified our calculation by reproducing the Hughes & McBride 1989’s estimation of the mass in the GEM stream. However, there are several sources of uncertainty in this meteor stream mass calculation. Namely, the upper and lower mass limits of the DSX shower are unknown. Because the GEM and the DSX are related showers, we used the upper and lower mass limits for the GEM that were used in Blaauw 2017’s calculation of the mass of the GEM meteor stream: grams and grams respectively.
The assumption that the DSX and GEM have similar upper and lower mass limits introduces considerable uncertainty in our calculation. For example, when the upper mass limit is increased to grams the estimated mass of the DSX stream is grams and when it is decreased to grams the estimated mass of the DSX stream is grams. Additionally, an assumption built-in to the Hughes & McBride 1989’s stream mass calculation methodology is the estimated unknown area of the meteoroid stream that the Earth does not pass through. Hughes & McBride 1989 uses an f-factor (filling factor) of 10 to compensate for this unknown.
Keeping the sources of uncertainty in mind, we can now compare the mass of the Daytime Sextantids stream with that of its parent body, 2005 UD. Jewitt & Hsieh 2006b observed 2005 UD at a distance of 1.6 AU from the Sun and estimated the mass of 2005 UD to be grams with a sublimation rate of .
This would suggest that the estimated mass of the DSX stream is larger than the mass of its potential parent body, 2005 UD. Two scenarios can explain this difference in mass.
We believe the more likely scenario is that 2005 UD is not the immediate parent body of the DSX. Rather, the DSX stream and 2005 UD could be part of a break-up event followed by a decay-chain. Potentially, 2005 UD could be just the largest member of the DSX. This origin would explain the amount of mass of the DSX stream. If this decay-chain model is true, than there would likely be large objects in the DSX stream, perhaps as large as tens of meters, as opposed to the predicted smaller objects if produced by the asteroid 2005 UD. Additionally, if the DSX stream was created in a decay-chain, this may imply that the GEM stream was also created in a decay-chain, rather than by 3200 Phaethon. This origin would also explain the apparent excess of mass in the GEM stream that cannot be accounted for by the low rate of mass-loss exhibited by Phaethon.
An alternative scenario is that 2005 UD was much larger and more active in the recent past. If this was the case, then the origin of the DSX could be linked to an earlier epoch of profound mass loss from 2005 UD which might be reflected in its surface characteristics today.
However, a further possibility, proposed by Babadzhanov & Obrubov 1987 and Jakubík & Neslušan 2015, cannot be ruled out. Jakubík & Neslušan 2015 simulated the dynamical evolution of various streams released by Phaethon and found that the DSX filament could be reproduced if the age of the DSX stream significantly exceeds 10 millennia. Additionally, another possible indication that the DSX and the GEM are related is that their radiants are symmetrical with respect to the Earth’s apex. This scenario could also explain why the DSX stream is larger than 2005 UD.
5.2 Comparisons to literature values
The Geminid meteor shower and the Daytime Sextantids are thought to be related as part of the Phaethon Geminid Complex (PGC). We now put our results from the characterization of the DSX into context with other literature values of the Geminid meteor shower to further examine the relationship between the two showers.
Multiple studies have measured the mass index of the Geminids. (Reddy et al. 2008) measured the Geminids in 2003 and 2005 and found that the mass index at the peak of the GEM was 1.64 +/- 0.05 in 2003 and 1.65 +/- 0.04 in 2005. (Blaauw et al. 2011) measured the mass index at the peak of the shower in 2007, 2008, and 2009 to be 1.63 +/- 0.04, 1.58 +/- 0.04, 1.62 +/- 0.04, respectively.
By comparison, for the Daytime Sextantids, we measured a mass index of 1.64 +/- 0.06. The DSX mass index, corrected for sporadic contamination using the mixing model method, is remarkably similar to the mass index of the Geminids. Similar mass indices indicate that the mass distribution of the two meteor streams is comparable, with similar relative amounts of small and large particles in the stream.
As discussed in Section 4.1, we found that the Geminids and the Daytime Sextantids have similar and parameters. We calculated a value of for the GEM and for the DSX and a value of for the GEM and for the DSX. This similarity indicates that the relative strength of the meteoroids are comparable between the two showers. The DSX meteoroids are expected therefore to be of high density and comparatively refractory compared to other showers.
The parent body of the Daytime Sextantids meteor shower has been proposed to be the asteroid 2005 UD. This parent relationship is mainly supported by the orbital similarity of the Daytime Sextantids and 2005 UD with a of 100 years, as noted by (Ohtsuka et al. 2006). For completeness, we will compare the orbital elements calculated in this study with the known orbital elements of 2005 UD. From (Ohtsuka et al. 2006), the orbital elements of 2005 UD are: , , , and . The mean orbital elements of the DSX, as discussed in Section 3.4.2, are , , , . From these orbital elements, we confirm that 2005 UD and the DSX have similar orbital elements, but are slightly offset. For example, while the orbital elements are similar, only the eccentricity of the DSX overlaps with 2005 UD’s value.
Our characterization of the Daytime Sextantids indicates that the DSX and GEM meteor showers share similar physical characteristics and are consistent with a relationship. However, while these findings may support the existence of the Phaethon-Geminid Complex, it is important to note that there are some separate lines of evidence that are in tension with this conclusion.
Most notably, Kareta et al. 2021 found that the near-infrared spectrum of 2005 UD was more red-sloped than Phaethon’s near-infrared spectrum and concluded that the two parent bodies might not be related. Additionally, Lisse & Steckloff 2022 found that the spectral reflectance spectrum of asteroids with small perihelion distances may develop a blue color due to thermal alteration and differential sublimation. If true, this would indicate that Phaethon and 2005 UD’s unusual blue reflectance spectrum would not be evidence of a relationship between the two bodies. If Phaethon and 2005 UD are not related, the unusually high strengths of the Geminid and Daytime Sextantid meteoroids may be due to the two streams’ low perihelia, rather than a common parentage. The upcoming DESTINY+ mission will shed new light on the nature of Phaethon and 2005 UD’s relationship and the existence or non-existence of the Phaethon-Geminid Complex.
6 Conclusions
In this work, we use 9 years of orbital radar observations of the Daytime Sextantid meteor shower and 3 years of optical DSX observations to characterize the stream.
From radar observations, we determined characteristics of the DSX such as its mass index, flux profile and radiant extent and drift. Using the optical observations we compared the relative strength and composition of the GEM meteors and DSX meteors. As discussed in Section 5, we found that the Geminids and Daytime Sextantids share many similar physical characteristics, and we conclude that the two showers are likely related.
Additionally, we have developed two new meteor analysis techniques for this study. We developed a convex hull approach for defining the set of meteor shower members with a confidence limit of 95% and used it to define the radiant, duration, and mean orbital elements of the DSX. We also developed a mixing model method that removes the effect of sporadic contamination from the mass index calculation. Using this new method, we calculated the contamination-corrected mass index along with the flux and activity profile of the DSX.
The major conclusions of this study are:
- 1.
The radiant and radiant drift of the Daytime Sextantids has been calculated as a function of solar longitude throughout the shower’s duration. During the time of the peak of the DSX, from - , the radiant drifted in right ascension and in declination per degree solar longitude. Results are shown in Figure 12 and compared to literature values in Appendix A in the supplementary materials.
- 2.
We find that the duration of the Daytime Sextantids shower is between 173∘ - 196∘ in solar longitude.
- 3.
The mean orbital elements of the DSX have been calculated as a function of solar longitude. Results are shown in Figure 11, along with the corresponding orbital elements from the literature for comparison purposes.
- 4.
- 5.
- 6.
Using the optical DSX observations and some GEM optical observations, we find that the DSX and GEM showers and parameters are identical within uncertainty. This suggests that the relative meteoroid strengths and composition at mm-sizes is similar for each shower.
- 7.
We calculated the mass of the DSX stream to be grams. Comparing this value to the mass of 2005 UD, estimated to be grams, we conclude that it is unlikely that 2005 UD is the parent body of the DSX stream. We proposed two possible scenarios. The more likely scenario is that 2005 UD and the DSX stream are related via a decay chain, meaning that a break-up event of a precursor body created both the DSX stream and 2005 UD. An alternative scenario is that 2005 UD could have been much larger in the past and could have experienced much more extensive mass loss than it is currently exhibiting today.
We suggest that the origin of the DSX and 2005 UD is most likely formed via a decay chain and that their relationship is one of sibling rather than parent-child association. This suggests that origin of the GEM and Phaethon may be as part of a break-up forming the PGC more broadly. If so, it also suggests that 3200 Phaethon would not be the parent of the GEM stream, but rather simply the largest remnant of the original precursor body.
Acknowledgements
Funding for this work was provided in part through NASA co-operative agreement 80NSSC21M0073, by the Natural Sciences and Engineering Research Council of Canada Discovery Grants program (Grants no. RGPIN-2016-04433 & RGPIN-2018-05659), and the Canada Research Chairs program. The authors thank J. Borovička for helpful comments related to this study.
References
- Babadzhanov (1991) Babadzhanov P. B., 1991, Soviet Astronomy, 35, 538
- Babadzhanov & Obrubov (1987) Babadzhanov P., Obrubov I. V., 1987, Publications of the Astronomical Institute of the Czechoslovak Academy of Sciences, 2, 141
- Blaauw (2017) Blaauw R. C., 2017, Planetary and Space Science, 143, 83
- Blaauw et al. (2011) Blaauw R. C., Campbell-Brown M. D., Weryk R. J., 2011, Monthly Notices of the Royal Astronomical Society, 412, 2033
- Borovička (2006) Borovička J., 2006, Proceedings of the International Astronomical Union, 2, 107
- Brown et al. (2008) Brown P., Weryk R. J., Wong D. K., Jones J., 2008, Icarus, 195, 317
- Brown et al. (2010) Brown P., Wong D. K., Weryk R. J., Wiegert P., 2010, Icarus, 207, 66
- Bruzzone et al. (2015) Bruzzone J. S., Brown P., Weryk R. J., Campbell-Brown M. D., 2015, Monthly Notices of the Royal Astronomical Society, 446, 1625
- Campbell-Brown (2019) Campbell-Brown M., 2019, Monthly Notices of the Royal Astronomical Society, 485, 4446
- Ceplecha (1967) Ceplecha Z., 1967, Smithsonian Contr. Astrophys, 11, 35
- Ceplecha et al. (1998) Ceplecha Z., Borovička J., Elford W. G., ReVelle D., Hawkes R., Porubčan V., Šimek M., 1998, Space Science Reviews, 84, 327
- De Leon et al. (2010) De Leon J., Campins H., Tsiganis K., Morbidelli a., Licandro J., 2010, Astronomy and Astrophysics, 513, A26
- Devogèle et al. (2020) Devogèle M., et al., 2020, The Planetary Science Journal, 1, 15
- Dewsnap & Campbell-Brown (2021) Dewsnap R. L., Campbell-Brown M., 2021, Monthly Notices of the Royal Astronomical Society, 507, 4521
- Galligan (2000) Galligan D. P., 2000, Doctoral, Canterbury
- Galligan (2003) Galligan D. P., 2003, Monthly Notices of the Royal Astronomical Society, 898, 893
- Gustafson (1989) Gustafson B. Å. S., 1989, Astronomy and Astrophysics, 225, 533
- Hocking et al. (2001) Hocking W., Fuller B., Vandepeer B., 2001, Journal of Atmospheric and Solar-Terrestrial Physics, 63, 155
- Huang et al. (2021) Huang J.-N., Muinonen K., Chen T., Wang X.-B., 2021, Planetary and Space Science, 195, 105120
- Hughes & McBride (1989) Hughes D. W., McBride N., 1989, Monthly Notices of the Royal Astronomical Society, 240, 73
- Ishiguro et al. (2022) Ishiguro M., et al., 2022, Monthly Notices of the Royal Astronomical Society, 509, 4128
- Jakubík & Neslušan (2015) Jakubík M., Neslušan L., 2015, Monthly Notices of the Royal Astronomical Society, 453, 1186
- Jenniskens (1994) Jenniskens P., 1994, Astronomy and Astrophysics
- Jenniskens et al. (2016a) Jenniskens P., et al., 2016a, Icarus, 266, 384
- Jenniskens et al. (2016b) Jenniskens P., et al., 2016b, Icarus, 266, 331
- Jewitt & Hsieh (2006a) Jewitt D., Hsieh H., 2006a, The Astronomical Journal, 132, 1624
- Jewitt & Hsieh (2006b) Jewitt D., Hsieh H., 2006b, The Astronomical Journal, 132, 1624
- Jewitt & Li (2010) Jewitt D., Li J., 2010, The Astronomical Journal, 140, 1519
- Jewitt et al. (2015) Jewitt D., Hsieh H., Agarwal J., et al., 2015, Asteroids IV, pp 221–241
- Jones & Jones (2006) Jones J., Jones W., 2006, Monthly Notices of the Royal Astronomical Society, 367, 1050
- Jones et al. (2005) Jones J., Brown P., Ellis K. J., Webster A. R., Campbell-Brown M., Krzemenski Z., Weryk R. J., 2005, Planetary and Space Science, 53, 413
- Jopek et al. (2006) Jopek T. J., Rudawska R., Pretka-Ziomek H., 2006, MNRAS, 371, 1367
- Kareta et al. (2021) Kareta T., Reddy V., Pearson N., Sanchez J. A., Harris W. M., 2021, The Planetary Science Journal, 2, 190
- Kashcheyev & Lebedinets (1967) Kashcheyev B., Lebedinets V., 1967, Smithsonian contributions to astrophysics, 11, 183
- Kinoshita et al. (2007) Kinoshita D., et al., 2007, Astronomy and Astrophysics, 466, 1153
- Licandro et al. (2007) Licandro J., Campins H., Mothé-Diniz T., Pinilla-Alonso N., De León J., 2007, Astronomy & Astrophysics, 461, 751
- Lisse & Steckloff (2022) Lisse C., Steckloff J., 2022, Icarus, p. 114995
- MacLennan et al. (2021) MacLennan E., Toliou A., Granvik M., 2021, Icarus, 366, 114535
- Mazur et al. (2020) Mazur M., Pokorný P., Brown P., Weryk R. J., Vida D., Schult C., Stober G., Agrawal A., 2020, Radio Science, n/a, e2019RS006987
- Moorhead et al. (2019) Moorhead A. V., Egal A., Brown P. G., Moser D. E., Cooke W. J., 2019, Journal of Spacecraft and Rockets, 56, 1531
- Neslušan & Hajduková (2017) Neslušan L., Hajduková M., 2017, Astronomy and Astrophysics, 598, A40
- Nilsson (1964) Nilsson C., 1964, Australian Journal of Physics, 17, 158
- Ohtsuka et al. (2006) Ohtsuka K., Sekiguchi T., Kinoshita D., Watanabe J.-I., Ito T., Arakida H., Kasuga T., 2006, Astronomy & Astrophysics, 450, L25
- Pokorný, P. & Brown, P. G. (2016) Pokorný, P. Brown, P. G. 2016, Astronomy & Astrophysics, 592, A150
- Pokorný et al. (2017) Pokorný P., Janches D., Brown P. G., Hormaechea J., 2017, Icarus, 290, 162
- Reddy et al. (2008) Reddy K. C., Kumar D. V. P., Yellaiah G., 2008, Planetary and Space Science, 56, 1014
- Rendtel (2014) Rendtel J., 2014, Meteor Shower Workbook 2014. International Meteor Organization
- Rudawska et al. (2015) Rudawska R., Matlovič P., Tóth J., Kornoš L., 2015, Planet. Space Sci., 118, 38
- Ryabova (2017) Ryabova G., 2017, Planetary and Space Science, 143, 125
- Ryabova et al. (2019) Ryabova G. O., Avdyushev V. A., Williams I. P., 2019, Monthly Notices of the Royal Astronomical Society, 485, 3378
- Sekanina (1976) Sekanina Z., 1976, Icarus, 27, 265
- Sonotaco (2009) Sonotaco 2009, Wgn, Jimo, 37, 55
- Spurný (1993) Spurný P., 1993, in Meteoroids and their Parent Bodies. pp 193–196
- Tabeshian et al. (2019) Tabeshian M., Wiegert P., Ye Q., Hui M.-T., Gao X., Tan H., 2019, The Astronomical Journal, 158, 30
- Verniani (1973) Verniani F., 1973, Journal of Geophysical Research, 78, 8429
- Vida et al. (2018) Vida D., Mazur M., Šegon D., Zubovič D., Kukič P., Parag F., Macan A., 2018, WGN, Journal of the International Meteor Organization, 46, 71
- Vida et al. (2020b) Vida D., Gural P. S., Brown P. G., Campbell-Brown M., Wiegert P., 2020b, Monthly Notices of the Royal Astronomical Society, 491, 2688
- Vida et al. (2020a) Vida D., Gural P. S., Brown P. G., Campbell-Brown M., Wiegert P., 2020a, Monthly Notices of the Royal Astronomical Society, 491, 2688
- Vida et al. (2021) Vida D., et al., 2021, Monthly Notices of the Royal Astronomical Society, 506, 5046
- Weiss (1960) Weiss A., 1960, Monthly Notices of the Royal Astronomical Society, 120, 387
- Williams & Wu (1993) Williams I., Wu Z., 1993, Monthly Notices of the Royal Astronomical Society, 262, 231
- Williams et al. (2019) Williams I. P., Jopek T. J., Rudawska R., Toth J., Kornos L., 2019, in Asher D. J., Ryabova G. O., Campbell-Brown M. D., eds, Cambridge Planetary Science, Meteoroids: Sources of Meteors on Earth and Beyond. Cambridge University Press, Cambridge, pp 210–234, doi:DOI: 10.1017/9781108606462.016, https://www.cambridge.org/core/books/meteoroids/minor-meteor-showers-and-the-sporadic-background/81F0683515A682F6712191DBF2154C79
- Ye et al. (2018) Ye Q., Wiegert P., Hui M.-T., 2018, The Astrophysical Journal, 864, L9
- Younger et al. (2009) Younger J. P., Reid I. M., Vincent R. A., Holdsworth D. A., Murphy D. J., 2009, MNRAS, 398, 350