Metallicities and ages for star clusters and their surrounding fields in the Large Magellanic Cloud Thanks: Full Table 1 is available on the Araucaria Project webpage (https://araucaria.camk.edu.pl/) and at the CDS via anonymous ftp to cdsarc.u-strasbg.fr (130.79.128.5) or via http://cdsarc.u-strasbg.fr/viz-bin/cat/J/A+A/666/A80
Abstract
Aims. We study star clusters in the Large Magellanic Cloud (LMC) in order to determine their mean metallicities and ages, as well as the mean metallicities of surrounding fields. We construct an age–metallicity relation (AMR) for the clusters in the LMC.
Methods. For this purpose, we used Strömgren photometry obtained with the SOI camera on the 4.1 m SOAR telescope. We derived the metallicities of individual stars utilizing a metallicity calibration of the Strömgren and colors from the literature. Cluster ages were determined from the isochrone fitting.
Results. We found the mean metallicity and age for star clusters. For the remaining we provide an age estimation only. To the best of our knowledge, for clusters from our sample, we provide both the metallicity and age for the first time, whereas for clusters, we provide a first determination of the metallicity, and for clusters, the first estimation of the age. We also calculated the mean metallicities for stars from fields around the clusters. The results were then analyzed for spatial metallicity and age distributions of clusters in the LMC, as well as their AMR. The old, metal-poor star clusters occur both in and out of the LMC bar region, while intermediate-age clusters are located mostly outside of the bar. The majority of star clusters younger than Gyr are located in the bar region. We find a good agreement between our AMR and theoretical models of the LMC chemical enrichment, as well as with AMRs for clusters from the literature. Next, we took advantage of stellar clusters from our sample which host Cepheid variables and used them as an independent check of the correctness of our age determination procedure. We used period-age relations for Cepheids to calculate the mean age of a given cluster and compared it with the age obtained from isochrone fitting. We find good agreement between these ages, especially for models taking into account additional physical processes (e.g., rotation). We also compared the AMR of the LMC and Small Magellanic Cloud (SMC) derived in a uniform way and we note that they indicate possible former interaction between these two galaxies. The Strömgren photometry obtained for this study has been made publicly available.
Key Words.
methods: observational – techniques: photometric – galaxies: individual: Large Magellanic Cloud – galaxies: star clusters: general – galaxies: abundances1 Introduction
The Large Magellanic Cloud (LMC) is a Magellanic spiral galaxy (SB(s)m type) and a satellite of the Milky Way (MW). It is located even closer to our Galaxy than its nearby companion on the sky – the Small Magellanic Cloud (SMC). Its proximity, favorable face-on orientation and miscellaneous stellar population make it an attractive target for detailed astrophysical studies. The LMC harbors a large and diverse system of star clusters, whose metallicities and ages follow a specific age–metallicity relation (AMR) and, as such, can serve as good tracers of the chemical evolution history of their host galaxy.
Many studies indicate a much more complicated star formation history (Pagel & Tautvaišvienė 1998; Carrera et al. 2008a; Harris & Zaritsky 2009; Rubele et al. 2012; Meschin et al. 2014; Palma et al. 2015; Perren et al. 2017, SFH; e.g.,) or AMR for star clusters (Olszewski et al. 1991; Hill et al. 2000; Dirsch et al. 2000; Rich et al. 2001; Leonardi & Rose 2003; Kerber et al. 2007, e.g.,) in the LMC than in the SMC. Early studies of the cluster AMR in the LMC (Olszewski et al. 1991, e.g., the spectroscopic study of) revealed a mysterious gap in the star cluster formation between and Gyr ago (Piatti 2022, with the sole exception of cluster ESO121-3 and very recently also KMHK1592, as reported by), which follows the initial formation of old, metal-poor globular clusters, and precedes more recent active formation of intermediate-age clusters. This so-called ”age gap,’ which is simultaneously a metallicity gap, was later reported also by other authors (e.g., Harris & Zaritsky 2009; Sharma et al. 2010; Kerber et al. 2007, and references therein), even though it has not been fully confirmed when only the field stars are considered. For example, Piatti & Geisler 2013 reported that no clear age gap in the field star formation is observed in their study of fields in the LMC main body, based on Washington photometry. Furthermore, based on their spectroscopic analysis of four fields to the north of the LMC bar, Carrera et al. 2008a maintain that the disk and cluster AMR are similar. However, unlike clusters, there is no age gap in the field population. On the contrary, Harris & Zaritsky 2009 claim that such a gap is evident in the field population of the bar, mostly omitted in previous studies. Also Meschin et al. 2014, using optical photometry, identified two main star -forming epochs with a period characterized by a lower activity in between; however, in their work that interval of time was shorter and lasted from up to Gyr ago. All the aforementioned authors agree that star formation in the LMC is continuing to this day.
Olszewski et al. 1991 claimed that the metal abundance of star clusters of age 2 Gyr from inner and outer regions of the LMC are nearly identical ( and dex, respectively) and that there is only a small radial abundance gradient visible in the cluster system. The difference in metallicity between various LMC regions, was later reported by other authors, for example, by Piatti et al. 2003b based on their study of LMC clusters observed with Washington photometry. These authors have claimed that clusters from the inner disk are, on average, more metal-rich and simultaneously younger than those from the outer disk. Similar conclusions were reached by, for instance, Livanou et al. 2013 (based on Strömgren photometry), Pieres et al. 2016 (from Sloan bands). Piatti & Geisler 2013, and Meschin et al. 2014 observed such an abundance gradient in the field population and postulated an outside-in star formation and chemical enrichment in the LMC.
Olszewski et al. 1991 also mentioned, that the burst of cluster formation around Gyr ago in the outer regions could result from the interaction between the LMC and the MW, possibly also with the SMC. Similar interpretation of this phenomenon was given by, for instance, Harris & Zaritsky 2009.
A second period of low cluster formation rate, lasting from about Myr ago, is reported by Leonardi & Rose 2003. Such a period is not clearly visible in other works (Glatt et al. 2010; Perren et al. 2017, e.g.,). Nevertheless, some authors refer to multiple peaks in recent SFH of the LMC. For example, Harris & Zaritsky 2009 found peaks at roughly Gyr, Myr, Myr, and Myr. They also emphasized that the peaks at Myr and Gyr coincide well with similar peaks seen in the SMC. Glatt et al. 2010, on the other hand, found two periods of enhanced cluster formation, but at Myr and Myr. The authors of these two studies argue that observed peaks in the recent cluster formation rate suggest a common history of the LMC and SMC.
In Narloch et al. 2021, we analyzed the AMR for star clusters in the SMC. A similar analysis for the LMC, carried out in a homogeneous manner, would therefore be a valuable addition to the overall picture of the evolution and interaction of these two MW satellites. Additionally, most of the results presented in this work come from the central regions of the LMC, which has not been well studied previously.
In this work, we obtain Strömgren photometry of stars belonging to the clusters and the fields in the LMC, and using the Strömgren metallicity calibration of Hilker 2000, we determine their metallicities. We use the obtained metallicity values of individual stars to calculate mean metallicities of the star clusters and their surrounding fields. We employ theoretical isochrones to estimate the age of each cluster. The resulting AMR is derived in a homogeneous way, which allows us to investigate the chemical history of the LMC, in order to verify the evolutionary scenarios presented in the extensive literature described above. To maintain homogeneity in the study, we repeated the reduction and photometry, and then we reanalyzed the clusters that have already been reported based on the same dataset (Piatti 2018; Piatti et al. 2019; Piatti 2020, e.g.,). Moreover, we use recent reddening maps of the Magellanic Clouds (Górski et al. 2020; Skowron et al. 2021) and the most recent distance determination to the LMC, which is precise to (Pietrzyński et al. 2019). The positions and radii of the star clusters were taken from the catalog of Bica et al. 1999. A uniform handling of data allowed us to compare the resulting AMR of the LMC to that of the SMC from Paper I.
This paper is organized as follows. In Sect. 2, we describe the observations, reduction procedure, and analysis techniques. In Sect. 3, we analyze our results for the spatial metallicity and age distributions of star clusters from our sample. We describe our resulting AMR and compare to SFH models from the literature. In Sect. 4, we discuss obtained cluster metallicities with the corresponding metallicities obtained with different methods in the literature, as well as the AMRs, with those found in the literature. We compare ages of the clusters hosting Cepheid variables with ages obtained from the period–age (PA) relations. Finally, we compare the AMR for the LMC and SMC, as derived in Paper I. Section 5 provides the conclusions of this study.
2 Observations and data reduction
Images in three Strömgren filters (, and ) were collected within the Araucaria Project (Gieren et al. 2005) using the m Southern Astrophysical Research (SOAR) Telescope placed in Cerro Pachón in Chile, equipped with the SOAR Optical Imager (SOI) camera (program ID: SO2008B-0917, PI: Pietrzyński). Observations were conducted during two runs: , , and December 2008 and , , and January 2009. The SOI camera is a mosaic of two E2V 2k4k CCDs (read by a total of four amplifiers). The field of view is arcmin2 and the pixel scale is arcsecpixel-1. During both runs, a pixel binning was applied, giving an effective pixel scale of arcsecpixel-1. Single images were taken in the air mass range of , and the average seeing was about , and arcsec in , and filters, respectively. Table 5 summarizes the information about the data set. Several fields were observed more than once. The repeated clusters have multiple records in Tables 3 and 5 .
During the reduction and analysis of the data, we followed the procedures described in Paper I. After bias subtraction and flatfield correction, we performed profile photometry using the standard DAOPHOT/ALLSTAR package (Stetson 1987), where the point spread function (PSF) was defined by a spatially variable Gaussian. Very dense fields were divided into smaller overlapping subframes to reduce the PSF and background variability, where we were always careful to provide a sufficient number of PSF stars; this number ranged from a handful to over depending on the frame. Photometry was performed iteratively by gradually decreasing the detection threshold. In the last step, the images were inspected by eye and stars omitted in the automatic procedure were manually added to the final list of stars in a given frame. This step was performed particularly in dense fields with significant background gradient where mostly faint stars ( mag) or stars located close to much brighter companions were added. They accounted for a maximum of of all stars on the final list. Subsequently, the aperture corrections for each frame were calculated using the DAOGROW package (Stetson 1990).
The instrumental color-magnitude diagrams (CMDs) were then standardized for each chip of the camera separately, using the transformation equations from Paper I and coefficients from Table 2 therein. The average errors of the photometry from DAOPHOT were mag in , mag in and mag in for stars with brightness mag. The astrometric solutions of images in the band were performed using the Gaia EDR3 catalog (Gaia Collaboration 2016b; Gaia Collaboration 2021; Lindegren et al. 2021) with subarcsec accuracy. The artificial star tests done using the ADDSTAR routine of the DAOPHOT package assured that the completeness of our master lists of stars is close to for stars used for the metallicity determination.
2.1 Selection of cluster members and field stars
In the first step of our selection of cluster members, we rejected galactic foreground stars with significant proper motion (PM) values. We applied a similar approach to that presented in Narloch et al. 2017, where stars are excluded from the sample based on their location on the vector point diagram (VPD). To that end, we cross-matched our CMDs with the Gaia EDR3 catalog and calculated mean values of PMs of all stars from a given field (MRA, MDE). These values were then subtracted from the individual PMs of stars in order to center the VPD. Then, mean and standard deviations of PMs (MRA, MDE, SRA, SDE) and PM errors (MERA, MEDE, SERA, SEDE) were calculated as well as total PMs () and their errors (). Because the number of stars in a field is often small, we decided to not divide them into magnitude bins. Next, the stars satisfying the conditions and were retained. The procedure was iterated twice to ensure reliable removal of stars with high PMs.
We adopted equatorial coordinates and sizes of star clusters taken mostly from Bica et al. 1999 and, for the case of the cluster OGLE-CL LMC 478, from Pietrzyński et al. 1999b. Stars lying outside of the cluster radii were classified as field stars. We did not perform a statistical subtraction. Most of the clusters are small and placed close to each other in dense fields. Also, the small field of view of the camera does not provide good statistics for the field stars. All of these obstacles make it difficult to perform statistical subtraction correctly. On the other hand, populous star clusters located in sparse fields are marginally contaminated by field stars. In the end, the individual metallicites can help to disentagle cluster and field stars.
2.2 Determination of reddening toward clusters
Reddening for each star cluster was determined using the two recent reddening maps of Górski et al. 2020 and Skowron et al. 2021. Both maps are based on red clump stars in the LMC, where S21 characterize a much larger area of the sky than G20. As most of our clusters are much smaller than the field of view of the SOI camera, we calculated the reddening of a given cluster or field in an area centered on the target with the G20 map resolution of three and five arcmin, respectively. The resolution of the S21 maps is in the central parts of the LMC and decreases in the outskirts down to about . For clusters located in the area covered by both reddening studies, we adopted the average of both values (), where from S21 is converted into with . Due to the limited area of G20, for the most outlying clusters, the converted value from S21 was used directly. For several clusters distant from the LMC center , even the reddening data from S21 was not available (clusters marked with a–symbol in fourth column of Table 3), or the calculated reddening seemed to be incorrect for a cluster (the isochrone with this reddening value clearly did not fit the CMD of a given cluster). In such cases, we adopted reddening values from other literature sources (see Table 6).
The mean difference between the G20 and S21 reddening values for the star clusters and fields studied in this work is about mag, where S21 gives systematically smaller values than G20. Half of this value, rounded up ( mag), was propagated into the systematic error on the derived metallicities, resulting from the reddening. The reddening values for magnitudes and colors were calculated using the following equations: , and (Cardelli et al. 1989; O’Donnell 1994).
Differential reddening, namely, spatially-variable extinction (either internal or external to the star clusters), is an effect that can occur in studied fields, affecting stellar magnitudes and colors, which influences both metallicity and age estimations. It would manifest itself as a broadening of the metallicity and age distribution, and for objects with large differential reddening, it could cause a systematic shift of the mean metallicity towards higher values, with larger statistical errors. In most of the clusters in our sample, we do not expect large reddening variations, although isolated cases may occur. The clusters most affected by differential reddening are likely located in the LMC bar. Although it cannot be precisely estimated solely based on our data, Milone et al. 2018 reported that the typical differential reddening in the LMC clusters is mag, which is considerably smaller than our photometric error.
2.3 Metallicity calculation based on Strömgren colors
The metallicites for red giants and supergiants in our fields were calculated based on the existing calibration of the Strömgren colors and with metallicity ([Fe/H]). The adopted method gives the metallicities of individual stars determined nearly independent of their age (Dirsch et al. 2000, e.g.,). During the analysis, we adopted a metallicity calibration of the Strömgren versus two-color relation derived by Hilker 2000, which is valid in the range of colors of , and is given by following equation:
| (1) |
where
The metallicity errors of individual stars were calculated by performing a full error propagation, as done by Piatti et al. 2019 or as shown in Paper I. For the derivation of the calibration, Hilker 2000 used stars with spectroscopic metallicities on the Zinn & West 1984 metallicity scale (hereafter the ZW84 scale).
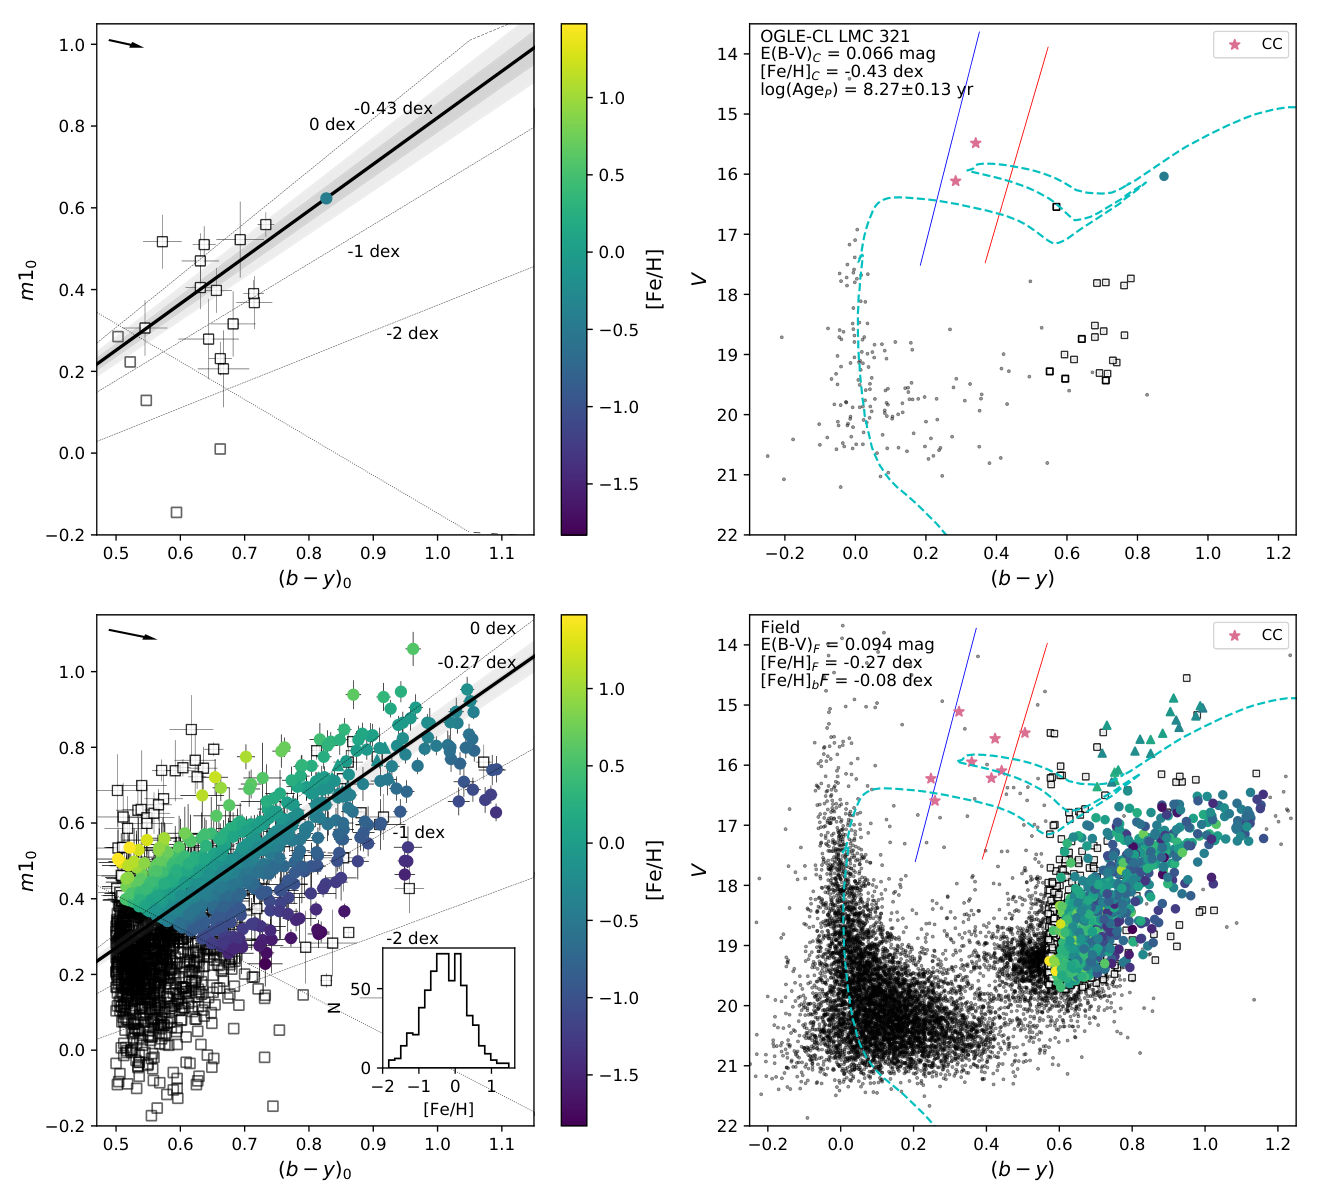
The procedure of the metallicity determination is described in detail in Paper I. Here we provide a brief summary for reference. After dereddening the data (see Section 2.2) we chose stars from the color range , having and (calculated from the DAOPHOT error estimates). Next, following Dirsch et al. 2000, we introduced a cut at the blue edge of the vs. relation (marked in the left panels of Fig. 1 and 2 with grey dotted line), where deviating stars cause a bias toward metal-poor stars with larger metallicity errors. For the remaining stars, the mean and unbiased standard deviation were calculated and then recalculated after applying clipping. The resulting CMDs and vs. relations were examined by eye to manually reject single stars deviating significantly, and the final values of the mean and the unbiased standard deviation were obtained. The statistical error of the mean metallicity was determined as an unbiased standard deviation divided by the square root of the number of stars used for the calculation.
One of the main sources of systematic metallicity error is the reddening. A mag increase in reddening increases the derived metallicity by about dex (see Paper I). A typical error resulting from the reddening adopted in the previous section corresponds to dex; this value is used to calculate the systematic error of the mean metallicity of clusters and their surrounding fields. The effect of differential reddening in the studied fields was neglected during the calculation of the total systematic error, as it cannot be precisely estimated with the available data.
Another source of systematic uncertainty is the precision of the and calibration to the standard system. This uncertainty causes a bias in the metallicity of individual stars depending on their color. The effect is larger for bluer stars, leading to larger metallicity errors (Dirsch et al. 2000, see Fig. 1 in). To estimate this uncertainty we performed simulations as described in Paper I.
Metallicities derived from Strömgren colors are also affected by the contribution of CN molecules absorption which reduces the flux in filter. CN bands lead then to higher value of index and as a consequence N-enriched stars appear to be more metal-rich. The increase of the metallicity would decrease the age derived via isochrone fitting. The chemical anomalies were found in the ancient, massive globular clusters from our Galaxy (Richter et al. 1999; Hilker & Richtler 2000, e.g.,), as well as massive, intermediate-age star clusters ( Gyr and older) of the Magellanic Clouds (Martocchia et al. 2021; Martocchia et al. 2019; Hollyhead et al. 2018, e.g.,), but none were found in younger clusters (Martocchia et al. 2017; Martocchia et al. 2021, e.g.,). Martocchia et al. 2019 showed that chemical anomalies in the form of N spreads is a strong function of age. Martocchia et al. 2021 presented a spectroscopic data for two clusters from our sample: NGC1651 and NGC1978. In the case of NGC1651 only three stars out of used for the metallicity calculation have a measured CN index, while ten more lie outside the cluster radius that we adopted and are classified as field stars. In the case of NGC1978, 6 stars out of have spectroscopic measurements and another 5 are classified as field stars. Rejection of these few N-enriched stars would not change the obtained mean metallicities of those clusters. CN bands increase photometric metallicities derived from Strömgren photometry but without detailed spectroscopic studies, we cannot account for this effect.
The total systematic error of a given mean metallicity is composed of the reddening and calibration errors added in quadrature. Tables 3 and 4, which summarize the measurements for the clusters and fields analyzed in this work, respectively, contain both the statistical and systematic (in parentheses) metallicity errors.
2.4 Age determination
We determined the ages of the star clusters in our sample by performing an isochrone fitting. To that end, we utilized isochrones from the Dartmouth Stellar Evolutionary Database11 1 http://stellar.dartmouth.edu/models/isolf_new.html (Dotter et al. 2008, hereafter the Dartmouth isochrones) and the Padova database of stellar evolutionary tracks and isochrones available through the CMD 3.3 interface22 2 http://stev.oapd.inaf.it/cgi-bin/cmd_3.3 (Marigo et al. 2017) calculated with the PARSEC (Bressan et al. 2012) and COLIBRI (Pastorelli et al. 2019) evolutionary tracks (hereafter the Padova isochrones). Most of the ages were estimated with the Padova isochrones sets, as they cover a wide range of possible age values, while the Dartmouth isochrones were available only for the Gyr range; thus, they were too old for most of our objects. Where possible, both isochrones were employed for the determination.
The isochrones were fitted for a specific metallicity of a given cluster at a fixed distance to the LMC mag, as reported by Pietrzyński et al. 2019. In cases where the isochrones for the reddening calculated from averaging G20 and S21 maps clearly did not fit the CMD of a given cluster, we adopted a value from the literature and iterated the procedure. The age error of a given cluster was defined as half the age difference between two marginally fitting isochrones selected around the best fitting isochrone.
Adopting a fixed distance to the LMC while fitting an isochrone is an approximation, as LMC star clusters can be located at different distances along the line of sight (Piatti 2021, see e.g.,). Placing them all at the same distance introduces error in our age calculations. If a given cluster turns out to be located in a distance different than adopted, then it would have a different age: would be younger or older depending on being farther or closer than adopted distance, respectively. Subramanian & Subramaniam 2009 reported a significant line of sight depth of the LMC bar ( kpc) and disk ( kpc). A change of adopted cluster distance of a half of the LMC bar depth, would result in a change of log(Age) by . The typical age error, however, estimated in the previous paragraph, is often higher (), so the error resulting from assuming a fixed distance to the LMC has no significant impact on the final error.
2.5 Strömgren photometry
We publish our photometry for more than stars having measurements in all three Strömgren filters, and the consequently calculated , and values. The first five rows of the catalog are presented in Table 1. The photometric errors come from the DAOPHOT package as well as the full error propagation of the transformation equations with coefficients from Table 2 in Paper I.
3 Results
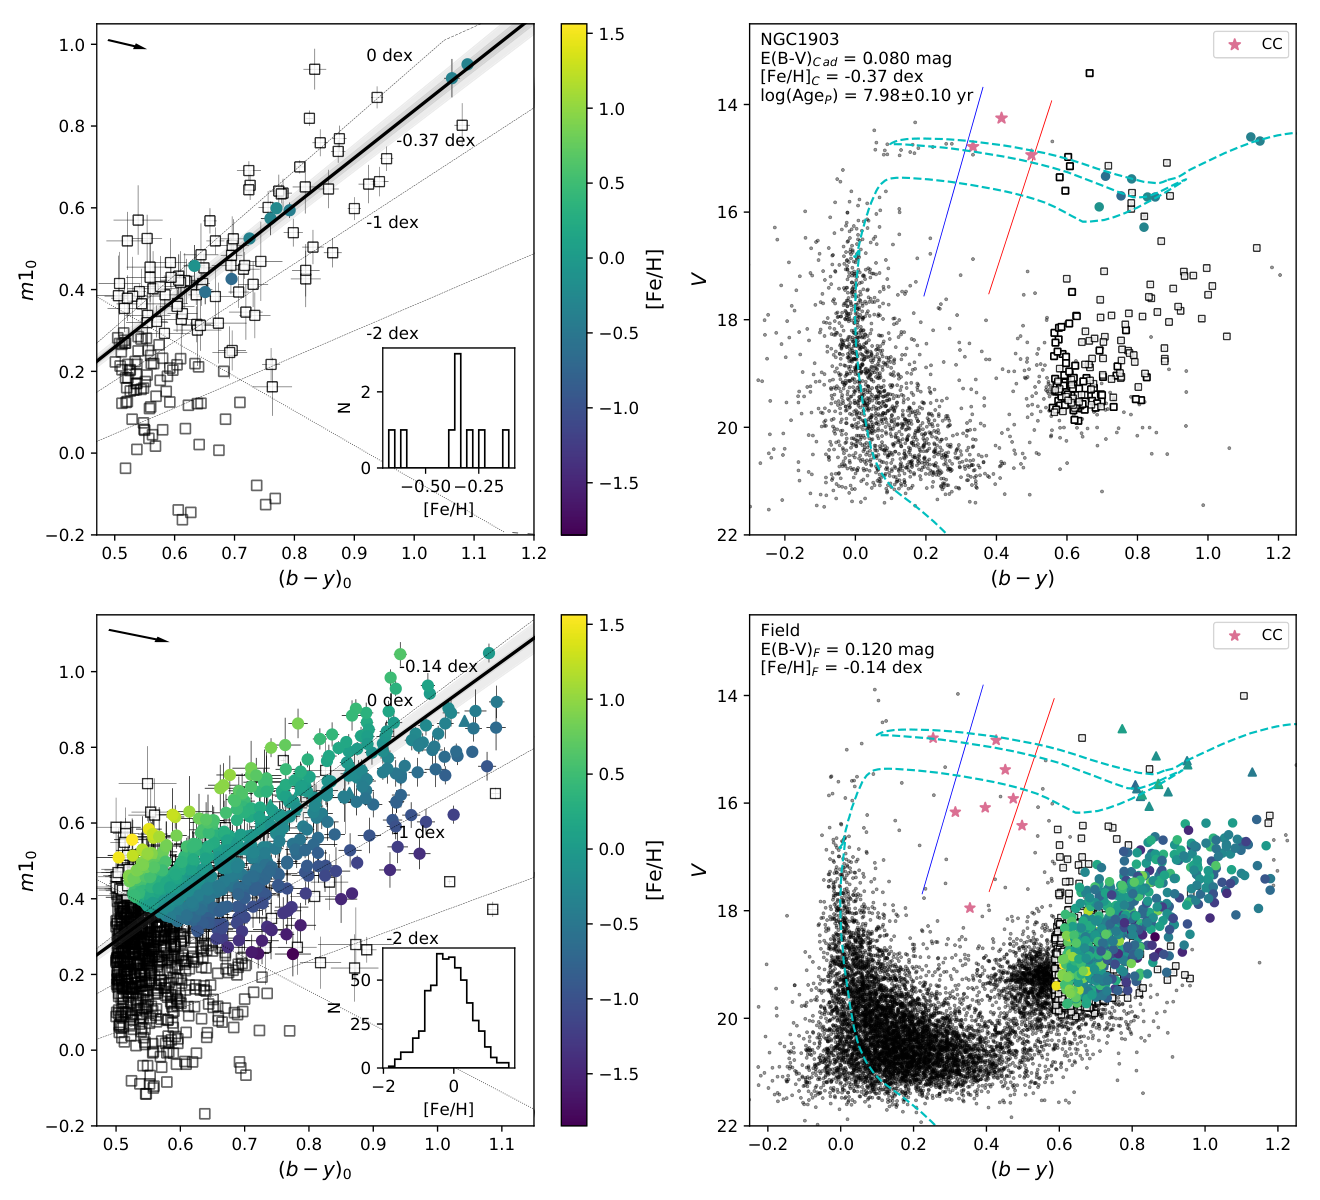
Figures 1 and 2 show example two-color diagrams and CMDs of star clusters and their surrounding fields from our sample for: an intermediate-age stellar cluster, NGC1651, with a well populated RGB (Fig. 1), and a young star cluster, NGC1903, hosting Cepheid variables in its field (Fig. 2). Analogous examples where only one or two stars were used for metallicity determination are presented in Appendix D. The left panels of Fig. 1 and 2 present the dereddened vs. relation, where stars used for the calculation of the mean metallicity of a given cluster (upper panels) or field (lower panels) are color coded. The same stars are marked on the CMDs presented in the right panels. The best fitting Padova (turquoise) and Dartmouth (grey) isochrones for a given cluster are shown in the upper right panels. The same isochrones are also plotted in the lower right panels to show their position relative to the field. Figure 3 presents the spatial distribution of the mean metallicities of clusters and fields from our sample, while Fig. 4 shows the on-sky distribution of estimated cluster ages. The histogram of metallicities of field stars is presented in Fig. 5. The metallicity and age determinations done in this work are summarized in Tables 3 and 4 and shown in Fig. 6. Multiple measurements for several clusters in Table 3 are averaged in Fig. 6. Figure 7 presents the AMR in the LMC bar and non-bar regions separately.
Our sample covers star clusters in the LMC and fields associated with them. We calculated the mean metallicities, together with ages for clusters in total. The remaining clusters lack metallicity information, as there were no suitable stars to estimate it. Nevertheless, we were able to estimate cluster ages by adopting Padova isochrones for dex. Metallicities were determined for clusters in our sample for the first time, to the best of our knowledge. For clusters, we provide the first estimation of the age and for clusters, both of these values were obtained for the first time. Nine star clusters from our sample are ancient globular clusters, older than Gyr, with low metallicities similiar to their Galactic equivalents; objects are intermediate-age clusters, with ages in the range of one to Gyr; and the remaining are clusters younger than one Gyr. There are clusters with at least 5 stars (up to 287) useful for metallicity calculation (these are marked in Fig. 6 with filled and opened squares). Another objects had less than 5, but at least one star for metallicity calculation, which gives a very poor statistic and makes the final value less reliable (these clusters are marked in Fig. 6 with opened circles). Cluster ages were estimated as described in Sec. 2.4.



3.1 Spatial metallicity distribution of cluster and field stars in the LMC
Figure 3 shows the spatial map of the cluster (upper panel) and field (lower panel) metallicities given in Tables 3 and 4. The black cross marks the center of the LMC adopted from Pietrzyński et al. 2019. The structure of the LMC is more complicated than that of the SMC, which is reflected in the metallicity distribution in this galaxy. Harris & Zaritsky 2009 defined several distinct LMC regions (see their Fig. 6), the description of which we follow.
Most of the star clusters from our sample are located in the bar, the elongated structure near the center of the galaxy (marked in Fig. 3 and 4 with blue dotted ellipse). The spread of their mean metallicities is large and ranges between dex up to as high as dex, with an average of dex ( dex). The majority of the clusters are metal-rich. One possible explanation for the presence of low-metallicity clusters in this region is that they might actually be in front of or behind it. Such a scenario is supported by the fact that the fields around these clusters are more metal-rich, and coincide better with the peak of the metallicity distribution of the field stars in the bar ( dex, dex, see Fig. 5). Alternatively, they might be remnants of an ancient bar history, and their fields became chemically enriched while the clusters remained untouched. Such speculation is supported by the fact that the AMR of bar and non-bar regions are qualitatively similar, as we discuss in the following sections.
A star-forming region to the north of the bar is called Constellation III (marked in Figs. 3 and 4 with red dotted circle). We were able to determine metallicities in this region for two clusters: NGC1978 is an intermediate-age globular cluster and NGC1948 is a much younger and more metal-rich association of stars. The rest of the clusters were too young and did not have enough stars for metallicity estimation. The peak of the metallicity distribution of the field stars located in the Constellation III region is significantly lower than in the bar ( dex, dex). This may suggest that this structure is formed from the unenriched material of the LMC disk, where star formation started recently and has not yet enriched the environment.
The star cluster NGC1754 in the outer bar has much lower metallicity than other clusters in this region (clusters enclosed in an orange trapezoid in the Figs. 3 and 4), while also being quite different from the peak of the metallicity distribution of field stars ( dex, dex). This suggests that NGC1754 is not a part of the outer bar or that it is a remnant of ancient star-forming activity that had occured there. Other clusters in this region (except one) have mean metallicities similar to the peak value of the field stars, which seem to confirm their affiliation with this structure. On the other hand, KMHK521, seems to be associated with a nearby H region, and its subsolar metallicity (calculated however based on one star only) seems to be confirming this. Interestingly, the average field metallicity of the outer bar coincides better with the field metallicity of LMC outer regions as opposed to the bar region.
The clusters lying in the disk arms and periphery of the LMC are characterized by a wide range of metallicities (from to dex). The average value found for these clusters is dex ( dex) and the peak of the field star distribution is dex ( dex). There are few stars in the fields of the periphery clusters, which causes problems in characterizing the surroundings of the clusters and might be the reason of the discrepancy between these two values. The field stars number grows in the fields located closer to the denser, more metal-rich, inner regions and these stars contribute more to the field star distribution. The overall agreement of our spatial metallicity maps from Fig. 3 with those presented by, for instance, Choudhury et al. 2015; Choudhury et al. 2016 is highly satisfactory.
The right panel of Fig. 5 shows the metallicity distributions of the young giants and supergiants from the fields (stars such as the ones marked with triangles in the lower right panel in Fig. 2), analogous to those for the older field red giants in the left panel. The peak values of the metallicity distributions for the former are usually higher than corresponding values for the latter. However, there are few such stars in outer regions, so this comparison might be misleading.
3.2 Spatial age distribution of clusters in the LMC
Figure 4 shows the spatial map of the cluster ages estimated from Dartmouth (upper panel) and Padova (lower panel) isochrones, given in Table 3. This map is tightly correlated with the metallicity map. The low-metallicity star clusters are simultaneously older ones and they mostly occur in regions outside of the the bar, with several exceptions mentioned in a previous section. Numerous metal-rich star clusters in the LMC bar region have log(Ages) between and ( Myr to Gyr), with an average of and ( Myr). Such scatter in the ages supports the scenario put forward in the previous section that the oldest, low-metallicity star clusters are in fact not part of the bar. Also, considering the prediction that the bar was formed about Gyr ago (Bekki & Chiba 2005), the LMC bar cannot be the birthplace of those clusters.
Another region occupied mostly by young star clusters is Constellation III, with objects having logarithm of ages of ( Myr), with the sole exception of cluster NGC1978 which has a log(Age) of ( Gyr). The presence of this intermediate-age globular cluster in a young star forming region is quite puzzling, as its metallicity does not deviate much from the average metallicity of the field.
The outer bar cluster NGC1754 has an age of about Gyr, which deviates significantly from other clusters in this region, and supports the claim made in the previous section that it might not belong to this structure, but instead lies in front of or behind the bar. NGC1795, on the other hand, is a Gyr old intermediate-age cluster and might be a product of earlier star formation (as its metallicity coincide with metallicity of the field). The remaining outer bar clusters from our sample are young and could be associated with a nearby H region.
The logarithm of ages of star clusters from the LMC disk and peripheries varies between and ( Myr – Gyr). The youngest ages clearly stand out in the bottom panel of Fig. 4, and belong to: a) young association of stars LH47/NGC1935 and LH48 located between the LMC bar and Constellation III; b) clusters located to the east of the LMC bar and the Doradus regions (NGC2136 and KMHK1489); c) NGC2111 located in the southeast arm; d) NGC1844 and NGC1866 from northwest arm. The rest of the outermost stellar clusters are older than ( Myr), reaching up to the age of the Universe. The spatial age distribution obtained in this work is in good agreement with previous results, for instance, the recent star formation activity in the LMC presented by Harris & Zaritsky 2009, as well as the spatial age distribution depicted by Glatt et al. 2010.
3.3 Age–metallicity relation for star clusters in the LMC
The resulting age–metallicity relation for star clusters studied in this work that have both metallicity and age determinations, is illustrated in Fig. 6. Most of the clusters have ages between Myr and Gyr, but the oldest ones reach as far back as the age of the Universe (adopted here as Gyr). The measured metallicities range between and dex. The young star clusters are characterized by quite a broad spread in metallicity. As already mentioned in previous sections, and clearly visible in Fig. 7, most of the young, metal-rich stellar clusters tend to lie in the LMC bar region, with a few exceptions. Both Constellation III and the outer bar regions contain young and intermediate-age clusters. The disk and outermost regions of the LMC contain old, metal-poor objects, as well as most of the intermediate-age clusters and some young clusters too.
In Figs. 6 and 7 (bottom panels), we can see a rapid chemical enrichment, which applies mostly to the non-bar areas of the LMC, followed by a quiescent period, dubbed ”the age gap” in the literature, when the star formation rate in the galaxy was very low and chemical enrichment very modest. After this period, we can see a burst which started about Gyr ago, causing enrichment mostly in the outer regions (see bottom panel of Fig. 7). This burst was followed by another in the bar region, which started about Gyr ago and triggered significant star cluster formation from the still quite metal-poor material (about dex), causing enrichment of the environment up to about dex (see top panel of Fig. 7). The period between ( Myr) in the LMC bar still seems to be characterized by a low cluster formation rate which increases for younger ages. In the case of the LMC disk and periphery, we do not observe clusters in the age range of ( Myr). The age difference between the two clusters in the Constellation III (NGC1978 and NGC1948) is Gyr, while in the LMC outer bar, we see the presence of every age group.
There are several star clusters younger than about Gyr with dex, manifesting themselves in Figs. 6 and 7. Two such clusters in the non-bar regions (NGC2136 and KMHK1679) are located east to the bar (see Fig. 4), while bar clusters tend to clump in the west end of the bar. The metallicity of the most deviating cluster (OGLE-CL LMC 111) is based on only one star and could be an error of selection, however, for the rest of the clusters, this is unlikely. The reason of their specific location is unknown, however, areas of lower metallicity in this part of the bar could be also identified in the metallicity maps of Choudhury et al. 2015; Choudhury et al. 2016.
3.4 Age-metallicity relation for star clusters in the LMC in comparison to the SFH from the literature
A literature review shows that there exist many models describing the global enrichment history of the LMC that nonetheless cover different age ranges. In Fig. 6, ten models from seven works are marked: Pagel & Tautvaišvienė 1998, Carrera et al. 2008a, Harris & Zaritsky 2009, Rubele et al. 2012, Piatti & Geisler 2013, Meschin et al. 2014, and Perren et al. 2017.
All models predict the initial increase of the metallicity level in the LMC, but only the PT98 models trace it over the first Gyr, when it is rapid and steep. Our results also show this rapid increase of the metallicity for old clusters (up to about dex), although the oldest ones tend to have ages older than the age of the Universe (Dirsch et al. 2000; Beasley et al. 2002, this problem is known also in the literature, e.g.,). Other models (e.g., M14, HZ09 or R12) do not reach the oldest ages, which means that only the PT98 models reproduce the rapid growth of chemical enrichment observed in our results well.
Models in the range of ages between Gyr up to Gyr ago cannot be unambiguously confirmed by our data, because we have only one cluster in this range, which might be equally well fit to the PT98 bursting model, C08a, M14-0, or PG13 models. Meschin et al. 2014 indicated that a peak at Gyr in the M14-0 model is very uncertain, which is related to low star formation activity in that period of time. Nevertheless, it can be confidently stated that the chemical enrichment in the galaxy at that time was slow and mild. The authors describe this interval of time as a quiescence. The period itself is referred to as the age gap and our results confirm this gap. Moreover, what seems already evident at this point is that the PT98 closed box model tends to fail at describing the chemical history of the LMC.
Many models more or less clearly predict a burst of chemical enrichment at intermediate ages. The PT98 bursting model shows such a burst at the age of Gyr, when the metallicity abruptly increases from about dex to the current level of about dex. The M14 models show a general trend of increasing metallicity over time, but we may distinguish mild bursts about , and Gyr ago for M14-0, M14-1, and M14-2, respectively. The first two models predict a growth of chemical abundances up to about dex around 1 Gyr ago and M14-2 up to about dex currently. Model R12, after its initial growth is followed by Gyr of stagnation, and shows an ultimate big burst Gyr ago, which preceded two smaller ones and Gyr ago. Model P17 shows a major burst about Gyr ago after which the metallicity increased from around dex up to dex. On the other hand, there are three models (C08a, PG13, and PT98 closed box), which predict a rather monotonic growth of metallicity over a time, up to about to dex without any bursts in the history. Moreover, Carrera et al. 2008a emphasize that, on average, the bar is slightly more metal-rich than the inner disk, which we also confirmed and commented on in previous sections.
The HZ09 model presents a very different scenario from those described above. First, the metallicities predicted by this model are much lower than any other model in our list. After an initial growth of chemical enrichment from a starting value of about dex Gyr ago (in contrast to any of the other models), a decline of about dex occurs instead of an increase. The final burst appeares Gyr ago and raises the chemical abundances up to current level of about dex.
Our results agree well with the burst in chemical enrichment at the intermediate ages predicted by bursting PT98, M14, R12, and PG13 models. The start of the burst in the outer regions of the LMC occured Gyr ago, raising the metallicity by about dex. Such a burst in the LMC bar took place with a delay of some Gyr. The spread of metallicity in our data means that none of the listed models are favorable at the present day, although the overall agreement of our total AMR for star clusters with the PT98 bursting model is highly satisfactory. Nevertheless, this model tends to fail for the bar region where, at least at the beginning of the burst, clusters follow the HZ09 model better. The latter seems to reflect our resulting AMR of the bar region quite well, at least for some of the star clusters from the sample. This model, however, does not agree with the AMR for outer regions at all. This comparison confirms our belief that the chemical history of the LMC is complicated and cannot be described by a single SFH model.
Harris & Zaritsky 2009 speculate that after an initial epoch of star formation, during which old populous star clusters were formed, and the era of stagnation that follows it, some dramatic event took place that led to a resumption of star formation processes. These authors propose an explanation based on a merger of a gas-rich dwarf galaxy or a tidal encounter with the SMC (where a similar resumption of star formation has been observed). Our measured AMR for star clusters strongly corroborates this idea. Additionally, Harris & Zaritsky 2009 indicate qualitatively similar SFH of the LMC bar and non-bar regions, suggesting that the stars in the former have most likely always been part of the LMC. Again, we confirm such a conclusion, as we too observe a similar behavior of the AMR in these regions. Moreover, the growth of the metallicity in the LMC bar starts at an almost identical level as in the non-bar regions. The star formation here could have proceeded inwards as suggested by Piatti & Geisler 2013. We cannot, however, unequivocally confirm (or deny) enhanced star formation activity at Myr, Myr, Myr as reported by Harris & Zaritsky 2009, as the spread in the metallicities of young star clusters is high. We can, however, confirm a period of enhanced star formation that happened Gyr ago, although we argue that it started even earlier.
3.5 Comments on individual star clusters
The five clusters in Table 3 are marked with the appropriate comment. Two of them (NGC1858 and NGC1948) are young clusters for which only age estimates could be made. The given age values are mean values as both clusters appear to have multiple stellar populations of different ages or the age range is large. NGC2136 and NGC1850 are defined as binary or even triple (in the case of NGC1850) systems as reported in the SIMBAD database – and a possible second population of stars of different metallicity but similar age is visible in both of them. In the case of NGC2136, it may be explained as field stars, but NGC1850 requires deeper reflecion. It has been proven that this cluster has variations of reddening across the field of view (Correnti et al. 2017, e.g.,), also its companion clusters (BRHT5b and NGC1850A) are projected very close to the cluster center. Moreover, for instance, Milone et al. 2018 and Bastian et al. 2017 showed the presence of an extended main sequence explained as a separation of fast- and slow-rotating stars. Taken together, these factors can explain the additional population. Finally, the ESO121-3 cluster may host more populations with different metallicites, although in this case it could be, for example, the effect of N-enriched stars.
4 Discussion
Figure 8 presents our AMR with overplotted literature measurements of the metallicity and age for some of the star clusters considered in this work, obtained with various methods: Strömgren photometry (black diamonds); spectroscopy (high and low-resolution shown as blue squares and green dots, respectively; integrated as purple triangles); RGB slope (open triangles) and RGB-HB (grey triangles) methods, both expressed on the ZW84 scale; Washington photometry (open crosses), theoretical isochrone fitting method (crosses), and, finally, metallicities determined with ASteCA package from Perren et al. 2017 (open circles). Metallicities calculated in this work are compared to the literature in Fig. 9. We note that the metallicity scales used in each method may be different. Ages derived from isochrone fitting are compared with corresponding literature values in Fig. 10. As in Fig. 6, multiple entries of metallicity and age for several clusters from Table 3 are averaged. Table 6 provides an overview of selected literature parameters of the analyzed clusters.
4.1 Age-metallicity relation for clusters in the LMC in comparison to the literature
The top panel of Fig. 9 shows a direct comparison of the mean metallicity values of clusters obtained in this work with metallicities from the literature. The lower panels show the residuals of the metallicity values obtained in this work for a given star cluster and the corresponding literature values from different methods. Each panel presents a single method or a set of methods. The dashed lines mark the means of differences. A similar comparison for logarithms of ages estimated on the basis of Padova isochrones with literature values is presented in Fig. 10.
We noticed a significant difference in the mean metallicity of our results with values obtained with Strömgren photometry from Stein, Hilker & Richtler 1994; Hill et al. 1995; Dirsch et al. 2000; Piatti et al. 2019; Piatti & Bailin 2019, and Piatti 2020 ( dex). Moreover, the mean difference for the last three works is dex, while for the rest it is close to zero (about dex). This may seem surprising, especially given that in the last three works the same data were used. The reason for the existing disaccord has already been indicated in Paper I, and is a consequence of the use of the metallicity calibration of the Strömgren colors from Calamida et al. 2007, as well as slightly different data processing in the three last papers. This calibration does not cover the higher metallicity regime (over dex) and as a result, it significantly underestimates the obtained metallicities.
The difference between our results and metallicities derived from high-resolution spectroscopy is satisfactory and amounting to dex. A worse agreement exists for metallicities based on low-resolution spectroscopy, whereby our results are more metal-rich by dex. In the case of low-metallicity clusters (lower than dex), this discrepancy is dex and for more metal-rich clusters dex. Our metallicities show a similar offset from results coming from integrated spectroscopy, about dex.
There are only a few metallicity measurements obtained with the RGB slope method for which the mean difference is relatively small ( dex), although the spread of the results is significant. A large difference is also noted with respect to the RGB-HB method ( dex). Metallicities for three of the studied clusters were estimated with this method by Brocato et al. 1996 and they deviate notably from our results ( dex), while the values from Olsen et al. 1998 are much closer to our determinations ( dex); this indicates that perhaps metallicities are underestimated in Brocato et al. 1996.
There is comparatively good agreement between our results and Washington photometry. The mean difference of metallicities is dex. The same is true for the isochrone fitting method ( dex). Finally, the ASteCA package from Perren et al. 2017 is the only method (on average) that gives more metal-rich results than what is obtained in this work (about dex). As noted by the authors themselves, this method estimates on average larger metallicities than those in the literature by about dex.
In conclusion, on average metallicities derived in this work are higher than most literature values calculated by various methods, but the overall agreement is satisfactory. Additionally, our choice to use the Hilker 2000 metallicity calibration is validated by the wide range of metallicities found in the LMC. The calibration still has some problems in the low metallicity regime, but it gives satisfying results for higher metallicities. Other possible causes of non-compliance with the literature may be the use of a higher reddening value in many cases; differential reddening; or the presence of N-enriched stars that are found in old and intermediate-age clusters, as their presence may lead to an overestimation of the calculated metallicities.
A similar comparison of ages shows very satisfactory agreement of our estimations with literature values. There are only a few points deviating significantly from our results in Fig. 10, but the same points also deviate from other measurements from the literature.
A comparison with AMRs from the literature suggests very similar conclusions as those described in previous sections. Many authors ascribe ages that are older than the presently accepted age of the Universe to the clusters (Olsen et al. 1998; Dirsch et al. 2000; Leonardi & Rose 2003, e.g.,), which we also obtain from the isochrone fitting. Olszewski et al. 1991, for this example, arbitrarily assigned ages of Gyr for oldest clusters.
Multiple authors report the existence of an age gap between to Gyr when almost no star clusters were formed (Olszewski et al. 1991; Hill et al. 2000; Sharma et al. 2010, e.g.,), with a sole exception of the cluster ESO121-3 (Olszewski et al. 1991; Bica et al. 1998); and more recently, there is also KMHK1592 (Piatti 2022). The gap is also evident in our AMR. However, we do not confirm the specific position of ESO121-3 (marked with grey arrow in Fig. 6) in the relation (noting that for KMHK1592, we do not have the data). The cluster fits the PT98 bursting model prediction very well and it seems to complete the initial active epoch of star formation ( Gyr ago). This period is also characterized by slow increase of the metallicity value seen not only in the cluster, but also in the field AMR (Carrera et al. 2008a; Piatti & Geisler 2013, e.g.,). This phase came to an end Gyr ago, finished by a burst of chemical enrichment. We confirm this result, as we also see an increase of star cluster formation around this age.
Leonardi & Rose 2003 notice a second minimum in the cluster formation rate between ( Myr). Such a gap, however, is not present in the AMR from, for instance, Palma et al. 2015 or Perren et al. 2017, based on star clusters studied using the Washington photometry and coming from many fields, that is, mostly regions beyond the LMC bar. We, too, tend to see a lower cluster formation rate in the mentioned age range in our AMR. In the LMC bar, the burst in intermediate ages started later than in the non-bar regions, but efficient formation of clusters started there earlier than in the outer regions (where we do not observe clusters between ). Just as it seems reasonable to claim that the end of the first age gap indicates some dramatic event in the history of the LMC (such as an interaction with another galaxy), the later increase in cluster formation rate appears to have a different cause, as it apparently propagates in the inside-outside direction. The latter, however, might be caused by an observing bias, resulting from the poor coverage of the various LMC regions.
Piatti et al. 2003b described a dual behavior among clusters in the inner and outer disk of the LMC. They note that outer disk clusters formed up to Gyr ago, reaching [Fe/H] values of about dex. We agree with this statement, as we also see in our AMR that the effective creation of intermediate-age star clusters ends Gyr ago at the metallicity level of about dex, growing to about dex until the present time. They also note that in the inner LMC disk, clusters have formed up until the present time and they have higher metallicities, where some of them even reach solar abundances. Our results confirm that observation.
In the AMR of Palma et al. 2015, there is broad dispersion in metallicity for young clusters (about dex). We notice a similar spread in our data. Moreover, these authors report a tendency for younger clusters to be more metal-rich than intermediate ones (clusters older than Gyr have dex). Our intermediate-age clusters have metallicities between about and dex, but we do observe some lower values for younger clusters too. Nonetheless, qualitatively, the two relationships are similar.
Perren et al. 2017 reported a drop of the metallicity value in their AMR from about dex Gyr ago to about dex Gyr ago. We do not observe this in our AMR, as in this age range the metallicites of star clusters in our sample increase with time. Furthermore, the authors describe a steep increase in metallicity between Gyr ago up to dex, after which the metallicity reaches the present day value of about dex. The increase in our AMR is shallower and longer, occurring between Gyr ago, and the level of metallicity reaches about dex. Nevertheless, we note that many of our young clusters have mean metallicities on the level of dex or even higher.
An interesting and completely independent comparison of our results is undertaken with Graczyk et al. 2018, where the authors derived their AMR from analysis of spectroscopic and photometric observations of eclipsing binary systems from the field. Figure 11 is analogous to their Fig. 7, with overplotted values for our clusters. The authors claim that, on average, the metallicity of stars older than about Gyr is noticeably smaller than the metallicity of the younger population, which we also observe in the case of stellar clusters. However, the authors do go on to argue that from Gyr to about Gyr, the metallicity shows a large scatter, indicating a flat relation at a constant level. The eclipsing binaries that were studied lie in the LMC bar, as well as the non-bar regions; these are two areas that we find ought to be considered separately. Furthermore, these conclusions were reached based on a very low number of studied systems. As we show in the zoom panel in Fig. 11, the average metallicity of star clusters from non-bar regions (calculated in Gyr age bins) tend to increase in time, so we do not confirm the flat relation for those clusters. However, a large scatter of metallicity and poor statistics on bar clusters in the considered age range do not allow us to either confirm or refute this interpretation.
4.2 Ages of star clusters based on Cepheids
Overall, open clusters from our sample contain Cepheid variables in their fields. We decided to take advantage of these stars, and compute their ages using theoretical period-age (PA) relations from the literature, to obtain an independent estimation of ages of the clusters hosting Cepheids. We first checked the PMs and parallaxes of the identified Cepheids with the Gaia EDR3 catalog to check if their PMs are consistent with PMs of other stars in the area of the considered cluster. Otherwise, they could be excluded from potential cluster members. Periods of fundamental and first-overtone Cepheids were adopted from the OGLE Collection of Variable Stars (Soszyński et al. 2015a; Soszyński et al. 2017). Figure 12 shows a comparison of the mean cluster ages estimated by us from isochrone fitting, as well as PA relations for the LMC metallicity, also summarized in Table 2.
The average cluster ages derived from PA relations presented by Bono et al. 2005 are systematically smaller than our results obtained from isochrone fitting, where the shift is (). Anderson et al. 2016, unlike former authors, included in their models the effect of rotation. When we apply their formula to the same sample of Cepheids, the resulting average cluster ages are systematically older for the relation of Anderson et al. 2016. This is due to rotational mixing at the edge of the convective core during the main sequence, which extends this evolutionary phase. The average cluster ages calculated based on their PA relations with average rotation (, i.e., average initial rotation) and averaged over the 2nd and 3rd crossing and instabillity strip width, are much closer to our estimations, although a bit older (, ). The recent work of De Somma et al. 2021 presents new PA relations derived for canonical (case A) and non-canonical (case B) models of the mass-luminosity relation. Canonical models neglect the existence of any physical process able to increase the size of the convecting core of a star (for example, core convective overshooting) contrary to the non-canonical models. Their case A gives values very similar to Bono et al. 2005, while case B results in older ages. The mean difference between cluster ages obtained in this work and case A of De Somma et al. 2021 is () and for case B, it is ().
The above comparison illustrates the differences between various models, where the age spread between them is quite large. That means that we still do not have a precise method for calculating the ages of stars and star clusters, and all methods are burdened with errors. Our age values are closest to ages obtained with Cepheid PA relations that Anderson et al. 2016 derived for models including rotation and the non-canonical models from De Somma et al. 2021. These models are more physically justified than the two others as mixing beyond the edge of convective core during its main sequence evolution, which leads to longer main sequence phase and older Cepheids – this is expected. Without additional mixing the so-called Cepheid mass discrepancy problem is manifested in masses of classical Cepheids, as predicted by evolution theory, that are overestimated as compared to pulsation masses (Keller 2008, see). Additional mixing, whether due to overshooting, or due to rotation, alleviates or removes the discrepancy (Prada Moroni et al. 2012; Anderson et al. 2014, see e.g.,). Also, the width of the main sequence in the turn-off region most probably is explained by a large population of fast rotating stars in LMC clusters (Bastian et al. 2016, e.g.,). Additional mixing is also necessary to reproduce properties of helium burning double-lined eclipsing binary systems (Claret & Torres 2016, see e.g.,) or to reproduce the width of the main sequence (Maeder & Mermilliod 1981, see e.g.,).
4.3 Comparison of age–metallicity relation for clusters in the LMC and SMC
The uniform analysis of the AMR in the LMC presented in this work and in the SMC from Paper I provides the opportunity to compare them, as shown in Fig. 13. Firstly, we can conclude that these two galaxies show a different chemical enrichment history. Rapid chemical enrichment has occured in the LMC since the very beginning of its history and lasted for about Gyr. During that time, many old globular clusters were formed, that survived till this day. On the other hand, in the SMC, star clusters older than Gyr are not observed. For the next Gyr there is a gap in the cluster formation history of the LMC while in the AMR of the SMC two bursts are visible at about and Gyr ago, causing star cluster formation and chemical enrichment in the outer regions of this galaxy. The latter burst is followed by another in the LMC’s outer regions, which might indicate the ancient event referred to in Harris & Zaritsky 2009 as the major triple-interaction between these two galaxies and the MW. The last enrichment raised the current metallicity value in the SMC up to about dex, and the average metallicity of numerous young star clusters in the LMC located mostly in the bar region rose to about dex.
5 Summary and conclusions
In this work, we present Strömgren photometry of fields in the LMC, where we identified star clusters for which we derived either mean metallicities and ages or only ages. We also calculated mean metallicities for the fields around these clusters. To obtain metallicities of individual stars, we took advantage of the metallicity calibration of the Strömgren colors presented by Hilker 2000, derived for a wide range of metallicities (from up to dex). We estimated ages of clusters from our sample using theoretical isochrones from the Dartmouth and Padova groups. During the analysis we utilized the recent reddening maps of G20 and S21, as well as the distance to the LMC obtained by Pietrzyński et al. 2019.
As a result, we obtained both metallicities and ages for star clusters from various regions of the LMC. For the remaining clusters, we provided the ages only. To the best of our knowledge, for clusters, this is the first-ever estimation of the metallicity, for of them age was provided for the first time, and, finally, in case of clusters (having metallicites from the range between and dex and log-ages between and ), both values are given here for the first time. These results allowed us to trace the metallicity and age distribution across the LMC, and to construct the AMR of the LMC star clusters, from which we were able to deduce the following chemical enrichment history in the LMC:
- •
An initial, ancient burst created old, populous star clusters. This period was relatively short and the metallicity increased from dex up to about dex.
- •
This is followed by a long period of stagnation with hardly any star cluster formation, and the chemical enrichment was very minor. This age gap lasted from Gyr to Gyr ago.
- •
After that epoch, about Gyr ago, a burst of formation of intermediate-age clusters in the non-bar regions lasted for Gyr, enriching the environment from about dex to dex. This was followed by another minimum in star cluster formation lasting for Myr. This, however, is highly uncertain and might be a consequence of the poor coverage of the outer regions of the LMC. The first large burst was probably a result of galaxy-galaxy interaction, while the second one, if true, might possibly have a different cause. The chemical abundance in the non-bar region rose to the present-day value of about about dex.
- •
an analogous burst appeared Gyr ago in the bar region, enriching the environment from about dex up to dex (with a few clusters having about dex). After the burst the cluster formation rate was relatively low, until Myr ago, since when many young and metal-rich clusters were formed, some of them even having solar-like abundances. These young clusters are also characterized by a large spread in metallicity (of about dex). The bar star clusters (except two) with metallicities of about dex and lower are located at the western end of the bar.
We compared our AMR with literature SFHs and other AMRs. The best fitting SFH model in the non-bar regions is the PT98 bursting model, which reproduces the initial rapid enrichment very well, followed by a certain stagnation period and an intermediate-age burst, which raised the metallicity to the current level of dex. Our results fit this scenario well. The AMR of the LMC bar seems to fit the HZ09 model up until Myr ago, but fails for young, metal-rich clusters. The AMRs from the literature qualitatively agree well with our results and are also characterized by quite a large metallicity dispersion for a given age, which is especially evident for young clusters. It is also worth noting that on average we provided higher metallicity values than reported by various authors.
As an independent test of the correctness of our isochrone-derived ages, we compared them with mean ages calculated for the clusters hosting Cepheid variables. For the latter, we used PA relations from literature along with pulsation periods from OGLE catalogs. We note systematic shifts between our values and a given PA relation, which show that the ages derived from PA relations are model-dependent. This implies that a precise method of calculating ages of stars, and therefore star clusters as well, is lacking.
Finally, we compared the AMR for the LMC from this work with the AMR for the SMC from Narloch et al. 2021. We claim that these two relations show distinct chemical enrichment histories, which, however, became entangled in intermediate ages, suggesting a former interaction of these two galaxies. The photometric catalog of Strömgren photometry used in this work has been made publicly available.
Acknowledgements.
We thank the anonymous referee for valuable comments which improved this paper. The research leading to these results has received funding from the European Research Council (ERC) under the European Union’s Horizon 2020 research and innovation program (grant agreement No 695099). We also acknowledge support from the National Science Center, Poland grants MAESTRO UMO-2017/26/A/ST9/00446, BEETHOVEN UMO-2018/31/G/ST9/03050 and DIR/WK/2018/09 grants of the Polish Ministry of Science and Higher Education. We also acknowledge financial support from UniverScale grant financed by the European Union’s Horizon 2020 research and innovation programme under the grant agreement number 951549. We gratefully acknowledge financial support for this work from the BASAL Centro de Astrofisica y Tecnologias Afines (CATA) AFB-170002 and the Millenium Institute of Astrophysics (MAS) of the Iniciativa Cientifica Milenio del Ministerio de Economia, Fomento y Turismo de Chile, project IC120009. B.P. gratefully acknowledge support from the Polish National Science Centre grant SONATA BIS 2020/38/E/ST9/00486. R.S. acknowledges support from SONATA BIS grant, 2018/30/E/ST9/00598, from the National Science Centre, Poland. P.W. gratefully acknowledges financial support from the Polish National Science Centre grant PRELUDIUM2018/31/N/ST9/02742. This work has made use of data from the European Space Agency (ESA) mission Gaia (https://www.cosmos.esa.int/gaia), processed by the Gaia Data Processing and Analysis Consortium (DPAC, https://www.cosmos.esa.int/web/gaia/dpac/consortium). Funding for the DPAC has been provided by national institutions, in particular the institutions participating in the Gaia Multilateral Agreement.| RA | DEC | X | Y | Field | ||||||
| (deg) | (deg) | (pixel) | (pixel) | (mag) | (mag) | (mag) | (mag) | (mag) | (mag) | |
| 69.469470 | -70.587620 | 6.071 | 887.872 | 1 | 21.118 | 0.056 | 0.056 | 0.236 | 0.085 | 0.086 |
| 69.469389 | -70.566830 | 7.703 | 1375.837 | 1 | 20.969 | 0.052 | 0.053 | 0.416 | 0.080 | 0.081 |
| 69.469200 | -70.572246 | 8.944 | 1248.710 | 1 | 20.386 | 0.031 | 0.032 | 0.303 | 0.047 | 0.049 |
| 69.469042 | -70.580556 | 9.779 | 1053.677 | 1 | 19.167 | 0.012 | 0.015 | 0.605 | 0.019 | 0.025 |
| 69.468859 | -70.570779 | 11.681 | 1283.150 | 1 | 21.404 | 0.074 | 0.074 | 0.266 | 0.107 | 0.107 |
| (…) | ||||||||||
| CHI | SHARP | |||
| (mag) | (mag) | (mag) | ||
| 0.001 | 0.195 | 0.200 | 0.779 | -0.696 |
| -0.134 | 0.153 | 0.158 | 0.816 | -0.418 |
| 0.013 | 0.082 | 0.085 | 0.792 | -0.262 |
| 0.385 | 0.059 | 0.067 | 0.778 | 0.187 |
| 0.031 | 0.185 | 0.190 | 0.790 | -1.177 |
| (…) | ||||
| Cluster | log(AgeP) | log(AgeB05) | log(AgeA16) | log(AgeDS2021) | log(AgeDS2021) | NF | N1O |
| canonical | noncanonical | ||||||
| (yr) | (yr) | (yr) | (yr) | (yr) | |||
| KMHK421 | 8.250.08 | 7.970.01 | 8.250.007 | 7.960.009 | 8.120.008 | 2 | - |
| BSDL581 | 8.020.06 | 7.65 | 7.98 | 7.64 | 7.83 | 1 | - |
| OGLE-CL LMC 113 | 7.930.10 | 7.55 | 7.89 | 7.54 | 7.74 | 1 | - |
| NGC1850 | 7.900.20(∗) | 7.600.16 | 7.940.14 | 7.600.16 | 7.790.14 | 3(a) | - |
| H88 165 | 7.800.10 | 7.57 | 7.91 | 7.56 | 7.76 | 1 | - |
| NGC1854 | 7.920.08 | 7.740.14 | 8.210.34 | 7.860.32 | 7.960.19 | 1 | 1 |
| NGC1866 | 8.220.10 | 8.030.03 | 8.310.04 | 8.020.03 | 8.150.05 | 14 | 2 |
| NGC1894 | 8.000.10 | 7.78 | 8.09 | 7.77 | 7.95 | 1 | - |
| NGC1903 | 7.980.10 | 7.670.09 | 8.020.09 | 7.680.10 | 7.910.14 | 2 | 1 |
| OGLE-CL LMC 321 | 8.270.13 | 7.970.05 | 8.250.05 | 7.960.05 | 8.110.05 | 2 | - |
| H88 283 | 8.180.08(∗) | 7.60 | 8.34 | 7.99 | - | - | 1 |
| OGLE-CL LMC 407 | 8.090.08 | 7.82 | 8.13 | 7.82 | 7.99 | 1 | - |
| OGLE-CL LMC 431 | 8.030.10 | 7.680.61 | 8.280.14 | 7.970.02 | 8.050.09 | 1 | 1 |
| NGC1950 | 8.000.10 | 7.82 | 8.13 | 7.81 | 7.98 | 1 | - |
| NGC1969 | 8.100.05 | 7.93 | 8.22 | 7.92 | 8.08 | 1 | - |
| BSDL1759 | 8.060.05 | 7.770.05 | 8.080.05 | 7.760.05 | 7.930.05 | 2 | - |
| NGC1971 | 8.020.10 | 7.93 | 8.14 | 7.80 | - | - | 1 |
| BSDL1821 | 7.920.05 | 7.74 | 8.05 | 7.73 | 7.91 | 1 | - |
| NGC1986 | 7.980.12 | 7.570.56 | 8.200.07 | 7.880.10 | 7.960.21 | 1 | 1 |
| OGLE-CL LMC 512 | 8.140.11(∗) | 7.900.08 | 8.230.11 | 7.900.08 | 7.980.04 | 1 | 1 |
| NGC2016 | 8.190.12 | 7.650.42 | 8.230.004 | 7.910.04 | 7.990.15 | 1 | 1 |
| BSDL2205 | 8.250.10 | 7.96 | 8.24 | 7.95 | 8.11 | 1 | - |
| OGLE-CL LMC 585 | 8.100.10 | 7.92 | 8.21 | 7.91 | 8.07 | 1 | - |
| OGLE-CL LMC 591 | 8.290.10 | 8.050.09 | 8.290.04 | 7.980.08 | 8.050.19 | 1(b) | - |
| NGC2065 | 8.170.10 | 7.860.14 | 8.260.09 | 7.950.08 | 8.080.08 | 7(a) | 3 |
| NGC2136 | 8.160.12 | 7.820.14 | 8.140.13 | 7.810.14 | 7.930.12 | 2(c) | 1 |
References
- Anderson et al. (2014) Anderson, R. I., Ekström, S., Georgy, C. et al. 2014, A&A, 564, A100
- Anderson et al. (2016) Anderson, R. I., Saio, H., Ekström, S. et al. 2016, A&A, 591, 8
- Bastian et al. (2016) Bastian, N., Niederhofer, F., Kozhurina-Platais, V. 2016, MNRAS, 460, L20
- Bastian et al. (2017) Bastian, N., Cabrera-Ziri, I., Niederhofer, F. 2017, MNRAS, 465, 4795
- Beasley et al. (2002) Beasley, M. A., Hoyle, F., Sharples, R. M. 2002, MNRAS, 336, 168
- Bekki & Chiba (2005) Bekki, K., Chiba, M. 2005, MNRAS, 356, 680B
- Bica et al. (1998) Bica, E., Geisler, D., Dottori, H., et al. 1998, AJ, 116, 723
- Bica et al. (1999) Bica, E. L. D., Schmitt, H. R., Dutra, C. M. et al. 1999, AJ, 117, 238
- Bertelli et al. (1992) Bertelli, G., Mateo, M., Chiosi, C., & Bressan, A. 1992, ApJ, 388, 400
- Bressan et al. (2012) Bressan, A., Marigo, P., Girardi, L. et al. 2012, MNRAS, 427, 127
- Brocato et al. (1996) Brocato, E., Castellani, V., Ferraro, F. R., et al. 1996, MNRAS, 282, 614
- Bono et al. (2005) Bono, G., Marconi, M., Cassisi, S. et al. 2005, ApJ, 621, 966
- Calamida et al. (2007) Calamida, A., Bono, G., Stetson, P. B. et al. 2007, ApJ, 670, 400
- Cardelli et al. (1989) Cardelli, J. A., Clayton, G. C., Mathis, J. S. 1989, ApJ, 345, 245
- Carrera et al. (2008a) Carrera, R., Gallart, C., Hardy, E. et al. 2008a, ApJ, 135, 836
- Choudhury et al. (2015) Choudhury, S., de Grijs, R., Bekki, K. et al. 2015, MNRAS, 507, 4752C
- Choudhury et al. (2016) Choudhury, S., Subramaniam, A., Cole, A. A. et al. 2016, MNRAS, 455, 1855C
- Claret & Torres (2016) Claret, A., Torres, G. 2016, A&A, 592, A15
- Colucci et al. (2011) Colucci, J. E., Bernstein, R. A., Cameron, S. A., & McWilliam, A. 2011, ApJ, 735, 55
- Colucci et al. (2012) Colucci, J. E., Bernstein, R. A., Cameron, S. A., & McWilliam, A. 2012, ApJ, 746, 29
- Correnti et al. (2017) Correnti, M., Goudfrooij, P., Bellini, A. et al. 2017, MNRAS, 467, 3628
- De Marchi et al. (2021) De Marchi, G., Panagia, N., Milone, A. P. 2021, arXiv:2109.13914
- De Somma et al. (2021) De Somma, G., Marconi, M., Cassini, S. et al. 2021, MNRAS, 508, 1473
- Dirsch et al. (2000) Dirsch, B., Richtler, T., Gieren, W. P., & Hilker, M. 2000, A&A, 360, 133
- Dolphin & Hunter (1998) Dolphin, A. E., Hunter, D. A. 1998, AJ, 116, 1275
- Dotter et al. (2008) Dotter, A., Chaboyer, B., Jevremović, D. et al. 2008, ApJS, 178, 89
- Ferraro et al. (2006) Ferraro, F. R., Mucciarelli, A., Carretta, E., & Origlia, L. 2006, ApJ, 645, 33
- Fischer et al. (1993) Fischer, P., Douglas, L. W. 1993, AJ, 105, 938
- Gaia Collaboration (2016b) Gaia Collaboration et al., 2016b, The Gaia mission. A&A, 595, A1
- Gaia Collaboration (2021) Gaia Collaboration et al. 2021, A&A, 649, A1
- Geisler et al. (1997) Geisler, D., Bica, E., Dottori, H. et al. 1997, AJ, 114, 192
- Geisler et al. (2003) Geisler, D., Piatti, A. E., Bica, E., & Clariá, J. J. 2003, MNRAS, 341, 771
- Gieren et al. (2005) Gieren, W., Pietrzyński, G., Bresolin, F. 2005, The Messenger, 121, 23
- Girardi et al. (1995) Girardi, L., Chiosi, C., Bertelli, G., & Bressan, A. 1995, A&A, 298, 87
- Glatt et al. (2010) Glatt, K., Grebel, E. K., Koch, A. 2010, A&A, 517, 50
- Górski et al. (2020) Górski, M., Zgirski, B., Pietrzyński, G. et al. 2020, ApJ, 889, 179
- Graczyk et al. (2018) Graczyk, D., Pietrzyński, G., Thompson, I. B. et al. 2018, ApJ, 860, 1
- Harris & Zaritsky (2009) Harris, J., Zaritsky, D. 2009, AJ, 138, 1243
- Hill et al. (1995) Hill, R. S., Cheng, K. P., Bohlin, R. C., et al. 1995, ApJ, 446, 622
- Hill et al. (2000) Hill, V., Francois, P., Spite, M. et al. 2000, A&A, 364, 19
- Hilker et al. (1995) Hilker, M., Richtler, T., Gieren, W. 1995, A&A, 294, 648
- Hilker (2000) Hilker, M. 2000, A&A, 355, 994
- Hilker & Richtler (2000) Hilker, M., Richtler, T. 2000, A&A, 362, 895
- Hollyhead et al. (2018) Hollyhead, K., Lardo, C., Kacharov, N. 2018, MNRAS, 476, 114
- Jasniewicz & Thevenin (1994) Jasniewicz, G., Thevenin, F. 1994, A&A, 282, 717
- Johnson et al. (2006) Johnson, J. A., Ivans, I. I., Stetson, P. B. 2006, ApJ, 640, 801
- Keller (2008) Keller, S. C. 2008, ApJ, 677, 483
- Kerber et al. (2007) Kerber, L. O., Santiago, B. X., Brocato, E. 2007, A&A, 462, 139
- Lemasle et al. (2017) Lemasle, B., Groenewegen, M. A. T., Grebel, E. K. et al. 2017, A&A, 608, A85
- Leonardi & Rose (2003) Leonardi, A. J., Rose, J. A. 2003, AJ, 126, 1811
- Lindegren et al. (2021) Lindegren, L., Klioner, S., Hernández, J. et al. 2021, A&A, 649, A2
- Livanou et al. (2013) Livanou, E., Dapergolas, A., Kontizas, M. et al. 2013, A&A, 554, 16
- Maeder & Mermilliod (1981) Maeder, A., Mermilliod, J. C. 1981, A&A, 93, 136
- Marigo et al. (2017) Marigo, P., Girardi, L., Bressan, A. et al. 2017, ApJ, 835, 77
- Martocchia et al. (2017) Martocchia, S., Bastian, N., Usher, C. et al. 2017, MNRAS, 468, 3150
- Martocchia et al. (2018a) Martocchia, S., Cabrera-Ziri, I., Lardo, C. et al. 2018a, MNRAS, 473, 2688
- Martocchia et al. (2018b) Martocchia, S., Niederhofer, F., Dalessandro, E.et al. 2018, MNRAS, 477, 4696
- Martocchia et al. (2019) Martocchia, S., Dalessandro, E., Lardo, C. et al. 2019, MNRAS, 487, 5324
- Martocchia et al. (2021) Martocchia, S., Lardo,C., Rejkuba, M. et al. 2021, MNRAS, 505, 5389
- Meschin et al. (2014) Meschin, I., Gallart, C., Aparicio, A. et al. 2014, MNRAS, 438, 1067
- Milone et al. (2013) Milone, A. P., Bedin, L. R., Cassisi, S.et al. 2013, A&A, 555, A143
- Milone et al. (2017) Milone, A. P., Marino, A. F., D’Antona, F.et al. 2017, MNRAS, 465, 4363
- Milone et al. (2018) Milone, A. P., Marino, A. F., Di Criscienzo, M. et al. 2018, MNRAS, 477, 2640
- Mould et al. (1997) Mould, J. R., Han, M., Stetson, P. B.et al. 1997, ApJ, 483, 41
- Mucciarelli et al. (2008) Mucciarelli, A., Carretta, E., Origlia, L., & Ferraro, F. R. 2008, AJ, 136, 375
- Mucciarelli et al. (2010) Mucciarelli, A., Carretta, E., Origlia, L., & Ferraro, F. R. 2008, AJ, 136, 375
- Mucciarelli et al. (2011) Mucciarelli, A., Cristallo, S., Brocato, E.et al. 2008, MNRAS, 413, 837
- Mucciarelli et al. (2012) Mucciarelli, A., Origlia, L., Ferraro, F. R.et al. 2012, ApJ, 746, 19
- Narloch et al. (2017) Narloch, W., Kaluzny, J., Poleski, R. et al. 2017, MNRAS, 417, 1446
- Narloch et al. (2019) Narloch, W., Pietrzyński, G., Kołaczkowski, Z. et al. 2019, MNRAS, 489, 3285
- Narloch et al. (2021) Narloch, W., Pietrzyśki., G., Gieren, W. et al. 2021, A&A, 647, A135
- Niederhofer et al. (2015) Niederhofer, F., Hilker, M., Bastian, N., & Silva-Villa, E. 2015, A&A, 575, 62
- O’Donnell (1994) O’Donnell J. E. 1994, ApJ, 422, 158
- Olsen et al. (1997) Olsen, K. A. G., Hodge, P. W., Wilcots, E. M., & Pastwick, L. 1997, ApJ, 475, 545
- Olsen et al. (1998) Olsen, K. A. G., Hodge, P. W., Mateo, M.et al. 1998, MNRAS, 300, 665
- Olszewski et al. (1991) Olszewski, E. W., Schommer, R. A., Suntzeff, N. B., & Harris, H. C. 1991, AJ, 101, 515
- Oey & Massey (1995) Oey, M. S., Massey, P. 1995, ApJ, 452, 210
- Pagel & Tautvaišvienė (1998) Pagel, B. E. J., Tautvaišvienė, G. 1998, MNRAS, 299, 535
- Palma et al. (2015) Palma, T., Clariá, J. J., Geisler, D. et al. 2015, MNRAS, 450, 2122
- Palma et al. (2016) Palma, T., Gramajo, L. V., Clariá, J. J. et al. 2016, MNRAS, 586, A41
- Pastorelli et al. (2019) Pastorelli, G., Marigo, P., Girardi, L. 2019, MNRAS, 485, 5666
- Perren et al. (2017) Perren, G. I., Piatti, A. E., Vázquez, R. A. 2017, A&A, 602, 89
- Piatti et al. (2003b) Piatti, A. E., Bica, E., Geisler, D., & Clariá, J. J. 2003b, MNRAS, 344, 965
- Piatti & Geisler (2013) Piatti, A. E., Geisler, D. 2013, AJ, 145, 17
- Piatti (2018) Piatti, A. E. 2018, AJ, 156, 5
- Piatti et al. (2019) Piatti, A. E., Pietrzyński, G., Narloch W. et al. 2019, MNRAS, 483, 4, 4766-4773
- Piatti & Bailin (2019) Piatti, A. E., Bailin, J. 2019, AJ, 157, 49
- Piatti (2020) Piatti, A. E. 2020, A&A, 642, 114
- Piatti (2021) Piatti, A. E. 2021, A&A, 647, 47
- Piatti (2022) Piatti, A. E. 2022, arXiv:2201.09926
- Pieres et al. (2016) Pieres, A., Santiago, B., Balbinot, E., & Luque, et al. 2016, MNRAS, 461, 519
- Pietrzyński et al. (1999b) Pietrzyński, G., Udalski, A., Kubiak, M. 1999b, Acta Astron., 49, 521
- Pietrzyński & Udalski (2000) Pietrzynski, G., Udalski, A. 2000, AcA, 50, 355
- Pietrzyński et al. (2019) Pietrzyński, G., Graczyk, D., Gallenne, A. et al. 2019, Natur., 567, 200
- Prada Moroni et al. (2012) Prada Moroni, P. G., Gennaro, M., Bono, G. et al. 2012, ApJ, 749, 108
- Rich et al. (2001) Rich, R. M., Shara, M. M., Zurek, D. 2001, AJ, 122, 842
- Richter et al. (1999) Richter, P., Hilker, M., Richtler, T. 1999, A&A, 350, 476
- Rubele et al. (2012) Rubele, S., Kerber, L., Girardi, L. et al. 2012, A&A, 537, 106
- Sarajedini (1998) Sarajedini A. 1998, AJ, 116, 738
- Sarajedini et al. (2002) Sarajedini, A., Grocholski, A. J., Levine, J., & Lada, E. 2002, AJ, 124, 2625
- Schlegel et al. (1998) Schlegel, D. J., Finkbeiner, D. P., Davis, M. 1998, ApJ, 500, 525
- Sharma et al. (2010) Sharma, S., Borissova, J., Kurtev, R. et al. 2010, AJ, 139, 878
- Skowron et al. (2021) Skowron, D. M., Skowron, J., Udalski, A. et al. 2021, ApJS, 252, 23
- Song et al. (2019) Song, Y., Mateo, M., Mackey, A. D. et al. 2019, MNRAS, 490, 385
- Song et al. (2021) Song, Y., Mateo, M., Bailey, J. I. et al. 2021, arXiv:2104.06882
- Soszyński et al. (2015a) Soszyński, I., Udalski, A., Szymański, M. K. et al. 2015a, Acta Astron., 65, 297
- Soszyński et al. (2017) Soszyński, I., Udalski, A., Szymański, M. K. et al. 2017, Acta Astron., 67, 103
- Stein, Hilker & Richtler (1994) Stein, D., Hilker, M., Richtler, T. 1994, AGAb, 10, 198
- Stetson (1987) Stetson, P. B. 1987, PASP, 99, 191
- Stetson (1990) Stetson, P. B. 1990, PASP, 102, 932
- Subramanian & Subramaniam (2009) Subramanian, S., Subramaniam, A. 2009, A&A, 496, 399
- Udalski et al. (2008a) Udalski, A., Soszyński, I., Szymański, M. K. et al. 2008a, AcA, 58, 89
- Vallenari et al. (1994a) Vallenari, A., Aparicio, A., Fagotto, F., & Chiosi, C. 1994a, A&A, 284, 424
- Vallenari et al. (1994b) Vallenari, A., Aparicio, A., Fagotto, F. et al. 1994b, A&A, 284, 447
- Will et al. (1996) Will, J. M., Bomans, D. J., Vallenari, A. et al. 1996, A&A, 315, 125
- Yang et al. (2021) Yang, Y., Li, C., de Grijs, R., & Deng, L. 2021, ApJ, 912, 27
- Zinn & West (1984) Zinn, R., West, M. J. 1984, ApJS, 55, 45
Appendix A Astrophysical properties of star clusters and fields
1]
| Cluster | Dmaj;Dmin | PA | NC | log(AgeP) | AgeD | ||
|---|---|---|---|---|---|---|---|
| (arcmin) | (deg) | (mag) | (dex) | (yr) | (Gyr) | ||
| NGC1651 | 2.70;2.70 | 0 | 0.110(a) | -0.430.04 (0.13) | 81 | 9.200.10 | 1.500.30 |
| KMHK21 | 1.50;1.50 | 0 | 0.070(a) | -0.460.04 (0.12) | 25 | 9.340.07 | 2.100.30 |
| NGC1841 | 4.00;4.00 | 0 | 0.160(a) | -1.510.02 (0.11) | 52 | 10.260.05 | 14.02.00 |
| NGC1711 | 3.50;3.30 | 40 | 0.125 | -0.310.03 (0.11) | 6 | 7.750.06 | - |
| KMHK156(∗∗) | 0.90;0.80 | 120 | 0.109 | - | - | 7.380.03 | - |
| NGC1754 | 1.60;1.60 | 0 | 0.112 | -1.070.04 (0.13) | 50 | 10.000.10 | 11.02.00 |
| ESO85-21 | 1.30;1.30 | 0 | 0.040(S) | -0.440.09 (0.13) | 7 | 9.330.06 | 2.200.40 |
| NGC1786 | 2.00;2.00 | 0 | 0.089 | -1.330.03 (0.12) | 35 | 10.060.06 | 12.01.50 |
| NGC1795 | 1.40;1.30 | 170 | 0.110 | -0.350.04 (0.12) | 28 | 9.020.10 | 1.000.20 |
| KMHK421(∗) | 1.00;0.90 | 130 | 0.082 | -0.540.29 (0.12) | 1 | 8.250.08 | - |
| H88 87(∗) | 0.85;0.75 | 90 | 0.086 | -0.330.11 (0.12) | 2 | 8.330.09 | - |
| NGC1804(∗) | 0.95;0.85 | 170 | 0.106 | -0.210.06 (0.11) | 3 | 7.790.10 | - |
| SL191(∗,∗∗) | 1.10;1.00 | 160 | 0.089 | -0.620.10 (0.11) | 6 | 8.170.20 | - |
| H88 104(∗) | 0.55;0.50 | 170 | 0.075 | -0.800.07 (0.13) | 4 | 8.950.10 | - |
| H88 107(∗) | 0.50;0.40 | 20 | 0.075 | -0.650.09 (0.12) | 5 | 9.050.10 | 1.000.25 |
| BRHT3b(∗) | 0.75;0.65 | 30 | 0.073 | -0.720.19 (0.13) | 2 | 8.800.12 | - |
| NGC1830 | 1.30;1.20 | 60 | 0.075 | -0.140.03 (0.12) | 8 | 8.450.12 | - |
| SL211(∗,∗∗) | 1.00;0.85 | 50 | 0.071 | -0.240.37 (0.14) | 1 | 8.400.07 | - |
| BSDL555(∗,∗∗) | 0.65;0.55 | 100 | 0.088 | -0.240.08 (0.12) | 2 | 8.450.12 | - |
| KMHK521(∗) | 0.60;0.55 | 10 | 0.119 | -0.040.28 (0.12) | 1 | 7.910.06 | - |
| BSDL565 | 0.85;0.50 | 90 | 0.079 | - | - | 7.960.05 | - |
| NGC1835 | 2.30;2.00 | 80 | 0.088 | -1.380.03 (0.11) | 38 | 10.150.05 | 13.52.00 |
| H88 119(∗∗) | 0.50;0.45 | 140 | 0.081 | - | - | 8.310.10 | - |
| H88 120(∗,∗∗) | 0.70;0.65 | 140 | 0.085 | -0.520.11 (0.14) | 3 | 8.730.05 | - |
| -0.440.14 (0.14) | 2 | 8.730.10 | - | ||||
| BSDL577 | 0.60;0.45 | 30 | 0.077 | - | - | 7.970.05 | - |
| BSDL581 | 0.60;0.50 | 140 | 0.077 | - | - | 8.020.06 | - |
| BSDL582(∗∗) | 0.95;0.80 | 160 | 0.111 | - | - | 7.500.12 | - |
| HS107(∗) | 1.10;0.90 | 120 | 0.076 | -0.370.28 (0.12) | 1 | 8.200.10 | - |
| SOI343 | 0.95;0.90 | 10 | 0.110 | - | - | 7.320.05 | - |
| BSDL591(∗,∗∗) | 1.20;0.60 | 140 | 0.082 | -0.320.24 (0.12) | 2 | 7.920.07 | - |
| -0.380.19 (0.12) | 2 | 7.920.07 | - | ||||
| -0.440.24 (0.11) | 1 | 7.940.11 | - | ||||
| NGC1836 | 1.50;1.40 | 50 | 0.085 | -0.590.06 (0.13) | 13 | 8.630.13 | - |
| -0.420.12 (0.13) | 5 | 8.630.13 | - | ||||
| -0.570.13 (0.13) | 9 | 8.640.13 | - | ||||
| HS109(∗) | 1.00;0.90 | 170 | 0.075 | -0.090.31 (0.12) | 1 | 7.850.05 | - |
| BRHT4b | 1.00;0.90 | 140 | 0.083 | -0.400.25 (0.11) | 1 | 7.860.10 | - |
| -0.510.08 (0.12) | 2 | 8.000.11 | - | ||||
| -0.630.08 (0.12) | 3 | 8.030.11 | - | ||||
| HS111(∗,∗∗) | 0.60;0.50 | 0 | 0.122 | -0.610.05 (0.13) | 3 | 9.050.10 | 1.000.50 |
| BSDL599(∗,∗∗) | 1.80;1.50 | 80 | 0.091 | -0.050.23 (0.11) | 1 | 7.860.08 | - |
| -0.120.23 (0.11) | 1 | 7.860.11 | - | ||||
| BSDL603 | 1.10;0.95 | 170 | 0.091 | - | - | 7.920.15 | - |
| NGC1839 | 1.60;1.60 | 0 | 0.076 | -0.100.10 (0.12) | 2 | 7.950.12 | - |
| -0.170.11 (0.12) | 2 | 7.960.13 | - | ||||
| -0.170.08 (0.12) | 2 | 7.960.13 | - | ||||
| NGC1838 | 1.30;1.20 | 20 | 0.104 | -0.380.24 (0.13) | 1 | 8.050.10 | - |
| BSDL623 | 0.90;0.80 | 120 | 0.091 | - | - | 8.000.10 | - |
| OGLE-CL LMC 111(∗) | 1.20;1.10 | 60 | 0.098 | -1.180.42 (0.15) | 1 | 8.040.08 | - |
| BSDL646(∗∗) | 1.50;0.80 | 160 | 0.102 | - | - | 7.790.05 | - |
| OGLE-CL LMC 113(∗) | 1.10;1.00 | 70 | 0.080 | -0.260.28 (0.14) | 1 | 7.930.10 | - |
| NGC1847 | 1.80;1.60 | 0 | 0.113 | -0.990.17 (0.11) | 6 | 8.220.20 | - |
| NGC1848(∗∗) | 2.20;2.00 | 140 | 0.103 | - | - | 6.700.10 | - |
| BSDL664(∗∗) | 1.10;1.00 | 110 | 0.119 | - | - | 8.200.20 | - |
| NGC1844 | 1.60;1.60 | 0 | 0.087 | -0.070.14 (0.14) | 4 | 7.920.10 | - |
| NGC1846 | 3.80;3.80 | 0 | 0.070 | -0.470.03 (0.11) | 188 | 9.210.08 | 1.500.30 |
| KMHK565 | 1.00;0.85 | 140 | 0.089 | - | - | 6.700.10 | - |
| SL244 | 1.00;1.00 | 0 | 0.106 | -0.110.05 (0.15) | 18 | 8.750.15 | - |
| H88 152(∗,∗∗) | 1.00;0.85 | 140 | 0.121 | 0.200.03 (0.14) | 2 | 8.010.04 | - |
| SL256(∗) | 1.00;0.95 | 50 | 0.099 | -0.210.22 (0.12) | 1 | 7.650.15 | - |
| NGC1850A | 0.50;0.45 | 0 | 0.110 | - | - | 6.400.20 | - |
| NGC1850(1) | 3.00;3.00 | 0 | 0.111 | -0.310.05 (0.11) | 16 | 7.900.15 | - |
| -0.300.05 (0.12) | 17 | 7.900.20 | - | ||||
| BRHT5b(∗) | 1.10;1.00 | 40 | 0.090(a) | -0.090.06 (0.12) | 7 | 7.860.07 | - |
| -0.030.06 (0.12) | 8 | 7.860.07 | - | ||||
| H88 165(∗) | 1.10;1.10 | 0 | 0.127 | -0.270.23 (0.13) | 1 | 7.800.10 | - |
| NGC1854 | 2.30;2.30 | 0 | 0.103 | -0.360.02 (0.12) | 6 | 7.920.08 | - |
| BSDL745 | 1.10;0.80 | 100 | 0.104 | - | - | 7.350.10 | - |
| BSDL748(∗) | 0.80;0.70 | 20 | 0.094 | -0.030.23 (0.12) | 1 | 7.550.10 | - |
| NGC1858(2) | 4.40;2.60 | 170 | 0.085 | - | - | 6.960.31 | - |
| H88 177(∗) | 1.20;1.00 | 120 | 0.081 | -0.290.08 (0.15) | 3 | 8.180.10 | - |
| BRHT48b | 0.80;0.65 | 170 | 0.079 | - | - | 8.400.10 | - |
| H88 180(∗,∗∗) | 0.90;0.75 | 100 | 0.099 | 0.050.28 (0.16) | 1 | 7.590.05 | - |
| BRHT48a(∗) | 0.60;0.65 | 130 | 0.079 | -0.650.12 (0.16) | 6 | 8.550.10 | - |
| OGLE-CL LMC 185 | 0.85;0.85 | 0 | 0.115 | - | - | 7.350.10 | - |
| NGC1863 | 1.40;1.20 | 50 | 0.092 | -0.280.17 (0.12) | 4 | 7.720.10 | - |
| NGC1866 | 5.50;5.50 | 0 | 0.046 | -0.270.03 (0.11) | 41 | 8.220.10 | - |
| BRHT8b(∗) | 1.00;1.00 | 0 | 0.068 | -0.130.25 (0.12) | 1 | 7.900.07 | - |
| OGLE-CL LMC 273(∗,∗∗) | 0.75;0.75(P) | 0 | 0.087 | 0.100.11 (0.13) | 5 | 8.070.05 | - |
| NGC1894 | 1.40;1.20 | 60 | 0.065 | -0.410.17 (0.12) | 4 | 8.000.10 | - |
| H88 236(∗,∗∗) | 0.80;0.65 | 10 | 0.073 | -0.190.24 (0.13) | 1 | 7.950.10 | - |
| NGC1898 | 1.60;1.60 | 0 | 0.068 | -1.060.05 (0.12) | 47 | 9.980.08 | 10.52.00 |
| NGC1903(∗) | 1.90;1.90 | 0 | 0.080(a) | -0.370.06 (0.13) | 9 | 7.980.10 | - |
| BRHT9b(∗) | 1.40;1.20 | 80 | 0.121 | -0.210.07 (0.14) | 40 | 8.850.08 | - |
| H88 255(∗) | 0.95;0.85 | 120 | 0.123 | -0.210.18 (0.12) | 2 | 7.920.10 | - |
| OGLE-CL LMC 318 | 1.30;1.30 | 0 | 0.069 | -0.330.06 (0.13) | 29 | 8.900.10 | - |
| OGLE-CL LMC 321(∗) | 0.65;0.60 | 140 | 0.066 | -0.430.25 (0.12) | 1 | 8.270.13 | - |
| ESO85-72 | 1.70;1.70 | 0 | 0.040 | -0.580.06 (0.11) | 8 | 9.420.12 | 3.001.25 |
| BSDL1291(∗∗) | 0.80;0.65 | 120 | 0.075 | - | - | 7.300.20 | - |
| OGLE-CL LMC 369(∗) | 1.00;0.90 | 70 | 0.073 | -0.220.11 (0.15) | 6 | 8.350.10 | - |
| H88 283(∗,∗∗) | 0.80;0.70 | 120 | 0.072 | -0.440.46 (0.16) | 1 | 8.170.07 | - |
| -0.520.44 (0.15) | 1 | 8.190.07 | - | ||||
| NGC1926 | 1.40;1.20 | 120 | 0.068 | - | - | 8.000.10 | - |
| NGC1935(∗∗) | 1.20;1.20 | 0 | 0.090 | - | - | 7.200.30 | - |
| OGLE-CL LMC 404 | 1.00;0.90 | 110 | 0.075 | - | - | 8.350.10 | - |
| LH47 | 7.30;5.50 | 160 | 0.105 | - | - | 6.970.10 | - |
| OGLE-CL LMC 407(∗) | 1.20;1.10 | 80 | 0.057 | -0.150.02 (0.12) | 4 | 8.090.08 | - |
| BSDL1411(∗,∗∗) | 1.00;0.90 | 100 | 0.059 | -0.080.23 (0.14) | 2 | 7.840.06 | - |
| NGC1937 | 3.20;2.00 | 70 | 0.131 | - | - | 6.220.10 | - |
| OGLE-CL LMC 431(∗) | 0.70;0.65 | 130 | 0.067 | -0.430.28 (0.13) | 2 | 8.030.10 | - |
| OGLE-CL LMC 438(∗,∗∗) | 1.40;1.40 | 0 | 0.068 | -0.240.06 (0.15) | 5 | 8.550.10 | - |
| BSDL1576(∗,∗∗) | 0.95;0.95 | 0 | 0.086 | -0.370.25 (0.13) | 1 | 8.060.07 | - |
| BSDL1592(∗) | 0.80;0.65 | 110 | 0.095 | -0.220.24 (0.15) | 3 | 7.970.07 | - |
| BSDL1588(∗∗) | 0.95;0.70 | 140 | 0.086 | - | - | 8.300.05 | - |
| OGLE-CL LMC 446(∗) | 1.30;1.20 | 100 | 0.083 | -0.130.07 (0.15) | 5 | 8.200.15 | - |
| BSDL1597(∗,∗∗) | 1.10;0.85 | 100 | 0.115 | -0.190.24 (0.12) | 1 | 7.930.05 | - |
| NGC1950(∗) | 1.70;1.70 | 0 | 0.085 | 0.070.18 (0.12) | 3 | 8.000.10 | - |
| BSDL1601 | 1.00;0.90 | 70 | 0.088 | - | - | 7.300.20 | - |
| SL457(∗∗) | 1.20;1.10 | 70 | 0.090 | - | - | 6.700.10 | - |
| NGC1948(3) | 7.00;5.70 | 30 | 0.103 | -0.110.18 (0.12) | 3 | 7.500.25 | - |
| NGC1955 | 4.00;3.60 | 20 | 0.082 | - | - | 6.250.10 | - |
| BSDL1674 | 0.85;0.65 | 30 | 0.082 | - | - | 6.150.15 | - |
| LH53 | 7.00;5.70 | 30 | 0.099 | - | - | 7.250.15 | - |
| KMK88 56(∗) | 0.80;0.70 | 150 | 0.085 | -0.010.12 (0.14) | 7 | 8.430.05 | - |
| NGC1969(∗) | 1.20;1.20 | 0 | 0.075 | 0.060.08 (0.13) | 10 | 8.100.05 | - |
| OGLE-CL LMC 478(∗) | 0.50;0.50(P) | 0 | 0.080 | 0.100.08 (0.12) | 4 | 7.930.05 | - |
| BSDL1759(∗∗) | 0.45;0.45 | 0 | 0.081 | - | - | 8.060.05 | - |
| NGC1971(∗) | 1.10;0.95 | 0 | 0.073 | -0.240.16 (0.13) | 2 | 8.020.10 | - |
| NGC1972 | 0.90;0.80 | 100 | 0.071 | -0.170.04 (0.12) | 3 | 7.870.10 | - |
| -0.270.08 (0.12) | 3 | 7.880.10 | - | ||||
| KMK88 57(∗,∗∗) | 0.60;0.55 | 60 | 0.073 | -0.480.03 (0.14) | 3 | 8.690.05 | - |
| BSDL1783(∗,∗∗) | 0.65;0.60 | 110 | 0.065 | -0.170.29 (0.16) | 1 | 8.200.10 | - |
| BSDL1785(∗,∗∗) | 0.85;0.70 | 110 | 0.068 | -0.130.01 (0.16) | 3 | 8.140.06 | - |
| -0.330.22 (0.13) | 2 | 8.130.10 | - | ||||
| BSDL1807(∗,∗∗) | 1.00;0.70 | 30 | 0.061 | 0.010.02 (0.14) | 2 | 8.090.09 | - |
| BSDL1821(∗) | 0.70;0.70 | 120 | 0.062 | -0.310.29 (0.15) | 1 | 7.920.05 | - |
| NGC1986 | 2.80;2.40 | 140 | 0.088 | 0.100.03 (0.12) | 13 | 7.980.12 | - |
| BSDL1858(∗∗) | 1.00;0.80 | 110 | 0.088 | - | - | 8.060.05 | - |
| OGLE-CL LMC 500(∗) | 0.95;0.95 | 0 | 0.084 | 0.180.24 (0.13) | 1 | 7.910.05 | - |
| OGLE-CL LMC 512(∗) | 0.85;0.85 | 0 | 0.076 | -0.460.09 (0.12) | 2 | 8.180.10 | - |
| -0.330.06 (0.13) | 2 | 8.100.05 | - | ||||
| NGC1978 | 4.00;2.70 | 160 | 0.056 | -0.350.02 (0.12) | 287 | 9.200.10 | 1.500.30 |
| KMHK960 | 1.20;1.10 | 160 | 0.103 | -0.350.05 (0.13) | 16 | 9.120.10 | 1.250.25 |
| BSDL1928(∗,∗∗) | 1.30;1.00 | 130 | 0.082 | -0.420.07 (0.12) | 3 | 8.270.20 | - |
| OGLE-CL LMC 525(∗,∗∗) | 1.40;1.10 | 70 | 0.095 | -0.270.15 (0.12) | 3 | 8.060.15 | - |
| -0.150.24 (0.14) | 3 | 8.030.08 | - | ||||
| ESO85-91 | 1.90;1.80 | 150 | 0.047 | -0.410.06 (0.13) | 20 | 9.020.09 | 1.000.25 |
| NGC2005 | 1.60;1.60 | 0 | 0.082 | -1.410.04 (0.12) | 30 | 10.100.04 | 13.52.00 |
| OGLE-CL LMC 540(∗,∗∗) | 1.50;1.30 | 20 | 0.103 | 0.100.23 (0.11) | 1 | 7.660.08 | - |
| NGC2016(∗,∗∗) | 1.80;1.80 | 0 | 0.108 | -0.150.07 (0.12) | 5 | 8.190.12 | - |
| KMHK1046 | 1.40;1.40 | 0 | 0.088 | -0.570.04 (0.13) | 22 | 9.280.10 | 1.750.50 |
| BSDL2205(∗,∗∗) | 1.10;1.00 | 10 | 0.102 | -0.220.14 (0.15) | 4 | 8.250.10 | - |
| BSDL2212(∗∗) | 1.10;0.90 | 80 | 0.105 | - | - | 7.840.15 | - |
| NGC2019 | 1.50;1.50 | 0 | 0.079 | -1.210.04 (0.12) | 57 | 10.100.05 | 13.02.00 |
| KMHK1013 | 1.40;1.40 | 0 | 0.056 | -0.670.05 (0.13) | 14 | 9.400.07 | 2.500.50 |
| LH72 | 8.00;4.00 | 160 | 0.052 | - | - | 7.150.10 | - |
| OGLE-CL LMC 585(∗,∗∗) | 1.20;1.20 | 0 | 0.114 | -0.160.09 (0.12) | 3 | 8.100.10 | - |
| LH77 | 35.0;12.0 | 70 | 0.042 | - | - | 7.200.10 | - |
| OGLE-CL LMC 591(∗∗) | 1.00;0.80 | 100 | 0.113 | - | - | 8.290.10 | - |
| NGC2028(∗,∗∗) | 1.10;1.00 | 60 | 0.101 | -0.140.13 (0.15) | 7 | 8.300.10 | - |
| BSDL2624(∗,∗∗) | 1.30;1.00 | 20 | 0.126 | -0.350.06 (0.12) | 2 | 7.970.05 | - |
| NGC2065 | 2.30;2.30 | 0 | 0.135 | -0.330.03 (0.12) | 9 | 8.170.10 | - |
| NGC2111(∗) | 0.45;0.45 | 0 | 0.152 | -0.200.20 (0.15) | 3 | 8.160.05 | - |
| KMHK1489 | 0.95;0.85 | 150 | 0.112 | - | - | 7.750.10 | - |
| NGC2136(4) | 2.80;2.50 | 140 | 0.121 | -0.690.10 (0.12) | 4 | 8.160.12 | - |
| NGC2155 | 2.40;2.40 | 0 | 0.040(a) | -0.530.04 (0.12) | 53 | 9.410.07 | 2.500.50 |
| ESO121-3(5) | 2.10;2.10 | 0 | 0.030(a) | -0.790.07 (0.13) | 18 | 9.930.11 | 9.002.00 |
| ESO86-61 | 1.70;1.70 | 0 | 0.050 | -0.640.07 (0.13) | 18 | 9.380.06 | 2.200.30 |
| KMHK1679(∗,∗∗) | 0.60;0.55 | 30 | 0.069 | -0.520.17 (0.14) | 2 | 8.650.10 | - |
| NGC2210 | 3.30;3.30 | 0 | 0.067 | -1.530.03 (0.12) | 62 | 10.220.04 | 14.01.00 |
| ESO57-75 | 1.70;1.70 | 0 | 0.119 | -0.480.06 (0.13) | 13 | 9.100.10 | 1.200.30 |
| NGC2249 | 2.30;2.30 | 0 | 0.074 | -0.270.28 (0.12) | 1 | 8.800.12 | - |
| NGC2257 | 4.00;4.00 | 0 | 0.040(a) | -1.670.02 (0.11) | 72 | 10.190.06 | 15.01.50 |
2]
| Nb | RA | DEC | NF | IQR | ||
|---|---|---|---|---|---|---|
| (h:mm:ss.ss) | (dd:mm:ss.ss) | (mag) | (dex) | (dex) | ||
| 1 | 4:37:31.00 | -70:35:02.01 | 0.148 | -0.390.04 (0.12) | 65 | 0.48 |
| 2 | 4:37:49.59 | -69:01:45.60 | 0.110 | -0.310.03 (0.12) | 79 | 0.41 |
| 3 | 4:45:22.75 | -83:59:48.00 | 0.160(a) | -1.430.05 (0.11) | 10 | 0.17 |
| 4 | 4:50:36.70 | -69:59:06.00 | 0.124 | -0.420.03 (0.11) | 88 | 0.48 |
| 5 | 4:54:16.85 | -70:26:30.01 | 0.110 | -0.650.03 (0.12) | 157 | 0.54 |
| 6 | 4:57:22.68 | -62:32:05.00 | 0.046(S) | -0.100.08 (0.12) | 11 | 0.34 |
| 7 | 4:59:07.55 | -67:44:43.01 | 0.087 | -0.360.03 (0.12) | 203 | 0.63 |
| 8 | 4:59:45.62 | -69:48:06.00 | 0.103 | -0.310.02 (0.12) | 268 | 0.47 |
| 9 | 5:00:26.45 | -68:46:22.00 | 0.086 | -0.200.02 (0.11) | 405 | 0.44 |
| 10 | 5:01:04.01 | -69:05:03.30 | 0.106 | -0.310.02 (0.11) | 496 | 0.50 |
| 11 | 5:03:05.78 | -69:02:14.91 | 0.090 | -0.410.02 (0.11) | 402 | 0.69 |
| 12 | 5:04:38.89 | -69:20:26.01 | 0.078 | -0.290.02 (0.11) | 422 | 0.56 |
| 13 | 5:04:56.79 | -70:01:08.41 | 0.118 | -0.360.02 (0.11) | 323 | 0.52 |
| 14 | 5:05:06.71 | -69:24:14.30 | 0.088 | -0.420.02 (0.11) | 408 | 0.49 |
| 15 | 5:05:09.53 | -68:57:23.81 | 0.082 | -0.570.02 (0.11) | 766 | 0.58 |
| 16 | 5:05:19.03 | -68:44:14.71 | 0.076 | -0.330.02 (0.11) | 446 | 0.59 |
| 17 | 5:05:24.63 | -68:30:02.01 | 0.116 | -0.310.02 (0.11) | 360 | 0.51 |
| 18 | 5:05:35.52 | -68:37:42.01 | 0.086 | -0.360.03 (0.11) | 262 | 0.55 |
| 19 | 5:05:39.65 | -68:38:12.01 | 0.083 | -0.380.03 (0.11) | 265 | 0.56 |
| 20 | 5:05:55.33 | -68:37:43.01 | 0.076 | -0.310.02 (0.11) | 310 | 0.58 |
| 21 | 5:06:08.56 | -68:26:44.99 | 0.102 | -0.180.03 (0.11) | 309 | 0.58 |
| 22 | 5:06:47.11 | -68:36:59.39 | 0.097 | -0.110.02 (0.13) | 319 | 0.56 |
| 23 | 5:06:54.37 | -68:43:07.99 | 0.079 | -0.120.02 (0.13) | 410 | 0.69 |
| 24 | 5:07:08.18 | -68:58:22.99 | 0.111 | -0.180.02 (0.13) | 503 | 0.63 |
| 25 | 5:07:30.11 | -67:19:26.30 | 0.091 | -0.150.03 (0.13) | 170 | 0.51 |
| 26 | 5:07:34.90 | -67:27:38.91 | 0.074 | -0.650.03 (0.12) | 125 | 0.43 |
| 27 | 5:07:36.71 | -68:32:30.00 | 0.109 | 0.020.03 (0.13) | 330 | 0.71 |
| 28 | 5:07:44.71 | -71:11:00.00 | 0.102 | -0.180.03 (0.13) | 143 | 0.46 |
| 29 | 5:08:06.45 | -69:16:04.00 | 0.117 | 0.120.02 (0.13) | 473 | 0.66 |
| 30 | 5:08:45.52 | -68:45:39.00 | 0.110 | -0.080.03 (0.13) | 323 | 0.67 |
| 31 | 5:08:54.32 | -68:45:13.89 | 0.120 | -0.250.03 (0.13) | 407 | 0.71 |
| 32 | 5:09:24.89 | -68:51:47.49 | 0.109 | -0.200.03 (0.12) | 379 | 0.79 |
| 33 | 5:09:55.75 | -68:54:06.20 | 0.086 | -0.350.03 (0.13) | 383 | 0.68 |
| 34 | 5:10:38.90 | -69:02:30.99 | 0.111 | -0.120.02 (0.12) | 564 | 0.74 |
| 35 | 5:11:39.72 | -68:43:36.00 | 0.088 | -0.150.03 (0.13) | 544 | 0.76 |
| 36 | 5:13:38.56 | -65:27:52.00 | 0.046(S) | -0.600.03 (0.12) | 14 | 0.18 |
| 37 | 5:15:36.83 | -69:28:24.50 | 0.068 | -0.160.02 (0.12) | 795 | 0.69 |
| 38 | 5:15:40.09 | -69:16:51.00 | 0.088 | -0.160.02 (0.12) | 654 | 0.78 |
| 39 | 5:16:41.08 | -69:39:24.40 | 0.066 | -0.330.01 (0.12) | 1112 | 0.59 |
| 40 | 5:17:07.85 | -69:21:35.50 | 0.120 | -0.140.02 (0.12) | 559 | 0.77 |
| 41 | 5:18:02.20 | -69:43:35.90 | 0.083 | -0.130.02 (0.12) | 780 | 0.66 |
| 42 | 5:18:17.73 | -69:36:57.21 | 0.094 | -0.270.02 (0.12) | 633 | 0.79 |
| 43 | 5:20:05.27 | -63:28:50.01 | 0.040(S) | -0.530.06 (0.11) | 31 | 0.40 |
| 44 | 5:20:23.35 | -69:35:03.00 | 0.076 | 0.070.02 (0.13) | 771 | 0.76 |
| 45 | 5:20:30.38 | -69:32:09.00 | 0.071 | -0.050.02 (0.13) | 790 | 0.78 |
| 46 | 5:21:57.61 | -67:57:18.00 | 0.101 | -0.410.09 (0.15) | 26 | 0.55 |
| 47 | 5:22:03.24 | -69:15:18.00 | 0.075 | 0.090.03 (0.13) | 467 | 0.78 |
| 48 | 5:22:14.21 | -69:30:41.01 | 0.056 | -0.200.02 (0.12) | 775 | 0.67 |
| 49 | 5:22:28.74 | -67:53:42.01 | 0.133 | -0.270.05 (0.13) | 126 | 0.88 |
| 50 | 5:24:19.71 | -66:24:12.01 | 0.139(S) | -0.170.08 (0.12) | 3 | 0.13 |
| 51 | 5:24:32.75 | -69:54:04.31 | 0.084 | -0.100.02 (0.13) | 724 | 0.76 |
| 52 | 5:24:33.34 | -69:44:43.11 | 0.070 | -0.080.02 (0.13) | 713 | 0.79 |
| 53 | 5:25:00.89 | -69:26:03.11 | 0.085 | 0.080.03 (0.13) | 468 | 0.86 |
| 54 | 5:26:05.99 | -66:14:00.00 | 0.103(S) | -0.740.06 (0.14) | 77 | 0.75 |
| 55 | 5:26:11.57 | -67:29:54.00 | 0.082(S) | -0.300.04 (0.13) | 117 | 0.57 |
| 56 | 5:26:48.44 | -69:50:17.01 | 0.077 | -0.050.02 (0.13) | 991 | 0.69 |
| 57 | 5:27:03.83 | -69:51:51.01 | 0.066 | -0.150.02 (0.12) | 880 | 0.63 |
| 58 | 5:27:37.54 | -69:58:14.01 | 0.090 | -0.180.02 (0.13) | 873 | 0.57 |
| 59 | 5:28:44.72 | -66:14:14.01 | 0.056(S) | -0.450.03 (0.12) | 134 | 0.41 |
| 60 | 5:28:49.69 | -71:38:00.01 | 0.104 | -0.300.03 (0.12) | 264 | 0.51 |
| 61 | 5:28:50.50 | -69:51:44.02 | 0.084 | -0.240.02 (0.12) | 843 | 0.77 |
| 62 | 5:29:05.86 | -69:48:30.01 | 0.083 | -0.050.02 (0.12) | 729 | 0.65 |
| 63 | 5:29:48.82 | -63:38:58.66 | 0.040(S) | -0.470.05 (0.12) | 57 | 0.58 |
| 64 | 5:30:10.13 | -69:45:09.60 | 0.086 | -0.430.02 (0.11) | 578 | 0.55 |
| 65 | 5:31:34.82 | -69:56:43.41 | 0.105 | -0.140.02 (0.12) | 733 | 0.68 |
| 66 | 5:31:41.67 | -72:08:48.01 | 0.088(S) | -0.420.02 (0.13) | 208 | 0.46 |
| 67 | 5:31:56.41 | -70:09:32.50 | 0.081 | -0.430.02 (0.12) | 836 | 0.62 |
| 68 | 5:32:02.67 | -64:14:30.01 | 0.056(S) | -0.630.04 (0.12) | 59 | 0.43 |
| 69 | 5:32:11.74 | -66:27:00.01 | 0.052(S) | -0.710.06 (0.13) | 60 | 0.68 |
| 70(c) | – | – | – | – | – | – |
| 71 | 5:33:21.62 | -69:57:21.01 | 0.108 | -0.180.02 (0.12) | 576 | 0.72 |
| 72 | 5:37:37.50 | -70:13:56.01 | 0.142 | -0.250.03 (0.12) | 392 | 0.78 |
| 73 | 5:44:32.66 | -70:59:35.31 | 0.151 | -0.200.04 (0.13) | 260 | 0.90 |
| 74 | 5:53:16.88 | -69:32:00.01 | 0.103 | -0.350.05 (0.13) | 107 | 0.69 |
| 75 | 5:58:32.05 | -65:28:38.00 | 0.049(S) | -0.440.05 (0.12) | 54 | 0.50 |
| 76 | 6:02:01.52 | -60:31:20.01 | 0.030(a) | -0.520.28 (0.12) | 17 | 1.14 |
| 77 | 6:08:15.62 | -62:59:15.01 | 0.050(a) | -0.530.10 (0.12) | 18 | 0.68 |
| 78 | 6:11:31.35 | -69:07:17.00 | 0.069 | -0.410.04 (0.12) | 39 | 0.33 |
| 79 | 6:13:26.81 | -70:41:45.16 | 0.123 | -0.310.04 (0.13) | 44 | 0.39 |
| 80 | 6:25:48.64 | -68:55:12.00 | 0.074(S) | -0.200.05 (0.12) | 41 | 0.43 |
| 81 | 6:30:11.53 | -64:19:25.99 | 0.040(a) | -0.090.32 (0.12) | 10 | 1.64 |
Appendix B Observing log
Table 5 presents the observing log for the fields analyzed in this work.
1]
| Cluster | RA | DEC | Date | Texp (,,) | Airmass (,,) | Seeing (,,) | Other name |
|---|---|---|---|---|---|---|---|
| (hh:mm:ss.s) | (dd:mm:ss.s) | (s) | (arcsec) | ||||
| NGC1651 | 04:37:32 | -70:35:07 | 2008 Dec 18 | 120;200;500 | 1.53;1.53;1.54 | 1.03;0.91;0.98 | SL7, ESO55-30, KMHK20 |
| KMHK21 | 04:37:51 | -69:01:45 | 2009 Jan 16 | 100;180;350 | 1.34;1.34;1.33 | 0.83;0.88;0.80 | SL8 |
| NGC1841 | 04:45:23 | -83:59:49 | 2009 Jan 16 | 100;180;350 | 1.73;1.73;1.73 | 1.06;0.87;0.97 | ESO4-15 |
| NGC1711 | 04:50:37 | -69:59:06 | 2009 Jan 16 | 100;180;350 | 1.38;1.38;1.37 | 0.83;0.96;0.83 | SL554, KMHK145 |
| KMHK156 | 04:51:00 | -70:01:24 | 2009 Jan 16 | 100;180;350 | 1.38;1.38;1.37 | 0.83;0.96;0.83 | |
| NGC1754 | 04:54:17 | -70:26:29 | 2008 Dec 19 | 90;140;350 | 1.53;1.53;1.53 | 0.70;0.70;0.75 | SL91, ESO56-25, KMHK247 |
| ESO85-21 | 04:57:22 | -62:32:05 | 2009 Jan 16 | 100;180;400 | 1.27;1.28;1.28 | 0.68;0.61;0.71 | SL126, KMHK322 |
| NGC1786 | 04:59:06 | -67:44:42 | 2008 Dec 19 | 90;140;350 | 1.51;1.52;1.52 | 0.68;0.78;0.80 | SL149, ESO56-39, KMHK385 |
| NGC1795 | 04:59:46 | -69:48:04 | 2008 Dec 19 | 90;140;350 | 1.37;1.38;1.38 | 0.79;0.91;0.78 | SL165, ESO56-44, KMHK411 |
| KMHK421 | 05:00:26 | -68:46:23 | 2009 Jan 16 | 100;180;400 | 1.39;1.39;1.38 | 0.73,0.76,0.86 | OGLE-CL LMC 5 |
| H88 87 | 05:00:43 | -69:07:14 | 2009 Jan 16 | 100;180;350 | 1.41;1.41;1.47 | 0.71;0.82;0.95 | |
| NGC1804 | 05:01:04 | -69:04:57 | 2009 Jan 16 | 100;180;350 | 1.41;1.41;1.47 | 0.71;0.82;0.95 | OGLE-CL LMC 8, SL172 , ESO56-46 |
| SL191 | 05:03:05 | -69:02:12 | 2009 Jan 16 | 100;180;400 | 1.52;1.52;1.53 | 0.86;1.03;0.99 | OGLE-CL LMC 35 |
| H88 104 | 05:04:20 | -69:21:27 | 2009 Jan 16 | 100;140;400 | 1.58;1.57;1.55 | 0.86;0.93;0.97 | OGLE-CL LMC 538, KMK88 4 |
| H88 107 | 05:04:26 | -69:21:06 | 2009 Jan 16 | 100;140;400 | 1.58;1.57;1.55 | 0.86;0.93;0.97 | OGLE-CL LMC 57 |
| BRHT3b | 05:04:31 | -69:21:19 | 2009 Jan 16 | 100;140;400 | 1.58;1.57;1.55 | 0.86;0.93;0.97 | OGLE-CL LMC 59, H88 108, KMK88 7 |
| NGC1830 | 05:04:39 | -69:20:37 | 2009 Jan 16 | 100;140;400 | 1.58;1.57;1.55 | 0.86;0.93;0.97 | OGLE-CL LMC 61, SL207, ESO56-56 |
| SL211 | 05:04:49 | -68:55:23 | 2009 Jan 16 | 90;140;350 | 1.67;1.66;1.64 | 0.93;0.87;0.84 | |
| BSDL555 | 05:04:51 | -68:59:14 | 2009 Jan 16 | 90;140;350 | 1.67;1.66;1.64 | 0.93;0.87;0.84 | OGLE-CL LMC 64 |
| KMHK521 | 05:04:56 | -70:01:09 | 2009 Jan 16 | 90;160;380 | 1.60;1.61;1.62 | 0.84;0.88;0.85 | OGLE-CL LMC 65, SL65 |
| BSDL565 | 05:05:01 | -68:45:01 | 2009 Jan 16 | 90;140;350 | 1.68;1.69;1.70 | 0.83;0.87;0.99 | OGLE-CL LMC 66 |
| NGC1835 | 05:05:05 | -69:24:14 | 2008 Dec 19 | 90;140;350 | 1.46;1.47;1.47 | 0.72;0.72;0.72 | OGLE-CL LMC 69, SL215, ESO56-58 |
| H88 119 | 05:05:07 | -68:57:35 | 2009 Jan 16 | 90;140;350 | 1.67;1.66;1.64 | 0.93;0.87;0.84 | OGLE-CL LMC 71 |
| H88 120 | 05:05:11 | -69:22:18 | 2008 Dec 19 | 90;140;350 | 1.46;1.47;1.47 | 0.72;0.72;0.72 | OGLE-CL LMC 74, KMK88 10 |
| BSDL577 | 05:05:13 | -68:44:26 | 2009 Jan 16 | 90;140;350 | 1.68;1.69;1.70 | 0.83;0.87;0.99 | OGLE-CL LMC 75 |
| BSDL581 | 05:05:17 | -68:43:12 | 2009 Jan 16 | 90;140;350 | 1.68;1.69;1.70 | 0.83;0.87;0.99 | OGLE-CL LMC 77 |
| BSDL582 | 05:05:19 | -68:29:23 | 2009 Jan 16 | 90;140;350 | 1.77;1.76;1.73 | 0.76;0.85;0.89 | |
| HS107 | 05:05:19 | -68:44:06 | 2009 Jan 16 | 90;140;350 | 1.68;1.69;1.70 | 0.83;0.87;0.99 | OGLE-CL LMC 78 |
| SOI343 | 05:05:23 | -68:30:00 | 2009 Jan 16 | 90;140;350 | 1.77;1.76;1.73 | 0.76;0.85;0.89 | OGLE-CL LMC 80, SL218 |
| BSDL591 | 05:05:32 | -68:39:09 | 2009 Jan 16 | 90;140;350 | 1.79;1.79;1.81 | 0.81;0.86;0.96 | |
| NGC1836 | 05:05:35 | -68:37:42 | 2009 Jan 16 | 90;140;350 | 1.79;1.79;1.81 | 0.81;0.86;0.96 | OGLE-CL LMC 81, SL223 |
| HS109 | 05:05:35 | -68:42:52 | 2009 Jan 16 | 90;140;350 | 1.68;1.69;1.70 | 0.83;0.87;0.99 | OGLE-CL LMC 82 |
| BRHT4b | 05:05:40 | -68:38:22 | 2009 Jan 16 | 90;140;350 | 1.88;1.87;1.84 | 0.85;0.95;1.00 | OGLE-CL LMC 83 |
| HS111 | 05:05:44 | -68:30:20 | 2009 Jan 16 | 90;140;350 | 1.77;1.76;1.73 | 0.76;0.85;0.89 | OGLE-CL LMC 85 |
| BSDL599 | 05:05:46 | -68:35:35 | 2009 Jan 16 | 90;140;350 | 1.79;1.79;1.81 | 0.81;0.86;0.96 | |
| BSDL603 | 05:05:54 | -68:37:46 | 2009 Jan 16 | 90;140;350 | 1.90;1.91;1.93 | 0.82;0.89;0.86 | OGLE-CL LMC 90 |
| NGC1839 | 05:06:02 | -68:37:36 | 2009 Jan 16 | 90;140;350 | 2.02;2.01;1.97 | 0.98;0.93;0.92 | OGLE-CL LMC 93, SL226, ESO53-63 |
| NGC1838 | 05:06:07 | -68:26:42 | 2009 Jan 17 | 90;140;350 | 1.28;1.28;1.28 | 0.95;1.16;1.05 | OGLE-CL LMC 97, SL225, ESO56-64 |
| BSDL623 | 05:06:22 | -68:35:34 | 2009 Jan 16 | 90;140;350 | 1.90;1.91;1.93 | 0.82;0.89;0.86 | |
| OGLE-CL LMC 111 | 05:06:47 | -68:37:05 | 2009 Jan 17 | 90;140;380 | 1.28;1.28;1.28 | 0.98;1.09;1.16 | HS118 |
| BSDL646 | 05:06:53 | -68:34:52 | 2009 Jan 17 | 90;140;380 | 1.28;1.28;1.28 | 0.98;1.09;1.16 | |
| OGLE-CL LMC 113 | 05:06:54 | -68:43:07 | 2009 Jan 17 | 90;200;400 | 1.29;1.29;1.29 | 0.96;1.13;1,13 | SL234 |
| NGC1847 | 05:07:08 | -68:58:17 | 2009 Jan 17 | 100;160;350 | 1.30;1.30;1.29 | 0.92;0.97;1.02 | OGLE-CL LMC 118, SL240, ESO56-66 |
| NGC1848 | 05:07:27 | -71:11:43 | 2009 Jan 17 | 100;160;400 | 1.36;1.36;1.36 | 0.97;1.05;1.15 | SL247, ESO56-68, KMHK580 |
| BSDL664 | 05:07:28 | -68:58:32 | 2009 Jan 17 | 100;160;350 | 1.30;1.30;1.29 | 0.92;0.97;1.02 | OGLE-CL LMC 124 |
| NGC1844 | 05:07:30 | -67:19:24 | 2009 Jan 17 | 100;140;400 | 1.27;1.27;1.27 | 0.89;0.96;1.03 | OGLE-CL LMC 126, SL242, ESO85-48, KMHK556 |
| NGC1846 | 05:07:34 | -67:27:36 | 2008 Dec 18 | 120;200;500 | 1.59;1.60;1.61 | 0.94;1.00;1.01 | OGLE-CL LMC 128, SL243, ESO56-67, KMHK557 |
| KMHK565 | 05:07:35 | -71:10:03 | 2009 Jan 17 | 100;160;400 | 1.36;1.36;1.36 | 0.97;1.05;1.15 | |
| SL244 | 05:07:37 | -68:32:31 | 2009 Jan 17 | 100;160;400 | 1.30;1.30;1.30 | 1.04;1.18;1.17 | |
| H88 152 | 05:08:06 | -69:15:52 | 2009 Jan 17 | 100;160;400 | 1.34;1.34;1.33 | 1.19;1.26;1.25 | OGLE-CL LMC 136, KMHK24 |
| SL256 | 05:08:10 | -71:10:23 | 2009 Jan 17 | 100;160;400 | 1.36;1.36;1.36 | 0.97;1.05;1.15 | |
| NGC1850A | 05:08:39 | -68:45:32 | 2009 Jan 17 | 100;160;400 | 1.34;1.34;1.34 | 1.28;1.22;1.34 | |
| 2009 Jan 18 | 100;100;400 | 1.28;1.28;1.28 | 0.84;0.89;0.89 | ||||
| NGC1850 | 05:08:44 | -68:45:33 | 2009 Jan 17 | 100;160;400 | 1.34;1.34;1.34 | 1.28;1.22;1.34 | OGLE-CL LMC 142, SL261, ESO56-70 |
| 2009 Jan 18 | 100;100;400 | 1.28;1.28;1.28 | 0.84;0.89;0.89 | ||||
| BRHT5b | 05:08:53 | -68:45:08 | 2009 Jan 17 | 100;160;400 | 1.34;1.34;1.34 | 1.28;1.22;1.34 | OGLE-CL LMC 145, H88 156 |
| 2009 Jan 18 | 100;100;400 | 1.28;1.28;1.28 | 0.84;0.89;0.89 | ||||
| H88 165 | 05:09:16 | -68:44:01 | 2009 Jan 18 | 100;100;400 | 1.28;1.28;1.28 | 0.84;0.89;0.89 | OGLE-CL LMC 152 |
| NGC1854 | 05:09:19 | -68:50:50 | 2009 Jan 18 | 120;200;450 | 1.29;1.29;1.29 | 0.99;0.91;0.97 | OGLE-CL LMC 154, SL265, ESO56-72 |
| BSDL745 | 05:09:24 | -68:51:46 | 2009 Jan 18 | 120;200;450 | 1.29;1.29;1.29 | 0.99;0.91;0.97 | OGLE-CL LMC 155 |
| BSDL748 | 05:09:27 | -68:51:02 | 2009 Jan 18 | 120;200;450 | 1.29;1.29;1.29 | 0.99;0.91;0.97 | OGLE-CL LMC 156 |
| NGC1858 | 05:09:56 | -68:53:59 | 2009 Jan 18 | 120;200;450 | 1.29;1.30;1.30 | 0.73;0.84;1.11 | OGLE-CL LMC 164, SL274 |
| 2009 Jan 18 | 120;200;350 | 1.30;1.30;1.30 | 0.80;0.93;1.12 | ||||
| H88 177 | 05:10:17 | -68:55:41 | 2009 Jan 18 | 120;200;450 | 1.29;1.30;1.30 | 0.73;0.84;1.11 | OGLE-CL LMC 177 |
| 2009 Jan 18 | 120;200;350 | 1.30;1.30;1.30 | 0.80;0.93;1.12 | ||||
| BRHT48b | 05:10:20 | -68:52:45 | 2009 Jan 18 | 120;200;450 | 1.29;1.30;1.30 | 0.73;0.84;1.11 | OGLE-CL LMC 176, KMK88 32, H88 178 |
| 2009 Jan 18 | 120;200;350 | 1.30;1.30;1.30 | 0.80;0.93;1.12 | ||||
| H88 180 | 05:10:29 | -68:56:03 | 2009 Jan 18 | 120;200;450 | 1.29;1.30;1.30 | 0.73;0.84;1.11 | OGLE-CL LMC 180 |
| 2009 Jan 18 | 120;200;350 | 1.30;1.30;1.30 | 0.80;0.93;1.12 | ||||
| BRHT48a | 05:10:30 | -68:52:21 | 2009 Jan 18 | 120;200;450 | 1.29;1.30;1.30 | 0.73;0.84;1.11 | OGLE-CL LMC 179, HS153 |
| 2009 Jan 18 | 120;200;350 | 1.30;1.30;1.30 | 0.80;0.93;1.12 | ||||
| OGLE-CL LMC 185 | 05:10:39 | -69:02:31 | 2009 Jan 18 | 100;180;400 | 1.32;1.32;1.31 | 0.95;0.99;0.93 | SL288 |
| NGC1863 | 05:11:39 | -68:43:48 | 2009 Jan 18 | 100;180;400 | 1.32;1.32;1.32 | 1.15;0.89;1.00 | OGLE-CL LMC 206, SL299, ESO56-77 |
| NGC1866 | 05:13:39 | -65:27:54 | 2008 Dec 18 | 120;200;500 | 1.32;1.33;1.33 | 1.30;1.07;1.46 | SL319, ESO85-52, KMHK664 |
| BRHT8b | 05:15:37 | -69:28:23 | 2009 Jan 18 | 100;180;400 | 1.35;1.34;1.34 | 0.85;0.88;1.13 | OGLE-CL LMC 270, SL341 |
| OGLE-CL LMC 273* | 05:15:40.26 | -69:16:50.7 | 2009 Jan 18 | 100;180;400 | 1.35;1.35;1.35 | 0.95;1.12;1.05 | |
| NGC1894 | 05:15:51 | -69:28:09 | 2009 Jan 18 | 100;180;400 | 1.35;1.34;1.34 | 0.85;0.88;1.13 | OGLE-CL LMC 278, SL344, ESO56-89, BRHT8a |
| H88 236 | 05:15:56 | -69:27:16 | 2009 Jan 18 | 100;180;400 | 1.35;1.34;1.34 | 0.85;0.88;1.13 | OGLE-CL LMC 280 |
| NGC1898 | 05:16:42 | -69:39:22 | 2008 Dec 19 | 90;140;350 | 1.37;1.37;1.37 | 0.71;0.77;0.81 | OGLE-CL LMC 292, SL350, ESO56-90 |
| NGC1903 | 05:17:22 | -69:20:17 | 2008 Dec 17 | 60;100;300 | 1.36;1.36;1.36 | 0.73;0.77;0.88 | OGLE-CL LMC 309, SL356, ESO56-93, BRHT9a |
| BRHT9b | 05:17:24 | -69:22:35 | 2008 Dec 17 | 60;100;300 | 1.36;1.36;1.36 | 0.73;0.77;0.88 | OGLE-CL LMC 311, SL357 |
| H88 255 | 05:17:27 | -69:21:28 | 2008 Dec 17 | 60;100;300 | 1.36;1.36;1.36 | 0.73;0.77;0.88 | OGLE-CL LMC 312 |
| OGLE-CL LMC 318 | 05:17:48 | -69:38:43 | 2008 Dec 17 | 60;100;300 | 1.44;1.45;1.50 | 0.80;0.83;0.97 | SL363 |
| OGLE-CL LMC 321 | 05:17:55 | -69:34:53 | 2008 Dec 17 | 60;100;300 | 1.44;1.45;1.50 | 0.80;0.83;0.97 | HS213 |
| ESO85-72 | 05:20:05 | -63:28:49 | 2009 Jan 16 | 90;140;350 | 2.01;2.02;2.04 | 0.99;0.78;1.02 | SL388, KMHK773 |
| BSDL1291 | 05:20:14 | -69:34:56 | 2009 Jan 17 | 100;160;400 | 1.39;1.39;1.38 | 1.08;1.19;1.15 | |
| OGLE-CL LMC 369 | 05:20:22 | -69:35:10 | 2009 Jan 17 | 100;160;400 | 1.39;1.39;1.38 | 1.08;1.19;1.15 | SL402 |
| H88 283 | 05:20:25 | -69:34:15 | 2009 Jan 17 | 100;160;400 | 1.39;1.39;1.38 | 1.08;1.19;1.15 | OGLE-CL LMC 371 |
| NGC1926 | 05:20:35 | -69:31:31 | 2009 Jan 17 | 100;160;400 | 1.40;1.40;1.41 | 1.08;1.11;1.14 | OGLE-CL LMC 379, SL403, ESO56-105 |
| NGC1935 | 05:21:58 | -67:57:20 | 2009 Jan 17 | 100;160;400 | 1.41;1.41;1.39 | 1.08;1.16;1.17 | |
| OGLE-CL LMC 404 | 05:22:00 | -69:15:16 | 2009 Jan 17 | 100;160;400 | 1.44;1.44;1.45 | 1.02;1.09;1.28 | SL419 |
| LH47 | 05:22:07 | -67:56:35 | 2009 Jan 17 | 100;160;400 | 1.41;1.41;1.39 | 1.08;1.16;1.17 | NGC1935 |
| OGLE-CL LMC 407 | 05:22:11 | -69:30:48 | 2009 Jan 17 | 100;160;400 | 1.49;1.48;1.47 | 1.13;1.20;1.29 | SL423 |
| BSDL1411 | 05:22:17 | -69:28:17 | 2009 Jan 17 | 100;160;400 | 1.49;1.48;1.47 | 1.13;1.20;1.29 | |
| NGC1937 | 05:22:29 | -67:53:40 | 2009 Jan 17 | 100;180;450 | 1.48;1.48;1.49 | 1.12;1.11;1.16 | LH48 |
| OGLE-CL LMC 431 | 05:24:21 | -69:46:25 | 2009 Jan 17 | 110;180;450 | 1.77;1.75;1.72 | 1.15;1.23;1.30 | HS275 |
| OGLE-CL LMC 438 | 05:24:36 | -69:44:44 | 2009 Jan 17 | 110;180;450 | 1.77;1.75;1.72 | 1.15;1.23;1.30 | SL449 |
| BSDL1576 | 05:24:42 | -69:53:15 | 2009 Jan 17 | 110;180;450 | 1.67;1.68;1.69 | 1.13;1.14;1.19 | OGLE-CL LMC 440 |
| BSDL1592 | 05:24:57 | -69:51:43 | 2009 Jan 17 | 110;180;450 | 1.67;1.68;1.69 | 1.13;1.14;1.19 | OGLE-CL LMC 444 |
| BSDL1588 | 05:24:58 | -69:25:26 | 2009 Jan 17 | 110;180;450 | 1.78;1.79;1.80 | 1.21;1.22;1.41 | OGLE-CL LMC 445 |
| OGLE-CL LMC 446 | 05:25:01 | -69:25:58 | 2009 Jan 17 | 110;180;450 | 1.78;1.79;1.80 | 1.21;1.22;1.41 | SL453 |
| BSDL1597 | 05:25:05 | -69:52:25 | 2009 Jan 17 | 110;180;450 | 1.67;1.68;1.69 | 1.13;1.14;1.19 | OGLE-CL LMC 449 |
| NGC1950 | 05:24:33 | -69:54:08 | 2009 Jan 17 | 110;180;450 | 1.67;1.68;1.69 | 1.13;1.14;1.19 | OGLE-CL LMC 436, SL450, ESO56-116 |
| BSDL1601 | 05:25:08 | -69:43:06 | 2009 Jan 17 | 110;180;450 | 1.77;1.75;1.72 | 1.15;1.23;1.30 | OGLE-CL LMC 450 |
| SL457 | 05:25:25 | -69:26:37 | 2009 Jan 17 | 110;180;450 | 1.78;1.79;1.80 | 1.21;1.22;1.41 | |
| NGC1948 | 05:25:51 | -66:15:51 | 2009 Jan 17 | 110;180;450 | 1.63;1.62;1.59 | 1.14;1.21;1.33 | LH52, SL458 |
| NGC1955 | 05:26:12 | -67:29:56 | 2009 Jan 18 | 100;180;400 | 1.36;1.36;1.37 | 0.83;0.86;0.95 | SL467, KMHK888, LH54 |
| BSDL1674 | 05:26:15 | -67:29:56 | 2009 Jan 18 | 100;180;400 | 1.36;1.36;1.37 | 0.83;0.86;0.95 | |
| LH53 | 05:26:16 | -66:07:51 | 2009 Jan 18 | 100;180;400 | 1.34;1.33;1.32 | 0.72;0.87;0.97 | LH53s |
| KMK88 56 | 05:26:32 | -69:48:03 | 2009 Jan 18 | 100;180;400 | 1.44;1.43;1.42 | 0.80;0.93;0.97 | OGLE-CL LMC 476 |
| 2009 Jan 18 | 100;180;400 | 1.45;1.46;1.46 | 0.78;0.77;0.81 | ||||
| NGC1969 | 05:26;32 | -69:50:29 | 2009 Jan 18 | 100;180;400 | 1.44;1.43;1.42 | 0.80;0.93;0.97 | OGLE-CL LMC 477, SL479, ESO56-124 |
| 2009 Jan 18 | 100;180;400 | 1.45;1.46;1.46 | 0.78;0.77;0.81 | ||||
| OGLE-CL LMC 478* | 05:26:35.30 | -69:49:23.1 | 2009 Jan 18 | 100;180;400 | 1.44;1.43;1.42 | 0.80;0.93;0.97 | |
| 2009 Jan 18 | 100;180;400 | 1.45;1.46;1.46 | 0.78;0.77;0.81 | ||||
| BSDL1759 | 05:26:45 | -69:48:11 | 2009 Jan 18 | 100;180;400 | 1.44;1.43;1.42 | 0.80;0.93;0.97 | |
| NGC1971 | 05:26:45 | -69:51:07 | 2009 Jan 18 | 100;180;400 | 1.44;1.43;1.42 | 0.80;0.93;0.97 | OGLE-CL LMC 480, SL481, ESO56-128, BRHT12a |
| 2009 Jan 18 | 100;180;400 | 1.45;1.46;1.46 | 0.78;0.77;0.81 | ||||
| 2009 Jan 18 | 100;180;400 | 1.50;1.50;1.48 | 0.67;0.72;0.81 | ||||
| NGC1972 | 05:26:48 | -69:50:18 | 2009 Jan 18 | 100;180;400 | 1.44;1.43;1.42 | 0.80;0.93;0.97 | OGLE-CL LMC 481, SL480, ESO56-129, BRHT12b |
| 2009 Jan 18 | 100;180;400 | 1.45;1.46;1.46 | 0.78;0.77;0.81 | ||||
| 2009 Jan 18 | 100;180;400 | 1.50;1.50;1.48 | 0.67;0.72;0.81 | ||||
| KMK88 57 | 05:26:52 | -69:48:57 | 2009 Jan 18 | 100;180;400 | 1.44;1.43;1.42 | 0.80;0.93;0.97 | OGLE-CL LMC 483 |
| BSDL1783 | 05:27:02 | -69:50:26 | 2009 Jan 18 | 100;180;400 | 1.44;1.43;1.42 | 0.80;0.93;0.97 | |
| 2009 Jan 18 | 100;180;400 | 1.45;1.46;1.46 | 0.78;0.77;0.81 | ||||
| BSDL1785 | 05:27:04 | -69:52:01 | 2009 Jan 18 | 100;180;400 | 1.45;1.46;1.46 | 0.78;0.77;0.81 | OGLE-CL LMC 487 |
| 2009 Jan 18 | 100;180;400 | 1.50;1.50;1.48 | 0.67;0.72;0.81 | ||||
| 2009 Jan 18 | 100;180;400 | 1.44;1.43;1.42 | 0.80;0.93;0.97 | ||||
| BSDL1807 | 05:27:27 | -69:52:14 | 2009 Jan 18 | 100;180;400 | 1.45;1.46;1.46 | 0.78;0.77;0.81 | OGLE-CL LMC 491 |
| BSDL1821 | 05:27:35 | -69:53:47 | 2009 Jan 18 | 100;180;400 | 1.45;1.46;1.46 | 0.78;0.77;0.81 | OGLE-CL LMC 495 |
| NGC1986 | 05:27:38 | -69:57:49 | 2009 Jan 18 | 100;180;350 | 1.51;1.52;1.53 | 0.68;0.70;0.68 | OGLE-CL LMC 496, SL489, ESO56-134 |
| BSDL1858 | 05:28:02 | -69:55:49 | 2009 Jan 18 | 100;180;350 | 1.51;1.52;1.53 | 0.68;0.70;0.68 | OGLE-CL LMC 498 |
| OGLE-CL LMC 500 | 05:28:02 | -69:59:10 | 2009 Jan 18 | 100;180;350 | 1.51;1.52;1.53 | 0.68;0.70;0.68 | HS310 |
| OGLE-CL LMC 512* | 05:28:44 | -69:50:03 | 2008 Dec 17 | 60;100;300 | 1.49;1.50;1.50 | 0.86;0.83;0.95 | HS321, SL504 |
| 2009 Jan 18 | 90;140;350 | 1.64;1.63;1.61 | 0.95;0.93;0.85 | ||||
| NGC1978 | 05:28:45 | -66:14:10 | 2009 Jan 18 | 90;140;350 | 1.52;1.52;1.50 | 0.69;0.72;0.77 | SL501, ESO85-90, KMHK944 |
| KMHK960 | 05:28:50 | -71:37:58 | 2009 Jan 18 | 90;140;350 | 1.60;1.60;1.61 | 0.69;0.68;0.77 | SL505 |
| BSDL1928 | 05:29:03 | -69:48:38 | 2009 Jan 18 | 90;140;350 | 1.64;1.63;1.61 | 0.95;0.93;0.85 | OGLE-CL LMC 516 |
| OGLE-CL LMC 525 | 05:29:35 | -69:46:37 | 2008 Dec 19 | 90;140;350 | 1.37;1.37;1.37 | 0.84;0.83;0.78 | SL514 |
| 2009 Jan 18 | 90;140;350 | 1.64;1.63;1.61 | 0.95;0.93;0.85 | ||||
| ESO85-91 | 05:29:48 | -63:38:58 | 2008 Dec 19 | 90;140;350 | 1.45;1.46;1.46 | 0.76;0.80;0.79 | SL509, KMHK957 |
| NGC2005 | 05:30:09 | -69:45:08 | 2008 Dec 19 | 90;140;350 | 1.37;1.37;1.37 | 0.84;0.83;0.78 | OGLE-CL LMC 538, SL518, ESO56-137 |
| OGLE-CL LMC 540 | 05:30:12 | -69:47:31 | 2008 Dec 19 | 90;140;350 | 1.37;1.37;1.37 | 0.84;0.83;0.78 | HS332 |
| NGC 2016 | 05:31:38 | -69:56:45 | 2009 Jan 18 | 90;140;350 | 1.73;1.73;1.74 | 0.83;0.88;0.89 | OGLE-CL LMC 559, SL547, ESO56-142 |
| KMHK1046 | 05:31:42 | -72:08:46 | 2009 Jan 18 | 90;140;350 | 1.82;1.81;1.79 | 0.73;0.73;0.88 | SL555 |
| BSDL2205 | 05:31:50 | -69:55:14 | 2009 Jan 18 | 90;140;350 | 1.73;1.73;1.74 | 0.83;0.88;0.89 | |
| BSDL2212 | 05:31:52 | -69:58:50 | 2009 Jan 18 | 90;140;350 | 1.73;1.73;1.74 | 0.83;0.88;0.89 | |
| NGC2019 | 05:31:56 | -70:09:34 | 2008 Dec 19 | 90;140;350 | 1.39;1.39;1.39 | 0.73;0.79;0.81 | OGLE-CL LMC 565, SL554, ESO56-145 |
| KMHK1013 | 05:32:03 | -64:14:32 | 2009 Jan 18 | 90;140;350 | 1.82;1.83;1.84 | 0.75;0.84;0.85 | SL549 |
| LH72 | 05:32:19 | -66:26:19 | 2009 Jan 18 | 90;140;350 | 1.93;1.91;1.88 | 0.74;0.83;0.84 | SL553 |
| OGLE-CL LMC 585 | 05:33:21 | -69:57:13 | 2009 Jan 18 | 90;140;350 | 2.04;2.03;1.99 | 1.02;1.02;1.01 | SL574 |
| LH77 | 05:33:29 | -66:59:34 | 2009 Jan 18 | 90;140;350 | 1.94;1.95;1.97 | 0.96;0.90;0.97 | |
| OGLE-CL LMC 591 | 05:33:45 | -69:54:57 | 2009 Jan 18 | 90;140;350 | 2.04;2.03;1.99 | 1.02;1.02;1.01 | HS353 |
| NGC2028 | 05:33:48 | -69:57:06 | 2009 Jan 18 | 90;140;350 | 2.04;2.03;1.99 | 1.02;1.02;1.01 | OGLE-CL LMC 594, SL575, ESO56-152, LH80 |
| BSDL2624 | 05:37:26 | -70:13:21 | 2009 Jan 18 | 90;180;400 | 2.04;2.05;2.07 | 0.85;0.94;1.01 | |
| NGC2065 | 05:37:37 | -70:14:09 | 2009 Jan 18 | 90;180;400 | 2.04;2.05;2.07 | 0.85;0.94;1.01 | OGLE-CL LMC 648, SL626, ESO57-2, KMHK1160 |
| NGC2111 | 05:44:32 | -70:59:36 | 2009 Jan 17 | 140;200;600 | 1.84;1.85;1.87 | 1.62;1.35;1.42 | OGLE-CL LMC 715, SL699, ESO57-35, BRHT21a |
| KMHK1489 | 05:52:57 | -69:31:51 | 2009 Jan 17 | 110;180;450 | 1.96;1.97;1.99 | 1.23;1.26;1.10 | |
| NGC2136 | 05:52:59 | -69:29:33 | 2009 Jan 17 | 110;180;450 | 1.96;1.97;1.99 | 1.23;1.26;1.10 | SL762, ESO57-48, KMHK1490 |
| NGC2155 | 05:58:33 | -65:28:37 | 2008 Dec 18 | 120;200;500 | 1.36;1.36;1.37 | 0.92;0.97;1.02 | SL804, ESO86-45, KMHK1563 |
| ESO121-3 | 06:02:02 | -60:31:24 | 2008 Dec 18 | 120;200;500 | 1.33;1.33;1.34 | 1.02;1.07;0.84 | KMHK1591 |
| ESO86-61 | 06:08:15 | -62:59;15 | 2009 Jan 18 | 100;180;400 | 2.09;2.06;2.01 | 0.88;0.91;0.96 | SL842, KMHK1652 |
| KMHK1679 | 06:10:53 | -69:08:24 | 2008 Dec 19 | 90;140;350 | 1.41;1.41;1.41 | 0.76;0.84;0.77 | LW421 |
| NGC2210 | 06:11:31 | -69:07:18 | 2008 Dec 19 | 90;140;350 | 1.41;1.41;1.41 | 0.76;0.84;0.77 | SL858, ESO57-71, KMHK1782 |
| ESO57-75 | 06:13:27 | -70:41:45 | 2009 Jan 18 | 100;180;400 | 2.02;2.02;2.04 | 0.89;0.91;0.98 | SL862, KMHK1692 |
| NGC2249 | 06:25:49 | -68:55:12 | 2008 Dec 18 | 120;200;500 | 1.32;1.32;1.32 | 0.97;1.05;0.86 | SL893, ESO57-82, KMHK1755 |
| NGC2257 | 06:30:12 | -64:19:34 | 2008 Dec 18 | 180;300;500 | 1.21;1.21;1.22 | 1.02;1.04;0.92 | SL895, ESO87-24, KMHK1756 |
Appendix C Literature values
Table 6 summarizes the literature values for studied star clusters.
1]
| Cluster | [Fe/H] | log(Age) | |
|---|---|---|---|
| (mag) | (dex) | (yr) | |
| NGC1651 | 0.1133, 0.1015, 0.1420 | -0.370.021, -0.630.0422, | 9.31,14, 9.200.1015 |
| 0.0422, 0.0756, 0.15755 | -0.280.0222, -0.580.0222, -0.415 | 9.240.0622, 9.300.1022 | |
| 0.09858,∗ | -0.070.1027, -0.820.4429 | 9.26, 9.340.0829 | |
| -0.700.1033, -0.300.0334 | 9.300.0333, 9.300.0456 | ||
| -1.050.1556 | |||
| KMHK21 | 0.0417,44, 0.0756, 0.13355 | -0.500.2017, -0.400.2030 | 9.260.0817, 9.26 |
| 0.11558,∗ | -0.500.3044, -0.850.1056 | 9.21, 9.26 | |
| -0.3517 (field), -0.3030 (field) | |||
| NGC1841 | 0.2012, 0.1112 | -2.200.2012, -1.960.1259 | 10.100.0214, 10.14 |
| NGC1711 | 0.148, 0.0922, 0.0752 | -0.408, -0.570.0622 | 7.798, 7.700.0522 |
| 0.0652, 0.14155, 0.14458,∗ | -0.780.1738, -0.570.1140 (FeI) | 8.26, 7.7052 | |
| -0.880.1940 (FeII), -0.060.0552 | |||
| -0.530.4222 (field) | |||
| KMHK156 | 0.12355, 0.12658,∗ | ||
| NGC1754 | 0.0921, 0.13855, 0.11358,∗ | -1.420.1521, -1.37 | 10.190.0721, 9.85 |
| -1.38, -1.440.0229 | 10.15, 9.840.0429 | ||
| -1.480.0937 | 10.1537 | ||
| ESO85-21 | 0.0117, 0.044, 0.05358,∗ | -0.450.2017,30, -0.450.3044 | 9.34, 9.34 |
| -0.580.0145, -0.4517 (field) | 9.37, 9.420.0145 | ||
| -0.5030 (field) | |||
| NGC1786 | 0.0912, 0.10855, 0.09258,∗ | -1.870.201, -2.100.3012 | 10.18, 10.0937 |
| -1.58, -1.63 | |||
| -1.750.0236, -1.770.0837 | |||
| NGC1795 | 0.09644, 0.1048, 0.0756 | -0.230.201, -0.690.4229 | 8.90-9.041, 9.300.1129 |
| 0.11655, 0.11058,∗ | -0.470.1037, -0.100.1148 | 9.1137, 9.20 | |
| -0.900.1556 | 8.950.0748, 9.18 | ||
| KMHK421 | 0.1535, 0.09255, 0.09558,∗ | 8.1035 | |
| H88 87 | 0.2035, 0.10255, 0.09158,∗ | 8.2035 | |
| NGC1804 | 0.2035, 0.12655, 0.11458,∗ | 7.8035 | |
| SL191 | 0.10755, 0.09458,∗ | ||
| H88 104 | 0.09055, 0.08058,∗ | 9.2024 | |
| H88 107 | 0.09055, 0.08058,∗ | ||
| BRHT3b | 0.08655, 0.08058,∗ | 8.800.1024 | |
| NGC1830 | 0.08955, 0.08158,∗ | -1.02, -1.30 | 8.400.1024, 9.09 |
| 9.18 | |||
| SL211 | 0.08655, 0.07458,∗ | ||
| BSDL555 | 0.10855, 0.09058,∗ | ||
| KMHK521 | 0.1535, 0.15055, 0.11558,∗ | 7.7035 | |
| BSDL565 | 0.0735, 0.09855, 0.07858,∗ | 8.000.0524, 8.3017 | |
| NGC1835 | 0.0821, 0.11355, 0.08358,∗ | -1.800.201, -1.620.1521 | 10.201, 10.210.0821 |
| -1.40, -1.74 | 9.92, 10.10 | ||
| H88 119 | 0.09855, 0.08458,∗ | ||
| H88 120 | 0.10355, 0.08858,∗ | ||
| BSDL577 | 0.09555, 0.07858,∗ | 7.900.0524 | |
| BSDL581 | 0.09755, 0.07458,∗ | 7.900.1024 | |
| BSDL582 | 0.12255, 0.13258,∗ | ||
| HS107 | 0.09555, 0.07558,∗ | 8.000.1024 | |
| SOI343 | 0.1035, 0.12055, 0.13158,∗ | -0.400.2030, -0.2530 (field) | 7.6017, 7.70 |
| BSDL591 | 0.09455, 0.09258,∗ | ||
| NGC1836 | 0.0630,44, 0.0448, 0.09555 | 0.000.2030, 0.000.3044 | 8.500.0524, 8.60 |
| 0.09858,∗ | -0.400.2948 | 8.800.1048 | |
| HS109 | 0.0335, 0.08955, 0.08158,∗ | 8.0017 | |
| BRHT4b | 0.0335, 0.0644, 0.0148 | -0.400.2030, -0.400.3044 | 7.800.0524, 8.00 |
| 0.09555, 0.09358,∗ | -0.100.1148 | 7.9517, 8.450.0848 | |
| -0.2530 (field) | |||
| HS111 | 0.13855, 0.14058,∗ | ||
| BSDL599 | 0.10755, 0.09958,∗ | ||
| BSDL603 | 0.1335, 0.09255, 0.08058,∗ | 7.800.1024, 7.8035 | |
| NGC1839 | 0.0644, 0.0448, 0.09155 | -0.400.2030, -0.4044 | 8.000.0524, 8.10 |
| 0.08058,∗ | -0.010.1248, -0.2530 (field) | 7.9035, 8.11 | |
| 8.300.50 | |||
| NGC1838 | 0.0644,48, 0.12055, 0.11758,∗ | -0.400.2030, -0.4044 | 8.00, 7.180.1244 |
| -0.010.0948, -0.2530 (field) | 8.200.1048 | ||
| BSDL623 | 0.0835, 0.10155, 0.10758,∗ | 8.0035 | |
| OGLE-CL LMC 111 | 0.1135, 0.12155, 0.10058,∗ | 8.0035 | |
| BSDL646 | 0.12555, 0.10558,∗ | ||
| OGLE-CL LMC 113 | 0.0335, 0.10055, 0.07858,∗ | 7.9535 | |
| NGC1847 | 0.2035, 0.1643, 0.0452 | -0.443, -0.910.0952 | 7.3035, 7.7643, 7.7052 |
| 0.0652, 0.13155, 0.12458,∗ | |||
| NGC1848 | 0.12355, 0.11058,∗ | ||
| BSDL664 | 0.13455, 0.13858,∗ | ||
| NGC1844 | 0.1535, 0.1542, 0.0452 | -0.242, -0.642, -0.500.1152 | 7.9035, 8.1842 |
| 0.0652, 0.10255, 0.09658,∗ | |||
| NGC1846 | 0.0248,59, 0.08155, 0.0756, | -0.700.201, -0.800.1426 | 9.49, 9.23 |
| 0.07858,∗ | -0.750.2026, -1.400.0529 | 9.500.0529, 9.15 | |
| -0.010.0948, -0.700.0854 | 9.000.0548, 9.15 | ||
| -0.900.1556, -0.490.0859 | 9.230.0159 | ||
| KMHK565 | 0.1035, 0.10755, 0.09458,∗ | 7.3035 | |
| SL244 | 0.0628,44, 0.0348, 0.11855 | -0.700.2028, -0.750.3028 | 9.11, 9.18 |
| 0.12558,∗ | -0.400.2030, -0.300.3044 | 9.08, 9.14 | |
| -0.280.1648, -0.2530 (field) | 9.150.0948 | ||
| H88 152 | 0.14455, 0.13058,∗ | ||
| SL256 | 0.1535, 0.12255, 0.10158,∗ | 7.8035 | |
| NGC1850A | 0.14055, 0.10658,∗ | -0.47,8 | 6.950.057, 6.828 |
| NGC1850 | 0.173, 0.187,8, 0.2035 | -0.263, -0.120.034, | 7.700.107, 7.78 |
| 0.0652, 0.1660, 0.1259 | -0.47,8, -0.530.0452 | 7.908,52, 7.900.0524 | |
| 0.14155, 0.10658,∗ | -0.310.2059 | 7.1035, 7.93 | |
| 7.95 | |||
| BRHT5b | 0.15255, 0.12758,∗ | 8.000.1024 | |
| H88 165 | 0.2035, 0.15155, 0.13758,∗ | 8.000.1024, 8.2035 | |
| NGC1854 | 0.12255, 0.11058,∗, 0.2157,∗ | Z=0.00757 | 7.850.0524, 7.7857 |
| BSDL745 | 0.11855, 0.11858,∗ | 7.600.0524 | |
| BSDL748 | 0.11555, 0.09558,∗ | 7.800.0524 | |
| NGC1858 | 0.157,8, 0.10555, 0.08658,∗ | -0.47,8, Z=0.00757 | 6.907, 6.888, 6.7057 |
| 0.1957 | 7.3057 | ||
| H88 177 | 0.09855, 0.08458,∗ | 8.200.0524 | |
| BRHT48b | 0.09855, 0.07858,∗ | 8.300.1024 | |
| H88 180 | 0.10955, 0.11658,∗ | ||
| BRHT48a | 0.10055, 0.07758,∗ | 8.350.1024 | |
| OGLE-CL LMC 185 | 0.1035, 0.13755, 0.12358,∗ | 7.7035 | |
| NGC1863 | 0.1535, 0.0644,52, 0.0848 | -0.400.2030, -0.4044 | 7.70, 7.8035 |
| 0.0552, 0.11955, 0.08658,∗ | -0.010.0948, -0.530.0952 | 7.60, 8.000.0948 | |
| -0.4030 (field) | 7.6052 | ||
| NGC1866 | 0.072,8, 0.0610,38, 0.147, | -0.430.1810, -0.3810, -0.48,47 | 8.148, 8.010,23, 8.480.7729 |
| 0.1560, 0.06058,∗ | -0.500.1023, -0.430.0439 | 8.00-8.4838, 8.260.2046 | |
| 0.000.0438, -0.270.1640 | |||
| -0.330.0746 | |||
| BRHT8b | 0.09255, 0.05458,∗ | 6.700.1024 | |
| OGLE-CL LMC 273 | 0.10855, 0.08758,∗ | ||
| NGC1894 | 0.08955, 0.05458,∗ | 7.850.0524 | |
| H88 236 | 0.09655, 0.06758,∗ | ||
| NGC1898 | 0.0721, 0.09355, 0.05758,∗ | -1.370.151, -1.180.1621 | 10.130.0821, 10.04 |
| -1.27, -1.33 | 10.140.0426 | ||
| -1.230.0532 (FeI), -0.810.1332 (FeII) | |||
| NGC1903 | 0.14355, 0.14558,∗ | 7.880.0324 | |
| BRHT9b | 0.13955, 0.13758,∗ | 9.000.0824 | |
| H88 255 | 0.14255, 0.13758,∗ | 8.000.0524 | |
| OGLE-CL LMC 318 | 0.09555, 0.05658,∗ | -0.900.1556 | 9.350.0256 |
| OGLE-CL LMC 321 | 0.09355, 0.05158,∗ | 8.100.0724 | |
| ESO85-72 | 0.0317,44, 0.0456, 0.05358,∗ | -0.650.2017,30, -0.650.3044 | 9.340.0317, 9.340.0317 |
| -0.580.0645, -0.950.1056 | 9.38, 9.38 | ||
| -0.6017 (field), -0.5530 (field) | 9.420.1045, 9.340.0656 | ||
| BSDL1291 | 0.09155, 0.07758,∗ | ||
| OGLE-CL LMC 369 | 0.08855, 0.07758,∗ | 8.300.0724 | |
| H88 283 | 0.08955, 0.07358,∗ | ||
| NGC1926 | 0.09255, 0.05958,∗ | 8.000.1024 | |
| NGC1935 | 0.09255, 0.11558,∗ | ||
| OGLE-CL LMC 404 | 0.10255, 0.06358,∗ | 8.350.0524 | |
| LH47 | 0.1111, 0.12355, 0.11458,∗ | -0.411 | 6.3011 |
| OGLE-CL LMC 407 | 0.08555, 0.03858,∗ | 8.200.1024 | |
| BSDL1411 | 0.08655, 0.04358,∗ | ||
| NGC1937 | 0.1111, 0.12555, 0.18058,∗ | -0.411 | 6.3011 |
| OGLE-CL LMC 431 | 0.08655, 0.06458,∗ | 8.000.0524 | |
| OGLE-CL LMC 438 | 0.08255, 0.07258,∗ | ||
| BSDL1576 | 0.09655, 0.10158,∗ | ||
| BSDL1592 | 0.09655, 0.12558,∗ | 8.000.0824 | |
| BSDL1588 | 0.11155, 0.07458,∗ | ||
| OGLE-CL LMC 446 | 0.11055, 0.07558,∗ | 8.300.0524 | |
| BSDL1597 | 0.10755, 0.16258,∗ | ||
| NGC1950 | 0.09455, 0.10058,∗ | 8.700.0824 | |
| BSDL1601 | 0.10455, 0.09658,∗ | 8.200.1024 | |
| SL457 | 0.10755, 0.09558,∗ | ||
| NGC1948 | 0.2013, 0.13658,∗ | -0.309, -0.413 | 7.009, 6.70-7.0013 |
| NGC1955 | 0.0918, 0.10858,∗ | -0.4018 | 7.190.0518 |
| BSDL1674 | 0.10858,∗ | 7.0035 | |
| LH53 | 0.13058,∗ | -0.309 | 7.009 |
| KMK88 56 | 0.11055, 0.07858,∗ | 8.400.1024 | |
| NGC1969 | 0.09355, 0.07658,∗ | 7.800.0524 | |
| OGLE-CL LMC 478 | 0.10255, 0.07758,∗ | 8.000.1024 | |
| BSDL1759 | 0.10455, 0.07658,∗ | ||
| NGC1971 | 0.08855, 0.07658,∗ | 8.000.0524 | |
| NGC1972 | 0.06244, 0.08555, 0.07658,∗ | -0.440.3044 | 7.800.1024, 8.20 |
| KMK88 57 | 0.09655, 0.06558,∗ | ||
| BSDL1783 | 0.08755, 0.05758,∗ | ||
| BSDL1785 | 0.09355, 0.05758,∗ | ||
| BSDL1807 | 0.08455, 0.05058,∗ | ||
| BSDL1821 | 0.08655, 0.04958,∗ | 8.600.2024 | |
| NGC1986 | 0.0552, 0.0652, 0.10755 | -0.460.0652 | 8.0052 |
| 0.09058,∗ | |||
| BSDL1858 | 0.11955, 0.08658,∗ | ||
| OGLE-CL LMC 500 | 0.10655, 0.08158,∗ | 8.200.1024 | |
| OGLE-CL LMC 512 | 0.10155, 0.06758,∗ | ||
| NGC1978 | 0.0938, 0.0751,53, 0.0559 | -0.420.041, -0.960.1523 | 9.301,50,59, 9.300.0223 |
| 0.07458,∗ | -0.21, -0.58 | 9.18, 9.13 | |
| -0.720.0129, -0.380.0231,34 (FeI) | 9.410.0629, 9.30 | ||
| -0.260.0.231 (FeII), -0.710.0838 | 9.7549 | ||
| -0.540.1940 (FeI), 0.050.1440 (FeII) | |||
| -0.3550, -0.5049, -1.053 | |||
| -0.430.0653, -0.490.1059 | |||
| KMHK960 | 0.0728,44, 0.1535, 0.0348 | -0.500.208, -0.700.308 | 8.95, 9.18 |
| 0.12155, 0.11258,∗ | -0.400.2030, -0.544 | 8.95, 8.8035 | |
| -0.700.3044, -0.280.1648 | 9.19, 8.900.1048 | ||
| -0.1530 (field) | |||
| BSDL1928 | 0.10655, 0.07658,∗ | ||
| OGLE-CL LMC 525 | 0.12055, 0.09258,∗ | ||
| ESO85-91 | 0.0317,44, 0.0556, 0.06258,∗ | -0.850.2017, -0.650.2030 | 9.08, 9.08 |
| -0.540.0937, -0.850.3044 | 9.0837, 9.140.0145 | ||
| -1.180.0845, -1.100.1556 | 9.11, 9.08 | ||
| -0.5017 (field), -0.3530 (field) | |||
| NGC2005 | 0.1021,38, 0.11255, 0.06958,∗ | -1.920.201, -1.350.1621 | 10.190.2021, 9.2024 |
| 0.1021,38, 0.11255, 0.06958,∗ | -1.51, -1.34 | 9.80, 10.20 | |
| -1.80.1032 (FeI), -1.33.0932 (FeII), | 1038, 538 | ||
| -1.520.0638, -1.540.0440 (FeI) | |||
| -1.270.0340 (FeII) | |||
| OGLE-CL LMC 540 | 0.13855, 0.08958,∗ | ||
| NGC2016 | 0.13855, 0.10458,∗ | ||
| KMHK1046 | 0.0728,44,56, 0.0235,48 | -0.700.2028,30, -0.750.3028 | 9.20, 9.20 |
| 0.11658,∗ | -0.7044, -0.750.3044 | 9.28, 8.8035 | |
| -0.700.5848, -1.100.1056 | 9.20, 9.23 | ||
| -0.4030 (field) | 9.300.2048, 9.230.0556 | ||
| BSDL2205 | 0.12255, 0.10758,∗ | ||
| BSDL2212 | 0.13255, 0.10458,∗ | ||
| NGC2019 | 0.0621,38, 0.09655, 0.08358,∗ | -1.800.201, -1.230.1521 | 10.210.0921, 9.2024 |
| -1.41, -1.44 | 10.20, 10.12 | ||
| -1.370.0732, -1.100.1632 | 1038, 738 | ||
| -1.640.0538, -1.670.0340 | |||
| -1.650.0440 | |||
| KMHK1013 | 0.0428,44,48, 0.0556 | -0.900.2028, -0.700.2030 | 9.30, 9.30 |
| 0.07458,∗ | -0.9044, -0.180.2248 | 9.23, 9.22 | |
| -1.100.1056 | 9.200.2048, 9.23 | ||
| -0.7030 (field) | |||
| LH72 | 0-0.1716, 0.06958,∗ | -0.6016 | 6.70-7.1816 |
| OGLE-CL LMC 585 | 0.13855, 0.11958,∗ | ||
| LH77 | 0.0618, 0.05658,∗ | -0.4018 | 7.200.1418 |
| OGLE-CL LMC 591 | 0.13355, 0.12358,∗ | ||
| NGC2028 | 0.12155, 0.10658,∗ | ||
| BSDL2624 | 0.15755, 0.12558,∗ | ||
| NGC2065 | 0.1052, 0.0652, 0.15655 | -0.400.0652 | 8.0052 |
| 0.15158,∗ | |||
| NGC2111 | 0.15955, 0.19058,∗ | 8.200.0524 | |
| KMHK1489 | 0.12955, 0.12658,∗ | 8.2035 | |
| NGC2136 | 0.105,22, 0.0922, 0.1535 | -0.55, -0.560.0322, | 6.905, 8.160.0522 |
| 0.0752, 0.0652, 0.14855 | -0.550.0622, -0.400.0141 | 8.000.1022, 7.910.0229 | |
| 0.12358,∗ | -0.4843, -0.510.0852 | 7.3035, 8.0041, 8.0943,52 | |
| NGC2155 | 0.072, 0.0233, 0.0544, | -0.550.201, -1.080.1219 | 9.401, 9.600.0319 |
| 0.0351, 0.0456, 0.0259 | -0.6825, -0.680.2025 | 9.500.0525, 9.430.2629 | |
| 0.06558,∗ | -0.440.8629, -0.800.2030 | 9.56, 9.480.0333 | |
| -0.700.1033,56, -0.9044, -0.6651 | 9.51, 9.40 | ||
| -1.00.1056, -0.590.1259 | 9.48, 9.48 | ||
| -0.7530 (field) | |||
| ESO121-3 | 0.0317,44 | -0.930.201, -1.050.2017 | 10.01, 9.9614, 9.930.0117 |
| -1.010.1519, -0.910.1623 | 9.980.1019, 9.2023 | ||
| -1.050.3044, -1.400.0545 | 9.93, 9.990.0145 | ||
| ESO86-61 | 0.0335,44, 0.0556 | -0.360.201, -0.650.2017 | 9.501, 9.300.0914 |
| -0.600.2030, -0.600.3044 | 9.340.0335, 9.34 | ||
| -1.000.1056, -0.5517 (field) | 9.31, 9.340.0656 | ||
| -0.6030 (field) | |||
| KMHK1679 | 0.07655, 0.08258,∗ | ||
| NGC2210 | 0.0912, 0.07855, 0.07458,∗ | -2.20.2012, -1.970.2016 | 10.2023, 9.580.0529 |
| -1.750.1023, -1.160.2029 | |||
| -1.650.0436 | |||
| ESO57-75 | 0.0935,44, 0.0756, 0.11855 | -0.850.2017, -0.750.2030 | 9.260.0335, 9.26 |
| 0.15958,∗ | -0.470.0737, -0.850.3044 | 9.2337, 9.26 | |
| -0.900.1556, -0.6017 (field) | |||
| -0.5530 (field) | |||
| NGC2249 | 0.256,8, 0.0133, 0.09858,∗ | -0.48, -0.400.0229 | 8.746, 8.540.108 |
| -0.450.1033 | 8.440.3029, 9.000.0333 | ||
| NGC2257 | 0.0620, 0.0422, 0.0459 | -1.630.2122, -0.850.1022 | , 10.11 |
| -1.950.0436, -1.640.1159 |
Appendix D Examples of metallicity determinations
Figures 14 to 17 show the examples of star clusters where only one or two stars were taken for metallicity determination.