Evidence for a Dense, Inhomogeneous Circumstellar Medium in the Type Ia SNR 0519-69.0
Abstract
We perform an expansion study of the Balmer dominated outer shock of the SNR 051969.0 in the LMC by using a combination of new HST WFC3 imagery obtained in 2020 and archival ACS images from 2010 and 2011. Thanks to the very long time baseline, our proper motion measurements are of unprecedented accuracy. We find a wide range of shock velocities, with the fastest shocks averaging 5280 km s-1 and the slowest grouping of shocks averaging just 1670 km s-1. We compare the H images from HST with X-ray images from Chandra and mid-IR images from Spitzer, finding a clear anti-correlation between the brightness of the remnant in a particular location and the velocity of the blast wave at that location, supporting the idea that the bright knots of X-ray and IR emission result from an interaction with a dense inhomogeneous circumstellar medium. We find no evidence for X-ray emission, thermal or nonthermal, associated with the fastest shocks, as expected if the fastest velocities are the result of the blast wave encountering the lower density ambient medium of the LMC. We derive an age of the remnant of yr, consistent with results derived from previous investigations.
I Introduction
Supernova remnants (SNRs) in nearby galaxies with well-known distances, such as the Large Magellanic Cloud (LMC), offer an excellent opportunity for studying the energetics of supernova explosions with great accuracy. Of the young remnants of Type Ia supernovae (SNe Ia), the four Balmer-dominated remnants DEM L71, SNR 0509-67.5, SNR 0519-69.0 and SNR 0548-70.4, have offered some of the best testing grounds for studying such aspects as Type Ia progenitor models (Seitenzahl et al. 2019), collisionless shock physics (Smith et al. 1991; Ghavamian et al. 2007; van Adelsberg et al. 2008; Heng 2010) and the physics of cosmic ray acceleration (Morlino et al. 2013, e.g.). All four Balmer-dominated SNRs were discovered as X-ray sources by the Einstein Observatory (Long et al. 1981) and confirmed as SNRs by Tuohy et al. 1982, where their Balmer-dominated nature was also established. The optical emission from Balmer-dominated shocks is produced by collisional excitation of neutral hydrogen atoms as they cross the shock. There are two populations of neutral atoms, a cold population excited by collisions with post-shock electrons and protons, and a hot population generated by charge exchange between the cold hydrogen atoms and hot protons. The two components produce broad and narrow H line emission which can be used to diagnose the shock speed and degree of electron-ion equilibration (Chevalier et al. 1980; Smith et al. 1991; Ghavamian et al. 2001; Ghavamian et al. 2007; van Adelsberg et al. 2008; Morlino et al. 2012, e.g.).
In recent years, a small subclass of SNe Ia has been identified as interacting with a circumstellar medium (CSM) in the months to years post-explosion (Silverman et al. 2013; Graham et al. 2019). While the number of members in this class is growing, it is still quite small, and systematic searches in the radio (Chomiuk et al. 2016; Cendes et al. 2020) and the UV (Dubay et al. 2022) have turned up only a few examples. In the SNR field, only Kepler’s SNR (Reynolds et al. 2007) in the Galaxy and N103B in the LMC (Williams et al. 2014) have shown evidence of substantial circumstellar interaction (at radii of a few pc and ages of several centuries).
Of all the Balmer-dominated SNRs in the LMC, SNR 0519-69.0 (hereafter, 0519) is one of the less well studied. The light-echo of the supernova that gave rise to 0519 presents as that of a spectroscopically normal SN Ia and the derived explosion age is (Rest et al. 2005). At least several solar masses of material have been swept-up by the blast wave so far (Borkowski et al. 2006). Models taking the combined constraints of the age and the forward and reverse shocks (as traced by the broad [Fe xiv] emission) into account are consistent with a Chandrasekhar-mass progenitor (Seitenzahl et al. 2019). Searches for surviving companions however have not been able to identify a donor/companion star (Edwards et al. 2012), but see Li et al. 2019 for a proposed candidate. A super-soft X-ray source has been ruled out a progenitor for 0519 by Kuuttila et al. 2019, based on the absence of a relic ionization nebular surrounding 0519. Li et al. 2021 recently reported on the discovery of some higher density knots exhibiting low surface-brightness forbidden line emission in 0519.
Although broad and narrow H were first detected by Smith et al. 1991, only the brightest filaments (corresponding to the slower shocks) were observed in that study. Ghavamian et al. 2007 detected broad Ly emission in the UV with the Far Ultraviolet Spectroscopic Explorer, from which they estimated a shock velocity of 36007100 km/s. More recently, Hovey et al. 2018 used a combination of ground-based optical spectra and space-based HST proper motions of 0519 to estimate the forward shock speed and cosmic ray acceleration efficiency of the SNR. Hovey et al. 2018 used HST observations separated by 1 year (2010 and 2011) to make their proper motion measurements. In this work, we extend the temporal baseline by an order of magnitude, using new observations obtained in 2020 to substantially reduce the uncertainties on the proper motions of the various filaments.
II Hubble Space Telescope Observations
The data considered here are a combination of existing archival HST images of 0519 acquired in 2010 and 2011 (Program ID GO-12017) with the ACS/F658N instrument/filter combination, along with a new epoch of data acquired in 2020 with WFC3/F657N as part of our approved Chandra program (Program ID GO-15989, which was part of a joint Chandra-HST program; B. J. Williams, PI). The WFC3/UVIS data were obtained on 2020 Jun 21 and Aug 10 with the F657N (H) filter, as shown in Table 1. The observations obtained in each exposure were dithered to permit removal of artifacts from the data and (for UVIS) to cover the chip gap, and the appropriate FLASH parameter was set for UVIS to reduce the effects of charge transfer inefficiency. The combined exposure was 8946 s for the WFC3 data. The corresponding earlier epoch ACS exposures were 4757 s each for both the 2010 and 2011 observations.
| Instrument | Dataset | Filter | Exposure Time (s) | Observation Date |
|---|---|---|---|---|
| ACS/WFC2 | JBDQ01010 | F658N | 3660 | 2010-04-17 |
| ACS/WFC2 | JBDQ01E5Q | F658N | 1097 | 2010-04-17 |
| ACS/WFC2 | JBDQ02010 | F658N | 3660 | 2011-04-21 |
| ACS/WFC2 | JBDQ02Y7Q | F658N | 1097 | 2011-04-21 |
| WFC3/UVIS2 | IE6M02020 | F657N | 3042 | 2020-06-21 |
| WFC3/UVIS2 | IE6M52010 | F657N | 5914 | 2020-08-10 |
The HST imagery provides exactly a decade in baseline (2010 to 2020), which, combined with the high shock velocities in 0519 (3000 km/s; Hovey et al. 2018), should allow a precise, easily measured expansion measurement. The expansion rate in arcseconds per year, , is given by
| (1) |
where is the shock speed (km/s) and is the SNR distance in kpc. Using a distance of 50 kpc for the LMC (Clementini et al. 2003), shock speeds of would result in filament displacements of around 0.08″- 0.1″over a 10 year baseline, corresponding to 4-5 ACS/WFC3 pixels. Owing to the small expected displacement ( half a pixel) of the Balmer filaments expected between 2010 and 2011 (as compared to the 2020 WFC3 data), we combined the 2010 and 2011 observations into a single high signal-to-noise image. Before combining, we utilized the tweakreg task in Drizzlepac to align the WCS solutions of all WFC3 images and ACS images to one another separately. The images include numerous well exposed LMC stars, with some near the full-well saturation limit, so the PEAKMAX value was set to 70,000 electrons during tweakreg runs. A SEARCHRAD parameter was set to 3.0″to allow a generous offset for search radius. We then used Astrodrizzle 3.2.1 to combine the 2010 and 2011 ACS images. As per our calculation above, the Balmer filaments in 0519 will only have moved less than 1/5 ACS pixels between the 2010 and 2011 data, so combining the 2010 and 2011 data will result in far smaller smearing of the filament emission than expected between the ACS data acquisition and the WFC3 data acquisition. Finally, we used Astrodrizzle to rotate and align the 2020 WFC3 image with the combined 2010+2011 ACS image. This procedure also resampled the WFC3 data to the ACS pixel scale (0.05′′ pixel-1).
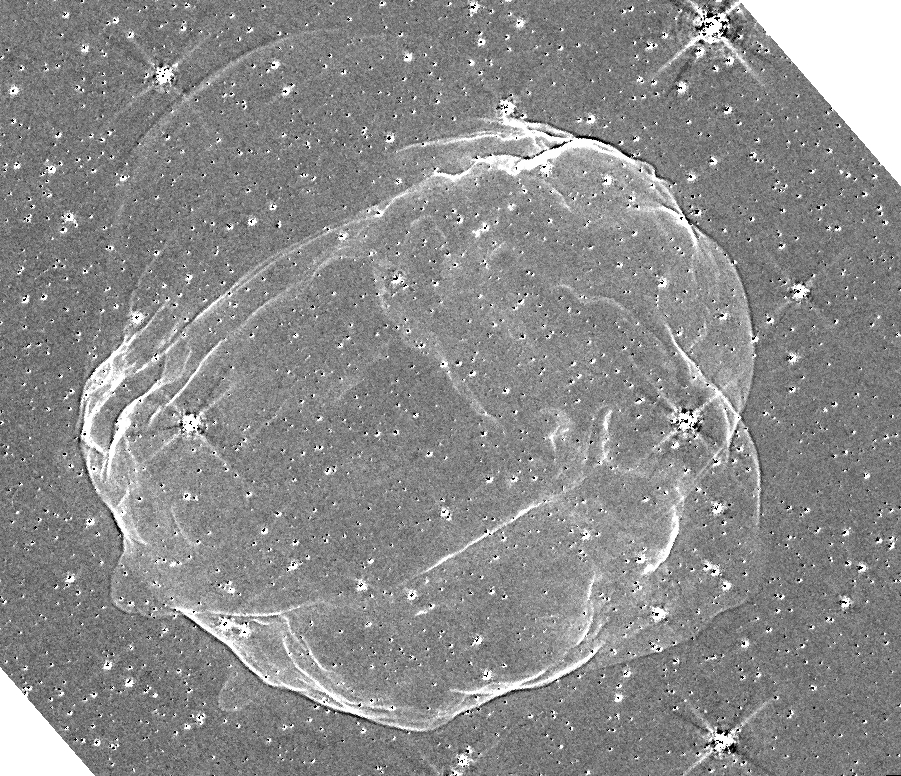
Examination of the final WFC3 and ACS images showed no residual asymmetries in the stellar PSFs, verifying that the image alignment had been successful. We checked the absolute astrometric accuracy of the final combined images by measuring centroids for a handful of stars in each field and comparing their coordinates to those of of those stars in the Gaia DR2 catalogue (Gaia Collaboration et al. 2018). These coordinates matched to within 0.01′′-0.02′′, or less than a quarter of an ACS pixel. In Figure 1, we show a difference image between the two epochs, where virtually all filaments can be easily seen to have moved outward.
III Measurements & Discussion
Our procedure for measuring the proper motions of the filaments is identical to that used in our previous proper motion studies of various remnants in the optical, radio, and X-ray bands (Williams et al. 2016; Winkler et al. 2014; Coffin et al. 2021). Briefly, we extract the 1D radial profiles from both epochs (where “radial” is defined as locally perpendicular to the shock front, which is linear over the small scales that we examine), with uncertainties on each data point, then shift epoch 1 relative to epoch 2, minimizing the value of when subtracting one profile from the other. Profiles are extracted in pixel space (using the ACS pixel scale size of 0.05′′), with shifts calculated on a grid of 10000 points with a step size of 0.002 pixels. We smooth the profiles very slightly, using a 1-pixel Gaussian. This has virtually no effect on the profile shapes, but significantly decreases the pixel-to-pixel Poisson noise level. Uncertainties reported are the 90% confidence limits from the fitting procedure.

Owing to the high angular resolution of HST and the high signal-to-noise ratio of the filaments, we were able to choose very narrow regions (10 pixels wide, or 0.5′′) over which to extract our 1D profiles. Such narrow regions ensure that filament curvature is negligible, while also allowing us to easily avoid stars. In Figure 2, we show the 21 regions we selected for analysis. This choice of regions is of course somewhat arbitrary, but we followed two general principles: 1) we chose enough regions around the remnant to get a representative sample size of forward shock velocities; and 2) in places like regions 36 or 17 and 18, where several distinct filamentary structures are present, we measure each filament’s position to search for differences in the expansion velocity. Region 1, 2, 8, and 10 are all located on faint “blowout” regions, visible on the image. Results from our measurements are shown in Table 2 and Figure 3. All values are also converted to velocities, using a distance of 50 kpc to the LMC.

It is apparent from the measurements that there is a spread in velocities present throughout the remnant. In general, the slowest shock speeds (regions 5, 6, and 14) correspond to the brightest filaments, while the faster shock speeds (regions 1, 2, 8, 18, 19) arise from the fainter filaments. Taking the average numbers for those groupings of filaments, we find an average shock velocity for the slower filament group of 1670 km s-1, and an average for the faster group of 5280 km s-1, corresponding to a factor of around 3 range in shock speed. Under the assumption of pressure equilibrium, where the product of density, , and the square of the shock velocity, (i.e., ) is constant, a factor of 3.1 difference in the shock velocities implies about a factor of 10 difference in the ambient density.
The flux ratio between the groupings of faint filaments and bright filaments measured above, as measured from the HST image, is about a factor of 5. Because the H emission behind the shock scales as the flux of incoming atoms , a velocity contrast of 3 and a flux contrast of 5 imply a density contrast of 15. Given the simplicity of these estimates, the rough agreement between the factor of 10 inferred from pressure equilibrium arguments and the factor of 15 inferred from H brightness is encouraging, and suggests that the remnant is not expanding into uniform density material.
It is important to note that due to projection effects, the proper motion can only measure the velocity of a filament in the plane of the sky. Getting the true velocity requires having the line-of-sight velocity via spectroscopic measurements. Geometrically, this is likely to be more important for the more internal filaments than those on the rim. In a future work, we will explore spectroscopy of these filaments, which can reveal both the bulk velocity and the widths of the broad spectral components.


One possible explanation for the large density variations on small scales is the presence of a dense shell of circumstellar material which has, in some locations, been penetrated by either the blast wave or clumps of ejecta. Regions 8 and 10 are examples. We have examined in detail the correlation between soft X-ray emission (0.4-0.8 keV) and H emission. Due to the degradation of Chandra’s soft X-ray response over the years, we use the original Chandra observation of this remnant from June 2000 (Obs. ID 118, PI S. Holt). In Figure 4, we show images of the remnant in the X-ray and optical bands plotted together. Sharp edges in the X-ray emission match slower shocks with brighter H emission quite well (e.g., regions 5, 6, 14, and 20). In the left panel of Figure 4, we separate the soft X-ray emission into two components: the 0.4-0.7 keV emission, most sensitive to lines from O, and the 0.7-0.8 keV emission, most sensitive to emission from L-shell emission of Ne-like Fe ions.
The O emission is most prominent in those regions where the shock speeds are lowest. As was shown in Borkowski et al. 2006, these regions also correspond to the brightest knots of emission seen in Spitzer 24 m images. The authors there concluded that the density in those knots is at least several times higher than in other parts of the remnant. In Figure 4, we show an overlay of the Spitzer 24 m emission with the HST H emission. This image has been de-convolved to a resolution of ” (the native resolution of Spitzer’s 24 m camera is ”) using the iCore software package (Masci & Fowler 2009). Similarly to the X-ray emission, the dust emission in IR is brightest where the H emission is bright and the shocks are slowest. As has been shown in previous studies of this and other remnants with Spitzer (Borkowski et al. 2006; Williams et al. 2011), it is possible to measure the post-shock gas density using emission from warm dust grains, as grain temperature (and thus spectral shape) and overall IR luminosity both scale with density. However, even with de-convolution, Spitzer’s spatial resolution makes this difficult to do for LMC remnants, where the angular sizes of SNRs is small (1′). Future high-resolution observations with JWST will be critical for gaining a detailed understanding of the density structures encountered by 0519 and other Type Ia SNRs in the LMC.

In contrast, there is little or no X-ray emission present from the faster, fainter filaments (e.g., 1, 2, 8, 15, 18), even in the hard X-rays, as Figure 4 shows. If the density contrast really is a factor of 10-15, then the thermal X-ray emission (X-ray emissivity scales as ) would be fainter by a factor of 100-200. In fact, this is almost exactly what we measure: when comparing the X-ray count rate in a small area behind region 18 with an identical area behind region 20, we find the X-ray brightness to be higher by a factor of 105 in the latter. It appears that the X-ray emission in 0519 is dominated by interaction with the densest material. We conclude that 0519, in at least some places, is interacting with a dense CSM. This conclusion is supported by the recent work of Li et al. 2021, who report that the dense knots seen in forbidden line observations of 0519 are consistent with an origin in a dense CSM. The dense knots seen in that paper correspond to the brightest knots in H seen in our observations.
All the shock velocities we obtain are well in excess of the km s-1 value often taken as the rough lower limit for shock speeds capable of accelerating electrons to X-ray-synchrotron-emitting energies TeV. However, X-ray images (shown in Figure 4, which use the recent deep Chandra observations of ks) show no evidence of non-thermal filamentary counterparts to the H filaments that circumscribe 0519. This is perhaps not surprising; the young Galactic SN Ia remnants Kepler, Tycho, and SN 1006 all show Balmer-dominated shocks in some areas, but typically without obvious X-ray counterparts. In SN 1006, dominated by nonthermal X-ray emission, faint H emission can be followed almost all around the remnant periphery, and in a few locations, narrow X-ray rims become evident as H rim emission weakens, overlapping over tens of degrees in azimuth. However, in the NW, where H emission is strongest, there is no nonthermal X-ray emission (see images in Winkler et al. 2014). The absence of nonthermal X-ray emission at the location of the H filaments is somewhat expected on theoretical grounds, in that the partially neutral upstream medium required for the Balmer emission is likely to suppress electron acceleration to TeV energies, due to ion-neutral wave damping (Draine & McKee 1993; O’C Drury et al. 1996). However, a cosmic-ray precursor can be inferred to be present ahead of Balmer-dominated shocks through detailed optical spectroscopy (this and related topics are reviewed in Heng 2010 and Ghavamian et al. 2013; also see Knežević et al. 2017 for more recent observational results). The substantial Balmer line emission from 0519, surrounding the entire remnant, is stronger and more extensive than in Galactic remnants, perhaps indicating a higher neutral fraction upstream and accounting for the absence of prominent nonthermal X-ray rims.
One may reasonably ask whether detection of thin rims of nonthermal X-ray emission, such as those seen in Tycho’s SNR, is possible at a distance of 50 kpc. To simulate this, we took a single observation of Tycho from 2004 (Obs ID 3837), and assumed its distance to be 2.3 kpc. Translating this to 50 kpc leads to angular scales smaller by a factor of 21.7 and fluxes smaller by a factor of 472. We chose a random piece of the Obs ID 3837 observation (total length 146 ks) that was only 0.309 ks in duration (146/472). We then binned this image by a factor of 22, and generated an RGB image with red (0.5 - 1.8 keV), green (1.8-4.0 keV), and blue (4.0-6.2 keV). We show this image in Figure 5, where one can see the narrow rims of nonthermal emission in blue. While this is only qualitative, it shows that it should at least be possible to discern nonthermal rims in 0519, if they were present. In a future work, we will examine the X-ray observations in more detail.
At a distance of 50 kpc, the radius of the remnant of corresponds to a physical radius of pc. Using the average shock velocities for the fastest filaments reported above (including their uncertainties), we can derive an undecelerated age of years. This assumes that the explosion site is in the center of the remnant, an assumption that may not be valid, even for “circular” SNRs, though the effect of this is relatively small (Williams et al. 2013). Because some amount of deceleration has almost certainly occurred, the real age is somewhat younger than this, which is completely consistent with the age reported in Rest et al. 2005 of years. Continued follow-up observations with HST will further refine estimates of the shock velocity.
IV Conclusions
We re-observed 0519-69.0, a young Type Ia SNR in the LMC, using HST in 2020, a decade after it was first observed in 2010. With this long baseline, we have measured the proper motions of filaments in the remnant that constitute a representative sample of the motions present. With the known distance to the LMC, we convert these proper motions to absolute velocities, finding a large range of about a factor of three. Combining our inferred velocities with a morphological study of the remnant at optical, IR, and X-ray wavelengths, we find that the slowest shock velocities result from an interaction of the blast wave with substantially denser material than the average ISM densities in the LMC ( cm-3). This dense material likely results from a circumstellar medium. We derive an undecelerated age (an upper limit) for the remnant of 670 yr, consistent with previous studies. Young remnants like this should be continuously monitored.
B.J.W. and P.G. acknowledge funding support through HST grant HST-GO-15989.
| Region Number | Proper MotionaaAll proper motions are reported in milliarcseconds over a 10 year baseline. | PM Lower Limit | PM Upper Limt | Shock VelocitybbAll shock velocities reported in km/s and assume a distance of 50 kpc for LMC | SV Lower Limit | SV Upper Limit |
|---|---|---|---|---|---|---|
| 1 | 196 | 156 | 234 | 4890 | 3890 | 5840 |
| 2 | 162 | 124 | 212 | 4040 | 3090 | 5290 |
| 3 | 107 | 88 | 126 | 2670 | 2200 | 3140 |
| 4 | 104 | 93 | 115 | 2600 | 2320 | 2870 |
| 5 | 59 | 55 | 63 | 1470 | 1370 | 1570 |
| 6 | 79 | 77 | 81 | 1970 | 1920 | 2020 |
| 7 | 145 | 140 | 154 | 3670 | 3490 | 3840 |
| 8 | 200 | 159 | 243 | 4990 | 3970 | 6060 |
| 9 | 139 | 130 | 148 | 3470 | 3240 | 3690 |
| 10 | 96 | 60 | 144 | 2400 | 1500 | 3590 |
| 11 | 148 | 139 | 156 | 3690 | 3470 | 3890 |
| 12 | 71 | 63 | 80 | 1770 | 1570 | 2000 |
| 13 | 106 | 98 | 114 | 2650 | 2450 | 2840 |
| 14 | 63 | 59 | 66 | 1570 | 1470 | 1650 |
| 15 | 160 | 108 | 229 | 3990 | 2700 | 5710 |
| 16 | 171 | 155 | 185 | 4270 | 3870 | 4620 |
| 17 | 110 | 97 | 123 | 2750 | 2420 | 3070 |
| 18 | 244 | 208 | 299 | 6090 | 5190 | 7460 |
| 19 | 206 | 183 | 232 | 5140 | 4570 | 5790 |
| 20 | 121 | 117 | 126 | 3020 | 2920 | 3140 |
| 21 | 170 | 148 | 193 | 4240 | 3690 | 4820 |
References
- Borkowski et al. (2006) Borkowski, K. J., Williams, B. J., Reynolds, S. P., et al. 2006, ApJ, 642, L141, doi: 10.1086/504472
- Cendes et al. (2020) Cendes, Y., Drout, M. R., Chomiuk, L., & Sarbadhicary, S. K. 2020, ApJ, 894, 39, doi: 10.3847/1538-4357/ab6b2a
- Chevalier et al. (1980) Chevalier, R. A., Kirshner, R. P., & Raymond, J. C. 1980, ApJ, 235, 186, doi: 10.1086/157623
- Chomiuk et al. (2016) Chomiuk, L., Soderberg, A. M., Chevalier, R. A., et al. 2016, ApJ, 821, 119, doi: 10.3847/0004-637X/821/2/119
- Clementini et al. (2003) Clementini, G., Gratton, R., Bragaglia, A., et al. 2003, AJ, 125, 1309, doi: 10.1086/367773
- Coffin et al. (2021) Coffin, S. C., Williams, B. J., & Katsuda, S. 2021, arXiv e-prints, arXiv:2112.08448. https://arxiv.org/abs/2112.08448
- Draine & McKee (1993) Draine, B. T., & McKee, C. F. 1993, ARA&A, 31, 373, doi: 10.1146/annurev.aa.31.090193.002105
- Dubay et al. (2022) Dubay, L. O., Tucker, M. A., Do, A., Shappee, B. J., & Anand, G. S. 2022, ApJ, 926, 98, doi: 10.3847/1538-4357/ac3bb4
- Edwards et al. (2012) Edwards, Z. I., Pagnotta, A., & Schaefer, B. E. 2012, ApJ, 747, L19, doi: 10.1088/2041-8205/747/2/L19
- Gaia Collaboration et al. (2018) Gaia Collaboration, Brown, A. G. A., Vallenari, A., et al. 2018, A&A, 616, A1, doi: 10.1051/0004-6361/201833051
- Ghavamian et al. (2007) Ghavamian, P., Blair, W. P., Sankrit, R., Raymond, J. C., & Hughes, J. P. 2007, ApJ, 664, 304, doi: 10.1086/518686
- Ghavamian et al. (2001) Ghavamian, P., Raymond, J., Smith, R. C., & Hartigan, P. 2001, ApJ, 547, 995, doi: 10.1086/318408
- Ghavamian et al. (2013) Ghavamian, P., Schwartz, S. J., Mitchell, J., Masters, A., & Laming, J. M. 2013, Space Sci. Rev., 178, 633, doi: 10.1007/s11214-013-9999-0
- Graham et al. (2019) Graham, M. L., Harris, C. E., Nugent, P. E., et al. 2019, ApJ, 871, 62, doi: 10.3847/1538-4357/aaf41e
- Heng (2010) Heng, K. 2010, PASA, 27, 23, doi: 10.1071/AS09057
- Hovey et al. (2018) Hovey, L., Hughes, J. P., McCully, C., Pandya, V., & Eriksen, K. 2018, ApJ, 862, 148, doi: 10.3847/1538-4357/aac94b
- Knežević et al. (2017) Knežević, S., Läsker, R., van de Ven, G., et al. 2017, ApJ, 846, 167, doi: 10.3847/1538-4357/aa8323
- Kuuttila et al. (2019) Kuuttila, J., Gilfanov, M., Seitenzahl, I. R., Woods, T. E., & Vogt, F. P. A. 2019, MNRAS, 484, 1317, doi: 10.1093/mnras/stz065
- Li et al. (2021) Li, C.-J., Chu, Y.-H., Raymond, J. C., et al. 2021, ApJ, 923, 141, doi: 10.3847/1538-4357/ac2c04
- Li et al. (2019) Li, C.-J., Kerzendorf, W. E., Chu, Y.-H., et al. 2019, ApJ, 886, 99, doi: 10.3847/1538-4357/ab4a03
- Long et al. (1981) Long, K. S., Helfand, D. J., & Grabelsky, D. A. 1981, ApJ, 248, 925, doi: 10.1086/159222
- Masci & Fowler (2009) Masci, F. J., & Fowler, J. W. 2009, in Astronomical Society of the Pacific Conference Series, Vol. 411, Astronomical Data Analysis Software and Systems XVIII, ed. D. A. Bohlender, D. Durand, & P. Dowler, 67. https://arxiv.org/abs/0812.4310
- Morlino et al. (2012) Morlino, G., Bandiera, R., Blasi, P., & Amato, E. 2012, ApJ, 760, 137, doi: 10.1088/0004-637X/760/2/137
- Morlino et al. (2013) Morlino, G., Blasi, P., Bandiera, R., & Amato, E. 2013, A&A, 557, A142, doi: 10.1051/0004-6361/201322161
- O’C Drury et al. (1996) O’C Drury, L., Duffy, P., & Kirk, J. G. 1996, A&A, 309, 1002. https://arxiv.org/abs/astro-ph/9510066
- Rest et al. (2005) Rest, A., Suntzeff, N. B., Olsen, K., et al. 2005, Nature, 438, 1132, doi: 10.1038/nature04365
- Reynolds et al. (2007) Reynolds, S. P., Borkowski, K. J., Hwang, U., et al. 2007, ApJ, 668, L135, doi: 10.1086/522830
- Seitenzahl et al. (2019) Seitenzahl, I. R., Ghavamian, P., Laming, J. M., & Vogt, F. P. A. 2019, Phys. Rev. Lett., 123, 041101, doi: 10.1103/PhysRevLett.123.041101
- Silverman et al. (2013) Silverman, J. M., Nugent, P. E., Gal-Yam, A., et al. 2013, ApJS, 207, 3, doi: 10.1088/0067-0049/207/1/3
- Smith et al. (1991) Smith, R. C., Kirshner, R. P., Blair, W. P., & Winkler, P. F. 1991, ApJ, 375, 652, doi: 10.1086/170228
- Tuohy et al. (1982) Tuohy, I. R., Dopita, M. A., Mathewson, D. S., Long, K. S., & Helfand, D. J. 1982, ApJ, 261, 473, doi: 10.1086/160358
- van Adelsberg et al. (2008) van Adelsberg, M., Heng, K., McCray, R., & Raymond, J. C. 2008, ApJ, 689, 1089, doi: 10.1086/592680
- Williams et al. (2013) Williams, B. J., Borkowski, K. J., Ghavamian, P., et al. 2013, ApJ, 770, 129, doi: 10.1088/0004-637X/770/2/129
- Williams et al. (2016) Williams, B. J., Chomiuk, L., Hewitt, J. W., et al. 2016, ApJ, 823, L32, doi: 10.3847/2041-8205/823/2/L32
- Williams et al. (2011) Williams, B. J., Blair, W. P., Blondin, J. M., et al. 2011, ApJ, 741, 96, doi: 10.1088/0004-637X/741/2/96
- Williams et al. (2014) Williams, B. J., Borkowski, K. J., Reynolds, S. P., et al. 2014, ApJ, 790, 139, doi: 10.1088/0004-637X/790/2/139
- Winkler et al. (2014) Winkler, P. F., Williams, B. J., Reynolds, S. P., et al. 2014, ApJ, 781, 65, doi: 10.1088/0004-637X/781/2/65