Estimations of On-Site Coulomb Potential and Covalent State in La2CuO4 by Muon Spin Rotation and Density Functional Theory Calculation
Abstract
The on-site Coulomb potential, , and the covalent state of electronic orbitals play key roles for the Cooper pair symmetry and exotic electromagnetic properties of high- superconducting cuprates. In this report, we demonstrate a new way to determine the value of and present the whole picture of the covalent state of Cu spins in the mother system of the La-based high- superconducting cuprate, La2CuO4, by combining the muon spin rotation (SR) and the density functional theory (DFT) calculation. We succeeded in revealing local deformations of CuO6 octahedron followed by changes in Cu-spin distributions which were caused by the injected muon. Adjusting the DFT and SR results, and the minimum charge transfer energy between the upper Hubbard band and the O2 band were optimized to be 4.87(4) eV and 1.24(1) eV, respectively.
I introduction
The La-based high- superconducting cuprate is a typical Mott system and has a rich variety in physics, making this system still mysterious and brightly fascinating even after three decades have passed since its discovery. There are open questions on exotic electronic states that need to be investigated, like pseudogaps,Timusk and Statt 1999 stripes of spins and holes,Tranquada et al. 1995 precursor of superconduting states,Wang et al. 2006 unconventional normal statesBoebinger et al. 1996 and charge-ordered states.Chang et al. 2012 These unique states are commonly realized on the basis of the strong on-site Coulomb potential, , and covalent states of Cu3 orbitals with surrounding O2 orbitals.Czyżyk and Sawatzky 1994; Anisimov et al. 2002; Wan et al. 2009; Pesant and Côté 2011; Werner et al. 2015; Jang et al. 2016; Hirayama et al. 2018; Lane et al. 2018; Nilsson et al. 2019 Both properties have been suggested to be essential to describe the possible mechanism of the high- superconductivity because those carry the symmetry of the wave function of the Cooper pair and electronic conducting properties.Zhang and Rice 1988; Yokoyama and Tanaka 2006
For deeper understanding of those exotic effects caused by the on-site Coulomb potential on Cu, , and the covalent state, the mother system of the La-based high- superconducting cuprate, La2CuO4 (LCO), can provide an ideal playground. LCO is a typical Mott insulator and has the strong covalent state of Cu3 with O2 within the two-dimensional (2D) CuO2 plane. The antiferromagnetic (AF) interaction between Cu spins leads to the formation of the AF ordered state.Budnick et al. 1987; Vaknin et al. 1987; Uemura 1988; Borsa et al. 1995 The exchange coupling energy within the CuO2 plane was suggested to be about 140 meV.Coldea et al. 2001 The value of on the Cu atom has been well investigated but still has large ambiguities of 3-10 eV,Czyżyk and Sawatzky 1994; Anisimov et al. 2002; Wan et al. 2009; Pesant and Côté 2011; Werner et al. 2015; Jang et al. 2016; Hirayama et al. 2018; Lane et al. 2018; Nilsson et al. 2019 giving uncertainty on discussions of exotic electronic states of high- superconducting cuprates. This is because, those features contain quantum and multi-body effects of electrons which are still difficult to approach either experimentally and theoretically.
Following this situation, we suggest a novel approach to this problem by combining the muon spin rotation (SR) measurement with the density functional theory (DFT) calculation including as an adjustable parameter (DFT+).Anisimov et al. 1991; Dudarev et al. 1998; Varignon et al. 2019 The muon is a sensitive local magnetic probe and can trace the covalent state with helps of DFT+. In this report, we are going to show the results of this combined investigation on LCO, revealing the covalent state of Cu spins and determining . We found three muon sites in LCO. Those muon positions were described from our DFT+ with the full view of the spatial distribution of Cu spins caused by the covalent state. Adjusting DFT+ with the SR results, we obtained the value to be 4.87(4) eV followed by the determination of the minimum charge-transfer (CT) energy between the upper Hubbard band of Cu3 and O2 to be 1.24(1) eV, and the size of the magnetic moment of Cu spin to be 0.520(3) .
II Experimentals
II.1 Growth of the La2CuO4 single crystal
A large LCO single-crystal was synthesized by the traveling-solvent floating-zone method and was confirmed to be of a single phase without impurities by using the X-ray diffraction measurement at room temperature. After the oxygen reduction annealing in Ar-gas flow, the AF transition temperature, , was estimated from the magnetic susceptibility measurement by using a Superconducting Quantum Interferometric Device (Quantum Design Co. Ltd., MPMS-XL). The crystal was sliced in parallel with the CuO2 layer for present SR measurements.
II.2 SR
SR measurements were carried out on the GPS spectrometer at the Paul Scherrer Institut (PSI) in Switzerland by using a continuous muon source in the zero-field condition. The muon was injected into the LCO single-crystal sample keeping the initial spin-polarization to be perpendicular to the CuO2 plane. The time dependence of the asymmetry parameter, (), is defined as () = (SR time spectrum). Here, () and () are numbers of positron counted by the forward and backward counters at , respectively.Hayano et al. 1979; Uemura et al. 1985 In order to determine internal fields at muon sites with the higher accuracy, we gathered more than 600 million positrons which were more than 20 times higher than usual cases.
II.3 DFT Calculations
DFT calculations were conducted using Vienna ab-initio Simulation Package (VASP)Kresse and Furthmöller 1996; Kresse and Furthmüller 1996 with the Generalized Gradient Approximation Perdew-Wang91 (GGA-PW91) exchange-correlation functional with adjusting between 2-8 eV.Perdew et al. 1992; Dudarev et al. 1998 The Kohn-Sham approach using the projector augmented-waves (PAW) formalism was adopted as implemented in VASP.Kresse and Furthmöller 1996; Kresse and Furthmüller 1996 It should be noted that DFT results generally depend on the functional.Kulik and Marzari 2008 Although GGA+ is not neither ideal nor the best functional to exactly describe electronic state of LCO, this functional is well known to be valid with in order to describe electronic states of strongly correlated systems.Czyżyk and Sawatzky 1994; Pesant and Côté 2011 Since there is no ideal full self-interaction correlated functional even now, we chose GGA+ as the ”best possible” functional for the present study as well as other published papers.Varignon et al. 2019
The ground state of a calculation model was achieved by setting the convergence criterion of 1 10-4 eV. The relaxation process of all atomic positions was terminated until the magnitude of the force on each atom became less than 0.05 eV/Å following the quasi-Newton algorithm. The crystal structural symmetry was set to be orthorhombic with the space group. Lattice parameters for the unit cell were set to be = 5.3568 Å = 5.4058 Å and = 13.1432 Å as estimated by the neutron scattering experiment.Reehuis et al. 2006
Figure 1 indicates an initial condition of the Cu-spin structure for present DFT calculations. Cu spins form the AF alignment with the spin direction in parallel with the b-axis within the CuO2 plane. This spin structure is the same with that determined from the neutron scattering experiment.Vaknin et al. 1987 The supercell containing 32 unit cells with one muon in the formation of the 442 stacking was used for all our non-collinear DFT calculations to estimate stable muon positions. RIKEN Supercomputing Facility named HOKUSAI was used for our supercell calculations.

III Results
III.1 Characterizations of the La2CuO4 single crystal
Figure 2 shows the temperature dependence of the magnetic susceptibility of the LCO single crystal which was used for the present SR study. The magnetic field of 0.5 T was applied perpendicular to the CuO2 plane. A sharp peak was observed around 309 K which was due to the appearance of the long-range AF ordering of Cu spins.Vaknin et al. 1987; Reehuis et al. 2006 An increase in the magnetic susceptibility was observed below about 20 K. This increase was fitted by the Curie-Weiss law. The red-solid line in Fig. 2 is the best fit result within the temperature range below 100 K. The Weiss temperature was estimated from this low temperature analysis to be -1.2(2) K. This result indicates that the increase in the magnetic susceptibility below 20 K is due to free spins which are not related to the AF ordering. Assuming that those free spins would be coming from Cu spins which appear around crystal defects, its fraction was estimated to be 0.024 %.

III.2 SR
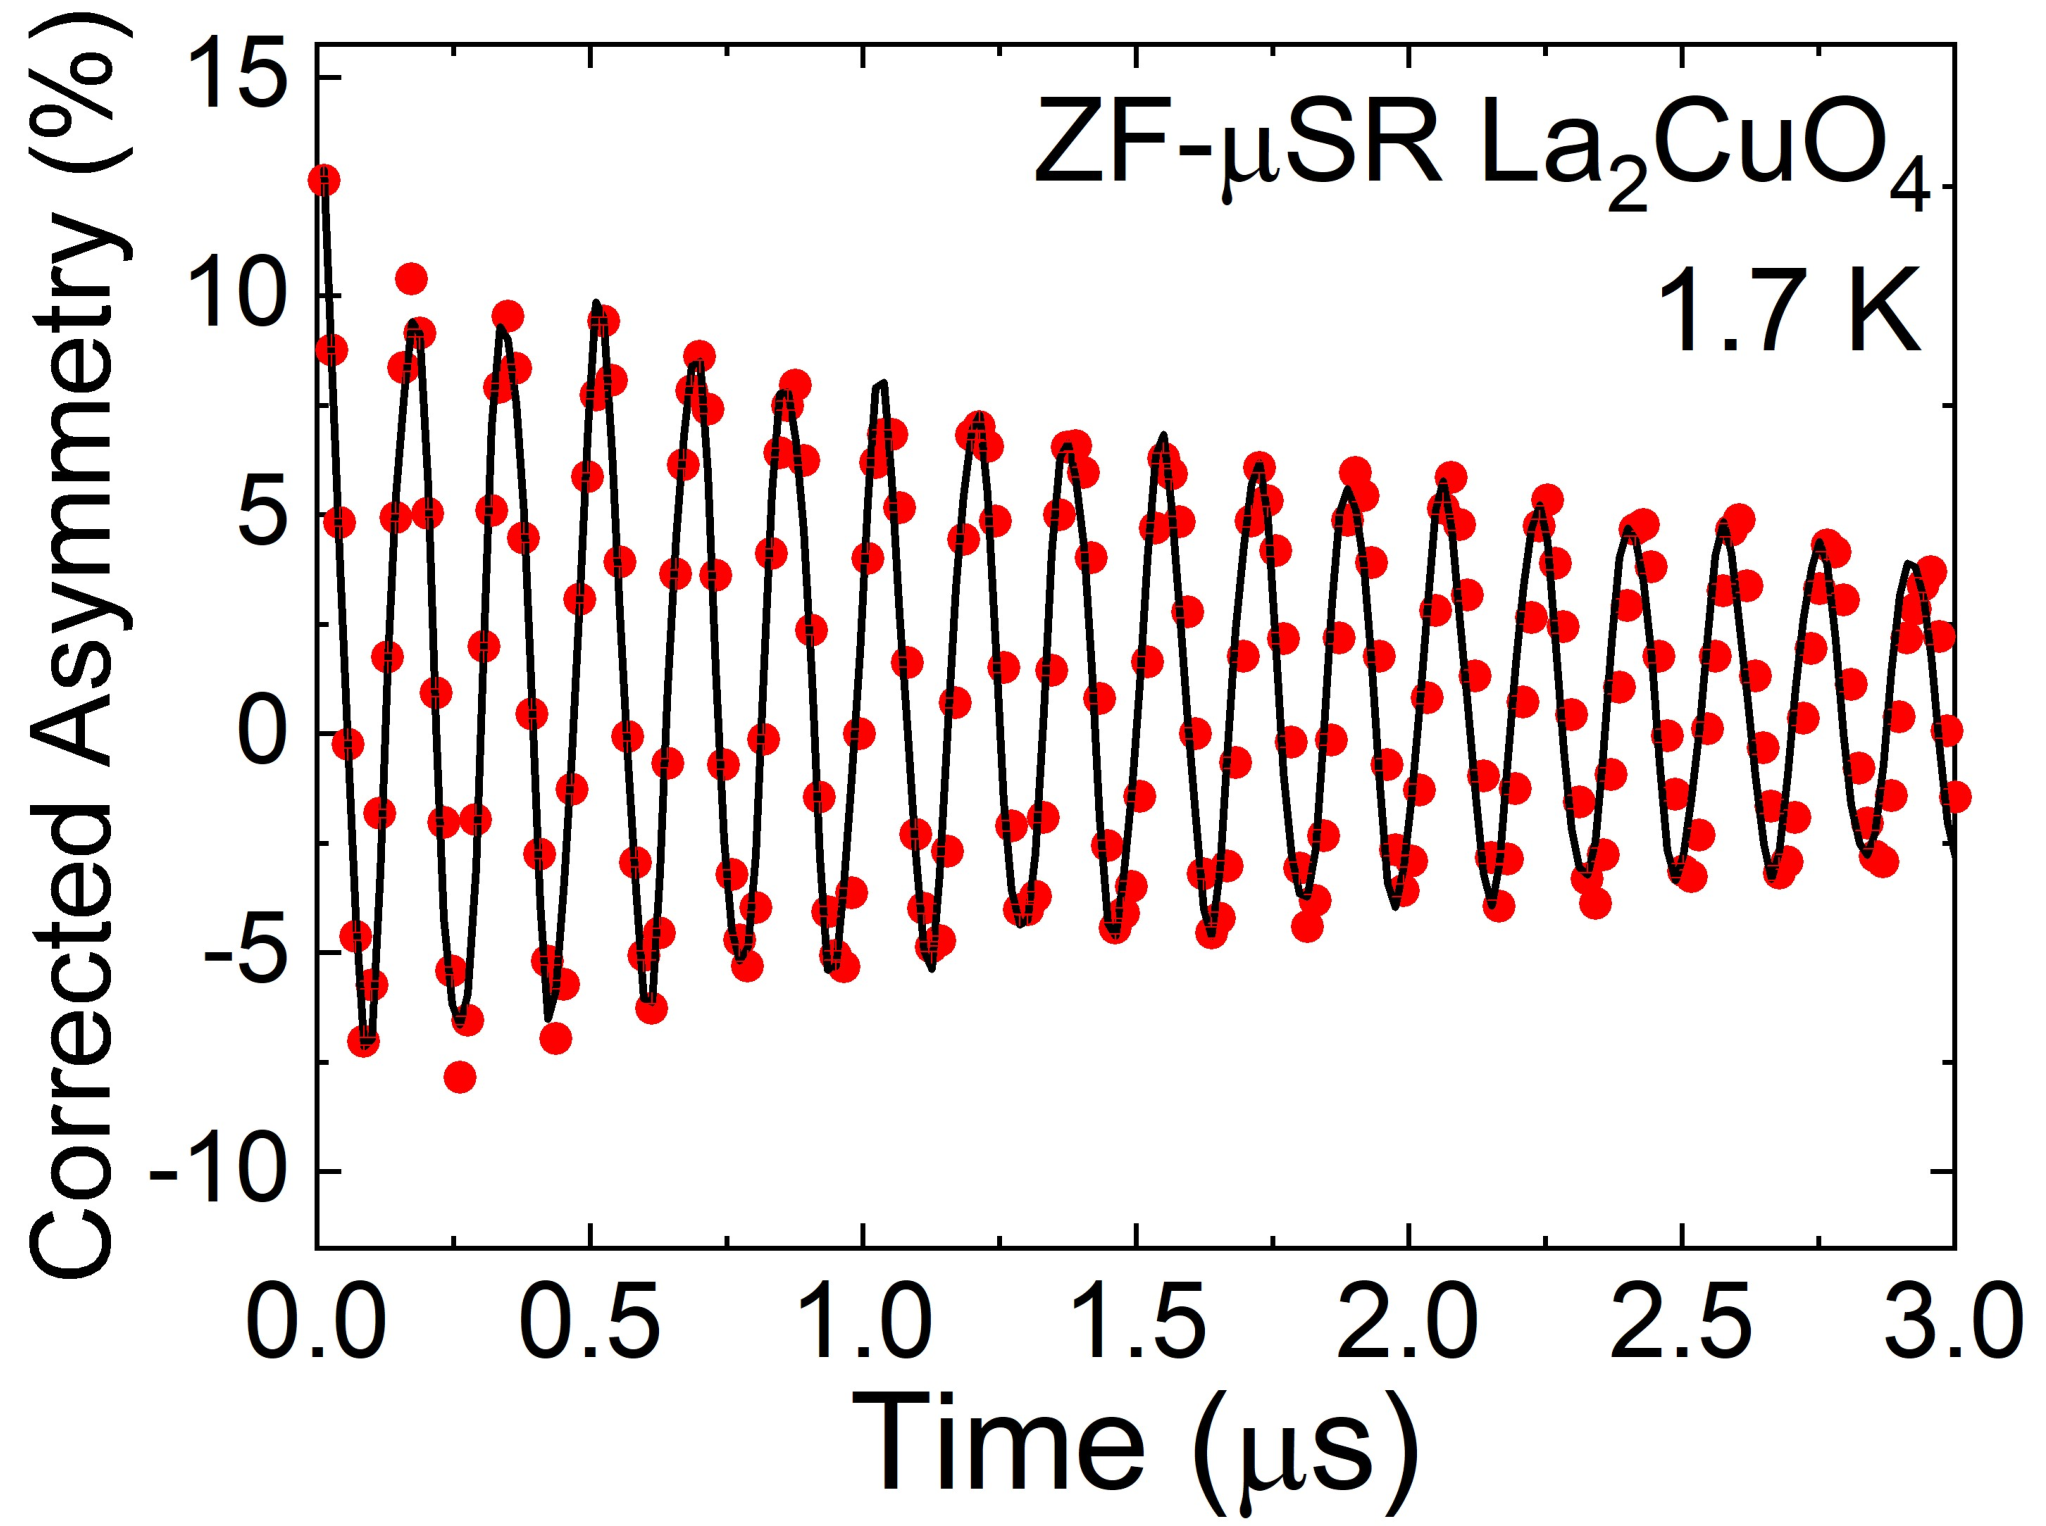
Figure 3(a) shows the SR time spectrum measured in the zero-field condition at 1.7 K on the LCO single crystal. The observation of the muon-spin precession proved that Cu spins in LCO were in the AF ordered state.Uemura 1988 The SR time spectrum showed many turns of the muon spin with the slow damping rate. The muon-spin precession was apparent at least up to 6 sec which was the reliable maximum measurable time. The observation of the clear muon-spin recession in the long-time region indicates that the AF network of Cu spins is well coherent compared to those used in other SR studies.Uemura 1988; Borsa et al. 1995; Stilp et al. 2013
Figure 3(b) shows the Fourier spectrum of the muon-spin precession. We confirmed three peaks. One was the main peak with a large spectral weight compared with the other two. The other two peaks were found at the higher and lower frequency sides with much smaller spectral weight than that of the main peak. These results mean that there are three possible muon stopping positions in LCO with different occupancies. For convenience, we named the main peak, lower field and higher field positions as M1μ, M2μ and M3μ, respectively.

We applied the Lorentzian function to estimate the internal field at each muon site. Solid lines in Fig. 3(b) are the best-fit results for each peak. The frequency value at each peak position, , was converted to an internal magnetic field at the muon site, , by the following relation,
| (1) |
At here, is the gyromagnetic ratio of of 135.5 MHz/T. The main peak is corresponding to the internal field of 426.7(1) G (5.78 MHz). This value is the same as that reported in the past.Uemura 1988 The low-frequency one is corresponding to 109.2(4) G (1.48 MHz). This low-frequency peak was reported from the SR study on the LCO thin film with much bigger muon-precession amplitude compared to our observed one in the bulk LCO single crystal.Stilp et al. 2013 At this moment, reasons why the amplitude obtained in the LCO thin film and the bulk form is different are still unclear and necessary to be investigated. On the other hand, The high-frequency peak with the internal field of 1251.6(3) G (17.0 MHz) was not reported in the LCO thin film. There would be a possibility that this high-frequency peak was not clearly observed in the LCO thin film by some reasons, such as too low precession amplitude.
Following this result, the time spectrum shown in Fig. 3(a) was analyzed assuming three muon sites by applying Eq.(2). Watching the time spectrum carefully, the center of the muon-spin precession is shifted from the corrected zero-asymmetry position and relax slowly. The shift of the time spectrum from the corrected zero position was included in the analysis function as the offset component. Constant background signals which were coming from surroundings of the sample were subtracted from the time spectrum by applying this fitting method, so that the SR time spectrum shown in Figure 3(a) is the background-free spectrum. The solid line in Fig. 3(a) is the best-fit result.
| (2) |
Here, and , and are initial asymmetries at =0, relaxing rates of the muon-spin precession and the offset component, respectively. The and are the frequency and phase of the muon-spin precession, respectively. The is converted to the the interal field at the muon site following Eq. 1. For convenience sake, we indexed the internal field at each muon site to be (=1,2,3). The ratio among is corresponding to the existing probability of the muon at each stopping site, putting =1,2,3 for M1μ, M2μ and M3μ, respectively. All parameters obtained from the Fourier analysis and direct fitting of the time spectrum are listed in Table 1.
The ratio among initial asymmetries seems to be different from that of the Fourier spectrum weight. This is due to the fast relaxation rate for M2μ compared to those for M1 and M3. After compensating the Fourier spectrum wight by the relaxation rate, both ratios became similar each other. Accordingly, we used the ratio among initial asymmetries for simplicity to argue the population of the muon at each site.
| SR Time Spectrum | Fourier Spectra | ||||
|---|---|---|---|---|---|
| (%) | (G) | (degree) | (sec-1) | Peak Position (G) | |
| M1μ | 9.228(23) | 426.35(2) | -5.15(15) | 0.333(20) | 426.59 (1) |
| M2μ | 2.631(54) | 95.9(58) | 22.6(55) | 5.36(26) | 109.16 (39) |
| M3μ | 0.872(26) | 1245.54(36) | -5.7(17) | 0.50(3) | 1251.55 (27) |
| offset | 1.879(54) | — | — | 0.380(36) | — |
III.3 DFT+ without
In the first attempt to combine DFT+ with the SR results, we tried to visualize the full view of the covalent state of Cu around the the nuclear position without the muon. Figure 4(a) exhibits the map of the Cu-spin density distribution obtained from DFT+ calculations. The was simply set to be 5.0 eV as a convenience. The Cu-spin density on the CuO2 plane expands from the atomic position of Cu to the in-plane O sites. This is due to the covalent state of Cu3 with the neighboring O2 and causes the appearance of a partial density of Cu-spin at the in-plane O position. The adjacent Cu spin also expands its density to the same in-plane O site with the opposite sign of the spin direction and cancels the net magnetic moment at in-plane O. We found that about 18% of the Cu spin was transferred from the atomic position of Cu to in-plane O. This should be one of reasons why the net magnetic moment of the Cu-spin (=1/2) is not 1 but reduced to be about a half as observed by neutron scattering experiments.Vaknin et al. 1987; Reehuis et al. 2006 This reduction due to the covalent state explained only 36 % of the total reduction in the magnetic moment of Cu, indicating that the quantum spin fluctuation effect is important to satisfy the difference.Kojima et al. 1997
In addition to this, a small amount of the asymmetric Cu-spin density was found in 2 of apical O as indicated in Fig. 4(a). The estimated amount was at most 1% of the Cu spin, and the density inside the CuO6 octahedron is bigger than that of the outside. This result is consistent with that obtained by Lane et al.Lane et al. 2018 Consequently, the net magnetic moment at apical O is not canceled and the amount of about 0.01 is left. The spin direction on apical O is opposite to that of Cu within the same CuO6 octahedron. This small magnetic moment at apical O cannot be ignored in the estimation of the internal field at the muon site.Miyazaki et al. 2010
The Cu-spin density in the vertical direction to the CuO2 plane was also investigated by DFT in order to visualize a magnetic path along the inter-plane direction within CuO6 octahedron. However, almost no enlargement of the polarized spin-density distribution in Cu3 was found as well as the preceding study,Lane et al. 2018 indicting a possibility that the inter-plane magnetic interaction could be driven by the direct exchange interaction between Cu3 and 2 of apical O within the same CuO6 octahedron. On the other hand, the angle-resolved photoelectron spectroscopy succeeded to visualize Cu3 and a 139La-NMR measurement pointed out a part of Cu-spin density was transferred to apical O via Cu3.Matt et al. 2018; Watanabe 1994 A theoretical study solving out low-energy Hamiltonians supposed active roles of Cu3 hybridizing with O2.Hirayama et al. 2018 These results indicate that the contribution of Cu3 to the inter-plane magnetic interaction is not negligible and still an open question.
III.4 DFT+ with
As the next step, DFT+ was carried out including the muon to reproduce the SR results. For this purpose, muon positions in LCO were investigated in advance. The precise determination of muon positions in LCO has not yet been successful in the past and was left as a long-term fundamental problem in the muon community.Hitti et al. 1991; Torikai et al. 1993; Sulaiman et al. 1994; Adiperdana et al. 2012; Suter et al. 2003; Stilp et al. 2013
Figure 4(b) shows our estimation of initial stopping positions of injected muons in LCO obtained from simple electrostatic potential calculations by using a unit cell since the muon has a positive charge and prefers to sit down at the minimum electrostatic potential just after it stops in the sample.Adiperdana et al. 2012 Three possible local minimum potential positions were found as candidates of initial muon stopping positions. We named those three positions as M1DFT, M2DFT and M3DFT in order to compare with the SR results. The injected muon choses one of those three positions to initially stop and moves to a local stable position interacting with surrounding atoms and electrons, causing local deformations of the crystal structure and electronic states in the vicinity of the muon.Suter et al. 2003; Möller et al. 2013 There are four crystallographic equivalent sites of each muon position within the unit cell. We confirmed by using the present calculation condition including the muon that those sites were also magnetically equivalent within the calculation accuracy.
Since the number of injected muons is almost negligible compared with the number of atoms in the sample, the muon can be regarded as a super-dilute magnetic impurity in DFT+. This situation requires us to set a sufficiently large supercell structure with one muon inside in order to follow the realistic SR experimental condition. Accordingly, the 442 supercell was used for the present DFT+ including the muon. DFT calculations on a small cell with one muon is unrealistic because the number of muons is comparable to the number of unit cell of the sample in smaller cells.Ramadhan et al. 2019 Our modeled supercell contained 896 atoms and one muon. All atomic positions and electronic density distributions were necessary to be as adjustable parameters within the supercell with only one muon as the magnetic impurity. This kind of supercell calculations need larger-scale computation volume. We carried out this large-scale calculation by using the high-performance supercomputing cluster system of HOKUSAI in RIKEN.

Figure 5(a)-(c) indicate the final muon positions and local deformations of the crystal structure estimated from our DFT++ calculations. As for M1DFT, the muon is located near apical O and inside the CuO6 octahedron as demonstrated in Fig. 5(a). The muon moves into the more inside of the CuO6 octahedron after relaxing its position and pushes away the Cu atom from the muon. Two in-plane O in the CuO2 plane are pulled toward M1DFT. Concerning M2DFT, the muon stops near apical O as well as M1DFT but outside the CuO6 octahedron as shown in Fig. 5(b). The muon moves away a little from apical O after the relaxation and pulls one in-plane O to its side. M2DFT does not affect the Cu position too much. In terms of M3DFT, the muon sits in between two in-plane O and pulls them to its side and pushes away the Cu atom from the muon as exhibited in Fig. 5(c).

Those local changes in atomic positions of Cu lead to changes in the Cu-spin distribution around the muon. Figure 6 shows the results of DFT++, indicating the Cu-spin density distribution around each muon position. In the case of M1DFT, the Cu-spin density becomes slightly less as shown in Fig. 6(a), resulting in the reduction of the magnetic moment of Cu in net. This reduction in the magnetic moment of Cu happens just beside the muon. The reduction ratio of the magnetic moment of Cu in the presence of the muon was estimated to be about -5 % and -1 % for M1DFT and M3DFT, and 0 % for M2DFT.

The unbalanced spin density was also found at in-plane O which were caused by changes in the spin densities coming from adjacent two Cu atoms. This effect was the largest for M3DFT as drawn in Fig. 6(c) and can be qualitatively understood as follows. The balance of the Cu-spin density transferred to in-plane O is broken due to deformations of local electronic states and crystal structure which happens at one side beside the muon. This unbalanced Cu-spin density at in-plane O causes the non-zero magnetic moment. The estimated size of the additional magnetic moment was about 0.01 but cannot be negligible for the estimation of the internal field at the muon site because this component appears just near the muon. Similarly, the small component of the magnetic moment at apical O slightly increased due to the change in the local Cu-spin density. All of these changes are local effects induced by the injected muon and disappear quickly beyond next neighbor unit cells.
III.5 Effects of the Zero-Point Vibration Motion of
In preceding studies, internal fields at the muon sites were always overestimated and could not explain the present SR results even taking into account distributed Cu spins as shown in Fig. 6(a)-(c). Accordingly, we included one quantum effect of the muon itself, which was the zero-point vibration motion.Bernardini et al. 2013 This is because the muon is a fine particle with the lighter mass of about 1/9 compared to the hydrogen and has the spatial distribution around the stopping position following the shape of the local potential. This quantum motion of the muon can be obtained by solving the Schrödinger equation around the local potential surrounding the muon as follows.
| (3) |
Here, , , and are the potential around the muon, muon’s mass, wave function and eigenvalue, respectively. The Schrödinger equation was solved out numerically by using the MATLAB program.

Figure 7 shows the estimated muon-spin distribution due to the zero-point vibration motion around the minimum electrostatic potential for M1DFT, M2DFT and M3DFT. These are two-dimensional images within the cross-section along the CuO2 plane. Red- and blue-color regions indicate the high and low muon-density areas, respectively. We confirmed that more than 99 % muon density are there within the 1.5 cubic volume. The total sum of the dipole fields from surrounding Cu spins are calculated taking into account this muon-spin density distribution.
IV Discussions
In order to optimize muon positions and other related parameters, the internal fields at M1DFT, M2DFT and M3DFT were calculated on the basis of the dipole-dipole coupling, because LCO is a good insulator and the existing probability of conducting electrons around the muon is expected to be unlikely.Hyp Cu-spin distributions and the muon’s zero-point vibration motion were also included in the estimation of the internal field by using the following equation.
| (4) |
Here, is the vector data for the spin grids and is the relative distance between the Cu-spin-density grids with the density of and the muon probability grids . Then, we summed up all grid components obtained from our DFT calculations to estimate the internal field at the muon site. We set the radius of 50 Å centering the muon to achieve the converged results for dipole calculations. The supercell with one muon was set at the center of the calculated sphere and other areas were filled up by normal unit cells without muons.
It should be noted that multiple magnetic sites can be realized when different spin-structure domains are induced around microscopic defects in the LCO crystal as suggested from the SR study on the LCO thin film.Stilp et al. 2013 If this is the case, those defects are expected to introduce free Cu spins as well around defects in the Cu-spin network.Kojima et al. 1995; Adachi et al. 2008 Our magnetic susceptibility measurement on the LCO single crystal showed that the fraction of those kinds of free spins is very small and almost negligible. This result means that the LCO single crystal used in the present study has less defects, indicating the uniform Cu-spin network with a single spin-structure domain.
We have already simulated internal fields at three muon sites in LCO with some different spin structures including the ones suggested from the SR study on the LCO thin film.Ramadhan et al. 2020 This previous result showed that three different internal fields at our estimated three muon sites in the LCO single crystal can be quantitatively explained by one magnetic domain even though different spin states were set. Accordingly, we assumed in the present study that one uniform magnetic spin structure which was the same as that determined from the neutron scattering experiment appeared in the LCO single crystal,Budnick et al. 1987; Vaknin et al. 1987 resulting in that the existence of three muon sites in LCO was intrinsic.
Since all muon positions, magnetic moment of Cu and Cu-spin density distributions are related to , the dipole-field calculation was repeated varying from 2 to 8 eV in order to find out the optimized results. All calculated values which we have done are summarized in Table 2.
| (eV) | |||||||||||||
| 2 | 3 | 3.5 | 4 | 4.5 | 5 | 5.6 | 6 | 6.5 | 7 | 7.2 | 7.5 | 8 | |
| Calculated Magnetic Moment without () | |||||||||||||
| Magnetic Moment | 0.386 | 0.436 | 0.460 | 0.482 | 0.503 | 0.524 | 0.547 | 0.562 | 0.583 | 0.602 | 0.609 | 0.621 | 0.641 |
| Muon Position | Calculated Internal Fields, (G) | ||||||||||||
| M1DFT | 336.35 | 376.01 | 384.85 | 391.51 | 429.28 | 446.36 | 450.22 | 471.50 | 474.90 | 491.08 | 503.83 | 507.16 | 523.10 |
| M2DFT | 103.99 | 116.30 | 121.28 | 127.04 | 131.21 | 135.68 | 141.54 | 145.85 | 150.14 | 154.33 | 155.44 | 159.07 | 163.76 |
| M3DFT | 888.06 | 990.60 | 1038.67 | 1077.89 | 1128.28 | 1169.74 | 1219.72 | 1241.02 | 1281.64 | 1322.98 | 1334.41 | 1364.36 | 1407.01 |
Basised on those results, we indexed the calculated internal fields as (=1,2,3) in order to compare with . And then, we defined differences between both values by using the following equation.
| (5) |
After this, we summed up all for each with fitting-error values of internal fields, , as follows. Detail values of are listed in Table 1.
| (6) |

Figure 8 shows the dependence of summed up values obtained from Eq. (6). Applying the Gaussian function, was optimized to be 4.87(4) eV. This value locates at the lower-end of the range which has been argues to be from 3 to 10 eV.Czyżyk and Sawatzky 1994; Anisimov et al. 2002; Wan et al. 2009; Pesant and Côté 2011; Werner et al. 2015; Jang et al. 2016; Hirayama et al. 2018; Lane et al. 2018; Nilsson et al. 2019
It was pointed out from theoretical studies on Hubbard model with a square lattice that is strongly correlated to the energy scale of the effective spin Hamiltonian which is described as 4/ and that a border between strong and weak correlations is around 6.5.Yokoyama and Tanaka 2006 Here, is the hopping energy of electrons. Our present result of the smaller in LCO would give limitations on discussions of and provide possible dedicated directions to understand differences in among high- superconducting cuprates.Andrade et al. 2018 For instance, we suggest following the ab-initio calculation of the effective Hamiltonian that the electronic state of LCO is closer to the one-band model although more detail comparisons with theoretical investigations are necessary.Hirayama et al. 2018
Following this result of the optimization of , the magnetic moment of Cu was estimated through the same DFT calculation processes. The optimized value was 0.520(3) in the case of LCO without the muon. The direction of the optimized Cu spin was still along the b-axis after the non-collinear refinement. The estimated magnetic moment and the spin structure were consistent with those suggested from neutron scattering experiment.Vaknin et al. 1987 In addition, optimized internal fields at each muon site in the case of = 4.87(4) eV were calculated from the dipole-field calculation using Eq.(4) to be 429.7(12) G, 134.1(4) G and 1,147.6(35) G for M1DFT, M2DFT and M3DFT, resulting in that M1DFT = M1μ, M2DFT = M2μ and M3DFT = M3μ, respectively. Differences in the internal field between the SR and DFT++ were 3.4 G (1%), 38.2 G (40 %) and 97.9 G (8 %) for M1μ, M2μ and M3μ, respectively. All optimized muon positions and internal fields at there are summarized in Table 3. Atomic positions of the CuO6 octahedron after the opitmization with the muon at M1DFT, M2DFT and M3DFT are listed in Table 4.
Figure 9 indicates the simulated SR time spectrum by using internal fields obtained from present DFT++ calculations. We used the same values for , and as listed in Table 1 and in order to evaluate our DFT results. The solid-red line in Fig. 9 is the simulation result. The simulated result reproduced the time spectrum fairly well, but there were still small differences between measured and simulated SR time spectra, especially in the longer time region. This is because, simulated internal fields for M1 and M3 are very close to the experimental results but the one for M2 is still fairly far. The reason why our DFT++ did not perfectly reproduce the experimental result is guessed to be due to DFT’s underlying principal statistical errors with regards to the pseudo-potential approximation, calculation-grid resolution, cut-off energy, relaxation step for self-consistent calculation loop and so on. Although the DFT+ calculation has been well established to describe electronic states of strongly correlated systemsCzyżyk and Sawatzky 1994; Anisimov et al. 2002; Wan et al. 2009; Pesant and Côté 2011; Werner et al. 2015; Jang et al. 2016; Hirayama et al. 2018; Lane et al. 2018; Nilsson et al. 2019; Varignon et al. 2019; Möller et al. 2013 and those statistical errors should be small, errors would be piled up during the total-energy minimization process of the non-periodical supercell model with the muon and become non-ignorable as a result in our case.
| Muon Position | before relaxation | after relaxation | Internal Fields (G) | ||||||||
|---|---|---|---|---|---|---|---|---|---|---|---|
| Fourier | DFT | ||||||||||
| M1DFT | 0.3839 | 0.5982 | 0.4336 | 0.3777 | 0.6175 | 0.4375 | 426.59(1) | 429.7(12) | -2.81 | 355.06 | -241.92 |
| M2DFT | 0.3928 | 0.5893 | 0.4023 | 0.3817 | 0.5968 | 0.3975 | 109.16(39) | 134.1(4) | -8.54 | 73.89 | -111.04 |
| M3DFT | 0.3660 | 0.5491 | 0.4961 | 0.3880 | 0.5502 | 0.4935 | 1251.55(27) | 1147.6(35) | 23.47 | -1134.59 | -170.17 |
| before relaxation | after relaxation |
![[Uncaptioned image]](2207.07926v1/O_Position.png)
| |||||||||||
|---|---|---|---|---|---|---|---|---|---|---|---|---|---|
| without | with at M1DFT | with at M2DFT | with at M3DFT | ||||||||||
| Atoms | |||||||||||||
| Cu | 0.3750 | 0.6250 | 0.5000 | 0.3751 | 0.6243 | 0.5087 | 0.3757 | 0.6240 | 0.5003 | 0.3739 | 0.6322 | 0.5024 | |
| O1 | 0.3125 | 0.5625 | 0.4964 | 0.3128 | 0.5635 | 0.4915 | 0.3125 | 0.5620 | 0.4942 | 0.3202 | 0.5597 | 0.4932 | |
| O2 | 0.4375 | 0.5625 | 0.4964 | 0.4369 | 0.5639 | 0.4891 | 0.4377 | 0.5622 | 0.4874 | 0.4350 | 0.5623 | 0.4929 | |
| O3 | 0.4375 | 0.6875 | 0.5036 | 0.4373 | 0.6876 | 0.5056 | 0.4381 | 0.6869 | 0.5042 | 0.4376 | 0.6898 | 0.5084 | |
| O4 | 0.3125 | 0.6875 | 0.5036 | 0.3128 | 0.6876 | 0.5059 | 0.3133 | 0.6872 | 0.5043 | 0.3102 | 0.6891 | 0.5087 | |
| O5 | 0.3750 | 0.6165 | 0.5918 | 0.3755 | 0.6112 | 0.5917 | 0.3766 | 0.6122 | 0.5918 | 0.3762 | 0.6079 | 0.5927 | |
| O6 | 0.3750 | 0.6335 | 0.4018 | 0.3742 | 0.6402 | 0.4052 | 0.3733 | 0.6408 | 0.4057 | 0.3753 | 0.6418 | 0.4076 | |
It is worthwhile to describe other value-added results obtained from the present DFT study. By using the optimized , the band-gap structure can also be optimized, leading to the minimum CT gap between the upper Hubbard band and O2 to be 1.24(1) eV. This CT-gap value has been discussed within the range of 0.9-2 eV giving large ambiguity.Lane et al. 2018; Tokura et al. 1990; Uchida et al. 1991; Ono et al. 2007 Note that our obtained value is in the ground state at 0 K. Even taking into account that the measured CT gap shows a shift for a couple of 0.1 eV to the lower energy side with increasing temperature,Ono et al. 2007 our obtained value is fully consistent with the previous results.Lane et al. 2018; Tokura et al. 1990; Uchida et al. 1991; Ono et al. 2007 Those facts also proved that our results revealed the realistic feature of the electronic state of LCO.
There still be one more question left for the full understandings of the SR results. That is how to explain differences in populations of stopped muons among the three sites. The experimental results indicate that most of injected muons stop at M1μ as evidenced in Fig. 3(b). The ratio of populations of muons among those three sites were determined from the differences in the initial asymmetries to be as M1μ:M2μ:M3μ=106:30:10. One possible way to address this question is to model the stopping procedure of the muon in LCO after its injection. This is left as an open question. More DFT calculations and/or simulations will be required to tackle this problem.
V Conclusion
We determined the value of , covalent state of the Cu spin and the CT gap energy in LCO by combining SR experiments and DFT calculations. Three muon positions in LCO were identified and was precisely determined to be 4.87(4) eV, followed by the magnetic moment of Cu to be 0.520(3) and the minimum CT gap between the upper Hubbard band to the O2 band to be 1.24(1) eV. The role of the perturbation introduced by the muon was found to deform the local crystal structure just around the muon, followed by subsequent changes in the surrounding electronic state in LCO. This effect leads to the slight reduction in the magnetic moment surrounding the muon.
Strong benefit of our technique is that we can achieve information of the spin structure, size of magnetic moment, muon positions and in one time by analyzing one SR time spectra. Especially, the value cannot be optimized from other experimental methods with good accuracy as demonstrated in the present study. In addition, our technique is workable for other systems on the basis of some experimental and computational conditions. Those are; 1) the target system has magnetic moments, 2) the muon-spin precession should be observed and 3) DFT calculations is applicable, 4) there are accessible high-performance computing resources which can accept large-scale supercell calculations. As long as those four conditions are satisfied, our developed technique to estimate is widely applicable to any systems. For instance, mother systems of all Cu-based high- cuprates, Mott systems, heavy Fermions and strongly correlated organic molecular systems are good targets. Even using other DFT package programs like Quantum Espresso, CASTEP and Wien2K, one can apply the same method described in this report to their own target materials. This means that the transferability of our method to other materials is quite high and widely applicable to other research fields providing us deeper knowledge on their unique and exotic properties from a different perspective via SR.
Acknowledgements.
The authors would like to thank for technical supports by the muon group of PSI to carry out the SR measurement and also thank K. Ishida, A. Fujimori and M. Ogata for their valuable discussions. We would like to acknowledge the HOKUSAI supercomputing facility (Project. No. G19007) of RIKEN. This work is supported by JSPS KAKENHI (No’s JP19H01841 and 20H04463) and International Program Associate of RIKEN.References
- Timusk and Statt [1999] T. Timusk and B. Statt, Rep. Prog. Phys. 62, 61 (1999).
- Tranquada et al. [1995] J. M. Tranquada, B. J. Sternlieb, J. D. Axe, Y. Nakamura, and S. Uchida, Nature 375, 561 (1995).
- Wang et al. [2006] Y. Wang, L. Li, and N. P. Ong, Phys. Rev. B 73, 024510 (2006).
- Boebinger et al. [1996] G. S. Boebinger, Y. Ando, A. Passner, T. Kimura, M. Okuya, J. Shimoyama, K. Kishio, K. Tamasaku, N. Ichikawa, and S. Uchida, Phys. Rev. Lett. 77, 5417 (1996).
- Chang et al. [2012] J. Chang, E. Blackburn, A. T. Holmes, N. B. Christensen, J. Larsend, J. Mesot, D. A. Ruixing Liang, Bonn, W. N. Hardy, A. Watenphul, M. V. Zimmermann, E. M. Forgan, and S. M. Hayden, Nature Phys. 8, 871 (2012).
- Czyżyk and Sawatzky [1994] M. T. Czyżyk and G. A. Sawatzky, Phys. Rev. B 49, 14211 (1994).
- Anisimov et al. [2002] V. I. Anisimov, M. A. Korotin, I. A. Nekrasov, Z. V. Pchelkina, and S. Sorella, Phys. Rev. B 66, 100502 (2002).
- Wan et al. [2009] X. Wan, T. A. Maier, and S. Y. Savrasov, Phys. Rev. B 79, 155114 (2009).
- Pesant and Côté [2011] S. Pesant and M. Côté, Phys. Rev. B 84, 085104 (2011).
- Werner et al. [2015] P. Werner, R. Sakuma, F. Nilsson, and F. Aryasetiawan, Phys. Rev. B 91, 125142 (2015).
- Jang et al. [2016] S. W. Jang, akakibara Hirofumi, H. Kino, T. Kotani, K. Kuroki, and M. J. Han, Scientific Reports 6, 33397 (2016).
- Hirayama et al. [2018] M. Hirayama, Y. Yamaji, T. Misawa, and M. Imada, Phys. Rev. B 98, 134501 (2018).
- Lane et al. [2018] C. Lane, J. W. Furness, I. G. Buda, Y. Zhang, R. S. Markiewicz, B. Barbiellini, J. Sun, and A. Bansil, Phys. Rev. B 98, 125140 (2018).
- Nilsson et al. [2019] F. Nilsson, K. Karlsson, and F. Aryasetiawan, Phys. Rev. B 99, 075135 (2019).
- Zhang and Rice [1988] F. C. Zhang and T. M. Rice, Phys. Rev. B 37, 3659 (1988).
- Yokoyama and Tanaka [2006] M. Yokoyama, H. Ogata and Y. Tanaka, J. Phys. Soc. Jpn. 75, 114706 (2006).
- Budnick et al. [1987] J. I. Budnick, A. Golnik, C. Niedermayer, E. Recknagel, M. Rossmanith, A. Weidinger, B. Chamberland, M. Filopkowski, and D. P. Yang, Phys. Lett. A 124, 103 (1987).
- Vaknin et al. [1987] D. Vaknin, S. K. Sinha, D. E. Moncton, D. C. Johnston, J. M. Newsam, C. R. Safinya, and H. E. King, Phys. Rev. Lett. 58, 2802 (1987).
- Uemura [1988] Y. J. Uemura, J. App. Phys. 64, 6087 (1988).
- Borsa et al. [1995] F. Borsa, P. Carretta, J. H. Cho, F. C. Chou, Q. Hu, D. C. Johnston, A. Lascialfari, D. R. Torgeson, R. J. Gooding, N. M. Salem, and K. J. E. Vos, Phys. Rev. B 52, 7334 (1995).
- Coldea et al. [2001] R. Coldea, S. M. Hayden, G. Aeppli, T. G. Perring, C. D. Frost, T. E. Mason, S.-W. Cheong, and Z. Fisk, Phys. Rev. Lett. 86, 5377 (2001).
- Anisimov et al. [1991] V. I. Anisimov, J. Zaanen, and O. K. Andersen, Phys. Rev. B 44, 943 (1991).
- Dudarev et al. [1998] S. L. Dudarev, G. A. Botton, S. Y. Savrasov, C. J. Humphreys, and A. P. Sutton, Phys. Rev. B 57, 1505 (1998).
- Varignon et al. [2019] J. Varignon, M. Bibes, and A. Zunger, Nature Commun. 10, 1658 (2019).
- Hayano et al. [1979] R. S. Hayano, Y. J. Uemura, J. Imazato, N. Nishida, T. Yamazaki, and R. Kubo, Phys. Rev. B 20, 850 (1979).
- Uemura et al. [1985] Y. J. Uemura, T. Yamazaki, D. R. Harshman, M. Senba, and E. J. Ansaldo, Phys. Rev. B 31, 546 (1985).
- Kresse and Furthmöller [1996] G. Kresse and J. Furthmöller, Comput. Mat. Sci. 6, 15 (1996).
- Kresse and Furthmüller [1996] G. Kresse and J. Furthmüller, Phys. Rev. B 54, 11169 (1996).
- Perdew et al. [1992] J. P. Perdew, J. A. Chevary, S. H. Vosko, K. A. Jackson, M. R. Pederson, D. J. Singh, and C. Fiolhais, Phys. Rev. B 46, 6671 (1992).
- Kulik and Marzari [2008] J. Kulik and N. Marzari, Chem. Phys. 129, 134314 (2008).
- Reehuis et al. [2006] M. Reehuis, C. Ulrich, K. Prokeš, A. Gozar, G. Blumberg, S. Komiya, Y. Ando, P. Pattison, and B. Keimer, Phys. Rev. B 73, 144513 (2006).
- Stilp et al. [2013] E. Stilp, A. Suter, T. Prokscha, E. Morenzoni, H. Keller, B. M. Wojek, H. Luetkens, A. Gozar, G. Logvenov, and I. Božović, Phys. Rev. B 88, 064419 (2013).
- Kojima et al. [1997] K. M. Kojima, Y. Fudamoto, M. Larkin, G. M. Luke, J. Merrin, B. Nachumi, Y. J. Uemura, N. Motoyama, H. Eisaki, S. Uchida, K. Yamada, Y. Endoh, S. Hosoya, B. J. Sternlieb, and G. Shirane, Phys. Rev. Lett. 78, 1787 (1997).
- Miyazaki et al. [2010] M. Miyazaki, R. Kadono, K. H. Satoh, M. Hiraishi, S. Takeshita, A. Koda, A. Yamamoto, and H. Takagi, Phys. Rev. B 82, 094413 (2010).
- Matt et al. [2018] C. E. Matt, D. Suter, and J. Chang, Nature Communications 9, 972 (2018).
- Watanabe [1994] I. Watanabe, J. Phys. Soc. Jpn. 63, 1560 (1994).
- Hitti et al. [1991] B. Hitti, P. Birrer, K. Fischer, F. N. Gygax, E. Lippelt, H. Maletta, A. Schenk, and M. Weber, Hyperfine Interact. 63, 287 (1991).
- Torikai et al. [1993] E. Torikai, K. Nagamine, H. Kitazawa, I. Tanaka, S. B. Kojima, Sulaiman, S. Srinivas, and T. P. Das, Hyperfine Interact. 79, 921 (1993).
- Sulaiman et al. [1994] S. B. Sulaiman, N. Sahoo, S. Srinivas, F. Hagelberg, T. P. Das, E. Torikai, and K. Nagamine, Hyperfine Interact. 84, 87 (1994).
- Adiperdana et al. [2012] B. Adiperdana, I. A. Dharmawan, S. E. Siregar, I. Watanabe, K. Ohishi, Y. Ishii, T. Suzuki, T. Kawamata, R. Scheuemann, K. Sedlak, Y. Tomioka, T. Waki, Y. Tabata, and H. Nakamura, Phys. Procedia 30, 109 (2012).
- Suter et al. [2003] H. U. Suter, E. P. Sroll, and P. F. Meier, Physica B 326, 329 (2003).
- Möller et al. [2013] J. S. Möller, P. Bonfà, D. Ceresoli, S. J. Bernardini, F. Blundell, T. Lancaster, R. De Renzi, N. Marzari, I. Watanabe, and S. B. Sulaiman, Phys. Scr. 88, 068510 (2013).
- Ramadhan et al. [2019] M. R. Ramadhan, I. Ramli, M. D. Umar, S. Winarsih, D. P. Sari, A. Manaf, B. Kurniawan, M. I. Mohamed-Ibrahim, S. Sulaiman, and I. Watanabe, Mater. Sci. Forum 966, 465 (2019).
- Bernardini et al. [2013] F. Bernardini, P. Bonfà, S. Massidda, and R. De Renzi, Phys. Rev. B 87, 115148 (2013).
- [45] .
- Kojima et al. [1995] K. Kojima, A. Keren, G. M. Luke, B. Nachumi, W. D. Wu, Y. J. Uemura, M. Azuma, and M. Takano, Phys. Rev. Lett. 74, 2812 (1995).
- Adachi et al. [2008] T. Adachi, N. Oki, Risdiana, S. Yairi, Y. Koike, and I. Watanabe, Phys. Rev. B 78, 134515 (2008).
- Ramadhan et al. [2020] M. R. Ramadhan, I. Ramli, D. P. Sari, B. Kurniawan, A. Manaf, M. I. Mohamed-Ibrahim, S. Sulaiman, and I. Watanabe, Key Engineering Materials 860, 154 (2020).
- Andrade et al. [2018] A. Andrade, T. Krikun, K. Schalm, and J. Zaanen, Nature Physics 14, 1049 (2018).
- Tokura et al. [1990] Y. Tokura, S. Koshihara, T. Arima, H. Takagi, S. Ishibashi, T. Ido, and S. Uchida, Phys. Rev. B 41, 11657 (1990).
- Uchida et al. [1991] S. Uchida, T. Ido, H. Takagi, T. Arima, Y. Tokura, and S. Tajima, Phys. Rev. B 43, 7942 (1991).
- Ono et al. [2007] S. Ono, S. Komiya, and Y. Ando, Phys. Rev. B 75, 024515 (2007).