VLT, GROND AND DANISH TELESCOPE OBSERVATIONS OF TRANSITS IN THE TRAPPIST-1 SYSTEM
By John Southworth1, L. Mancini,2,3,4 M. Dominik,5 U. G. Jørgensen6,
V. Bozza7,8, M. J. Burgdorf 9, R. Figuera Jaimes10, L. K. Haikala11,
Th. Henning3, T. C. Hinse12,13, M. Hundertmark14, P. Longa-Peña15,
M. Rabus16, S. Rahvar17, S. Sajadian18, J. Skottfelt19 and C. Snodgrass20
Astrophysics Group, Keele University, Staffordshire, UK
University of Rome “Tor Vergata”, Rome, Italy
Max Planck Institute for Astronomy, Heidelberg, Germany
INAF –- Turin Astrophysical Observatory, Pino Torinese, Italy
University of St Andrews, St Andrews, UK
Centre for ExoLife Sciences, Niels Bohr Institute, Copenhagen, Denmark
Università di Salerno, Fisciano, Italy
Istituto Nazionale di Fisica Nucleare, Sezione di Napoli, Napoli, Italy
Universität Hamburg, Hamburg, Germany
Universidad San Sebastian, Valdivia, Chile
Universidad de Atacama, Copiapo, Chile
Nicolaus Copernicus University, Toruń, Poland
Chungnam National University, Daejeon, South Korea
Zentrum für Astronomie der Universität Heidelberg, Germany
Centro de Astronomía, Universidad de Antofagasta, Chile
Universidad Católica de la Santísima Concepción, Concepción, Chile
Department of Physics, Sharif University of Technology, Tehran, Iran
Department of Physics, Isfahan University of Technology, Isfahan, Iran
The Open University, Milton Keynes, UK
University of Edinburgh, Royal Observatory, Edinburgh, UK
TRAPPIST-1 is an ultra-cool dwarf that hosts seven known transiting planets. We present photometry of the system obtained using three telescopes at ESO La Silla (the Danish 1.54 m telescope and the 2.2 m MPI telescope) and Paranal (Unit Telescope 1 of the Very Large Telescope). We obtained 18 light curves from the Danish telescope, eight from the 2.2 m and four from the VLT. From these we measure 25 times of mid-transit for four of the planets (b, c, f, g). These light curves and times of mid-transit will be useful in determining the masses and radii of the planets, which show variations in their transit times due to gravitational interactions.
Introduction
TRAPPIST-1 is an ultra-cool dwarf of mass M⊙, radius R⊙, and effective temperature K Vangrootel+18apj. Two transiting planets were found in this system by Gillon et al. Gillon+16nat, based on photometry from the 0.6-m TRAPPIST telescope Jehin+11msngr. A further five transiting planets were found by Gillon et al. Gillon+17nat and Luger et al. Luger+17natas from observations with the Spitzer and K2 satellites augmented by ground-based data.
Based on analysis of transit light curves, the radii of the planets have been found to range from 0.76 R⊕ to 1.13 R⊕ and their orbital periods from 1.5 d to 18.8 d Delrez+18mn; Grimm+18aa; Agol+21psj. All seven planets are in orbital resonances with each other Grimm+18aa; Agol+21psj; Teyssandier++22aa, causing dynamical interactions between the planets which depend on their masses and orbital characteristics. This has allowed measurement of their masses, which range from 0.33 M⊕ to 1.37 M⊕ Grimm+18aa; Agol+21psj, from analysis of transit timing variations (e.g. Refs. HolmanMurray05sci; Agol+05mn).
TRAPPIST-1 remains the lowest-mass stellar object known to host a transiting planet** * Based on data obtained from the Transiting Extrasolar Planet Catalogue (TEPCat Me11mn at https://www.astro.keele.ac.uk/jkt/tepcat/) on 2022/05/11., so the system is an important one for further study. Aside from mass and radius measurements, it is an important tracer of tidal effects HayMatsuyama19apj; Brasser++19mn; Bolmont+20aa, the formation and interior structure of rocky planets Coleman+19aa; Turbet+20aa; Burn+21aa; Raymond+22natas, and the characterisation of atmospheres via transmission spectroscopy Ducrot+18aj; Burdanov+19mn; Krishnamurthy+21aj; Gressier+22aa. TRAPPIST-1 is a high-priority target for observations with the James Webb Space Telescope BarstowIrwin16mn; Morley+17apj; Bean+18pasp; Krissansen+18aj; Lustig+19aj.
The faintness of the TRAPPIST-1 system (, ) and the low planet masses means that it is difficult to measure the masses of the planets using high-precision spectroscopic radial velocities. Therefore measurements of the times of mid-transit for these planets are crucial for improving measurements of their masses, and thus densities and surface gravities. In this work we present extensive photometry of transits of TRAPPIST-1 obtained in the 2017 and 2018 observing seasons using three telescopes.
Observations with the Danish telescope
A total of 18 light curves of TRAPPIST-1 were obtained in 2017 June–August using the 1.54 m Danish Telescope at ESO La Silla, Chile, equipped with the DFOSC imager. The data were obtained whilst the telescope was being operated by the MiNDSTEp Consortium Dominik+10an in the context of the transit project running as a side project in this consortium Me+09mn; Me+09mn2. A Cousins filter was used for all observations of TRAPPIST-1, which is an extremely red star. A total of 13 transits were detected, with others lost to poor weather or the shifting of the transit outside the observing interval due to dynamical effects.
Data reduction was performed using the defot pipeline Me+09mn; Me+14mn, which uses an IDL implementation of the daophot aperture photometry routine Stetson87pasp. The observations were taken in focus and were debiassed and flat-fielded. Differential photometry versus multiple comparison stars was obtained by optimising the weights of the comparison stars simultaneously with a low-order polynomial to minimise the scatter around zero differential magnitude outside transit.
An observing log is given in Table I. The light curves are shown in Fig. 1. The timestamps have been placed on the BJD(TDB) timescale using routines from Eastman et al. Eastman++10pasp. The times written into the FITS files were manually checked during the observation of the majority of the transits to confirm their reliability.
| Telescope | Planet(s) | Date of | Start | End | Filter | Airmass | Moon | Aperture | Scatter | ||||
| first obs | (UT) | (UT) | (s) | (s) | illum. | radii (px) | (mmag) | ||||||
| Danish | c | 2017/06/10 | 08:13 | 10:30 | 74 | 100 | 12 | 1.32 1.10 | 0.876 | 9 14 30 | 1 | 2.9 | |
| Danish | b | 2017/06/13 | 06:31 | 08:24 | 63 | 100 | 8 | 1.96 1.25 | 0.992 | 8 12 30 | 1 | 2.9 | |
| Danish | b | 2017/06/19 | 07:02 | 09:15 | 72 | 100 | 11 | 1.50 1.12 | 0.301 | 8 13 30 | 1 | 1.9 | |
| Danish | e ∗ | 2017/06/30 | 08:00 | 10:09 | 67 | 100 | 16 | 1.15 1.10 1.13 | 0.432 | 9 13 30 | 2.8 | ||
| Danish | f | 2017/07/22 | 05:21 | 08:58 | 116 | 100 | 11 | 1.50 1.12 | 0.019 | 7 12 25 | 1 | 2.1 | |
| Danish | c | 2017/07/26 | 08:25 | 10:28 | 67 | 100 | 12 | 1.13 1.51 | 0.117 | 8 12 25 | 1 | 1.8 | |
| Danish | g | 2017/07/27 | 06:27 | 10.01 | 98 | 100 | 13 | 1.13 1.10 1.44 | 0.187 | 6 12 25 | 1 | 2.6 | |
| Danish | h ∗ | 2017/07/28 | 04:50 | 08:52 | 92 | 200–100 | 12 | 1.38 1.10 1.22 | 0.272 | 7 13 25 | 3.7 | ||
| Danish | c, d ∗ | 2017/07/31 | 04:25 | 07:32 | 88 | 200–100 | 6 | 1.44 1.10 | 0.561 | 4 8 20 | 6.0 | ||
| Danish | c, b | 2017/08/17 | 03:51 | 08:27 | 103 | 100 | 25 | 1.49 1.10 1.17 | 0.258 | 8 12 25 | 1 | 2.2 | |
| Danish | e ∗ | 2017/08/18 | 02:36 | 04:50 | 69 | 100 | 25 | 1.72 1.14 | 0.170 | 6 10 20 | 3.1 | ||
| Danish | b | 2017/08/20 | 05:32 | 07:25 | 68 | 100 | 8 | 1.10 1.21 | 0.030 | 9 13 25 | 1 | 2.6 | |
| Danish | b ∗ | 2017/08/23 | 06:34 | 09:12 | 86 | 100 | 11 | 1.13 1.77 | 0.030 | 6 11 25 | 8.2 | ||
| Danish | e ∗ | 2017/08/24 | 04:55 | 07:14 | 84 | 100 | 16 | 1.11 1.10 1.25 | 0.075 | 5 8 20 | 40.1 | ||
| Danish | b | 2017/08/26 | 05:59 | 09:05 | 98 | 100 | 13 | 1.11 1.80 | 0.224 | 9 13 25 | 1 | 2.4 | |
| Danish | c | 2017/09/15 | 05:19 | 07:27 | 66 | 100 | 13 | 1.15 1.64 | 0.279 | 9 13 25 | 2 | 2.4 | |
| Danish | b | 2017/09/20 | 23:29 | 01:17 | 51 | 100 | 11 | 2.42 1.37 | 0.008 | 8 13 25 | 1 | 2.5 | |
| Danish | b | 2017/09/23 | 23:58 | 01:44 | 57 | 100 | 13 | 1.83 1.23 | 0.149 | 8 12 25 | 1 | 1.9 |
∗ transit not detected due to observing conditions or dynamical effects.

Observations with the MPI 2.2 m telescope
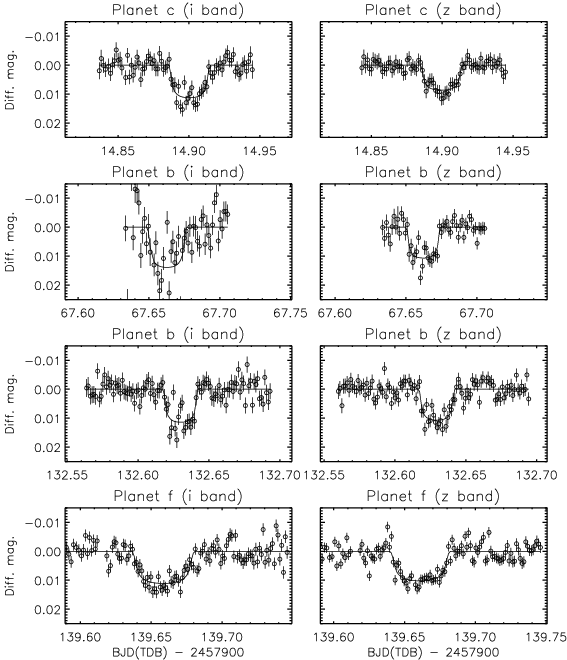
TRAPPIST-1 was observed on four night using the MPI 2.2 m telescope at ESO La Silla. The GROND imager Greiner+08pasp was used to obtain observations simultaneously in seven passbands, approximating the Gunn , , and and near-infrared , and filters. The and bands suffer from a high scatter due to the faintness of the target. Conversely, the , and bands do not yield good light curves because the target is much brighter than the available comparison stars. We therefore present light curves from only the and bands here.
We encountered a problem with the presence of transient bad pixels in the and bands caused by a bug in the CCD controller software. These bad pixels comprise approximately 0.5% of the pixels in an image and cause the pixel count rate to be either the bias level or unusually high. Left uncorrected, the bad pixels significantly increase the scatter in the light curves. Fortunately, the bad pixels occurred randomly in each image. We were therefore able to find them by comparing each pixel value in two successive images to detect those that differed by more than a manually-chosen threshold. The count rates in the affected pixels were then replaced by the means of the count rates in the surrounding eight pixels.
Aside from the bad-pixel correction, the data were reduced using the defot pipeline as described above. The observing log is given in Table II and the data are plotted in Fig. 2.
| Telescope | Planet(s) | Date of | Start | End | Filter | Airmass | Moon | Aperture | Scatter | ||||
| first obs | (UT) | (UT) | (s) | (s) | illum. | radii (px) | (mmag) | ||||||
| GROND | c | 2017/06/10 | 07:49 | 10:37 | 80 | 90 | 25 | 1.40 1.10 | 0.876 | 15 22 40 | 2 | 2.4 | |
| GROND | c | 2017/06/10 | 07:49 | 10:37 | 77 | 90 | 25 | 1.40 1.10 | 0.876 | 20 28 50 | 2 | 1.6 | |
| GROND | b | 2017/08/02 | 03:01 | 04:49 | 54 | 90 | 25 | 2.17 1.31 | 0.747 | 27 35 60 | 2 | 8.6 | |
| GROND | b | 2017/08/02 | 03:01 | 04:49 | 55 | 90 | 25 | 2.17 1.31 | 0.747 | 34 40 70 | 2 | 2.7 | |
| GROND | b | 2017/10/06 | 01:17 | 04:30 | 105 | 60–80 | 27 | 1.19 1.10 1.21 | 0.997 | 14 23 50 | 2 | 3.1 | |
| GROND | b | 2017/10/06 | 01:17 | 04:30 | 108 | 60–80 | 27 | 1.19 1.10 1.21 | 0.997 | 18 28 60 | 1 | 2.6 | |
| GROND | f | 2017/10/13 | 01:41 | 05:45 | 119 | 80 | 31 | 1.11 1.10 1.70 | 0.429 | 16 25 50 | 2 | 3.1 | |
| GROND | f | 2017/10/13 | 01:41 | 05:45 | 118 | 80 | 31 | 1.11 1.10 1.70 | 0.429 | 20 30 55 | 2 | 2.7 | |
| VLT | c | 2017/11/05 | 02:23 | 04:29 | 192 | 12–8 | 26 | 1.18 1.77 | 0.980 | 10 15 35 | 1 | 3.1 | |
| VLT | c | 2018/09/06 | 05:45 | 07:52 | 230 | 10–6 | 26 | 1.13 1.55 | 0.167 | 11 20 40 | 1 | 2.4 | |
| VLT | c | 2018/09/11 | 02:13 | 04:17 | 815 / 13 | 145 | 25 | 26 | 1.31 1.09 | 0.028 | 12 20 40 | 1 | 2.3 |
| VLT | b | 2018/11/14 | 23:56 | 01:54 | 195 | 25–6 | 25 | 1.10 1.21 | 0.447 | 10 30 40 | 1 | 2.8 |
Observations with the VLT
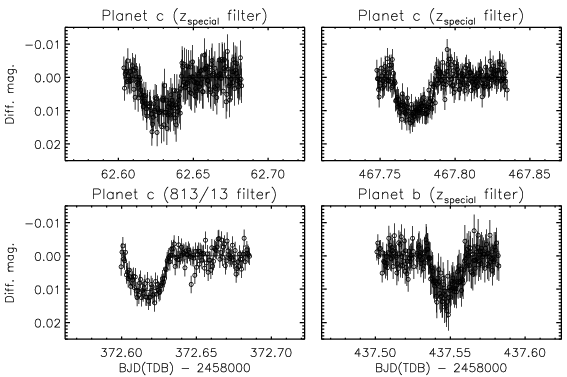
One transit of TRAPPIST-1 b and three more of TRAPPIST-1 c were observed using the Very Large Telescope (VLT) Unit Telescope 1 (UT1) equipped with the FORS2 imager Appenzeller+98msngr. The data were obtained through either a filter with a central wavelength of 916 nm and a full-width at half maximum of 18 nm, or a night-sky suppression filter with a central wavelength of 813 nm and a full-width at half maximum of 13 nm. These observations were obtained in order to search for a variation in radius with wavelength indicative of the presence of a planetary atmosphere, as tentatively found for GJ 1132 Me+17aj, but this test could not be performed due to the scatter of the observations plus complications with the scheduling of these time-critical observations in service mode.
The data were reduced using the defot pipeline as described above. The observing log is given in Table II and the data are plotted in Fig. 3. These data have a relatively large scatter because all comparison stars had significantly lower count rates than the target star.
Transit timing measurements
Each light curve was modelled individually using version 38 of the jktebop†† † http://www.astro.keele.ac.uk/jkt/codes/jktebop.html code Me++04mn2; Me13aa. We fitted for the sum of the fractional radii ( where , , is the radius of the star, is the radius of the planet in question, and is the semimajor axis of the relative orbit), their ratio () and the time of transit mid-point. We fixed the orbital periods and inclinations to the values measured by Gillon et al. Gillon+17nat. Limb darkening was accounted for using the quadratic law with coefficients fixed at and .
The light curve from the Danish telescope on the night of 2017/08/17 contains two transits, the first by planet c and the second by planet b. These were modelled separately after removing the data for the other transit from the light curve before fitting.
Four of our transit observations were obtained simultaneously in the and passbands using GROND. This provides an opportunity to check if the two light curves from each night yield timings in mutual agreement. We calculated the level of agreement to be 1.5 for the night of 2017/06/10, 0.3 for 2017/08/02, 0.8 for 2017/10/06 and 2.9 for 2017/10/13. This agreement is acceptable but suggests that the errorbars of our timing measurements may be slightly too small.
The resulting transit times are given in Table III. The reduced light curves will be made available at the Centre de Données astronomiques de Strasbourg‡‡ ‡ http://cdsweb.u-strasbg.fr/. Because all planets in the TRAPPIST-1 system show complex transit timing variations caused by gravitational interactions, and because good ephemerides are available from elsewhere (Refs. Gillon+17nat; Delrez+18mn; Agol+21psj), we have not performed any analysis on the transit timings in the current work. They are instead presented here so they may be used in future studies of this system.
| Telescope | Filter | Planet | Time of mid-transit (BJD/TDB) |
|---|---|---|---|
| GROND | c | 2457914.90035 0.00039 | |
| GROND | c | 2457914.89956 0.00034 | |
| Danish | c | 2457914.90084 0.00047 | |
| Danish | b | 2457917.80266 0.00049 | |
| Danish | b | 2457923.84702 0.00042 | |
| Danish | f | 2457956.80753 0.00054 | |
| Danish | c | 2457960.91366 0.00036 | |
| Danish | g | 2457961.82616 0.00067 | |
| GROND | b | 2457967.66265 0.00098 | |
| GROND | b | 2457967.66231 0.00042 | |
| Danish | c | 2457982.70928 0.00051 | |
| Danish | b | 2457982.77099 0.00039 | |
| Danish | b | 2457985.79287 0.00042 | |
| Danish | b | 2457991.83630 0.00032 | |
| Danish | c | 2458011.77209 0.00046 | |
| Danish | b | 2458017.52100 0.00039 | |
| Danish | b | 2458020.54178 0.00030 | |
| GROND | b | 2458032.63003 0.00044 | |
| GROND | b | 2458032.62955 0.00038 | |
| GROND | f | 2458039.65854 0.00064 | |
| GROND | f | 2458039.66100 0.00057 | |
| VLT | c | 2458062.62830 0.00031 | |
| VLT | c | 2458367.77302 0.00023 | |
| VLT | 815 / 13 | c | 2458372.61662 0.00027 |
| VLT | b | 2458437.54799 0.00028 |
Acknowledgements
This paper was based on data collected by MiNDSTEp with the Danish 1.54 m telescope at the ESO La Silla Observatory. This paper was also based on observations collected using the Gamma Ray Burst Optical and Near-Infrared Detector (GROND) instrument at the MPG 2.2 m telescope located at ESO La Silla, Chile, under programs 099.A-9030(A) and 0100.A-9004(A). GROND was built by the high-energy group of MPE in collaboration with the LSW Tautenburg and ESO, and is operated as a PI-instrument at the MPG 2.2 m telescope. This paper was also based on observations collected at the European Southern Observatory under ESO programme 0100.C-0716(C). The following resources were used in the course of this work: the NASA Astrophysics Data System; the SIMBAD database operated at CDS, Strasbourg, France; and the ariv scientific paper preprint service operated by Cornell University. We thank Eric Agol for checking our planet identifications and alerting us to one incorrect one.
UGJ acknowledges funding from the Novo Nordisk Foundation Interdisciplinary Synergy Programme grant no. NNF19OC0057374 and from the European Union H2020-MSCA-ITN-2019 under Grant no. 860470 (CHAMELEON).
NP’s work was supported by Fundação para a Ciência e a Tecnologia (FCT) through the research grants UIDB/04434/2020 and UIDP/04434/2020.
PLP was partly funded by Programa de Iniciación en Investigación-Universidad de Antofagasta, INI-17-03.
References
- 1 V. Van Grootel et al., ApJ, 853, 30, 2018.
- 2 M. Gillon et al., Nature, 533, 221, 2016.
- 3 E. Jehin et al., The Messenger, 145, 2, 2011.
- 4 M. Gillon et al., Nature, 542, 456, 2017.
- 5 R. Luger et al., Nature Astronomy, 1, 0129, 2017.
- 6 L. Delrez et al., MNRAS, 475, 3577, 2018.
- 7 S. L. Grimm et al., A&A, 613, A68, 2018.
- 8 E. Agol et al., Planetary Sciences Journal, 2, 1, 2021.
- 9 J. Teyssandier, A. S. Libert & E. Agol, A&A, 658, A170, 2022.
- 10 M. J. Holman & N. W. Murray, Science, 307, 1288, 2005.
- 11 E. Agol et al., MNRAS, 359, 567, 2005.
- 12 J. Southworth, MNRAS, 417, 2166, 2011.
- 13 H. C. F. C. Hay & I. Matsuyama, ApJ, 875, 22, 2019.
- 14 R. Brasser, A. C. Barr & V. Dobos, MNRAS, 487, 34, 2019.
- 15 E. Bolmont et al., A&A, 644, A165, 2020.
- 16 G. A. L. Coleman et al., A&A, 631, A7, 2019.
- 17 M. Turbet et al., A&A, 638, A41, 2020.
- 18 R. Burn et al., A&A, 656, A72, 2021.
- 19 S. N. Raymond et al., Nature Astronomy, 6, 80, 2022.
- 20 E. Ducrot et al., AJ, 156, 218, 2018.
- 21 A. Y. Burdanov et al., MNRAS, 487, 1634, 2019.
- 22 V. Krishnamurthy et al., AJ, 162, 82, 2021.
- 23 A. Gressier et al., A&A, 658, A133, 2022.
- 24 J. K. Barstow & P. G. J. Irwin, MNRAS, 461, L92, 2016.
- 25 C. V. Morley et al., ApJ, 850, 121, 2017.
- 26 J. L. Bean et al., PASP, 130, 114402, 2018.
- 27 J. Krissansen-Totton et al., AJ, 156, 114, 2018.
- 28 J. Lustig-Yaeger, V. S. Meadows & A. P. Lincowski, AJ, 158, 27, 2019.
- 29 M. Dominik et al., AN, 331, 671, 2010.
- 30 J. Southworth et al., MNRAS, 396, 1023, 2009.
- 31 J. Southworth et al., MNRAS, 399, 287, 2009.
- 32 J. Southworth et al., MNRAS, 444, 776, 2014.
- 33 P. B. Stetson, PASP, 99, 191, 1987.
- 34 J. Eastman, R. Siverd & B. S. Gaudi, PASP, 122, 935, 2010.
- 35 J. Greiner et al., PASP, 120, 405, 2008.
- 36 I. Appenzeller et al., The Messenger, 94, 1, 1998.
- 37 J. Southworth et al., AJ, 153, 191, 2017.
- 38 J. Southworth, P. F. L. Maxted & B. Smalley, MNRAS, 351, 1277, 2004.
- 39 J. Southworth, A&A, 557, A119, 2013.