Stability versus Meta-stability in a Skin Microbiome Model
Abstract
The skin microbiome plays an important role in the maintenance of a healthy skin. It is an ecosystem, composed of several species, competing for resources and interacting with the skin cells. Imbalance in the cutaneous microbiome, also called dysbiosis, has been correlated with several skin conditions, including acne and atopic dermatitis. Generally, dysbiosis is linked to colonization of the skin by a population of opportunistic pathogenic bacteria (for example C. acnes in acne or S. aureus in atopic dermatitis). Treatments consisting in non-specific elimination of cutaneous microflora have shown conflicting results. It is therefore necessary to understand the factors influencing shifts of the skin microbiome composition. In this work, we introduce a mathematical model based on ordinary differential equations, with 2 types of bacteria populations (skin commensals and opportunistic pathogens) to study the mechanisms driving the dominance of one population over the other. By using published experimental data, assumed to correspond to the observation of stable states in our model, we derive constraints that allow us to reduce the number of parameters of the model from 13 to 5. Interestingly, a meta-stable state settled at around 2 days following the introduction of bacteria in the model, is followed by a reversed stable state after 300 hours. On the time scale of the experiments, we show that certain changes of the environment, like the elevation of skin surface pH, create favorable conditions for the emergence and colonization of the skin by the opportunistic pathogen population. Such predictions help identifying potential therapeutic targets for the treatment of skin conditions involving dysbiosis of the microbiome, and question the importance of meta-stable states in mathematical models of biological processes.
Keywords:
skin microbiome atopic dermatitis ODE model steady-state reasoning parameter relations quasi-stability meta-stability.1 Introduction
Located at the interface between the organism and the surrounding environment, the skin constitutes the first line of defense against external threats, including irritants and pathogens. In order to control potential colonization of the skin surface by pathogens, the epidermal cells, called keratinocytes, produce antimicrobial peptides (AMPs) [26]. The physiologically acidic skin surface pH also contributes to control the growth of bacterial populations [27, 17]. Another contributor to the defense against pathogen colonization are commensal bacteria in the community of microorganisms living on the skin, commonly referred to as the skin microbiome. Over the past decade, several studies have highlighted the key role played by such commensal bacterial species defending against invading pathogens, as well as their contribution to the regulation of the immune system [19, 5, 18, 15, 1, 2].
Alterations in the composition of the skin microbiome resulting in a dominance by a pathogenic species, also called dysbiosis, have been associated with skin conditions such as acne or atopic dermatitis (AD) [20, 16]. In the case of AD, the patient skin is often colonized by Staphylococcus aureus (S. aureus), especially on the lesions [16]. Treatment strategies targeting non-specific elimination of cutaneous microflora, such as bleach baths, have shown conflicting results regarding their capacity to reduce the disease severity [4]. On the other hand, treatments involving introduction of commensal species, like Staphylococcus hominis [24] on the skin surface appear promising. Accordingly, the interactions between the commensal populations, pathogens and skin cells seem at the heart of maintaining microbiome balance. There is therefore a necessity to investigate further those interactions and the drivers of dominance of one population over others. Unfortunately, it is challenging to perform in vitro experiments involving more than one or two different species, even more so on skin explants or skin equivalents.
Mathematical models of population dynamics have been developed and used for more that 200 years [21]. Here, we introduce a model based on ordinary differential equations (ODEs), describing the interactions of a population of commensal species with one of opportunistic pathogens and the skin cells. We study the factors influencing the dominance of one population over the other on a microbiologically relevant timescale of a couple of days corresponding to biological experimental data. More specifically, we identify constraining relationships on the parameter values, based on published experimental data [23, 14], corresponding to special cases of our model, allowing us to reduce the parametric dimension of our model from 13 to 5 parameters. Interestingly, we observe in the reduced model a phenomenon of meta-stability [30, 28], also called quasi-stability, in which the seemingly stable state reached after 30 hours following the initiation of the experiment, is followed after 300 hours by a reversed stable state. On the time scale of the experiments, we show that certain changes in the environment, like an elevation of skin surface pH, create favorable conditions for the emergence and colonization of the skin by the opportunistic pathogen population. Such predictions can help identify potential therapeutic strategies for the treatment of skin conditions involving microbiome dysbiosis, and underscore the importance of meta-stable states in the real biological processes at their different time scales.
2 Initial ODE model with 13 parameters
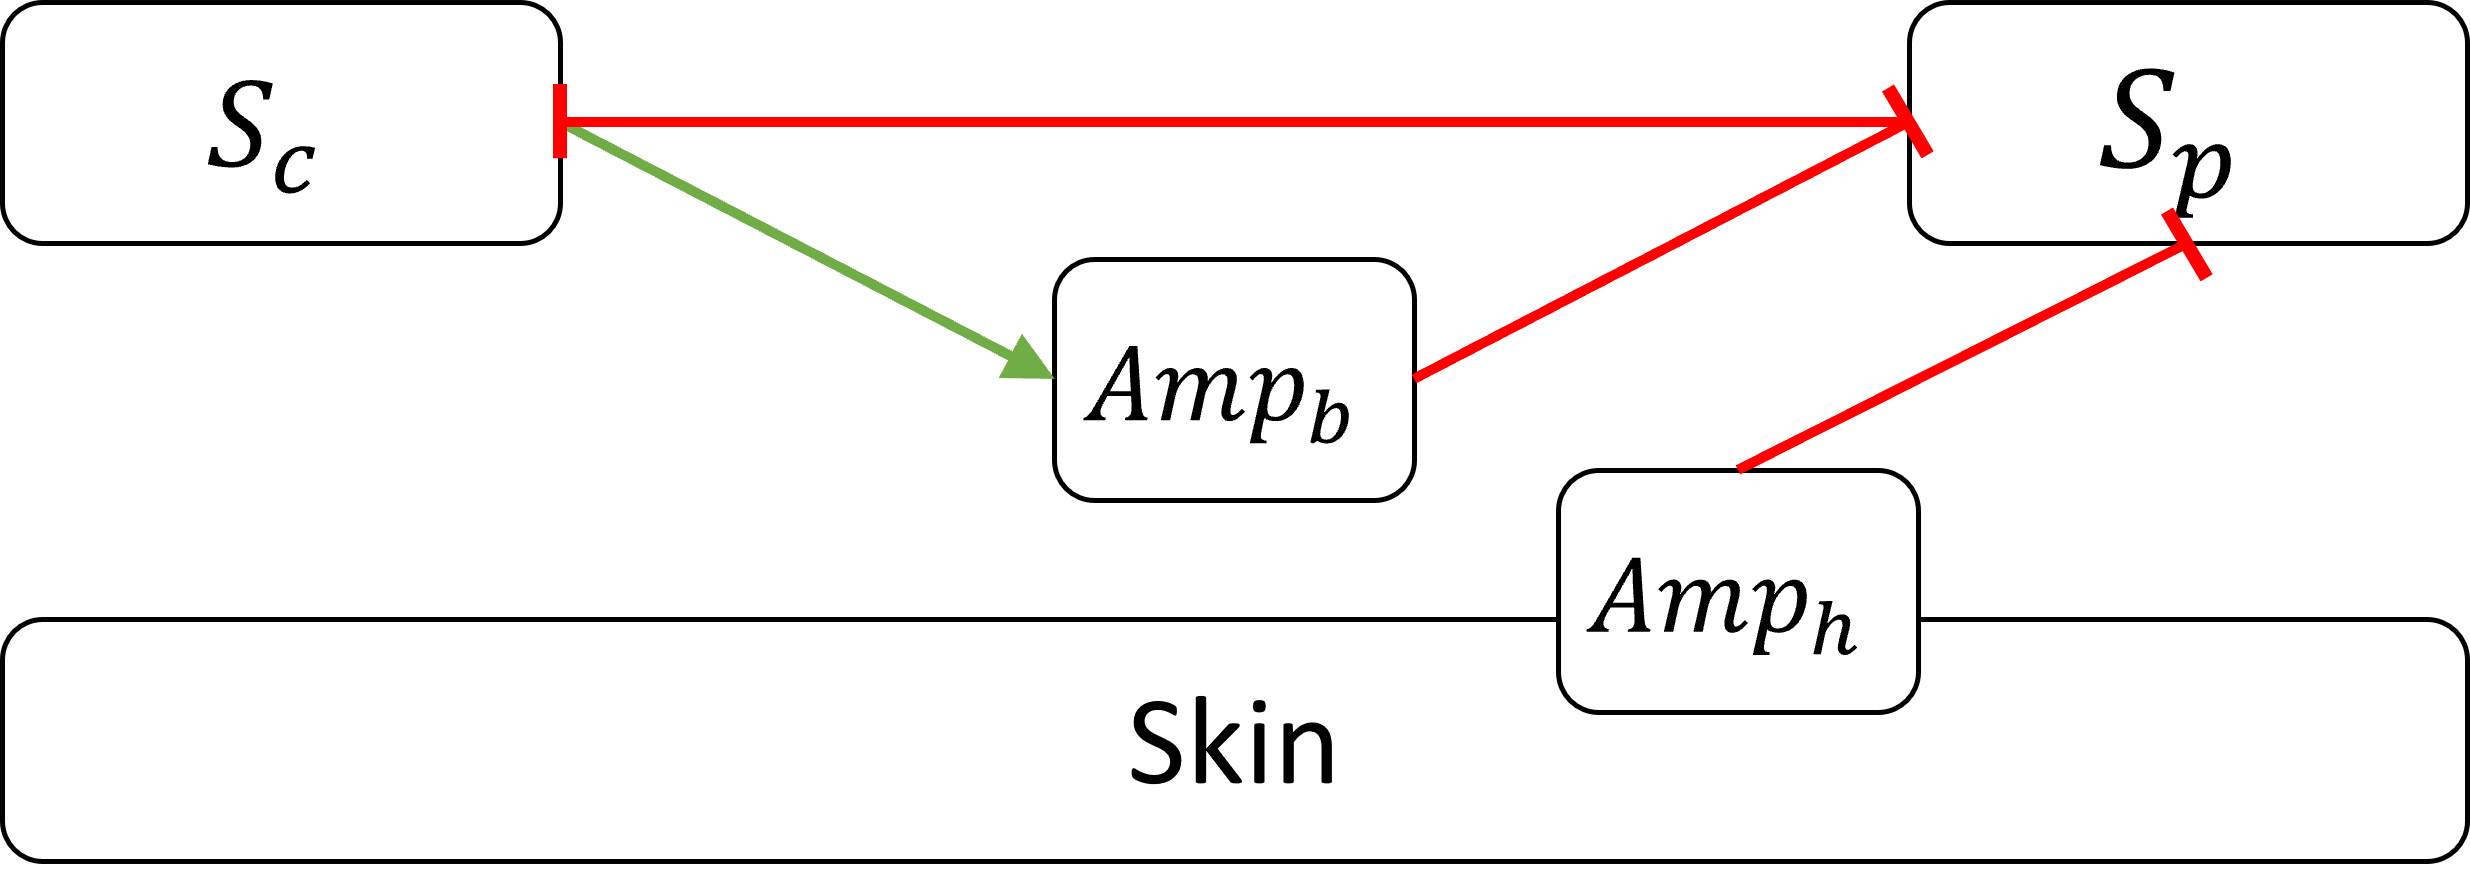
The model built in this paper considers two types of bacterial populations. The first population, , regroups commensal bacteria species having an overall beneficial effect for the skin, and the second population, , represents opportunistic pathogens. The differential equations for both bacterial populations are based on the common logistic growth model [32], considering non-explicitly the limitations in food and space. The limited resources are included in the parameters and , representing the optimum concentration of the populations in a given environment, considering the available resources.
The bactericidal effect of antimicrobial peptides (AMPs) produced by skin cells, , on is included with a Hill function. This type of highly non-linear functions have been used previously to model the effect of antibiotics on bacterial populations [22]. For the sake of simplicity, the AMPs produced by skin cells is introduced as a constant parameter, , in the model. It represents the average concentration of these AMPs among surface cells, under given human genetic background and environmental conditions.
Several studies revealed that commensal bacterial populations, like S. epidermidis or S. hominis, are also able to produce AMPs targeted against opportunistic pathogens, such as S. aureus [6, 23]. For these reasons, we introduce in the model AMPs of bacterial origin, , acting similarly to on the pathogenic population . is produced at rate by , and degraded at rate . Furthermore, we include a defense mechanism of against with a direct killing effect.
Altogether, this gives us the following ODE system with 3 variables and 13 parameters, all taking non-negative values:
| Variable | Interpretation (unit) |
|---|---|
| Surface apparent concentration of () | |
| Surface apparent concentration of () | |
| Concentration of () | |
| Parameter | Interpretation (unit) |
| Growth rate of () | |
| Growth rate of , () | |
| Optimum concentration of () | |
| Optimum concentration of () | |
| Maximal killing rate of by () | |
| Concentration of inducing half the maximum killing rate () | |
| Maximal killing rate of by , () | |
| Concentration of inducing half the maximum killing rate () | |
| Maximal killing rate of by , () | |
| Concentration of inducing half the maximum killing rate () | |
| Concentration of AMPs produced by the skin cells () | |
| Production rate of by () | |
| Degradation rate of () |
The model is illustrated on Fig. 1 and Table 1 recapitulates the variables and the parameters with their unit.
Such a model cannot be solved analytically. Furthermore, the use of optimization algorithms to infer the 13 parameter values from data resulted in many valid sets of parameter values. Therefore, it is clearly necessary to restrict the number of parameters by identifying some of them, to be able to analyze the model.
3 Using published experimental data to define relations between model parameters by steady-state reasoning
The amount of quantitative experimental data available for the model calibration is very limited due to the difficulty of carrying out experiments involving co-cultures of different bacterial species. Most of the published work focuses on single species or on measuring the relative abundances of species living on the skin, which is highly variable between individuals and skin sites [10]. In the case of AD specifically, S. aureus is considered pathogenic and S. epidermidis commensal. Published data exist however for those species which we can use to constrain the parameter values of the model.
Two series of in vitro experiments are considered [23, 14]. While in vitro cultures, even on epidermal equivalent, do not entirely capture the native growth of bacteria on human skin, they provide useful quantitative data that would be very difficult to measure in vivo.
In the first experiment [14], mono-cultures and co-cultures of S. epidermidis and S. aureus were allowed to develop on a 3D epidermal equivalent. Table 2 recapitulates the population sizes of the two species measured after 48 hours of incubation. Kohda et al. also performed another co-culture experiment where S.epidermidis was inoculated 4 hours prior to S.aureus in the media. This data is not used here as it requires additional manipulation to match the situation represented by the model. However, it would be interesting to use it in the future for model validation.
In the second experiment [23] the impact of human (LL-37) and bacterial (Sh-lantibiotics) AMPs on S. aureus survival was studied. The experiments were performed in vitro, and the S. aureus population size was measured after 24 hours of incubation. Table 3 summarizes their observations.
| S. epidermidis (CFU/well) | S. aureus (CFU/well) | |
|---|---|---|
| Mono-cultures | ||
| Co-cultures |
| Sh-lantibiotics () | LL-37 () | S. aureus (CFU/mL) |
|---|---|---|
| 0 | 4 | |
| 0 | 8 | |
| 0.32 | 0 | |
| 0.64 | 0 |
3.1 Parameter values inferred from mono-culture experiment data
We consider first the monocultures experiments from Kohda et al. [14], representing the simplest experimental conditions. S. epidermis is a representative of the commensal population , and S. aureus of the pathogenic one, . Since the two species are not interacting, the set of equations simplifies to:
At steady-state, the population concentrations are either zero, or equal to their optimum capacities ( or ) when the initial population concentration is non-zero. Given the rapid growth of bacterial population, the experimental measurements done after 48 hours of incubation can be considered as corresponding to a steady-state, which gives:
| (1) |
| (2) |
3.2 Parameter relations inferred from experimental data on AMP
The experimental conditions of Nakatsuji et al. [23] correspond to the special case where there is no commensal bacteria alive in the environment, only the bacterial AMPs, in addition to those produced by the skin cells. Our system of equations then reduces to:
| (3) |
The concentrations in LL-37 and Sh-lantibiotics, translated in our model into and respectively, are part of the experimental settings. Therefore, we consider them as constants over time. At steady state, we get:
| (4) |
Let us first focus on the special case where no Sh-lantibiotics were introduced in the media, translating into in our model. We consider again that the biological observations after 24 hours of incubation correspond to steady-state and substitute the experimental values measured
; CFU, and ; CFU,
together with the values of and (from (1) and (2)) in (4), to obtain the following equations:
which reduce to and .
Following the same method with the experimental conditions without any LL-37 (i.e. ) and using two data points
( ; CFU) and ( ; CFU),
we get and .
It is notable that the maximum killing rates of by and are both proportional to growth rate. Interestingly, such proportional relation has been observed experimentally between the killing rate of Escherichia coli by an antibiotic and the bacterial growth rate [31].
To be consistent with the ranges of Sh-lantibiotics concentrations described in Nakatsuji et al. [23], should take positive values below 10. Given that at steady-state, and that CFU is the upper bound for , we obtain the following constraint:
| (5) |
3.3 Parameter relations inferred from co-culture data
The initial model described earlier is representative of the experimental settings of the co-culture conditions described in Kohda et al. [14]. At steady-state, the system (2) gives:
| (6) |
| (7) |
| (8) |
Considering that what is observed experimentally after 48 hours of incubation is at steady-state, one can replace and with the experimental data point (S. epidermidis CFU; S. aureus CFU) in (6) and (7) to get the following parameter relation:
| (9) |
| (10) |
By integrating the values found for and , and the relations involving and into (10), we end up with:
| (11) |
4 Reduced model with 5 parameters
Using the previously mentioned experimental data, and assuming they represent steady state conditions of the initial model (2), we have reduced the parametric dimension of the model from 13 to 5. Specifically, out of the original 13 parameters, we could define the values of 4 of them, and derive 4 functional dependencies from the values of the remaining parameters, as summarized in Table 4).
| Parameter | Value or relation to other parameters |
|---|---|
| 8 | |
| 0.16 | |
| with |
In our skin microbiome model (2), the parameters that remain unknown are thus:
- •
- •
, the growth rate of , taking similar values in the interval between 0 and 2 ;
- •
- •
, the production rate of chosen to take values between and , and shown to have a limited impact on the steady-state values in section 4.2;
- •
, the concentration in of AMPs produced by skin cells between 0 and 4 (equation (11)).
4.1 Simulations at the time scale of the experiments
In order to reproduce what was observed by Kohda et. al [14], that is a dominant pathogenic population after 50 hours which can thus be considered as dysbiosis in our skin microbiome model, it is sufficient to fix a relatively low concentration of Amp produced by the skin cells, i.e. , and some fixed values for the four other parameters chosen in their intervals described above. Among a continuum of possible solutions, we chose .
The doses of S. epidermidis and S. aureus applied at the surface of the 3D epidermal equivalent at the beginning of the experiment ( and respectively) are used as the initial concentrations for and respectively. Fig. 2 shows the result of a numerical simulation11 1 All computation results presented in this paper have been done using the BIOCHAM software with a notebook runnable online and available at https://lifeware.inria.fr/wiki/Main/Software#CMSB22b. of our model with those parameters which are in accordance to the co-culture experiments of Kohda et. al and reproduce a consistent qualitative behavior [14].

Our model can also be used to reproduce what is considered a balanced microbiome, corresponding to the commensal population being significantly more abundant than the pathogenic one. This requires modifying some parameter values to represent a less virulent pathogenic population, closer to the physiological context, given that the experiments from Kohda et. al [14] were performed using a virulent methicillin-resistant S. aureus strain.
We chose , and a higher production of AMPs by the skin cells, , to compensate for feedback loops or stimuli that might be missing in the 3D epidermal equivalent used. Fig. 3 shows a simulation trace obtained under those conditions which clearly indicates the dominance of the non-pathogenic population under those conditions.

4.2 Parameter sensitivity and robustness analyses
Since the previous simulations rely on some choices of values
for the unknown parameters, it is important to evaluate the robustness of the predictions of our model
by performing an analysis of sensitivity to the parameter values.
This is possible in Biocham by specifying the property of interest in quantitative temporal logic [29].
The interesting property here is the stabilization at the time scale of the experiments around 48 hours of the bacterial population sizes to the values given by simulation (Fig. 3),
Here we use the temporal logic formula:
and objective values equal to 1 for the free variables ,
to express that the normalized variables and , i.e. current values of and divided by their expected value at steady state, respectively and in the pathogenic case of Kohda et al. experiments, is reached (F, finally) at time around 40 and finally at the end of the time horizon (FG) of 50 hours.
On a given simulation trace, the free variables of the formula have a validity domain (here fixed values) which is used to define a continuous degree of satisfaction of the property as a distance to the objective values, and a robustness degree by sampling parameter values around their nominal values
[29].
The sensitivity analysis (Table 5) reveals that the dominance of the commensal population is highly sensitive to variations of the initial concentration of the pathogen. To a lesser extend, the dominant population is also sensitive to the growth rates ( and ) and the concentration of human AMPs (). On the other hand, and do not seem to affect the relative proportions of the bacterial populations.
| Parameter | Coefficient of variation | Robustness degree |
|---|---|---|
| 0.2 | 0.62 | |
| 0.2 | 0.57 | |
| 10 | 0.95 | |
| 1 | 0.95 | |
| 0.2 | 0.53 | |
| 10 | 0.23 | |
| 10 | 0.58 | |
| 0.2 | 0.48 | |
| 10 | 0.31 |
4.3 Meta-stability revealed by simulation on a long time scale
Interestingly, by extending the simulation time horizon to a longer time scale of 500 hours, one can observe a meta-stability phenomenon, shown in Fig. 4. The seemingly stable state observed in Fig. 3 at the relevant time scale of 50 hours of the experiments, is thus not a mathematical steady state, but a meta-stable state, also called quasi-stable state, that slowly evolves, with and , towards a true stable state of the model reached around 300 hours in which the population density are reversed.
The population almost reaches its optimum capacity after approximately 30 hours and stays relatively stable for around 100 hours more, that is over 4 days, which can reasonably be considered stable on the microbiological time scale. Meanwhile, the population is kept at a low concentration compared to , even though it is continuously increasing and eventually leading to its overtake of .
By varying the parameters values, it appears that this meta-stability phenomenon emerges above a threshold value of for 22 2 All computation results presented in this paper have been done using the BIOCHAM software with a notebook runnable online and available at https://lifeware.inria.fr/wiki/Main/Software#CMSB22b., that is for almost half of its possible values (see section 4).
That phenomenon of meta-stability, also called quasi-stability, is a classical notion of dynamical systems theory, particularly well-studied in the case of oscillatory systems for which analytical solutions exist, and as models of brain activity [30]. It is worth noting that it has also been considered in the computational systems biology community with respect to model reduction methods based on the identification of different regimes corresponding to different preponderant terms of the ODEs, for which simplified dynamics can be defined, and chained within a hybrid automaton [28].
More generally, this raises the question of the existence and importance of meta-stability in real biological processes, as well as the validity of the steady state assumptions made in mathematical modeling methods to fit the models to the observed experimental data.

5 Conditions favoring the pathogenic population
Whether the dysbiosis observed in AD is the cause or the result of the disease is unclear [12, 13]. Infants developing AD do not necessarily have more S. aureus present on their skin prior to the onset of the disease compared to the healthy group [11]. This suggests that atopic skin has some characteristics enabling the dominance of S. aureus over the other species of the microbiome. To test this hypothesis, we investigate two changes of the skin properties observed in AD patients (skin surface pH elevation [9] and reduced production of AMPs [25]) and their impact on the dominant species at steady-state. More specifically, we study the behavior of the system following the introduction of a pathogen and whether the pathogen will colonize the media depending on the initial concentrations of the bacterial populations and the particular skin properties mentioned before.
5.1 Skin surface pH elevation
According to Proksch [27], the physiological range for skin surface pH is 4.1-5.8. However, in certain skin conditions, like AD, an elevation of this pH has been observed. Dasgupta et al. studied in vitro the influence of pH on the growth rates of S. aureus and S. epidermidis[8]. Their experimental results show that, when the pH is increased from 5 to 6.5, the growth rate of S. epidermidis is multiplied by 1.8, whereas the one of S. aureus is multiplied by more than 4 (Table 6).
| pH | Growth rate (OD/hour) | |
|---|---|---|
| S. aureus | S. epidermidis | |
| 5 | 0.03 | 0.05 |
| 5.5 | 0.04 | 0.07 |
| 6 | 0.09 | 0.08 |
| 6.5 | 0.13 | 0.09 |
| 7 | 0.14 | 0.10 |
Their data can be used to select values for the growth rates and in our model, corresponding to healthy skin with a skin surface pH of 5 and compromised skin with a pH of 6.5. Because the experiments from Dasgupta et al. were performed in vitro and the bacterial population sizes measured with optical density (OD) instead of CFU, the growth rates cannot be directly translated into and . We use as the reference value for the commensal growth rate at pH 5, following on from previous simulation (Fig. 3). Maintaining the ratio between the two population growth rates at pH 5 and the multiplying factors following the pH elevation from Dasgupta et al. experimental data, we can define two sets of values for and :
Considering the healthy skin scenario with a skin surface pH of 5, the influence of the bacterial populations initial concentrations on the dominant species after 50 hours is evaluate using the temporal logic formula:
where and are free variables representing the abundance factors between both populations, evaluated at Time and at the last time point of the trace respectively (F stands for finally and G for globally at all future time points), i.e. at the time horizon of the experiments of 50 hours.
When given with an objective value, e.g. , the distance between that value and the validity domain of the formula, i.e. the set of values for that satisfy the formula, provides a violation degree which is used to evaluate the satisfaction degree of the property.
Here, we evaluate how much the temporal formula , , is satisfied given variations of the initial concentrations of two populations (Fig. 5). The model predicts that, under the healthy skin condition, the commensal population will always dominate after 50 hours, except when introduced at a relatively low concentration () while the initial concentration of the pathogenic population is high ().

The model predicts a higher vulnerability of the skin regarding invading pathogens with an elevated skin surface pH. When evaluating the same temporal formula with growth rates values corresponding to a skin surface pH of 6.5, we observe that even when the initial concentration of commensal is high (), the pathogenic population is able to colonize the skin when introduced at a concentration as low as (Fig. 6).

Such predictions highlight the protective effect of the skin surface acidic pH against the invasion of pathogenic bacteria.
5.2 Reduced production of skin AMPs
As mentioned before, human keratinocytes constitutively produce AMPs as a defense against pathogens. In atopic dermatitis, the expression of AMPs is dysregulated, leading to lower concentration levels of AMPs in the epidermis [23].
Similarly to the analysis done for skin surface pH, our model can be used to study how the skin microbiome reacts to modulation of the AMPs production by the skin cells.
Two situations are considered: an impaired production of AMPs by the skin cells () and a higher concentration with .
Using the same methodology as in the case of skin surface pH, the temporal logic formula , , is evaluated for variations of the initial concentrations of both populations for and (Fig. 7).


The model predicts a slightly protective effect of regarding the colonization of the skin by a pathogenic population, for low initial concentrations. However when both populations are introduced in high concentrations, the increase of appears to have the opposite effect of facilitating the colonization by the pathogenic population.
This mitigated effect might be due to the presence of in the constraint related to the degradation rate of (equation (11)) and deserves further investigation.
6 Conclusion
The objective of this research is the identification of conditions which might favor or inhibit the emergence of pathogenic populations in the skin microbiome. Such analyses can lead to insights about potential treatment strategies aiming at restoring a dysbiotic condition.
We have developed a simple ODE model of skin microbiome with 3 variables and 13 parameters which could be reduced to 5 parameters by using published data from the literature and steady state reasoning on the observations made in the biological experiments. Our bacterial population model is generic in the sense that we did not take into account the peculiarities of some specific bacterial populations, but on some general formulas of adversary population dynamics and influence factors. We showed through sensitivity analyses that our model predictions are particularly robust with respect to parameter variations.
Perhaps surprisingly, we also showed that this simple model exhibits over a large range of biologically relevant parameter values, a meta-stability phenomenon, revealed by allowing the simulation to continue for times one order of magnitude longer than the reported experimental times. This observation questions the existence and importance of meta-stability phenomena in real biological processes, whereas a natural assumption made in mathematical modeling, and model fitting to data, is that the experimental data are observed in states corresponding to real stable states of the mathematical model.
Acknowledgments.
We are grateful to Mathieu Hemery, Aurélien Naldi and Sylvain Soliman for interesting discussions on this work.
References
- [1] Belkaid, Y., Segre, J.A.: Dialogue between skin microbiota and immunity. Science 346(6212), 954–959 (Nov 2014). https://doi.org/10.1126/science.1260144, https://www.science.org/doi/10.1126/science.1260144
- [2] Byrd, A.L., Belkaid, Y., Segre, J.A.: The human skin microbiome. Nature Reviews Microbiology 16(3), 143–155 (Feb 2018). https://doi.org/10.1038/nrmicro.2017.157
- [3] Campion, J.J., McNamara, P.J., Evans, M.E.: Pharmacodynamic Modeling of Ciprofloxacin Resistance in Staphylococcus aureus. Antimicrobial Agents and Chemotherapy 49(1), 209–219 (Jan 2005). https://doi.org/10.1128/AAC.49.1.209-219.2005, https://journals.asm.org/doi/10.1128/AAC.49.1.209-219.2005, publisher: American Society for Microbiology
- [4] Chopra, R., Vakharia, P.P., Sacotte, R., Silverberg, J.I.: Efficacy of bleach baths in reducing severity of atopic dermatitis: A systematic review and meta-analysis. Annals of Allergy, Asthma & Immunology 119(5), 435–440 (Nov 2017). https://doi.org/10.1016/j.anai.2017.08.289, https://www.annallergy.org/article/S1081-1206(17)30958-4/fulltext, publisher: Elsevier
- [5] Cogen, A.L., Yamasaki, K., Muto, J., Sanchez, K.M., Alexander, L.C., Tanios, J., Lai, Y., Kim, J.E., Nizet, V., Gallo, R.L.: Staphylococcus epidermidis antimicrobia -toxin (phenol-soluble modulin-) cooperates with host antimicrobial peptides to kill group a streptococcus. PLOS ONE 5(1), e8557 (Jan 2010). https://doi.org/10.1371/journal.pone.0008557, https://journals.plos.org/plosone/article?id=10.1371/journal.pone.0008557, publisher: Public Library of Science
- [6] Cogen, A.L., Yamasaki, K., Sanchez, K.M., Dorschner, R.A., Lai, Y., MacLeod, D.T., Torpey, J.W., Otto, M., Nizet, V., Kim, J.E., Gallo, R.L.: Selective antimicrobial action is provide by phenol-soluble modulins derived from staphylococcus epidermidis, a normal resident of the skin. Journal of Investigative Dermatology 130(1), 192–200 (Jan 2010). https://doi.org/10.1038/jid.2009.243, https://linkinghub.elsevier.com/retrieve/pii/S0022202X15345486
- [7] Czock, D., Keller, F.: Mechanism-based pharmacokinetic-pharmacodynamic modeling of antimicrobial drug effects. Journal of Pharmacokinetics and Pharmacodynamics 34(6), 727–751 (Dec 2007). https://doi.org/10.1007/s10928-007-9069-x
- [8] Dasgupta, A., Iyer, V., Raut, J., Qualls, A.: 16502 effect of ph on growth of skin commensals and pathogens. Journal of the American Academy of Dermatology 83(6), AB180 (Dec 2020). https://doi.org/10.1016/j.jaad.2020.06.808, https://www.jaad.org/article/S0190-9622(20)31908-3/abstract, publisher: Elsevier
- [9] Eberlein-König, B., Schäfer, T., Huss-Marp, J., Darsow, U., Möhrenschlager, M., Herbert, O., Abeck, D., Krämer, U., Behrendt, H., Ring, J.: Skin surface ph, stratum corneum hydration, trans-epidermal water loss and skin roughness related to atopic eczema and skin dryness in a population of primary school children. Acta Dermato-Venereologica 80(3), 188–191 (May 2000). https://doi.org/10.1080/000155500750042943
- [10] Grice, E.A., Kong, H.H., Conlan, S., Deming, C.B., Davis, J., Young, A.C., Bouffard, G.G., Blakesley, R.W., Murray, P.R., Green, E.D., Turner, M.L., Segre, J.A.: Topographical and temporal diversity of the human skin microbiome. Science (New York, N.Y.) 324(5931), 1190–1192 (May 2009). https://doi.org/10.1126/science.1171700, https://www.ncbi.nlm.nih.gov/pmc/articles/PMC2805064/
- [11] Kennedy, E.A., Connolly, J., Hourihane, J.O., Fallon, P.G., McLean, W.H.I., Murray, D., Jo, J.H., Segre, J.A., Kong, H.H., Irvine, A.D.: Skin microbiome before development of atopic dermatitis: Early colonization with commensal staphylococci at 2 months is associated with a lower risk of atopic dermatitis at 1 year. J Allergy Clin. Immunol. 139(1), 7 (2017)
- [12] Kobayashi, T., Glatz, M., Horiuchi, K., Kawasaki, H., Akiyama, H., Kaplan, D.H., Kong, H.H., Amagai, M., Nagao, K.: Dysbiosis and staphylococcus aureus colonization drives inflammation in atopic dermatitis. Immunity 42(4), 756–766 (Apr 2015). https://doi.org/10.1016/j.immuni.2015.03.014, https://www.ncbi.nlm.nih.gov/pmc/articles/PMC4407815/
- [13] Koh, L.F., Ong, R.Y., Common, J.E.: Skin microbiome of atopic dermatitis. Allergology International p. S1323893021001404 (Nov 2021). https://doi.org/10.1016/j.alit.2021.11.001, https://linkinghub.elsevier.com/retrieve/pii/S1323893021001404
- [14] Kohda, K., Li, X., Soga, N., Nagura, R., Duerna, T., Nakajima, S., Nakagawa, I., Ito, M., Ikeuchi, A.: An in vitro mixed infection model with commensal and pathogenic staphylococci for the exploration of interspecific interactions and their impacts on skin physiology. Frontiers in Cellular and Infection Microbiology 11, 712360 (Sep 2021). https://doi.org/10.3389/fcimb.2021.712360, https://www.ncbi.nlm.nih.gov/pmc/articles/PMC8481888/
- [15] Kong, H.H.: Skin microbiome: genomics-based insights into the diversity and role of skin microbes. Trends in Molecular Medicine 17(6), 320–328 (Jun 2011). https://doi.org/10.1016/j.molmed.2011.01.013, https://www.sciencedirect.com/science/article/pii/S1471491411000232
- [16] Kong, H.H., Oh, J., Deming, C., Conlan, S., Grice, E.A., Beatson, M.A., Nomicos, E., Polley, E.C., Komarow, H.D., NISC Comparative Sequence Program, Murray, P.R., Turner, M.L., Segre, J.A.: Temporal shifts in the skin microbiome associated with disease flares and treatment in children with atopic dermatitis. Genome Research 22(5), 850–859 (May 2012). https://doi.org/10.1101/gr.131029.111, http://genome.cshlp.org/lookup/doi/10.1101/gr.131029.111
- [17] Korting, H.C., Hübner, K., Greiner, K., Hamm, G., Braun-Falco, O.: Differences in the skin surface ph and bacterial microflora due to the long-term application of synthetic detergent preparations of ph 5.5 and ph 7.0. results of a crossover trial in healthy volunteers. Acta Dermato-Venereologica 70(5), 429–431 (1990)
- [18] Lai, Y., Cogen, A.L., Radek, K.A., Park, H.J., MacLeod, D.T., Leichtle, A., Ryan, A.F., Di Nardo, A., Gallo, R.L.: Activation of tlr2 by a small molecule produced by staphylococcus epidermidis increases antimicrobial defense against bacterial skin infections. The Journal of investigative dermatology 130(9), 2211–2221 (Sep 2010). https://doi.org/10.1038/jid.2010.123, https://www.ncbi.nlm.nih.gov/pmc/articles/PMC2922455/
- [19] Lai, Y., Di Nardo, A., Nakatsuji, T., Leichtle, A., Yang, Y., Cogen, A.L., Wu, Z.R., Hooper, L.V., Schmidt, R.R., von Aulock, S., Radek, K.A., Huang, C.M., Ryan, A.F., Gallo, R.L.: Commensal bacteria regulate toll-like receptor 3-dependent inflammation after skin injury. Nature Medicine 15(12), 1377–1382 (Dec 2009). https://doi.org/10.1038/nm.2062
- [20] Leyden, J.J., McGinley, K.J., Mills, O.H., Kligman, A.M.: Propionibacterium levels in patients with and without acne vulgaris. Journal of Investigative Dermatology 65(4), 382–384 (Oct 1975). https://doi.org/10.1111/1523-1747.ep12607634, https://www.sciencedirect.com/science/article/pii/S0022202X1544610X
- [21] Malthus, T.R.T.R.: An essay on the principle of population, as it affects the future improvement of society. With remarks on the speculations of Mr. Godwin, M. Condorcet and other writers. London, J. Johnson (1798), http://archive.org/details/essayonprincipl00malt
- [22] Meredith, H.R., Lopatkin, A.J., Anderson, D.J., You, L.: Bacterial temporal dynamics enable optimal design of antibiotic treatment. PLOS Computational Biology 11(4), e1004201 (Apr 2015). https://doi.org/10.1371/journal.pcbi.1004201, https://journals.plos.org/ploscompbiol/article?id=10.1371/journal.pcbi.1004201, publisher: Public Library of Science
- [23] Nakatsuji, T., Chen, T.H., Narala, S., Chun, K.A., Two, A.M., Yun, T., Shafiq, F., Kotol, P.F., Bouslimani, A., Melnik, A.V., Latif, H., Kim, J.N., Lockhart, A., Artis, K., David, G., Taylor, P., Streib, J., Dorrestein, P.C., Grier, A., Gill, S.R., Zengler, K., Hata, T.R., Leung, D.Y.M., Gallo, R.L.: Antimicrobials from human skin commensal bacteria protect against staphylococcus aureus and are deficient in atopic dermatitis. Science translational medicine 9(378), eaah4680 (Feb 2017). https://doi.org/10.1126/scitranslmed.aah4680, https://www.ncbi.nlm.nih.gov/pmc/articles/PMC5600545/
- [24] Nakatsuji, T., Hata, T.R., Tong, Y., Cheng, J.Y., Shafiq, F., Butcher, A.M., Salem, S.S., Brinton, S.L., Rudman Spergel, A.K., Johnson, K., Jepson, B., Calatroni, A., David, G., Ramirez-Gama, M., Taylor, P., Leung, D.Y.M., Gallo, R.L.: Development of a human skin commensal microbe for bacteriotherapy of atopic dermatitis and use in a phase 1 randomized clinical trial. Nature Medicine 27(4), 700–709 (Apr 2021). https://doi.org/10.1038/s41591-021-01256-2, https://www.nature.com/articles/s41591-021-01256-2
- [25] Ong, P.Y., Ohtake, T., Brandt, C., Strickland, I., Boguniewicz, M., Ganz, T., Gallo, R.L., Leung, D.Y.M.: Endogenous antimicrobial peptides and skin infections in atopic dermatitis. The New England Journal of Medicine 347(15), 1151–1160 (Oct 2002). https://doi.org/10.1056/NEJMoa021481
- [26] Pazgier, M., Hoover, D.M., Yang, D., Lu, W., Lubkowski, J.: Human -defensins. Cellular and Molecular Life Sciences CMLS 63(11), 1294–1313 (Jun 2006). https://doi.org/10.1007/s00018-005-5540-2, http://link.springer.com/10.1007/s00018-005-5540-2
- [27] Proksch, E.: pH in nature, humans and skin. The Journal of Dermatology 45(9), 1044–1052 (2018). https://doi.org/https://doi.org/10.1111/1346-8138.14489, https://onlinelibrary.wiley.com/doi/abs/10.1111/1346-8138.14489
- [28] Radulescu, O., Samal, S.S., Naldi, A., Grigoriev, D., Weber, A.: Symbolic dynamics of biochemical pathways as finite states machines. In: Roux, O.F., Bourdon, J. (eds.) Computational Methods in Systems Biology - 13th International Conference, CMSB 2015, Nantes, France, September 16-18, 2015, Proceedings. Lecture Notes in Computer Science, vol. 9308, pp. 104–120. Springer (2015). https://doi.org/10.1007/978-3-319-23401-4_10
- [29] Rizk, A., Batt, G., Fages, F., Soliman, S.: Continuous valuations of temporal logic specifications with applications to parameter optimization and robustness measures. Theoretical Computer Science 412(26), 2827–2839 (2011). https://doi.org/10.1016/j.tcs.2010.05.008
- [30] Tognoli, E., Kelso, J.A.S.: The metastable brain. Neuron 81(1), 35–48 (01 2014). https://doi.org/10.1016/j.neuron.2013.12.022, https://pubmed.ncbi.nlm.nih.gov/24411730
- [31] Tuomanen, E., Cozens, R., Tosch, W., Zak, O., Tomasz, A.: The rate of killing of Escherichia coli by beta-lactam antibiotics is strictly proportional to the rate of bacterial growth. Journal of General Microbiology 132(5), 1297–1304 (May 1986). https://doi.org/10.1099/00221287-132-5-1297
- [32] Zwietering, M.H., Jongenburger, I., Rombouts, F.M., van ’t Riet, K.: Modeling of the bacterial growth curve. Applied and Environmental Microbiology 56(6), 1875–1881 (Jun 1990), https://www.ncbi.nlm.nih.gov/pmc/articles/PMC184525/