Characterization of ion-beam-sputtered AlF3 thin films
for gravitational-wave interferometers
Abstract
Thermal noise in amorphous coatings is a limitation for a wide range of precision experiments such as gravitational-wave detectors (GWDs). Mirrors for GWDs are composed of multiple thin layers of dielectric materials deposited on a substrate: the stack is made of layers with a high refractive index interleaved with layers of a low refractive index. The goal is to obtain high reflectivity and low thermal noise. In this paper we report on the optical and mechanical properties of ion-beam-sputtered aluminium fluoride (AlF3) thin films which have one of the lowest refractive index among the known coating materials and we discuss their application in current and future GWDs.
Keywords:
Keywordspacs
PACSI Introduction
Brownian thermal noise in coatings (CTN) is a limiting noise source for precision experiments based on optical and quantum transducers. For example the sensitivity of interferometric gravitational-wave detectors (GWDs) is limited in the frequency range around 100 Hz by CTN Adhikari14; Saulson90; Levin98. GWDs are Michelson interferometers with mirrors placed at the ends of two Fabry-Pérot cavities, in order to measure the relative motion of the two arms.
Mirrors for GWDs are Bragg reflectors composed by a stack of thin layers of two alternated dielectric materials (with high and low refractive index) deposited on a substrate. It is crucial to find coatings with low optical loss (absorption, scatter) and low thermal noise in order to improve the sensitivity of GWDs.
The power spectral density of thermally induced surface fluctuations is determined by the rate of energy dissipation in each coating material, as stated by the fluctuation-dissipation theorem Callen52: the higher the energy loss, the higher the CTN.
As measured with a laser beam, the CTN power spectral density can be written as Harry02
| (1) |
where is the Boltzmann constant, is the frequency, is the temperature, is the coating thickness, is the laser beam radius (where intensity drops by 1/e2), and is the loss angle associated with energy dissipation in the coating and corresponds to its internal mechanical friction.
Thus can be reduced by increasing the beam radius , decreasing the temperature , or by choosing coating materials which minimize ; furthermore, the lowest CTN is expected to occur when the Young modulus of the coting () matches the elastic modulus of the substrate Harry02.
The reflectivity of a Bragg mirror depends on the number of low/high index layer pairs and on the refractive index contrast , where and are the high and low refractive indices, respectively. Using materials with higher allows us to use a lower number of layers and hence a lower thickness of the entire stack .
Up to now, the high-reflectivity (HR) coatings of the Advanced LIGO aLIGO, Advanced Virgo AdVirgo and KAGRA KAGRA GWDs are thickness-optimized stacks Villar10 of layers of tantalum pentoxide (Ta2O5) doped with a relevant fraction of titanium dioxide (TiO2), also known as titania-doped tantala as high index material and silicon dioxide (SiO2), silica, as low index material Granata20. Those HR coatings are deposited by the Laboratoire des Matériaux Avancés (LMA) Degallaix19; Pinard17 using the ion-beam-sputtering (IBS) technique. Despite the excellent mechanical and optical properties of the current HR coatings Degallaix19; Granata20, CTN remains a severe limitation for further sensitivity enhancements in GWDs. In the last two decades, a lot of effort has been committed to find an alternative high-index material Granata20review; Vajente21, that is the most dissipative one at room temperature, but for present and future cryogenic GWDs like KAGRA KAGRA, Einstein Telescope ET, and Cosmic Explorer Abbott17 there is a need to find alternative low-CTN materials: in fact, the currently available data on IBS silica shows a dramatic increase of dissipation below 30 K Martin14; Granata15, so silica coating should be replaced by another low refractive index material featuring low mechanical and optical losses.
Because of their low refractive index Kolbe92; Kolbe93; Yoshida06; Ode14 and potentially low mechanical loss at low temperature Schwarz11, fluoride coatings could be a valid option for use in cryogenic GWDs. So far, however, fluoride coatings have never been considered for implementation in gravitational-wave detectors, so that a specifically oriented characterization of their properties is needed. The aim of this paper is to provide optical and mechanical properties of IBS aluminium fluoride (AlF3) coatings as replacement of the low-index silica layers in the HR coatings of current and future GWDs. As a first step, we report the (AlF3) properties measured at ambient temperature and we compare them with those of low-index silica films.
We took special care to characterize the impact of the post-deposition thermal treatment on coating properties, in particular on the Granata20. Annealing treatment are performed inside a tube furnace in argon-saturated atmosphere in order to avoid surface oxidation.
II Methods
II.1 Samples
A thin layer of AlF3 has been deposited by ion beam sputtering (IBS) at the Laser Zentrum Hannover 11 1 www.lzh.de on both sides of fused silica substrates ( 50 mm, mm) for mechanical characterization and on one side of silicon substrates ( 75 mm) for ion beam analysis, x-ray diffraction measurements and optical characterization. The coating is deposited on both sides of fused silica substrates in order to have balanced stresses and avoid deformations of the disk that could produce a variation in resonant frequencies and affect the evaluation of the frequency-dependent dilution factor.
Prior to deposition, fused-silica disks have been annealed in air at 900 ∘C for 10 hours to release the internal stress due to manufacturing. Their masses and mechanical losses were measured so that the coating losses were calculated as explained in section II.4.
Prior to deposition, the base pressure inside the coater vacuum chamber was mbar. The total pressure during the coating process was of the order of mbar, with noble gases and gases containing fluorine injected into the chamber. Energy and current of the sputtering ions were of the order of 1 keV and 0.1 A, respectively.
II.2 Structure and chemical composition
In order to determine the chemical composition of the coating samples after deposition, as well as its change after annealing treatments, we performed a series of Rutherford back-scattering spectrometry (RBS) measurements. Those measurements were done in the Accelerator AN2000 at the INFN-LNL using an ion beam at 2 MeV in normal incidence, with a scattering angle of 160∘.
Moreover, a series of grazing-incidence X-ray diffraction (GI-XRD) measurements were performed on coating samples after the deposition and after different annealing steps, in order to determine the coating microscopic structure and its evolution with thermal treatments. GI-XRD measurements were done with a Philips MRD diffractometer that is equipped with a Cu tube operated at 40 kV and 40 mA (collimated and partially monochromatized to the Cu K- line using a parabolic multilayer mirror) and with a detector provided with a parallel plate collimator.
II.3 Optical properties
We used two J. A. Woollam spectroscopic ellipsometers to measure the coating optical properties, covering complementary spectral regions from ultraviolet to infrared: a VASE for the 0.73-6.53 ev photon energy range (corresponding to a 190-1700 nm wavelength range) and a M-2000 for the 0.74-5.06 ev range (245-1680 nm). The coated wafers were measured in reflection, their complex reflectance ratio was characterized by measuring its amplitude component and phase difference Fujiwara07. To maximize the response of the instruments, the (, ) spectra were acquired at different incidence angles ( = 50∘, 55∘, 60∘) close to the coating Brewster angle. Coating refractive index and thickness were derived by fitting the spectra with realistic optical models Fujiwara07. The optical response of the bare wafers had been characterized with prior dedicated measurements. Further details about our ellipsometric analysis are available elsewhere Amato19.
We used photo-thermal deflection Boccara80 to measure the coating optical absorption at nm with an accuracy of less than 1 part per million (ppm).
II.4 Mechanical properties
Two silica disks (A and B) were used for the characterization of the coating mechanical properties.
Before and after each treatment (coating deposition, annealing runs) we measured the mass of the disks with an analytical balance and we observed the surface with an optical microscope (Olympus IX51 equipped with e ToupCam camera) to check if the coating surface was deteriorated by each treatment. Their properties are summarized in Table 1.
| sample A | sample B | |
|---|---|---|
| diameter [mm] | 49.94 0.02 | 49.79 0.02 |
| thickness [mm] | 1.0 0.1 | 1.0 0.1 |
| mass before coating [mg] | 4647.3 0.1 | 4612.3 0.1 |
| mass after coating [mg] | 4649.1 0.1 | 4613.9 0.1 |
| coating thickness on each side [nm] | 211 6 | 211 6 |
We used the ring-down method Nowick72 to measure the frequency and ring-down time of several vibrational modes of each disk, before and after the coating deposition (and after each annealing treatment) in order to calculate the coating loss angle
| (2) |
where is the measured loss angle of the coated disk, is the measured loss angle of the bare substrate. is the frequency-dependent measured dilution factor Li14:
| (3) |
where , are the disk masses as measured before and after the coating deposition, respectively.
In order to minimize coating mechanical loss and optical absorption , we tested different plateau temperatures and duration . During the annealing, samples were hold in a quartz box inside the oven and maintained in a controlled argon atmosphere during the entire process. In between measurements, the samples were stored under primary vacuum ( mbar) to avoid oxidation from air exposure.
Disks were first measured at the Laboratoire des Matériaux Avancés (LMA) before and after coating deposition, then measured, annealed and measured again at Università degli Studi di Urbino Carlo Bo (UniUrb). Since the temperature in the two laboratories is different, a correction of measured mode frequencies is necessary for a correct evaluation of the frequency-dependent dilution factor, as explained in granata2021optical.
We measured resonant modes from 2.5 to 50 kHz for each sample, in a frequency band which partially overlaps with the detection band of ground-based GWDs ( Hz). For these ringdown measurements we used two clamp-free in-vacuum Gentle Nodal Suspension (GeNS) systems Cesarini09. This kind of facility is currently the preferred solution of the Virgo and LIGO Collaborations for performing internal friction measurements because avoids systematic damping from suspension, clamp or residual gas pressure Granata20; Vajente17.
The coating Young modulus and Poisson ratio were estimated by fitting finite-element simulations to measured dilution factors via least-squares numerical regression Granata20. Further details about our GeNS systems, finite-element simulations and data analysis are available elsewhere Granata20; Granata16.

III Results
III.1 Structure and chemical composition
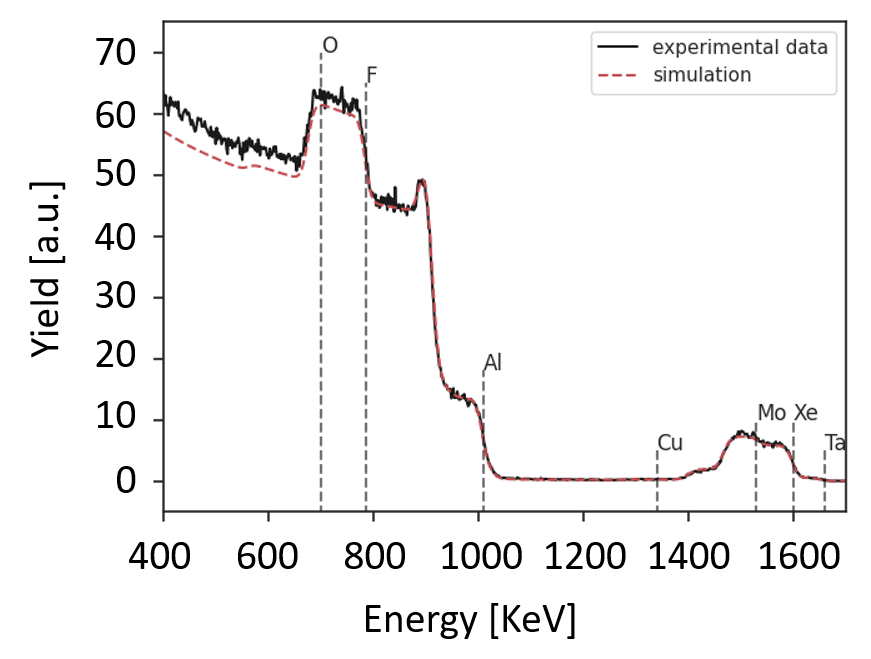
RBS results of the coating samples are listed in Table II. Relative atomic concentrations and density are deduced from simulations of the experimental spectra based on stopping powers drawn from SRIM database SRIM-2003. Figure 2 shows an example of a RBS measurement, referred to the as-deposited IBS AlF3 coating. RBS analysis of the as-deposited film shows that the Al/F atomic ratio is slightly higher than the stoichiometric one (0.4 instead of 0.33): the missing F is partially compensated by O incorporation (8%). Moreover, the sample is contaminated by the Xe sputtering gas and by Mo from the sputtering source grids and contains traces of Cu and Ta. Film density has been calculated by dividing the areal atomic density (obtained from RBS) by the layer thickness measured via spectroscopic ellipsometry, to find a value of g/cm3.
| Al | F | O | Xe | Mo | Cu | Ta | Al/F | [g/cm3] | |
|---|---|---|---|---|---|---|---|---|---|
| as deposited | 25.7 | 65 | 8 | 0.78 | 0.42 | 0.05 | 0.039 | 0.40 | 2.7 |
| 200 ∘C | 27.5 | 63 | 8 | 0.82 | 0.49 | 0.11 | 0.041 | 0.43 | 2.8 |
| 300 ∘C | 28.8 | 58 | 12 | 0.7 | 0.44 | 0.06 | 0.038 | 0.50 | 2.7 |
| 400 ∘C | 29.8 | 60 | 9 | 0.6 | 0.42 | 0.12 | 0.036 | 0.50 | 2.3 |
| 500 ∘C | 33.5 | 45 | 20 | 0.95 | 0.46 | 0.08 | 0.039 | 0.72 | 1.8 |
RBS analysis of the annealed samples highlights the effect of annealing treatments on the film composition. The increase of the Al/F atomic ratio, which is small at the lower temperatures, becomes particularly pronounced in the sample annealed at 500 ∘C and is accompanied by a release of fluorine ( 40%) and by an increase of the incorporated oxygen (+100%). Film density is also affected by the annealing treatments and decreases to 1.8 g/cm3 in the sample annealed at 500 ∘C. Concerning the other elements present in the film, annealing treatments do not seem to influence their atomic concentration, even at the highest temperature.
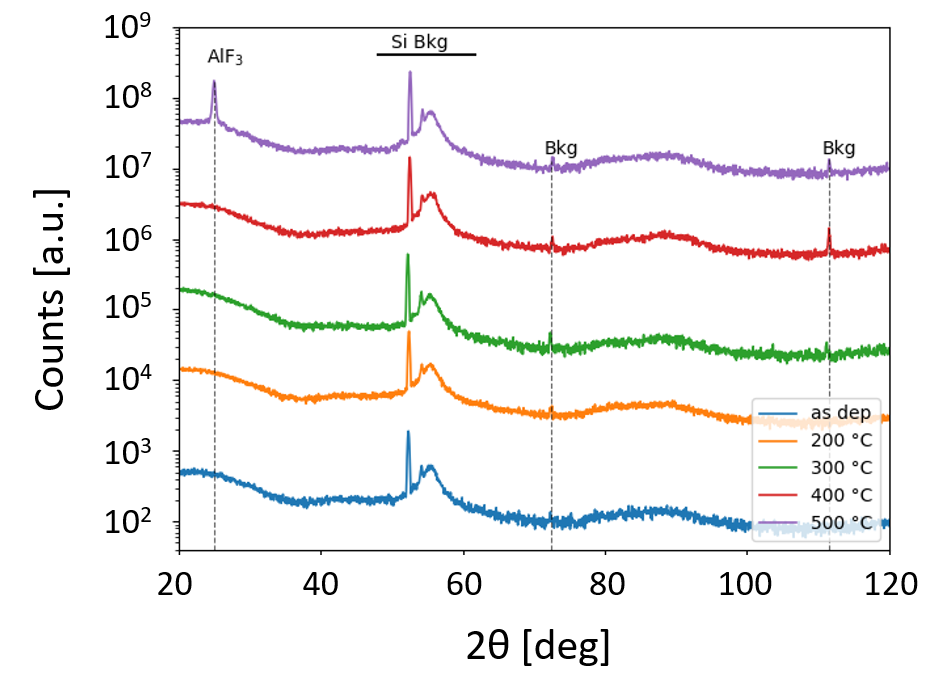
The GI-XRD diffractograms of the coating samples are reported in Figure 3. Peaks between 50∘ and 60∘ are due to the background signal of the crystalline silicon substrate and are visible in all the spectra.The coating material remained amorphous with the exception of the sample treated at 500 ∘C that displays a peak at , compatible with AlF3 crystalline spectrum that has a main peak at 25.3∘ Villars2016. The absence of other peaks is probably due to the fact that other peaks of AlF3 are much less intense. There are some peaks around 70∘ and 110∘ whose origin is not known. Their behaviour seems not to be related to annealing treatments, so they are associated to a background signal.
III.2 Optical properties
Figure 4 shows exemplary spectra of the as-deposited coatings, acquired at an incidence angle = 60∘. At higher energy, above 5.7 eV, sample absorption is the cause of the observed degradation of the signal to noise ratio. The absorption could be related to the formation of colour centres, to the presence of roughness or to a poorly stoichiometric structure, where some aluminium particles might not be fully fluorinated Ode14. We then used a pole in the UV region and a Tauc-Lorentz oscillator for the otical model of the thin film layer, which simultaneously fitted all the measured spectra with the same accuracy. A Bruggeman effective medium approximation (EMA) surface layer was added to the model to account for possible surface effects such as roughness.
Figure 5 shows the dispersion law and the extinction curve derived from our analysis of the as-deposited coatings, and Table 3 lists our results (including density) against those we found in the literature concerning IBS AlF3 thin films Kolbe93; Yoshida06; Ode14. The Bruggeman layer was found to be almost of the total coating thickness, indicating that the surface condition may play a role in optical loss at low wavelength. Values at = 1.17 eV and = 0.80 eV are particularly relevant, since those photon energies correspond to 1064 and 1550 nm, respectively, which are the operational laser wavelenghts of current and future GWDs aLIGO; AdVirgo; KAGRA; ET. Refractive index values are at 1064 nm and at 1550 nm. For comparison, the refractive index at 1064 nm of the IBS silica coatings of present GWDs is before annealing Granata20.
| This work | Kolbe et al. Kolbe93 | Yoshida et al. Yoshida06 | Ode Ode14 | ||
| 1550 nm | 1.356 0.005 | ||||
| 1064 nm | 1.358 0.005 | ||||
| 633 nm | 1.362 0.005 | ||||
| 193 nm | 1.4 (∗) | 1.41 | 1.43 | 1.42 | |
| (∗) | |||||
| [g/cm3] | 2.2 0.4 |
Figure 6 shows the extinction coefficient obtained from the photo-thermal deflection measurements of optical absorption at 1064 nm, as a function of the annealing temperature using the measured thickness of 211 nm, as reported in Table 1. We assumed that loss by light scatter was negligible. We measured before treatment, then increased after each annealing step up to for ∘C.
III.3 Mechanical properties
It is known that post-deposition annealing treatment can improve mechanical properties of a material Granata20, but it is important to establish both the ideal peak temperature and the duration at that temperature.
III.3.1 Sample A
Disk A underwent a series of annealing treatments of equal duration but of increasing plateau temperature (Table 4). Heating and cooling ramps of 100 ∘C every hour were used.
| run | #1 | #2 | #3 | #4 | #5 | #6 | #7 |
|---|---|---|---|---|---|---|---|
| [∘C] | 120 | 200 | 285 | 330 | 373 | 462 | 550 |
| [h] | 10 | 10 | 10 | 10 | 10 | 10 | 10 |
After each annealing we measured the loss angle of the coated silica disk and applying equations 2 and 3 we could measure the frequency-dependent dilution factor and extract the coating loss angle . The results achieved at LMA before the first annealing treatment are shown in Figure 7. It is possible to describe the frequency-dependent behaviour of the coating loss angle fitting a power-law model to our data via least-squares linear regression Gilroy81; Travasso07; Cagnoli18:
| (4) |
In Table 5 are reported the mechanical properties of as-deposited IBS AlF3 estimated using the procedure described in Section (II D) and the best-fit parameters (a,b) for each sample.
. Y [GPa] a [ rad] b disk A 78 2 0.27 0.02 1.06 0.06 0.02 0.06 disk B 72 1 0.22 0.03 1.25 0.04 0.03 0.03
In Figure 8 are reported the evolutions of dilution factor and coating loss angle with annealing temperature, measured at the UniUrb laboratory. The first set of data ( ∘C) represents the measured values before the first annealing. The notation denote different vibrational modes with radial and azimuthal nodes that are summarized in Figure 9.


From Figure 8 it is possible to see that the dilution factor increases until the treatment at 373 ∘C and that the coating loss angle decreases after each annealing until the treatment at 373 ∘C. The annealing temperature that minimizes the coating loss angle is between 285 ∘C and 373 ∘C.
The mass of the sample remains unchanged until the treatment at 373 ∘C then starts to decrease of mg after the annealing at 462 ∘C and mg after the last annealing at 550 ∘C. So, after the last treatment, we have lost mg of coating out of mg.
Moreover, using the optical microscope, we started to observe some round structures on the surface of the coating after the treatment at 330 ∘C. An example, recorded using an environmental scanning electron microscope, is reported in Figure 10.

After the treatment at 550 ∘C the appearance of the coating changed: the side in contact with the quartz box used inside the furnace during the annealing looked opaque in the centre as shown in Figure 11. The morphology of the coating, measured with an atomic force microscope (AFM), appeared very different on the two sides of the sample: the roughness of the side in contact with the quartz box reported in Figure 12 (a) completely changed from its original value.


Moreover, we observed the surface and the chemical composition of the sample with an enviromental scanning electron microscope (FEI quanta 200 FEG equipped with a spectrometer). In Figure 13 it is possible to observe the formation of crystals on both sides of the sample. Crystals on side (a) are coarser than on side (b). In Table 6 we reported the chemical compositions of the two sides measured with the spectrometer. Stoichiometry of AlF3 is not respected: there is a deficiency of fluoride on both sides of the sample. The presence of silicon and oxygen is due to the silica substrate under the coating. It seems that the fluoride reacted with the silicon contained in the quartz box during the thermal treatment at 550 ∘C producing a volatile compound (SiF4): this can explain the mass loss, the defects formation on the surface and the deficiency of fluoride.


| Element | Atomic % side(a) | Atomic % side(b) |
|---|---|---|
| O | 55.3 0.6 | 52.6 0.6 |
| F | 4.4 0.2 | 7.5 0.4 |
| Al | 24.8 0.6 | 30.8 0.5 |
| Si | 15.5 0.9 | 9.1 0.7 |
III.3.2 Sample B
Disk B, nominally identical to disk A, underwent a series of annealing treatments of equal but of increasing (Table 7). We have indicated as ”cumulative duration” the total amount of time at the plateau temperature.
| run | #1 | #2 | #3 |
|---|---|---|---|
| [∘C] | 285 | 285 | 285 |
| [h] | 10 | 20 | 30 |
| cumulative duration [h] | 10 | 30 | 60 |
From the results on Sample A, we have chosen 285 ∘C as the best annealing temperature, because it minimizes the coating loss angle and seems not to produce defects on its surface. After each annealing we measured the coated disk and applying equations 2 and 3 we could measure the frequency-dependent dilution factor and extract the coating loss angle . The results are reported in Figure 14. The first set of data ( ∘C) represents the measured values (at UniUrb laboartory) before the first annealing. The coating loss angle decreased after the first treatment, but no more improvements were observed after subsequent annealings.

The mass of the sample remained unchanged after all thermal treatments. No defects or crystals were observed using the optical microscope and the environmental scanning electron microscope.
| Element | Atomic % side(a) | Atomic % side(b) |
|---|---|---|
| O | 19.1 0.4 | 15.2 0.5 |
| F | 50.8 0.4 | 56.1 0.5 |
| Al | 28.7 0.3 | 27.5 0.4 |
| Si | 1.4 0.3 | 1.2 0.2 |
In Table 8 we reported the chemical compositions of the two sides measured with the spectrometer. In this case, there is more fluoride than aluminium, however the stoichiometry is not respected.
IV Conclusions
In the framework of a research activity devoted to find low-noise coating materials for present and future gravitational-wave detectors, we characterized the optical and mechanical properties of a set of IBS AlF3 thin films. We chose fluoride coatings because of their low refractive index , with the aim of minimizing the overall high-reflection coating thickness in Eq.(1). As a reminder, is a monotonically decreasing function of the refractive index contrast . Furthermore, because of their potentially low mechanical loss at low temperature Schwarz11, fluorides could be a valid option for use in cryogenic detectors.
Indeed, the IBS AlF3 thin films featured a lower refractive index at 1064 nm than that of IBS silica layers of current detectors Granata20. However, their optical absorption and ambient-temperature loss angle turned out to be considerably higher.
Concerning the coating loss angle, the best annealing temperature is found to be 285 ∘C (from the analysis of Sample A) and a duration of 10 hours at the plateau temperature is sufficient to reach a minimum in the coating loss angle rad achieved in sample B. Higher annealing temperatures could produce a chemical reaction between the fluoride of the coating and the silicon contained in the substrate, producing defects on the sample surface. However, the loss angle of AlF3 coatings at room temperature is still too high compared to silica coatings, whose value is rad Granata20. Further tests will be carried out in the near future to explore the mechanical behaviour of AlF3 coatings at low temperatures, where the silica loss angle increases and should be replaced by another low refractive index material.
From a point of view of optical properties, the optical absorption increases after each annealing and is at least 3 orders of magnitude higher than what is tolerable for GWDs applications Granata20. In the future, efforts will be made to optimise the quality of the coating material in order to decrease the coating optical absorption and loss angle. Lower optical and mechanical losses could possibly be achieved by changing the coating growth conditions Granata20, as well as by improving the stoichiometry and reducing the amount of impurities.
V Acknowledgments
This work has been promoted by the Laboratoire des Matériaux Avancés and partially supported by the Virgo Coating Research and Development (VCR&D) Collaboration. The authors would like to thank M. Gauch, F. Carstens and H. Ehlers of the Laser Zentrum Hannover for the production of the AlF3 thin films and for the fruitful discussions. In the online document repositories of the LIGO and the Virgo Scientific Collaborations, this work has been assigned document numbers LIGO-P2100478 and VIR-1385B-21, respectively.
References
References
- (1) R. X. Adhikari, Rev. Mod. Phys. 86, 121 (2014).
- (2) P. R. Saulson, Phys. Rev. D 42, 2437 (1990).
- (3) Y. Levin, Phys. Rev. D 57, 659 (1998).
- (4) H. B. Callen and R. F. Greene, Phys. Rev. 86, 702 (1952).
- (5) G. M. Harry et al., Class. Quantum Grav. 19, 897 (2002).
- (6) J. Aasi J et al., Class. Quantum Grav. 32, 074001 (2015).
- (7) F. Acernese F et al., Class. Quantum Grav. 32, 024001 (2015).
- (8) Yoichi Aso, Yuta Michimura, Kentaro Somiya, Masaki Ando, Osamu Miyakawa, Takanori Sekiguchi, Daisuke Tatsumi, and Hiroaki Yamamoto, Phys. Rev. D 88, 043007 (2013).
- (9) A. E. Villar et al., Phys. Rev. D 81, 122001 (2010).
- (10) M. Granata et al, Class. Quantum Grav. 37, 095004 (2020).
- (11) J. Degallaix et al., J. Opt. Soc. Am. A 36, C85 (2019).
- (12) L. Pinard et al., Appl. Opt. 56, C11 (2017).
- (13) M. Granata et al., Appl. Opt. 59, A229 (2020).
- (14) G. Vajente et al., Phys. Rev. Lett. 127, 071101 (2021).
- (15) S. Hild et al., Class. Quantum Grav. 28, 094013 (2011); M. Abernathy et al., Einstein Telescope conceptual design study, ET technical note ET-0106C-10, (2011).
- (16) B. P. Abbott et al., Class. Quantum Grav. 34, 044001 (2017).
- (17) I. W. Martin et al., Class. Quantum Grav. 31, 035019 (2014).
- (18) M. Granata et al., Arch. Metall. Mater. 60, 365 (2015).
- (19) J. Kolbe, H. Kessler, T. Hofmann, F. Meyer, H. Schink, and D. Ristau, Optical properties and damage thresholds of dielectric UV/VUV-coatings deposited by conventional evaporation, IAD and IBS in Laser-Induced Damage in Optical Materials: 1991 1624 (SPIE, Bellingham, 1990), p. 221.
- (20) J. Kolbe and H. Schink, Optical losses of dielectric VUV-mirrors deposited by conventional evaporation, IAD and IBS in Thin Films for Optical Systems 1782 (SPIE, Bellingham, 1990), p. 435.
- (21) T. Yoshida, K. Nishimoto, K. Sekine, and K. Etoh, Appl. Opt. 45, 1375 (2006).
- (22) James F. Ziegler, Nuclear Instruments and Methods in Physics Research Section B: Beam Interactions with Materials and Atoms Volumes 219–220, 2004, p. 1027-1036, ISSN 0168-583X, https://doi.org/10.1016/j.nimb.2004.01.208.
- (23) Villars, Pierre and Cenzual, Karin, AlF3 Crystal Structure: Datasheet from PAULING FILE Multinaries Edition 2012, SpringerMaterials.
- (24) A. Ode, Appl. Opt. 53, A330 (2014).
- (25) C. Schwarz, D. Heinert, P. Seidel, A. Tünnermann, G. Hammond, and R. Nawrodt, Phys. Status Solidi A 208, 2719 (2011).
- (26) V. Mussi, F. Granone, C. Boragno, F. Buatier de Mongeot, U. Valbusa, T. Marolo and R. Montereali, Appl. Phys. Lett. 88, 103116 (2006).
- (27) H. Fujiwara, Spectroscopic ellipsometry: principles and applications (John Wiley & Sons, New York, 2007).
- (28) A. Amato et al., J. Phys. Mater. 2, 035004 (2019).
- (29) A. C. Boccara, D. Fournier, W. Jackson, and N. M. Amer, Opt. Lett. 5, 377 (1980).
- (30) A. Nowick and B. Berry, Anelastic Relaxation in Crystalline Solids (Academic Press, New York, 1972), p. 582-602.
- (31) T. Li T et al., Phys. Rev. D 89, 092004 (2014).
- (32) M. Granata et al., Phys. Rev. Applied 17, 034058 (2022).
- (33) E. Cesarini, M. Lorenzini, E. Campagna, F. Martelli, F. Piergiovanni, F. Vetrano, G. Losurdo, and G. Cagnoli, Rev. Sci. Instrum. 80, 053904 (2009).
- (34) G. Vajente, A. Ananyeva, G. Billingsley, E. Gustafson, A. Heptonstall, E. Sanchez, and C. Torrie, Rev. Sci. Instrum. 88, 073901 (2017).
- (35) M. Granata et al., Phys. Rev. D 93, 012007 (2016).
- (36) K. Gilroy and W. Phillips, Philos. Mag. B 43, 735 (1981).
- (37) F. Travasso, P. Amico, L. Bosi, F. Cottone, A. Dari, L. Gammaitoni, H. Vocca, and F. Marchesoni, EPL 80, 50008 (2007).
- (38) G. Cagnoli et al., Phys. Lett. A 382, 2165 (2018).