Piezo- and pyroelectricity in Zirconia: a study with machine learned force fields
Abstract
The discovery of very large piezo- and pyroelectric effects in ZrO and HfO-based thin films opens up new opportunities to develop silicon-compatible sensor and actor devices. The effects are amplified close to the polar-orthorhombic to tetragonal phase transition temperature. Molecular dynamics is the preferred technique to simulate such effects, though its application has to solve the dilemma between sufficient accuracy and sufficient efficiency of the interatomic force field. Here we present a deep neural network-based interatomic force field of ZrO learned from ab initio data using a systematic learning procedure in the Deep Potential framework. The model potential is verified to predict a variety of structural and dynamic properties with an accuracy comparable to density functional theory calculations. Then the Deep Potential model is used to reproduce the different thermal expansion and piezo and pyroelectric phenomena in ZrO with molecular dynamics calculations. At low temperature simulating the direct effect we find negative values for the piezo-and pyroelectric coefficients matching the ab initio calculations. Approaching the phase transition temperature these values remain negative and become large. Simulating the field induced effect above the phase transition temperature we find positive, giant piezo-electric coefficients matching the observations. The model is able to explain the large values and the sign of the experimental observations in relation to the polar-orthorhombic to tetragonal phase transition. The model furthermore explains the recently observed giant dielectric constant in a similiar system.
Keywords:
Deep Potential, ZrO, piezoelectric, pyroelectric, ferroelectricI Introduction
Ferroelectrics based on HfO and ZrO Schroeder, Hwang, and Funakubo 2019 are attracting increasing attention due to their great potential for a variety of applications such as next-generation memoriesMikolajick et al. 2018, nanotransistorsHoffmann et al. 2019, and piezoelectric and pyroelectricKirbach, Kühnel, and Weinreich 2018; Jachalke et al. 2018 thin-film devices. The ferroelectric phaseSchroeder et al. 2022a has been recognized as the polar-orthorhombic , no 29 (po-phase), which does not stabilize in this material system without special conditions, but requires very thin layersHoffmann et al. 2015a or specific dopingBatra et al. 2017; Materlik et al. 2018. In this way, both HfO and ZrO can act as a base material. While ferroelectric devices depend on the existence of a stable and and switchable polarization, the piezoelectric and pyroelectric properties result from a sufficient electrotromechanical and electrothermal response of the polarization. Experiments showed that piezoelectric coefficients obtained with dopant optimized material are attractively large compared to other thin film materials. Interestingly, large positive values up to = 73pm/V were reportedKirbach, Kühnel, and Weinreich 2018 as well as large negative valuesMart et al. 2020 of = -11pm/V. Very large values could be theoretically understood by the electro-strain effectJo et al. 2012; Hao et al. 2019, which explains the response as a field-induced phase transition from the tetragonal , no 137 (t-phase) and the associated volume changeFalkowski and Kersch 2020, but the different signs are puzzling. The large values furthermore appear to mask the genuine piezoelectric coefficient, which is anomalously negative but small, as indicated by ab initio calculationsLiu et al. 2019; Dutta et al. 2021.
The amplified response of the material near the phase transition has also been observed in the pyroelectric effect. The giant pyroelectric response up to was found in polycristalline, doped thin films stimulated by an electric field at different temperaturesHoffmann et al. 2015b. Temperatures were chosen near the phase transition temperature between the ferroelectric and paraelectric phases, whose Curie temperature could be varied with doping concentration. The giant effect was smeared over a range of more than 100K, and for explanation it was suggested that the Curie temperature also depends on an effect of grain size on the free energyMaterlik, Künneth, and Kersch 2015; Künneth, Materlik, and Kersch 2017, which creates a window of enhanced values and makes the effect more useful for applications. A very large pyroelectric response was also found in similiar samples with low-frequency thermal stimulation experiments without an electric fieldMart et al. 2021, which resembles the typical pyroelectric application. In these experiments, an influence of the phase transition on the pyroelectric effect is not directly apparent, but was suggested. Liu et al.Liu et al. 2019 studied the pyroelectric effect for HfO with ab initio harmonic lattice theory developed in Liu and Pantelides 2018 and for HfO and Si:HfO with ab initio molecular dynamics (AIMD). They found that the primary coefficient (constant external strain) and the secondary coefficient (strain due to thermal expansion) both contribute with a negative sign and therefore add up to the large effect. The contribution of the secondary coefficient is explained by the anomalous negative genuine piezo effect. The contribution of the primary coefficient is related to anharmonic effects of the lattice, although this is only beginning to be understood in the harmonic approximation. To better investigate the anharmonic effects on the primary coefficient, Liu et al. performed ab initio molecular dynamics calculations, which are computationally expensive. They found that the enhancement of the secondary coefficient is associated with the ferroelectric to paraelectric phase transition.
This finding is the starting point for our investigation. The AIMD is the optimal tool to study the pyroelectric effect for anharmonic lattice effects. However, progress is hindered by large computation times. We have therefore developed a machine-learned deep potential (DP) for ZrO, which has been missing in the literature, and which combines near ab initio accuracy with significantly lower computational time. We were motivated to do this by the development of a DP for HfO by Wu et al.Wu et al. 2021. Using the developed DP for ZrO, we will calculate the piezoelectric and pyroelectric coefficients for ZrO including the temperature dependence. We will evaluate the results for very low temperatures, intermediate temperatures, and temperatures near the transition from the ferroelectric to the paraelectric phase.
II Methodology
The Deep Potential (DP) method for fitting the potential energy surface has been developed, validated and described in the literatureHan et al. 2018; Zhang et al. 2018, so in this section we only briefly introduce the idea, the generation of the database from first-principles calculations and the training and simulation protocols used in this work. The DP decomposes the total energy of a system into atomic contributions where depends only on atom and the neighbours when the relative position is smaller than a cutoff radius . DP defines the energy contribution by , where is the environment matrix whose entries are embedded into the descriptor matrix containing symmetry preserving expressions of the coordinates. The embedding net and the fitting net have trainable parameters which maps the descriptor to . and are smooth functions which allows to calculate the atomic force as negative gradient of the total energy. In our model we use a cut-off radius of and and the predefined neural network size.
In the training of the model the discrepancy between the prediction of DP and the total energy and atomic forces calculated by an ab initio approach is minimized with respect to the model parameters
| (1) |
where and denote the ab initio total energy and atomic forces, respectively. and are tunable prefactors where progressively increases and decreases.
II.1 Training Data
To train the DP model, a large training data set must be created. For the training data set the monoclinic m-phase (, no 14), polar-orthorhombic po-phase (, no 29) and tetragonal t-phase (, no 137) in a 12-atomic pseudo-cubic configuration were used. To create a first data set which represents vibrational motion with an average energy related to a specified temperature, we displaced the ionic coordinates about the equilibrium position according to the following rule. The potential energy for each displacement from the equilibrium position was estimated, with the atomic label and the direction x, y or z. The estimate for a maximal displacement uses the Interatomic Force Constants , which have been calculated from ab initio for each crystal phase, as
| (2) |
The maximum allowed energy per degree of freedom is larger than the expected average by the empirically chosen factor 8, which allows strongly deformed structures for the training data set, but on the other hand represents a cutoff against too strongly deformed structures. The equation can be resolved to for each degree of freedom. The overall covered energy range of the data sample is first defined with a randomly, uniform choosen temperature smaller than a threshold temperature in the order of the melting temperature. The actual displacement for each degree of freedom was then randomly chosen to be in the range . In this way, ionic positions which may occur in a vibrational motion are homogeneously distributed over the configuration space in a way which takes care of soft mode oscillations, performs an energy cutoff, and because of the quadratic dependence in (2) generally favours low energy displacements. The drawback of this method is that the data do not contain any information about cell deformations. Therefore a second data set was created which includes cell deformations. For this purpose strain tensor data were created to calculate new lattice vectors from the equilibrium lattice vectors from
The values of were uniformly sampled in a range of for all elements. With these values compression and stretching of the cell are well covered, as well as shear deformation which occurs during the phase transition from no 14 to no 137 or no 29.
A third data set combines the atomic and the lattice perturbation. A smaller lattice perturbation (0.5% for shear and 3% for linear strain) was combined with atomic perturbation. It was found that the third data set improves results for the elastic constants.
In total 90 000 structures were included in the data set with 30000 structures for each of the three phases and 10000 for each of the three subsets.
In the comparable model development of Wu et al.Wu et al. 2021 21768 structures of large 2x2x2 super cells (96-atoms) were included into the training process. Larger cells contain more relevant information, but are also significantly more computationally intensive, as the computing time grows at least linearly with the volume. In this paper we investigate a model based on smaller structures which can be improved subsequently with larger structures containing long range correlations or with more irregular structures containing surfaces and defect configurations.
For all structures of our data set the total energy was calculated from ab initio with quantum-espressoGiannozzi 2009 (QE) using the PBEsolPerdew et al. 2008 exchange-correlation functional. We choose efficient ultrasoft poseudopotentials with an energy cutoff of 450eV and a 4x4x4 k-point sampling. The results were compared with a highly accurate all electron implementation of the PBEsol functional in FHI-aims with a 6x6x6 k-point sampling, with an agreement of about 1meV/f.u., see Table 1.
II.2 Training
For the training process we used the DeepMD-kit Han Wang and E. 2018 with an implementation of the Deep Potential (DP). We used the standard settings of the most important parameters: a batchsize = 2 000 000, sizebatch = 50 000, learning decay rate = 0.95 , learning steps = 10 000 and start learning rate = 0.005. The three data sets were learned subsequently: after learning the first data set, the result was used as initialization for the learning on the second data set. Similiarly for the third data set.

Fig. 1 shows the fit of the energy to the training data. In the molecular dynamics simulation of the paper the model is used within the range of the training data. In the validation the range outside the training data is also explored to show the limitation of the model.
II.3 Validation
To validate the ZrO DP model the DeepMD-kit Han Wang and E. 2018 was used to predict the total energy of various crystalline structures. Table 1 compares the lattice parameter of different phases of ZrO optimized with DP and DFT, demonstrating the excellent agreement. The table contains the comparison of the total energy of relaxed structures between DP and DFT as well as total energies obtained from highly accurate calculation with the all-electron code FHI-aimsBlum et al. 2009. The data include the three phases included in the learning process, the second ferroelectric phase no 31, as well as three 24-atomic phases: the two inequivalent nonpolar no 61 and antipolar orthorhombic no 61xKersch and Falkowski 2021.
| a | b | c | E(QE) | E(aims) | ||
| [Å] | [Å] | [Å] | [∘] | E | ||
| 5.1 | 5.22 | 5.22 | 80.3 | 0.0 | 0.0 | |
| no14 m-phase | ||||||
| nonpolar | 10.17 | 5.19 | 5.30 | 90 | 24.9 | 25.3 |
| no 61 | ||||||
| antipolar | 10.05 | 5.25 | 5.25 | 90 | 42.2 | 41.7 |
| no 61x | ||||||
| 5.05 | 5.26 | 5.07 | 90 | 53.4 | 52.9 | |
| no 29 po-phase | ||||||
| 5.07 | 5.18 | 5.07 | 90 | 80.4 | 78.5 | |
| no 137 t-phase | ||||||
| 3.46 | 5.18 | 3.75 | 90 | 95.3 | 94.2 | |
| no 31 |
The next validation is done with energy-volume curves. The unit cells of Table 1 were strained and the ionic positions were subsequently relaxed in DFT. Then the energy of the structures was calculated with DFT and DP. Fig. 2 shows the results.

The comparison is excellent for the phases involved in the learning process and also for the no 61 nonpolar, fair for the polar phases no 31 and no 7, and the antipolar no 61 with an energy difference of about 20meV/f.u. The DP model is capable to predict metastable crystal phases not participating in the learning process, but with an error in energy. This error seems to be related to long range dipole interaction contained in the antipolar no 61 structure, and to a lesser extent in the polar no 7 and no 31 structure.
The next validation of the DP model is the strain tensor and compliance tensor, which is contained in the energy-volume curve. The tensor furthermore relates the piezoelectric stress and strain coefficients. The values from DP and DFT compare excellent and are found in the Supplemental Material S1.
A further validation concerns the minimum energy curves that connect the discussed phases. We have calculated the minimal energy paths with the Nudged Elastic Band (NEB) method with FHI-aims and the PBEsol functional. The energy of the 19 frames connecting the crystal phases were calculated with the DP model. Fig. 3 shows the comparison of the data. The crystal structures from the minimal energy paths extend to the energy landscape far away from equilibrium structures. The comparison is excellent.

II.4 Molecular Dynamics
The DeePMD-kit is interfaced with the high-performance classical molecular dynamics packages LAMMPSPlimpton 1995. Thus the DP potential energy models can be used to perform efficient MD simulations for different purposes.
The Born-Oppenheimer approximation is a sufficient approximation for MD of crystalline properties at elevated temperatures but fails to capture low temperature effects related to zero-point vibrations. In order to take zero point vibration and quantum occupation into account, a quantum-thermal bath (QTB) is coupled to the MD simulations as proposed by DammakDammak et al. 2009. By adding a random and a dissipative force term, which follows the power spectral density given by the quantum fluctuation-dissipation theorem, a model of the Debye-behaviour close to 0K can be achieved. The quantum-thermal bath needs the Debye frequencies of the associated crystal structures, which were calculated using the phonopy-package, see below, and were obtained as 9.345THz for the no 29 po-phase, 8.119THz for the no 137 t-phase and 8.52THz for the no 14 m-phase. The parameters for the thermostat and barostat are choosen to be uniform in all simulations with being 1ps and being 100fs. The values are chosen to be relatively large to prevent overshooting of the atomic deflections in the simulation, which could potentially lead to phase transitions and other spurious effects. The supercells are composed of 4x4x4 12 atomic unit cells, corresponding to 768 atoms. The initial supercells are fully relaxed, using the conjugate gradient (CG) algorithm of LAMMPS, which allows the relaxation the crystal cell, until the forces converge below 10-4eV/Å and energies below 10-6eV.
The MD simulations are conducted with a time step of 1fs at constant temperatures ranging from 1K to 1200K, in 100K intervals. The microcanonical ensemble (NVT) simulation cells are constructed by first using isothermic-isobaric ensemble (NPT) simulations at different temperatures and zero stress to determine the thermal expansion coefficients relative to the relaxed cell Klarbring, Skorodumova, and Simak 2018. By enlarging the relaxed structure corresponding to the desired temperature and thermal expansion coefficients, a shortening of the equilibrium times was achieved. The simulations were conducted with a thermal equilibrium time of 5ps and a sampling time of at least 20ps. The polarization is calculated by:
| (3) |
being the displacement between the zirconium and the oxygen ions centers of mass, N the number of atoms in the unitcell, the Born charges, and the size of the supercell. The Born charges were calculated using ABINIT with the PBEsol functional, which resulted in averaged diagonal values of q = 5.10e for zirconium ions and q = -2.55e for oxygen ions.
The interaction with an uniform, external electric field is calculated from multiplication with the Born charges.
As an error estimate, values over 100 fs were averaged to one data-point. These were then treated as stochastic independent results, which allows for gaussian error estimation.
II.5 Phonon dispersion
The phonopy packageTogo and Tanaka 2015 was used for the calculation of the phonon-dispersion relation, for validation of the energy landscape around the minima of metastable phases, and for the calculation of the free energies using the harmonic approximation. To achieve sufficient accuracy the structures were relaxed until the forces and energies converged below 1e-5eV/Å and 1e-6eV. This was conducted with the DFT implemented in FHI-aims with the PBEsol functional and with the DP model. The phonon dispersion of the no 14 m-phase, no 29 po-phase, and no 137 t-phase were calculated using supercells of size 12. DFT and DP compare very well, which is documented in the Supplemental Material S2.
In total we have used 3 different models: DFT calculations, DP model calculations with the potential learned from DFT, and MD calculations using the DP model.
III Results
III.1 Curie-temperature
Using the phonon-dispersions, the temperature-dependent total energy and entropy were calculated relative to the m-phase, which provides the free energy . The intersection of the free energies and defines the value of the Curie-temperature .

Fig. 4 shows the comparison of the free energies relative to the m-phase for DFT and DP calculations. The data compare well, but the DP energy of the po-phase is about 5 meV/f.u. higher than the ab initio calculation indicating a training error. This error shifts the Curie-temperature to lower value. For the DP model we estimate = 560K, whereas the reported ab initio values are around = 650KAzevedoAntunes et al..
Because the computation of with the MD method is intricate, we calculated only the total energy with MD and compared the resulting statistical averages with values from phonopy using DFT forces. Fig. 4 shows the comparison of the total energies E(po) and E(t) relative to the m-phase from DFT calculations and from MD with DP. The MD results compare well to the DFT results within the gaussian error. Remarkably, the phase transition appears in as a discontinuity at the phase transition temperature . Interesting is that this temperature with = 1000K is larger than the Curie-temperature. Such a behaviour can be expected from the energy landscape when in addition to the lowering of the t-phase free energy with temperature there is an energy barrier present similiar to Fig. 3 which persists at elevated temperatures. A consequence is a bidirectional thermal hysteresis for the phase transitions between the po- to t-phase. A thermal hysteresis in Hf1-xZrxO2 for different stoichiometries of 50-200K has recently been found experimentallySchroeder et al. 2022b. Such a thermal hysteresis is expected for ferroelectric materials and contained in a 6th order Landau-Devonshire effective model Strukov and Levanyuk 1998. But a phase transition temperature for the reverse transition from the t- to the po-phase is also expected from the experimental observation, but not visible in the MD data even at longer simulation times of 50ps, although the ferroelectric phase has a lower free energy as prerequisite. The difficulty to describe the formation of the po-phase in spite of a missing ferroelectric instability, which would be visible in the phonon dispersion, has been discussed by Reyes-Lillo et al.Reyes-Lillo, Garrity, and Rabe 2014 and recently DelodoviciDelodovici, Barone, and Picozzi 2021. The authors identified a multi-phonon coupling as a possible explanation for the transition to the po-phase. Therefore this transition could require a much longer simulation time.
At this point the values of the free energies should be discussed in relation to experimental data. Crystalline ZrO is mostly found either in the m- or in the t-phase. The t-phase is substantially favoured in polycrystaline nanoscale thin films. GarvieGarvie 1965 proposed this to be an effect of a lower surface energy of the t- relative to the m-phase. This observation has been extendedMaterlik, Künneth, and Kersch 2015; Künneth, Materlik, and Kersch 2017 to the po-phase with a prediction of stability windows for the o-phase and the t-phase, depending on the size of the nuclei, which is experimentally confirmedMimura et al. 2021. Furthermore, ZrO at room temperature is t-phase and the po-phase can be stabilized with reduced temperature Müller et al. 2012a; Cheng et al. 2019.
The conclusion for our paper is that the calculated free energy is a model for mono-crystalline or large-grain ZrO with negligible surface effects, and that the free energy in polycrystalline material is shifted by surface energy effects, resulting in t- or po-phase ZrO at room temperature, and a Curie temperature around room temperature.
Polycrystalline, Si-doped HfO with about 5% doping has similarities to polycrystalline ZrO regarding the free energy because the t- and po-phase are competing at room temperatureHoffmann et al. 2015b; Richter et al. 2017. In both materials the Curie-temperature is close to room temperature, whereas in our DP ZrO the Curie-temperature is shifted to about 560K.
After the preliminary investigation of the energy landscape, we conclude that the trained DP model compares well with the DFT results. We have therefore enabled efficient MD simulation for the potentially ferroelectric ZrO.
III.2 Field induced phase-transition and giant piezoelectric effect
The antiferroelectric behaviour in ZrO Müller et al. 2012b has been interpreted as field induced phase transition. The prerequisite is that the free energy of the t-phase is below the ferroelectric phase. While this should be true for the poly-crystalline ZrO, according to ab initio models this is not true for the mono-crystalline material. Furthermore, the t-phase shows no instability from thermal motion within simulation time. With MD we demonstrate that an applied electric field forces an instability and a subsequent phase transition. The electric field values in Table 2 were increased in 0.1MV/cm steps until the phase-transition occurred for each temperature. The size of the field , for the t- to po-phase transition, is nearly constant and is consistent with the size of the energy barrier of about 20meV/f.u. (see Fig. 3) due to the field energy . is the f.u.-volume and the polarization at the transition state, derived from NEB calculation to be about . Interestingly, the required field-strength for the phase transition remains constant for temperatures above , where the free energy of the t-phase lies below the po-phase, and we observe in fact a field induced phase transition. The experimentally measured electric field strengths required for phase transition are in the range of 1-2MV/cm compared to the 3-4MV/cm from our simulation. Although these values are in qualitative agreement, the reasons for the remaining discrepancy are of interest. Possible explanations include the choice of the PBEsol functional compared to others with different energy barriers (see e.g. Guan et al.Guan, Zhang, and Liu 2015), a possible effect of surface energy of a polycrystal on the energy landscape, and lowered energy barriers from intrinsic defects.
The field induced phase transition followed by a volumetric change is the explanation for the giant piezoelectric effect, also proposed to explain the values in many high-strain piezoelectric ceramicsJo et al. 2012; Hao et al. 2019. Beyond the field induced transition to the po-phase reverses to the t-phase when the electric field is reduced, as shown in Fig. 4. Falkowski et al.Falkowski and Kersch 2020 have investigated the volumetric change for doped HfO and ZrO and estimated piezo-strain coefficients assuming a required field of 2MV/cm, and obtained a value of 29pm/V in very good agreement with dataStarschich et al. 2017. In Table 2 we have added the volumetric change in our MD calculation. The resulting piezo-strain coefficient is positive and has a value beyond of 10 pm/V, which is in good agreement with Falkowski taking our larger electric field from the simulation into account.
|
|
|
| |||||||||||
| 300 | 3.5 | 0.54 | 4.7 | |||||||||||
| 400 | 3.6 | 0.47 | 4.2 | |||||||||||
| 500 | 3.6 | 0.41 | 3.2 | |||||||||||
| 600 | 3.5 | 0.36 | 2.9 | |||||||||||
| 700 | 2.9 | 0.32 | 2.3 | |||||||||||
| 800 | 3.2 | 0.30 | 1.5 | |||||||||||
| 900 | 3.3 | 0.28 | 0.9 | |||||||||||
| 1000 | 3.1 | 0.28 | 0 | |||||||||||
| 1100 | 3.3 | 0.29 | 0 | |||||||||||
| 1200 | 3 | 0.31 | 0 |
Whereas the giant piezo-strain effect has the t-phase as initial condition, the conventional piezoelectric effect has the po-phase as initial condition, which leads to negative coefficients. To study the energy landscape, it is of interest to apply a strong external field opposite to the polarization direction causing a phase transition to the t-phase. For low temperatures, the free energy of the po-phase is below the t-phase, and the electric field energy has to overcome the free energy difference plus the height of a possible energy barrier. Table 2 shows the required fields, linearly decreasing with temperature from 4MV/cm at 300K to 0MV/cm at . The field energies to transition the po- to the t-phase compare well to a decrease of the free energy with increasing temperature. The field energy fits well to the barrier height of 50meV/f.u. for the path from po-phase to t-phase (see Fig. 3). In contrast to the t-phase, the po-phase shows an intrinsic instability when the phase transition temperature is approached. This is crucial for a deeper understanding of the piezo-, pyro-, and dielectric-effects close to the phase transition temperature. Although our model does describe a mono-crystalline instead of a poly-crystalline ZrO, we think that the surface effects mainly cause a shift of the po- to t-phase transition temperatureMaterlik, Künneth, and Kersch 2015.
III.3 Thermal expansion of polar-orthorhombic phase
To explore the influence of temperature on the crystal volume, we calculated the thermal expansion coefficients for the t-phase and the m- phase using NPT ensembles, which are in good agreement with experimental dataHaggerty et al. 2014, see Supplemental Material S3. Based on the agreement of these simulations with the experiments, we calculated the anisotropic thermal expansion coefficients for the po-phase up to plotted in Fig. 5. It is important to note that similar to the heat capacity, the coefficients of thermal expansion of crystalline materials must generally vanish when approaching the temperature zero point. Our classical MD calculations reproduce this behaviour only because we use the QTB model, and therefore our predictions match the data well also at low temperatures.

III.4 Piezoelectric stress coefficients
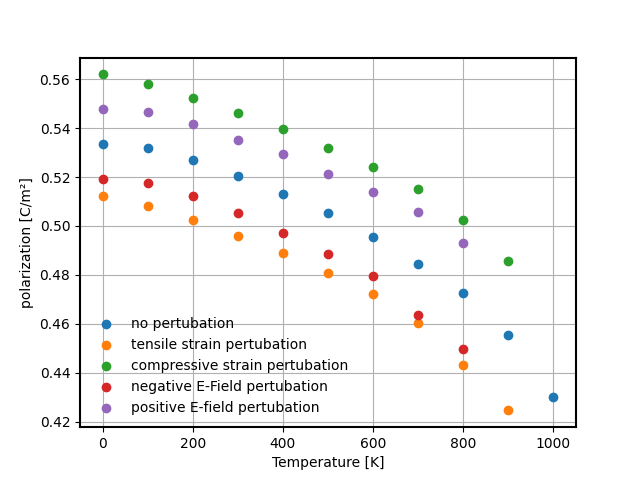
We performed NVT simulations with up to applied uniaxial strains and electric fields up to 1MV/cm along the polarization direction at various temperatures, and determined the polarization. The results in Fig. 6 show generally a decrease of polarization with temperature, and a dependence on strain and electric field perturbation. From such results the pyroelectric, piezoelectric and dielectric coefficients are derived. The polarization of the unperturbed po-phase was calculated in MD simulations with Eq. (3) to be 0.69C/m2, which is larger than the values calculated with the Berry phase methodReyes-Lillo, Garrity, and Rabe 2014. This is because of the in (3) inherent simplified assumption of constant Born charges along the path to the paraelectric reference phase. For a better comparison of our data with experiments and ab initio calculations, we scaled our polarization values to 0.545C/m2, which coincides with the Berry phase calculation with PBEsol from ABINIT.
The piezoelectric stress coefficientsWu, Vanderbilt, and Hamann 2005 describe the change of polarization component with applied strain ( Voigt index) at zero electric field
| (4) |
In ab initio calculations HfO Liu et al. 2019; Dutta et al. 2021 and ZrO show negative piezoelectric coefficients (see Table 3 and Supplemental Material S1), opposed to positive relations between polarization and strain typically observed in ferroelectric perovskites. DuttaDutta et al. 2021 et al. explained the negative sign in HfO from the peculiar chemical bond of the polarizing oxygen atoms to the neighboring Hf atoms, which seems to be similar in ZrO.
| ZrO | HfO | |||||
|---|---|---|---|---|---|---|
| Index | [C/m2] | [C/m2] | [pm/V] | [C/m2] | [C/m2] | [pm/V] |
| 31 | -0.40 | -1.78 | -3.03 | -0.37 | -1.40 | -1.84 |
| 32 | -0.37 | -1.54 | -2.17 | -0.39 | -1.53 | -2.51 |
| 33 | 0.69 | -1.56 | -2.56 | 0.65 | -1.34 | -2.03 |
| 15 | -0.32 | -0.26 | -2.97 | -0.29 | -0.22 | -2.39 |
| 24 | -0.24 | 0.78 | 9.45 | -0.22 | 0.69 | 7.46 |
From the MD simulations and unidirectional strain amplitudes in steps we calculated the polarization derivative using central differences. The results in Fig. 7 show values slightly larger than from ab initio. For example for we obtain -1.9C/m2 compared to an ab initio value of -1.56C/m2. Furthermore the absolute values increase with temperature beyond room temperature. To explain the trend of the MD calculated piezoelectric coefficients being larger than from DFT calculations, we performed near simulations without the QTB model. The results in Fig. 7 show smaller values being close to the DFT results. The QTB model therefore reduces the temperature dependence of the piezoelectric coefficients below 300K.

The increase of the absolute values of the piezoelectric stress coefficients towards the phase transition temperature indicates destabilization of the po-phase. In MD simulation we cannot approach closely because the tensile strained po-phase starts already to decay at 900K into the t-phase. This is a simulation effect because we need finite strain perturbation which increases the instability.
III.5 Piezoelectric strain coefficients
The piezoelectric strain coefficients describe the change of polarization under controlled stress and zero electric field
| (5) |
The coefficients can be obtained according to the first relation by applying stress to the crystal and calculating the response of the polarization, which requires a NPT simulation with a barostat to fix the stress. Using a barostat the error of the resulting polarization becomes larger than for the polarization calculated with a fixed strain. Fig. 8 shows the results as a function of temperature. The values are negative between -2pm/V and -4pm/V and increase with temperature. They are slightly larger than the ab initio results in Table 3, which range from -2pm/V to -3pm/V. Again, this is an effect of the QTB model. The values increase with temperature and become very large when the phase transition temperature is approached. Stable values very close to cannot be obtained because the finite stress perturbation furthermore destabilizes the po-phase. The phase transition at changes the polarization about a very large negative value to zero. But this very large change cannot be interpreted as giant, negative strain coefficient because the transition is irreversible. In contrast, the giant piezoelectric strain coefficient section III.2 has the t-phase as initial state, is positive and is reversible beyond .

Thin film ZrO often consists of a phase mixture of t-phase, po-phase and eventually m-phase grains. Whereas the sign of the piezoelectric coefficient of a single grain depends on the crystal phase, the averaged piezoelectric coefficient of a thin film depends on the phase mixture. For a thin film it is probably difficult to measure a negative piezoelectric coefficient, because this requires a nearly pure po-phase film.
III.6 Pyroelectric coefficient
In ab initio calculations, the pyroelectric coefficients , , are separated into the primary contribution describing the change of polarization at fixed cell parameters and variable temperatures, and the secondary contribution which describes the effect from thermal expansion of the cell together with the change of polarization via the piezoelectric effect.Bernardini, Fiorentini, and Vanderbilt 1997
| (6) |
and have been calculated for HfO from ab initio by LiuLiu et al. 2019. We calculated the with NVT simulations for different temperatures and fixed cell parameters from 0K. This leads to a change in polarization attributed to internal, temperature-dependent rearrangements of the ions. The secondary pyroelectric coefficient was obtained as product of the previously from MD calculated thermal expansion coefficients and piezoelectric stress coefficients. Due to the negative sign of the piezoelectric coefficient, the thermal expansion of the crystal leads to a decrease of the polarization. The peculiarity of ZrO consists in the negative signs of primary and secondary contribution leading to an added effect in total. Both contributions as well as the sum are shown in Fig. 9. The increase of the values with temperature is moderate.
In MD a NPT simulation yields the pyroelectric coefficients directly, without any limiting assumptions
| (7) |
The resulting values shown in Fig. 9 start at zero which is a result of the quantum occupation at low temperature, contained in the QTB model. The values for ZrO are somewhat larger than reported for HfO Liu et al. 2019 and increase significantly beyond these values when the phase transition temperature is approached. The direct calculation shows larger values than from the decomposition. This hints to the assumptions made in deriving eq. 6 as truncated part of some expansion. The simulated large values derive from anharmonic effects and the destabilization of the po-phase. The significant increase of the pyroelectric coefficient when approaching is consistent with the large values which have been found experimentallyMart et al. 2021.
Fig. 9 shows furthermore a negative, giant value obtained beyond after the phase transition has occurred. This hints to values which can be obtained when the phase transition can be reversed. In the experiments of Hoffmann et al.Hoffmann et al. 2015b the polarization change of the po-phase was observed for temperatures around and beyond , and negative, giant values for the pyroelectric coefficients could be derived. But in the experiments the po-phase was recovered with help of electric field-cycling, which spontaneously does not happen beyond . Therefore this giant pyroelectric coefficients cannot be compared with the very large pyroelectric coefficients obtained below .

To get a picture of the polarization change close to the phase-transition, the polarization distribution at different temperatures is plotted, see Fig. 10. The polarization decreases between 0K and 1000K from 0.54C/m2 to 0.43C/m2, which is a reduction of merely 20%.

III.7 Dielectric constant
We performed NPT simulations at different temperatures, applied electrical field perturbation, and obtained the temperature dependent dielectric constant. Fig. 11 shows the results for the t-phase and the po-phase. The dielectric constant of the t-phase matches with =60 ab initio data Fischer and Kersch 2008 and experimental values very well and shows no temperature dependence, again demonstrating the surprising stability at . The dielectric constant of the po-phase, however, shows a low temperature value of =26 and a significant increase with temperature leading to a very large value when is approached. Very large values for have recently been measured for a thin film with HZO in predominatly polar phase, when the phase transition temperature was approachedSchroeder et al. 2022b.

IV Conclusion
In summary, we applied molecular dynamics with a machine learned potential to identify the underlying mechanisms for piezoelectric, pyroelectric and dielectric effects in monocrystalline ZrO. Another motivation was to find an estimate of what values to expect for these coefficients and what circumstances would be required. The developed potential model reproduces and predicts ab initio data very well, but involves their imperfection.
We found the phase transition temperature to govern the overall behaviour. This temperature differs from the Curie-temperature and results from the inherent kinetic energy barriers between the po-phase and the t-phase. The barrier depends in simulation quantitatively on the chosen density functional. We could distinguish the genuine piezoelectric effects with negative coefficients increasing towards which requires the po-phase, from the giant piezoelectric strain effect. The latter is positive, involves a field-induced phase transition and requires the t-phase. The measured large positiveKirbach, Kühnel, and Weinreich 2018 and negativeMart et al. 2021 values can be attributed to these effects. In a phase mixed polycrystalline thin film effects of both sign should coexist and the positive effect should mostly dominate. The largest possible piezoelectric coefficients would result from the giant effect under the conditions of maximal t-phase content. A further optimization would result from maximizing the volume changeFalkowski and Kersch 2020 and simultaneously minimizing the kinetic barrier for the required electric field, possibly with doping.
The direct simulation of the pyroelectric coefficient compared to the simulation of the primary and secondary contribution revealed, that the enhancement of the effect with temperature is related to anharmonic effects not contained in the defining truncated expression. The simulated pyroelectric coefficients increase significantly towards the phase transition temperature which fits well to the experimentally observed values. The largest pyroelectric coefficients should be achieved with a film of largest po-content, and a temperature closest to . Further effects from doping which increase the anharmonic contributions have already been demonstrated exemplarily by LiuLiu et al. 2019. Crossing the phase transition temperature does not lead to the giant pyroelectric coefficient, because the po-phase does not recover without an action. An electric field is required to complete the recovery of the po-phase, which matches the circumstances of the observation of giant piezoelectricity by HoffmannHoffmann et al. 2015a.
Regarding the dielectric constant, we found no dielectric enhancement for the t-phase approaching the phase transition temperature, which convincingly demonstrates the stability of the t-phase, and leaves us with the puzzle of the po-phase formation from a tetragonal precursor phase. The po-phase, however, showed a significant dielectric enhancement, close to a singularity at . This surprising observation has been done recently in experiments in Hf1-xZrxO2 and is expected for a proper ferroelectric material like the classical BaTiO3 ferroelectric. The explanation from our simulation is an energy landscape with a barrier for the transition from t-phase to po-phase below , but no barrier for the transition from po-phase to t-phase above .
It is expected that the insights gained from the simulations with ZrO can be transferred to HfO and the doped materials. Most important is here the polar to tetragonal phase transition temperature , and the phase mixture. Further effects on the phase transition temperature are expected from size effects resulting from the grains in polycristalline films.
Acknowledgements.
Luis Azevedo Antunes and Richard Ganser received funding from the Deutsche Forschungsgemeinschaft (German Research Foundation) in the frame of the project "Zeppelin" (Project KE 1665/5-1). The authors gratefully acknowledge the Leibniz Supercomputing Centre for funding this project by providing computing time on its Linux-Cluster.References
- Schroeder, Hwang, and Funakubo (2019) U. Schroeder, C. S. Hwang, and H. Funakubo, eds., Ferroelectricity in Doped Hafnium Oxide: Materials, Properties and Devices, Woodhead Publishing Series in Electronic and Optical Materials (Woodhead Publishing, 2019).
- Mikolajick et al. (2018) T. Mikolajick, S. Slesazeck, M. H. Park, and U. Schroeder, “Ferroelectric hafnium oxide for ferroelectric random-access memories and ferroelectric field-effect transistors,” MRS Bulletin 43, 340–346 (2018).
- Hoffmann et al. (2019) M. Hoffmann, F. Fengler, M. Herzig, T. Mittmann, B. Max, U. Schroeder, R. Negrea, P. Lucian, S. Slesazeck, and T. Mikolajick, “Unveiling the double-well energy landscape in a ferroelectric layer,” Nature 565, 464–467 (2019).
- Kirbach, Kühnel, and Weinreich (2018) S. Kirbach, K. Kühnel, and W. Weinreich, “Piezoelectric hafnium oxide thin films for energy-harvesting applications,” 2018 IEEE 18th International Conference on Nanotechnology (IEEE-NANO) , 1–4 (2018).
- Jachalke et al. (2018) S. Jachalke, T. Schenk, M. H. Park, U. Schroeder, T. Mikolajick, H. Stö̈cker, E. Mehner, and D. C. Meyer, “Pyroelectricity of silicon-doped hafnium oxide thin films,” Applied Physics Letters 112, 142901 (2018).
- Schroeder et al. (2022a) U. Schroeder, M. H. Park, T. Mikolajick, and C. S. Hwang, “The fundamentals and applications of ferroelectric hfo2,” Nature Reviews Materials (2022a), 10.1038/s41578-022-00431-2.
- Hoffmann et al. (2015a) M. Hoffmann, U. Schroeder, T. Schenk, T. Shimizu, H. Funakubo, O. Sakata, D. Pohl, M. Drescher, C. Adelmann, R. Materlik, A. Kersch, and T. Mikolajick, “Stabilizing the ferroelectric phase in doped hafnium oxide,” Journal of Applied Physics 118, 072006 (2015a).
- Batra et al. (2017) R. Batra, T. D. Huan, G. A. Rossetti, and R. Ramprasad, “Dopants Promoting Ferroelectricity in Hafnia: Insights From a Comprehensive Chemical Space Exploration,” Chem. Mater. 29, 9102–9109 (2017), 1707.04211 .
- Materlik et al. (2018) R. Materlik, C. Künneth, M. Falkowski, T. Mikolajick, and A. Kersch, “Al-, Y-, and La-Doping Effects Favoring Intrinsic and Field Induced Ferroelectricity in HfO2: A First Principles Study,” J. Appl. Phys. 123, 164101 (2018).
- Mart et al. (2020) C. Mart, T. Kämpfe, R. Hoffmann, S. Eßlinger, S. Kirbach, K. Kühnel, M. Czernohorsky, L. M. Eng, and W. Weinreich, “Piezoelectric response of polycrystalline silicon-doped hafnium oxide thin films determined by rapid temperature cycles,” Advanced Electronic Materials 6, 1901015 (2020).
- Jo et al. (2012) W. Jo, R. Dittmer, M. Acosta, J. Zang, C. Groh, E. Sapper, K. Wang, and J. Rödel, “Giant Electric-Field-Induced Strains in Lead-Free Ceramics for Actuator Applications - Status and Perspective,” J. Electroceram. 29, 71–93 (2012).
- Hao et al. (2019) J. Hao, W. Li, J. Zhai, and H. Chen, “Progress in High-Strain Perovskite Piezoelectric Ceramics,” Mater. Sci. Eng., R 135, 1–57 (2019).
- Falkowski and Kersch (2020) M. Falkowski and A. Kersch, “Optimizing the piezoelectric strain in zro2- and hfo2-based incipient ferroelectrics for thin-film applications: An ab initio dopant screening study,” ACS Applied Materials & Interfaces 12, 32915–32924 (2020).
- Liu et al. (2019) J. Liu, S. Liu, L. H. Liu, B. Hanrahan, and S. T. Pantelides, “Origin of pyroelectricity in ferroelectric hfo2,” Phys. Rev. Applied 12, 034032 (2019).
- Dutta et al. (2021) S. Dutta, P. Buragohain, S. Glinsek, C. Richter, H. Aramberri, H. Lu, U. Schroeder, E. Defay, A. Gruverman, and J. Íñiguez, “Piezoelectricity in hafnia,” Nature Communications 12, 7301 (2021).
- Hoffmann et al. (2015b) M. Hoffmann, U. Schroeder, C. Künneth, A. Kersch, S. Starschich, U. Böttger, and T. Mikolajick, “Ferroelectric phase transitions in nanoscale hfo2 films enable giant pyroelectric energy conversion and highly efficient supercapacitors,” Nano Energy 18, 154–164 (2015b).
- Materlik, Künneth, and Kersch (2015) R. Materlik, C. Künneth, and A. Kersch, “The origin of ferroelectricity in Hf1-xZrxO2: A computational investigation and a surface energy model,” Journal of Applied Physics 117, 134109 (2015).
- Künneth, Materlik, and Kersch (2017) C. Künneth, R. Materlik, and A. Kersch, “Modeling Ferroelectric Film Properties and Size Effects from Tetragonal Interlayer in Hf1-xZrxO2 Grains,” J. Appl. Phys. 121, 205304 (2017).
- Mart et al. (2021) C. Mart, T. Kämpfe, K. Kühnel, M. Czernohorsky, S. Kolodinski, M. Wiatr, W. Weinreich, and L. M. Eng, “Enhanced pyroelectric response at morphotropic and field-induced phase transitions in ferroelectric hafnium oxide thin films,” APL Materials 9, 051120 (2021).
- Liu and Pantelides (2018) J. Liu and S. T. Pantelides, “Mechanisms of pyroelectricity in three- and two-dimensional materials,” Phys. Rev. Lett. 120, 207602 (2018).
- Wu et al. (2021) J. Wu, Y. Zhang, L. Zhang, and S. Liu, “Deep learning of accurate force field of ferroelectric ,” Phys. Rev. B 103, 024108 (2021).
- Han et al. (2018) J. Han, L. Zhang, R. Car, and W. E, “Deep potential: A general representation of a many-body potential energy surface,” Communications in Computational Physics 23, 629–639 (2018).
- Zhang et al. (2018) L. Zhang, J. Han, H. Wang, R. Car, and W. E, “Deep potential molecular dynamics: A scalable model with the accuracy of quantum mechanics,” Phys. Rev. Lett. 120, 143001 (2018).
- Giannozzi (2009) P. Giannozzi, “Quantum espresso: a modular and open-source software project for quantum simulations of materials,” J.Phys.: Condens. Matter 21, 395502 (2009).
- Perdew et al. (2008) J. P. Perdew, A. Ruzsinszky, G. I. Csonka, O. A. Vydrov, G. E. Scuseria, L. A. Constantin, X. Zhou, and K. Burke, “Restoring the density-gradient expansion for exchange in solids and surfaces,” Phys. Rev. Lett. 100, 136406 (2008).
- Han Wang and E. (2018) J. H. Han Wang, Linfeng Zhang and W. E., “Deepmd-kit: A deep learning package for many-body potential energy representation and molecular dynamics.” Computer Physics Communications 228, 178–184 (2018).
- Blum et al. (2009) V. Blum, R. Gehrke, F. Hanke, P. Havu, V. Havu, X. Ren, K. Reuter, and M. Scheffler, “Ab Initio Molecular Simulations with Numeric Atom-Centered Orbitals,” Comput. Phys. Commun. 180, 2175–2196 (2009).
- Kersch and Falkowski (2021) A. Kersch and M. Falkowski, “New low-energy crystal structures in zro2 and hfo2,” physica status solidi (RRL) – Rapid Research Letters 15, 2100074 (2021).
- Plimpton (1995) S. Plimpton, “Fast parallel algorithms for short-range molecular dynamics,” J. Comput. Phys. 117, 1–19 (1995).
- Dammak et al. (2009) H. Dammak, Y. Chalopin, M. Laroche, M. Hayoun, and J. J. Greffet, “Quantum Thermal Bath for Molecular Dynamics Simulation,” Physical Review Letters 103, 190601 (2009).
- Klarbring, Skorodumova, and Simak (2018) J. Klarbring, N. V. Skorodumova, and S. I. Simak, “Finite-temperature lattice dynamics and superionic transition in ceria from first principles,” Physical Review B 97, 104309 (2018).
- Togo and Tanaka (2015) A. Togo and I. Tanaka, “First principles phonon calculations in materials science,” Scripta Materialia 108, 1–5 (2015).
- (33) L. AzevedoAntunes, R. Ganser, C. Kuenneth, and A. Kersch, “Characteristics of low-energy phases of hafnia and zirconia from density functional theory calculations,” physica status solidi (RRL) – Rapid Research Letters n/a, 2100636, https://onlinelibrary.wiley.com/doi/pdf/10.1002/pssr.202100636 .
- Schroeder et al. (2022b) U. Schroeder, T. Mittmann, M. Materano, P. D. Lomenzo, P. Edgington, Y. H. Lee, M. Alotaibi, A. R. West, T. Mikolajick, A. Kersch, and J. L. Jones, “Temperature-dependent phase transitions in hfxzr1-xo2 mixed oxides: Indications of a proper ferroelectric material,” Advanced Electronic Materials (2022b).
- Strukov and Levanyuk (1998) B. A. Strukov and A. P. Levanyuk, Ferroelectric Phenomena in Crystals (Springer, 1998).
- Reyes-Lillo, Garrity, and Rabe (2014) S. E. Reyes-Lillo, K. F. Garrity, and K. M. Rabe, “Antiferroelectricity in thin-film ZrO2 from first principles,” Phys. Rev. B 90, 140103 (2014).
- Delodovici, Barone, and Picozzi (2021) F. Delodovici, P. Barone, and S. Picozzi, “Trilinear-coupling-driven ferroelectricity in ,” Phys. Rev. Materials 5, 064405 (2021).
- Garvie (1965) R. C. Garvie, “The occurrence of metastable tetragonal zirconia as a crystallite size effect,” The Journal of Physical Chemistry 69, 1238–1243 (1965).
- Mimura et al. (2021) T. Mimura, T. Shimizu, O. Sakata, and H. Funakubo, “Thickness dependence of phase stability in epitaxial films,” Phys. Rev. Materials 5, 114407 (2021).
- Müller et al. (2012a) J. Müller, T. S. Böscke, U. Schröder, S. Mueller, D. Bräuhaus, U. Böttger, L. Frey, and T. Mikolajick, “Ferroelectricity in simple binary ZrO2 and HfO2,” Nano Letters 12, 4318–4323 (2012a).
- Cheng et al. (2019) P. Cheng, Y. Yin, I. Tsai, and et al., “Negative capacitance from the inductance of ferroelectric switching,” Communications Physics 2, 32 (2019).
- Richter et al. (2017) C. Richter, T. Schenk, M. H. Park, F. A. Tscharntke, E. D. Grimley, J. M. LeBeau, C. Zhou, C. M. Fancher, J. L. Jones, T. Mikolajick, and U. Schroeder, “Si doped hafnium oxide—a “fragile” ferroelectric system,” Advanced Electronic Materials 3, 1700131 (2017).
- Müller et al. (2012b) J. Müller, T. S. Böscke, U. Schröder, S. Mueller, D. Bräuhaus, U. Böttger, L. Frey, and T. Mikolajick, “Ferroelectricity in simple binary ZrO2 and HfO2,” Nano Letters 12, 4318–4323 (2012b).
- Guan, Zhang, and Liu (2015) S.-H. Guan, X.-J. Zhang, and Z.-P. Liu, “Energy landscape of zirconia phase transitions,” Journal of the American Chemical Society 137, 8010–8013 (2015).
- Starschich et al. (2017) S. Starschich, T. Schenk, U. Schroeder, and U. Boettger, “Ferroelectric and piezoelectric properties of Hf1-xZrxO2 and pure ZrO2 films,” Applied Physics Letters 110, 182905 (2017).
- Haggerty et al. (2014) R. P. Haggerty, P. Sarin, Z. D. Apostolov, P. E. Driemeyer, and W. M. Kriven, “Thermal Expansion of HfO2 and ZrO2,” Journal of the American Ceramic Society 97, 2213–2222 (2014).
- Wu, Vanderbilt, and Hamann (2005) X. Wu, D. Vanderbilt, and D. R. Hamann, “Systematic treatment of displacements, strains, and electric fields in density-functional perturbation theory,” Physical Review B 72, 035105 (2005), 0501548 .
- Bernardini, Fiorentini, and Vanderbilt (1997) F. Bernardini, V. Fiorentini, and D. Vanderbilt, “Spontaneous polarization and piezoelectric constants of III-V nitrides,” Physical Review B 56, R10024 (1997).
- Fischer and Kersch (2008) D. Fischer and A. Kersch, “The effect of dopants on the dielectric constant of hfo2 and zro2 from first principles,” Applied Physics Letters 92, 012908 (2008).