Consistent and fast inference in compartmental models of epidemics using Poisson Approximate Likelihoods
Abstract
Addressing the challenge of scaling-up epidemiological inference to complex and heterogeneous models, we introduce Poisson Approximate Likelihood (PAL) methods. In contrast to the popular ODE approach to compartmental modelling, in which a large population limit is used to motivate a deterministic model, PALs are derived from approximate filtering equations for finite-population, stochastic compartmental models, and the large population limit drives consistency of maximum PAL estimators. Our theoretical results appear to be the first likelihood-based parameter estimation consistency results which apply to a broad class of partially observed stochastic compartmental models and address the large population limit. PALs are simple to implement, involving only elementary arithmetic operations and no tuning parameters, and fast to evaluate, requiring no simulation from the model and having computational cost independent of population size. Through examples we demonstrate how PALs can be used to: fit an age-structured model of influenza, taking advantage of automatic differentiation in Stan; compare over-dispersion mechanisms in a model of rotavirus by embedding PALs within sequential Monte Carlo; and evaluate the role of unit-specific parameters in a meta-population model of measles.
1 Introduction
Compartmental modelling is one of the most widespread methods for quantifying the dynamics of infectious diseases in populations, rooted in the works of McKendrick and Kermack in the 1920’s [49, 37], [9, 8] and [35], see [33] for an overview. In this modelling paradigm individuals in a population transition between a collection of discrete compartments, usually representing disease states, where the rates of transition may depend on the current state of the population as a whole as well as possibly unknown parameters. This provides an interpretable, mechanistic framework in which to infer epidemic characteristics such as reproduction numbers, forecast disease dynamics and explore the possible impacts of public health interventions. Compartmental models are also popular in ecology and biochemistry, for example, [42, 21], but that is beyond the scope of the present work.
The earliest formulated compartmental models of epidemics consist of a small number of compartments, just three in the standard Susceptible-Infected-Recovered (SIR) model. Modern compartmental models often feature many more compartments, each corresponding to some combination of disease state and other variates. By increasing the number of compartments, the modeller can specify a more precise representation of complex diseases and populations, such as multi-strain dynamics [70], subpopulations associated with, e.g., households or age-groups [3], and spatial information [71]. Modelling such features is considered a key challenge by epidemiologists [7, 23, 57, 69].
However, the computational cost of fitting compartmental models to data, in general, grows with the number of compartments and also, in the cases of some methods, with the population size. Exact likelihood-based inference is intractable in general and approximate inference typically either involves deleterious model simplifications or involves highly sophisticated algorithms which incur a substantial computational cost. Thus scaling-up inference to complex models is an important and open challenge – this is the motivation for the present work.
Compartmental models come in various forms, some stochastic, some deterministic; some in continuous time, some in discrete time; some modelling finite populations, some motivated by large population asymptotics. Deterministic, ODE-based compartmental models are very popular in practice and often motivated by the fact they can be obtained from finite-population stochastic models in the large population limit. As a very simple example, consider the continuous-time, stochastic version of the SEIR model, with fixed population size and numbers of susceptible, exposed, infective and removed individuals denoted . Each susceptible individual becomes exposed at instantaneous rate , each exposed individual becomes infective at rate , each infective individual is “removed” at rate , and is a jump-Markov process. General results concerning the convergence of jump-Markov processes to the solutions of ODE’s [43, 44] can be applied to show that, if in probability, then for any and ,
| (1.1) |
where , , solves:
| (1.2) |
It follows from together with and (1.2), that for all . In order to use this ODE to model a population of size , is scaled back up by a factor of , , which satisfies the form of SEIR ODE usually encountered in practice:
| (1.3) |
To relate or to data, for example, error-prone measurements of the number of newly infective individuals in given time periods, one usually postulates a probabilistic observation model, and evaluation of the likelihood function for the parameters then involves marginalizing out in the case of the finite population stochastic model, which is intractable, or numerical approximation to in the case of the ODE.
Note here that the only way that depends on is through the scaling factor . This, along with the lack of stochasticity, illustrates the simplicity but inflexibility of the ODE approach to compartmental modelling. Indeed it has been recognized that ODE models cannot capture important epidemiological phenomena such as fade-out, extinction, lack of synchrony, or deviations from stable behaviour [60, Sec. 8] and, somewhat more obviously, may under-represent uncertainty [38].
To summarise the above, consider the following conceptual workflow:
- ODE 1.
specify a finite population, stochastic, continuous-time compartmental model ;
- ODE 2.
scale by and take the large population limit to obtain ;
- ODE 3.
re-scale by to obtain on the appropriate scale for a population of size ;
- ODE 4.
numerically approximate and combine with an observation model to evaluate the likelihood function.
Of course in practice, someone can use the ODE model (1.3) without knowing anything about steps ODE 1.-3. We write out these steps in order to emphasize how the ODE approach differs to the PAL methods proposed in the present work, where crucially the limit is taken later in the conceptual workflow:
- PAL 1.
specify a finite population, stochastic, discrete-time compartmental model;
- PAL 2.
combine this model with an observation model to obtain discrete-time filtering equations;
- PAL 3.
recursively approximate the filtering equations using Poisson distributions, thus defining the PAL;
- PAL 4.
take the large population limit, , to establish the consistency of the parameter estimator obtained by maximizing the PAL.
The Latent Compartmental Model we work with is introduced in section 3. It allows the probabilities of individuals transitioning between compartments to depend on the state of the population as a whole in a quite general way, as well as allowing for immigration and emigration, constant or random and dynamic population size. Due to the general form of this compartmental model, we can treat classical disease states, such as SEIR, as well as discrete covariates or subpopulations such as spatial locations or age-groups, in a single framework. Also in section 3, we introduce two types of observation models: one for prevalence data, allowing for under-reporting, mis-reporting and spurious measurements; and one for incidence data, including incidence data which are aggregated in time. In section 4 we introduce recursive Poisson approximations of filtering equations which lead us to PALs. The algorithms used to compute PALs involve only elementary linear algebra operations. Evaluating PALs up to a constant independent of parameter values as is sufficient for optimization, or evaluating ratios of PALs as arises in MCMC algorithms, has computational cost independent of population size. In section 5 we state our main theoretical results concerning consistency of maximum PAL estimators in the large-population regime, and outline the main steps in the proof. As part of the proof we obtain novel results about asymptotically accurate filtering. Section 6 discusses how over-dispersion can be handled by numerically integrating out latent variables using sequential Monte Carlo. In section 7 we demonstrate various aspects of our methodology and connections to our theory in the context of simulated and real data sets. Opportunities for future research are described in section 7.5.
2 Connections to the literature
Poisson process approximations
Recursive approximation of filtering distributions using Poisson processes underlies the so-called Probability Hypothesis Density (PHD) filter of [48], subsequently re-derived and generalized by [61, 13]. A specific but epidemiologically uninteresting (as we shall explain in section 3.2) case of one model we consider in section 4.1 coincides with a discrete-state version of the model considered in these works and the corresponding special case of our algorithm 1 would coincide with a discrete-state version of the PHD filter. The incidence data model we define in sections 3.3.2 and 3.3.3 is however different, and particularly important for epidemiological data. Parameter estimation using the PHD filter in spatial multi-target models was suggested by [62] but without any rigorous justification and the authors are not aware of any theoretical results concerning parameter estimation consistency using the PHD filter. Approximate filtering for a limited class of epidemic models using multinomial rather than Poisson approximations was proposed by [68], but without any consistency theory.
Inference algorithms for stochastic compartmental models
Evaluating the likelihood function for finite-population, stochastic compartmental models involves marginalizing out over the set of all possible configurations of the population amongst the compartments. The cost of this summation explodes with the number of compartments and the population size. This has prompted the development of a variety of simulation-based inference methods: Data Augmentation MCMC [25, 54, 53, 45, 22, 51], Approximate Bayesian Computation (ABC) [64, 50] and Sequential Monte Carlo (SMC) [5, 30, 20, 41, 34]. If one can simulate from the model, then in principle, one can apply the ABC and SMC methods. However, in practice there are usually algorithmic parameters to tune and the computational cost of the simulation usually scales up with both the number of compartments and population size, making these techniques very computationally intensive in general.
A functional central limit theorem associated with (1.1) due to [44] gives rise to an SDE known as the Linear Noise Approximation (LNA), see e.g., [21, 42]. Evaluating the Gaussian transition density of the LNA involves solving an ODE for its mean vector and covariance matrix. If combined with a linear-Gaussian observation model, the cost of a marginal likelihood evaluation scales with the third power of the number of compartments in general. Other varieties of SDE-based approximations to finite-population stochastic compartmental models have been proposed [1], but their transition probabilities are usually not available in closed form and generally costly simulation-based methods are relied upon to fit these models to data [59, 15].
Parameter estimation consistency results for compartmental models
The literature on consistency of parameter estimation in the large population limit is focused on specific instances of compartmental models for which inferential calculations can be made in closed form, such as the continuous-time SIR model in which all infection and removal times are observed [10], [2, Ch. 9], or only the initial and final states of the population are observed [2, Ch. 10], estimating the Malthusian parameter in an SEIR model [47], or in an SIR model [12]. There appears to be a lack of consistency results for likelihood-based estimators for more general classes of compartmental models. Many stochastic compartmental models of epidemics are transient, in the sense that with probability one the entire population eventually ends up in one compartment and stays there, such as the R compartment in SIR. For this reason it seems that the asymptotic regime of a finite, fixed population size and increasingly long time horizon is not a fruitful regime in which to study consistency of parameter estimators for many epidemic models. One unusual case is the Susceptible-Infective-Susceptible model, see [27] for an analysis in the regime where the time horizon tends to infinity, though for any finite population this epidemic will eventually go extinct.
3 Models
3.1 Notation
The set of natural numbers, including , is denoted . The set of non-negative real numbers is denoted . For an integer , . Matrices and vectors are denoted by bold upper-case and bold lower-case letters, respectively, e.g., and , with non-bold upper-case and lower case used for their respective elements , . All vectors are column vectors unless stated otherwise. We use to denote the vector of ’s and to denote the vector of ’s. The indicator function is denoted . The element-wise product of matrices and vectors are denoted and respectively, the element-wise division of matrices and vectors are denoted and respectively, the outer product of vectors is denoted . The logarithm , factorial , and exponential are taken element-wise. For we define if , i.e. normalizes to yield a probability vector; and if .
For and we write to denote that the elements of are independent and element is Poisson distributed with parameter . We shall say that such a random vector has a “vector-Poisson distribution”. For a probability vector we write for the associated multinomial distribution. Similarly, for a random matrix and a matrix , we write when the elements of are independent with being Poisson distributed with parameter . We call (resp. ) the intensity vector (resp. matrix). For a length- vector with nonnegative elements, we call the support of . By convention, we take a sum over an empty set to be equal to , i.e. a sum of terms. We write for the vector of zeros except for a in the th entry.
3.2 Latent Compartmental Model
The model we consider is defined by: , the number of compartments; the expected initial population size; an initial distribution on such that , e.g., for some such that , or for some length- probability vector ; a sequence, with for all , of immigration intensity vectors; a sequence, with for all ; and for each a mapping from length- probability vectors to size- row-stochastic matrices, .
The population at time is a set of a random number of random variables , each valued in . The counts of individuals in each of the compartments at time are collected in , where The population is initialised as a draw . The members of the population are exchangeable, labelled by, e.g., a uniformly random assignment of indices subject to For , given , we obtain and as follows. For , with probability the individual emigrates from to a state from which it does not return. The counts of remaining individuals are collected in the vector , where and .
For each such that , i.e. a remaining individual, is then drawn from the ’th row of and the resulting counts of individuals in the compartments are denoted where , if then . Let be the matrix with elements which counts the individuals transitioning from compartment at to compartment at time . New individuals then immigrate into the compartments according to a vector-Poisson distribution and the resulting combined counts of individuals are with . The population is then obtained by uniformly random assignment of indices subject to . Note that under this model, the processes and are Markov chains, although we shall not need explicit expressions for their transition probabilities.
If the matrix were to have no dependence on , then the Latent Compartmental Model is a discrete-state version of the dynamic spatial Poisson-process model underlying the PHD filter [48, 61, 13]. However, for epidemiological modelling it is critical that does depend on ; for example in the case of SEIR as we shall now state, it is this dependence which models the mechanism of infection amongst the population.
SEIR example
As a very simple example of the Latent Compartmental Model consider the SEIR model:
With conditionally independent, binomially distributed random variables:
where is a time-step size. With no immigration or emigration, this model is cast as an instance of the model from section 3.2 by taking , identifying and:
| (3.1) |
3.3 Observation Models
3.3.1 Prevalence data
Epidemiological prevalence data pertain to the overall levels of susceptibility, exposure and infectivity in the population. In the context of the Latent Compartmental Model, such data are related to the counts of individuals in each compartment at given points in time, i.e., . The observation at time is an -length vector distributed as follows. With a vector , for each each individual in compartment is independently detected with probability , and the counts of detected individuals are collected in a vector , i.e.,
| (3.2) |
With a row-stochastic matrix of size , each individual detected in compartment is independently reported in compartment with probability . The counts of these reported individuals are collected in an -length vector . The off-diagonal elements of the matrix can be interpreted as the probabilities of mis-reporting between compartments. Then the observation is given by:
where independently for , which can be interpreted as additive error counts. In epidemiological data usually only individuals associated with some subset of compartments are detected, and only at certain times. If individuals in say compartment are not observed at time , then for inference we will set and .
More detailed interpretation of this observation model, in terms of e.g. epidemiological testing of the population, probability of false positives, etc., will be specific to the context in which the Latent Compartmental Model is applied. We provide discussion of this point illustrated by example in section C.2 of the supplementary material.
3.3.2 Incidence data
Epidemiological measurements often involve data related to the number of newly infective or recovered individuals over given time periods – known as incidence data. In order to model such data, generalized to allow for transitions from any compartment to any compartment, we consider an observation at time which is an matrix . The elements of are conditionally independent given , and with a matrix ,
| (3.3) |
Similarly to the case of prevalence data, if are missing, then for inference we set and . One could extend this model to incorporate mis-reporting and/or additive error counts in a similar manner to in section 3.3.1, but for simplicity of presentation we do not do so.
In the context of the SEIR model, for example, the variable models the number of individuals which are newly infective at time , i.e. the count of the number of individuals which have transitioned from time to , subject to random under-reporting parameterized by .
3.3.3 Aggregated incidence data
In some situations it is desirable to model observations as in section 3.3.2, but with transitions of individuals between compartments occurring on a finer time-scale than observations. For example, consider the SEIR model and suppose each discrete time step corresponds to one week. Then the model in (3.1) assigns zero probability to a transition in one week: in order to transition between , an individual must transit and then , but at least two discrete time steps are needed for that to occur with positive probability. Similarly, transitions in one week happen with zero probability. To model incidence data as in section 3.3.2 but allowing for these sort of multi-step transitions between observation times, we introduce a sequence of increasing integer observation times where . We then define , where are distributed as per section 3.3.2. This model coincides with the model from that section in the case that , we present these two models separately in order to help present a step-by-step explanation in section 4 of the corresponding filtering recursions.
In the context of the SEIR model, models the total number of individuals which have become infective between times and , subject to random under-reporting. If , this allows for two-step transitions of the form or to occur with positive probability between observations times.
4 Filtering recursions and Poisson Approximate Likelihoods
Our next objective is to state and explain the filtering recursions which are used to compute PALs. In section 4.1 we give the filtering recursion and PAL for the Latent Compartmental Model combined with the prevalence data model from section 3.3.1, we refer to this combination as case (I). In section 4.2 we give filtering recursions for a simplified case of the Latent Compartmental Model in which for , , and for all , i.e. no emigration or immigration, combined with the incidence data model from sections 3.3.2 and 3.3.3. We refer to this as case (II). We discuss the filtering recursions in case (II) with and only for ease of exposition. By expanding on the derivations we give in the following sections, the reader could obtain without great difficulty the filtering recursions for case (II) in the full generality of the Latent Compartmental Model and in section 7.4 we consider an example involving immigration, emigration and incidence data as an illustration.
Below we state a collection of lemmas which formalize the derivations of the steps in filtering recursions. The proofs, given in section A of the supplementary materials, rely on moment generating functions and some techniques from the theory of Poisson processes [40].
4.1 Case (I)
In this case, the observations follow the model from section 3.3.1. The pair of processes and constitutes a hidden Markov model: is a Markov chain, and are conditionally independent given with the conditional distribution of given depending only on . Therefore the filtering distributions , obey a two-step recursion, with steps canonically referred to as “prediction” and “update”:
where, for ,
| (4.1) | ||||
| (4.2) | ||||
| (4.3) |
and here and below, by convention, conditioning on is understood to mean no conditioning, . The marginal likelihood of the observations can be written:
| (4.4) |
The general idea of the PAL is to obtain vector-Poisson distribution approximation to each of the terms and , , computed via vector-Poisson approximations to each of the filtering distributions and .
Approximating the prediction step
For time step we take a vector-Poisson approximation to the initial distribution by setting and . For , suppose we have obtained and so defined a vector-Poisson approximation to . In order to derive a vector-Poisson approximation to , we need to consider the operation (4.1) in more detail, in accordance with the definition of the Latent Compartmental Model. We shall not need an explicit formula for the transition probabilities , but rather work with the intermediate quantities introduced in section 3.2.
For and a length- probability vector , let be the probability mass function of where the th row of has distribution . Then we have:
| (4.5) | ||||
| (4.6) |
where is related to by . The summation in (4.6) is too expensive to compute in general. To define an approximation which circumvents this issue, in (4.6) we replace by its approximation , and replace by where this expectation is under . Lemma 1 explains the rationale for making the vector-Poisson approximation
Lemma 1.
Suppose that for and for . Then Furthermore, if is the probability mass function associated with and is the expected value under , then is the probability mass function associated with .
The proof is given in section A of the supplementary material. As per the definition of the Latent Compartmental Model, is obtained by summing with where . Since the sum of independent Poisson random variables is also Poisson with intensity given by the sum of the intensities, we then take the approximation
Approximating the update step
In order to obtain a vector-Poisson approximation to we substitute in place of in (4.2), which can be viewed as an application of Bayes’ rule, and we shall define to be the mean vector of the resulting distribution. Lemma 2 can be applied to calculate in accordance with this recipe, leading us to:
Lemma 2 also tells us how to obtain a vector-Poisson approximation to .
Lemma 2.
Suppose that for given and let be a vector with conditionally independent elements distributed for given . For a row-stochastic matrix and an matrix with rows distributed , let and where for a given . Then:
| (4.7) |
and , i.e.,
with the convention .
The proof is given in section A of the supplementary material.
Computing the PAL
Gathering together the approximations discussed above we arrive at the following algorithm.
If, at line of algorithm 1, we encounter in performing the element-wise division operation we set the vector element in question to , which is in accordance with . At line 5 of algorithm 1 we apply the convention , in accordance with .
Mimicking (4.4), the log PAL associated with algorithm 1 is:
| (4.8) |
It is important to note that the term in calculated in algorithm 1 has no dependence on the ingredients of the model, i.e., , , etc. and so in practice if one is computing the PAL in order to maximize it with respect to parameters of the model, or evaluate PAL ratios for different parameter values, the term never needs to be computed.
4.2 Case (II)
In this case we consider the Latent Compartmental Model with with probability , and for all , i.e. no emigration or immigration, and with the observations following the model from section 3.3.3. For ease of exposition we start with the special case that , in which case and the model from section 3.3.3 reduces to that from section 3.3.2.
To derive the filtering recursions we follow a similar programme to case (I), starting from the fact that the pair of processes and constitutes a hidden Markov model, and approximating the following prediction and update operations:
Approximating the prediction step when
For and a length- probability vector , let be the probability mass function of a random matrix, say , such that with probability and such that given the row sums , the rows of are conditionally independent with the conditional distribution of the row being . By construction is equal to for case (II), hence
| (4.9) | ||||
| (4.10) |
Assuming we have already computed such that , we substitute this approximation in to (4.10) and replace by where this expectation is under . Lemma 3 explains the rationale for then making the approximation:
Lemma 3.
If for a given matrix , is the probability mass function associated with and is the expected value of where , then is the probability mass function associated with , where .
The proof is given in section A of the supplementary material.
Approximating the update step when
We now apply Bayes’ rule to and shall define to be the mean vector of the resulting distribution. Lemma 4 shows how to do this, leading to:
Lemma 4.
Suppose that for some , and that for some , given , is a matrix with conditionally independent entries distributed: , then the conditional distribution of given is that of where:
i.e.,
and , i.e,
with the convention .
The proof is given in section A of the supplementary material.
Computing the PAL when
Combining the above prediction and update approximations we arrive at algorithm 2.
In algorithm 2 we adopt the same convention as in algorithm 1. The log PAL associated with algorithm 2 is:
We now consider general . The filtering recursion is:
| (4.11) | ||||
Approximating the prediction and update steps for general
Assuming that we are given such that , each of the prediction steps in (4.11) is approximated by applying lemma 3, leading to lines 2-6 of algorithm 3. To approximate the update step, applying lemma 5 leads to lines 7-10 of algorithm 3.
Lemma 5.
For and , define:
and let be independent with . Suppose that given , is a matrix with conditionally independent entries distributed , and let . Then:
and , i.e.,
where and by convention .
The proof is given in section A of the supplementary material.
Computing the PAL for general
5 Consistency of maximum PAL estimators
Whilst the results in section 4 explain how the steps in algorithms 1-3 and the associated PALs are motivated by recursive vector-Poisson approximations, so far nothing we have stated quantifies the quality of these approximations, nor the PALs. In this section we present consistency results for parameter estimators defined by maximising PALs. Section C.2 of the supplementary material contains a simulation-based example to empirically illustrate our theoretical results.
5.1 Notation and definitions for the consistency results
We now introduce explicit notation for dependence of various quantities on a parameter vector ; we allow to depend on , and reflect this throughout section 5 with notation . We allow and to depend on , as well as the expected initial population size , with notation and . We also need to make explicit the dependence on and of the quantities computed in algorithms 1 and 3; we write these as: , ; and , , .
In either case (I) or (II), one can think of the expected initial population size as a global model index. We write for a probability space underlying each of these cases with expected initial population size ; in the context of case (I), is the joint distribution of and (as formulated in section 3) whilst in the context of case (II), is the joint distribution of and . In either case the overall probability space we shall work with is . From henceforth we denote by an arbitrarily chosen but then fixed data-generating parameter (DGP). Almost sure convergence under is denoted .
We now fix a time horizon where for case (I), is any positive integer, whilst for case (II), we assume for some . Since this time horizon is fixed, it will not appear explicitly in some of the notation for our consistency results. However, in order to state and prove various results, we need to make the dependence on and of the PALs computed using algorithms 1 and 3 explicit. To do so we define
where it is to be understood that each of the terms and are computed using respectively algorithms 1 and 3 with parameter value and expected initial population size , and where the distribution of the random variables and is specified by the DGP and the expected initial population size . The fact that and are functions of respectively and is not shown in the notation.
5.2 Assumptions
Assumption 1.
The parameter space is compact.
Assumption 2.
For all probability vectors , , and , and are continuous functions of , and the supports of these vectors and the supports of each matrix row do not depend on or . For all and , , i.e. has no entries equal to . Furthermore, there exist continuous functions of mapping , and , such that and for all , and for each there exist , , , and such that:
Assumption 3.
For all , there exists a constant such that for all , all vectors , and all probability vectors :
Furthermore, if then for all .
Assumption 4.
Let , , and . There exists which is a continuous mapping such that the support of , which is not the empty set, does not depend on , and there exists such that for any there exists a such that:
Furthermore, there exists some and such that:
and for all and .
The compactness of in assumption 1 and the continuity in of various quantities in assumption 2 are fairly standard assumptions in proofs of consistency of maximum likelihood estimators. The conditions on the supports of various vectors in assumptions 2-4 are used to rule out the possibility that different parameter values may induce mutually singular distributions over observations, this helps us ensure well-defined contrast functions in our consistency proofs. Assumption 4 asserts that the scaled initial population configuration, , obeys a law of large numbers.
5.3 Main consistency theorem and outline of the proof
In order to state and explain our main consistency result, theorem 1, we now summarize some intermediate results concerning the asymptotic behaviour of the models and quantities calculated using algorithms 1 and 3. Precise statements and proofs of these intermediate results are in section B of the supplementary material.
Laws of large numbers.
The first step is to establish laws of large numbers for the Latent Compartmental Model, and hence for the observations, these results are stated and proved in section B.1 of the supplementary material. In case (I) we show that for certain deterministic vectors , ,
| (5.1) |
and in case (II), for certain deterministic matrices , ,
| (5.2) |
The vectors and matrices satisfy recursive (in time) formulae and the convergence of and as is a discrete time analogue of the convergence of the continuous time, stochastic model to the solution of the ODE in (1.1), i.e. a discrete-time counterpart of the results of [43].
Filtering intensity limits and asymptotic filtering accuracy.
Making use of the laws of large numbers for the observations, the next step is to establish convergence to deterministic limits of intensity vectors and matrices computed using respectively algorithms 1 and 3 and which thus define the PALs (4.8) and (4.12). This is the subject of section B.2 of the supplementary material. In case (I) we find deterministic vectors and , , , where is a function of , such that:
In case (II) we find deterministic matrices and , , , , where is a function of for , such that:
A notable fact about the limiting filtering intensities and that we uncover (see remarks 1 and 2 in section B.2 of the supplementary material) is that:
where and are as in (5.1) and (5.2). In this sense, running algorithms 1 and 3 with the model specified by the DGP is asymptotically accurate as , in spite of the recursive Poisson approximations involved in these procedures.
Contrast functions.
We then construct contrast functions associated with the PALs. This is the subject of section B.3 of the supplementary material. The contrast functions turn out to be in the form of Kullback-Liebler divergences. In case (I),
| (5.3) |
and in case (II),
| (5.4) |
where in each case the convergence is established to be uniform in .
Convergence of the maximum PAL estimators.
With:
uniform convergence to the contrast functions as well as standard continuity and compactness arguments are used to complete the proof of our main consistency result:
Theorem 1.
Identifiability.
We now provide some further insight into the sets and in order to explain in what sense the model is identified under theorem 1. In section B.5 of the supplementary material we show that for any ,
The vector turns out (see remark 1) to be equal to the r.h.s. of the second -almost sure limit in (5.1). Thus for case (I), the convergence to in theorem 1 tells us that as , approaches the set of such that the -almost sure limit of is the same as the -almost sure limit of , for all . Similarly for case (II), turns out (see remark 2) to be equal to the r.h.s. of the second limit in (5.2), and the convergence to in theorem 1 tells us that as , approaches the set of such that the -almost sure limit of is the same as the -almost sure limit of , for all .
6 Dealing with over-dispersion
Over-dispersion is an important modelling consideration in many epidemiological contexts and may have substantial implications for model fit and predictive uncertainty. The models we have considered so far are equi-dispersed in the sense of [11]. For compartmental models in general, over-dispersion can be incorporated in either the transition or observation models, or both, see for example [63]. In the context of the models from section 3, a natural approach would be to replace the binomial and Poisson-distributed elements of the latent compartmental model (section 3.2) and/or observation models (sections 3.3.1-3.3.3) with over-dispersed counterparts, such as beta-binomial and negative binomial distributions. It appears that analytically tractable PAL-style approximations cannot be derived for such models. However, one can often construct over-dispersed distributions as compound distributions through introduction of latent variables, e.g. placing a beta prior on in (3.2) and then integrating out would result in a marginally beta-binomial observation model. Similarly priors could be placed on parameters which specify the matrix , the immigration and emigration parameters , , the spurious observation intensity , and so on. It is through this latent variable perspective that we extend the use of the PAL to deal with over-dispersion.
Consider the latent compartmental model from section 3.2 combined with observation mechanism from section 3.3.1 with parameter (the observation models from sections 3.3.2 and 3.3.3 can be handled in a very similar manner). We consider to be partitioned into two components: , where consists of parameters which are either fixed or to be estimated, and are to be integrated out, for some density and hyperparameter . A default approach would be for to be independent under , but Markovian or other dependence could be incorporated.
We assume that the elements of the model are parameterised such that:
for some given functions , , etc., which implies that:
and in turn that is conditionally independent of given , and .
Let us derive the marginal likelihood for the parameters with integrated out. Momentarily regarding as fixed and suppressing it from notation, consider the recursive relationship:
| (6.1) | ||||
| (6.2) | ||||
| (6.3) |
where the third equality holds due to the aforementioned conditional independence. Now, re-introducing to the notation, we have:
| (6.4) | ||||
| (6.5) |
We can approximate this using the PAL:
| (6.6) |
where is defined as per algorithm 1. The right-hand side of (6.6) can be efficiently numerically approximated by embedding PAL computations within sequential Monte Carlo – see [16] for an introduction to this family of Monte Carlo algorithms. Such a scheme is given by algorithm 5 and its subroutine algorithm 4.
In line 5 of algorithm 5 we take the convention . Algorithm 5 yields a Monte Carlo approximation to the r.h.s. of (6.6), so overall we obtain:
| (6.7) |
We stress there are two ingredients to this approximation: the Monte Carlo approximation and the PAL approximation. Whilst the main emphasis above regarding is that they are to be integrated out, a benefit of algorithm 5 is that it also yields the approximation:
| (6.8) |
which enables inference for on the basis of observations .
In section 7 we explore ways in which the large population theory from section 5 is relevant to the construction and behaviour of PALSMC algorithms for over-dispersed models:
- •
It is well known that the efficiency of sequential Monte Carlo methods can be highly sensitive to the choice of the proposal distribution, in algorithm 5. If we could choose to be proportional (as a function of ) to:
(6.9) then the weight would have no dependence on . Consequently the variability of the weight would be reduced and the overall efficiency of the PALSMC algorithm likely improved. This “optimal” choice of is often not analytically tractable, but inspired by our consistency theory we suggest Laplace approximation to it. We demonstrate such proposals in simulation-based and real data examples in sections 7.2 – 7.4 and find them to be very efficient in practice.
- •
Through a simulation example in section 7.2, we illustrate that even for our over-dispersed models, where one might expect estimation consistency to be ruled out, increasing population size can in fact increase the accuracy of point estimates of obtained from the r.h.s. of (6.8). The explanation for this is that whilst the model may be over-dispersed once are integrated out, it is equi-dispersed conditional on .
In the examples in section 7 we also expand on algorithm 5 to include sophisticated resampling schemes and block particle filtering techniques [56].
7 Discussion and examples
Code for all examples is available at: https://github.com/LorenzoRimella/PAL.
7.1 Inference using automatic differentiation and HMC for an age-structured model of ’flu
In this example, we demonstrate PALs for an age-structured model of a 1957 outbreak of influenza in Wales. Computation is performed using the probabilistic programming language Stan [14], taking advantage of automatic differentiation to implement Hamiltonian Monte Carlo (HMC). This example also highlights how the general Latent Compartmental Model can accommodate discrete or discretisable covariates associated with subpopulations: in this case the covariates are indicators of the age-group which individuals belong to and this is reflected in the compartment structure of the model.
Data and Model
The data consist of 19 weeks of incidence data in the form of GP symptom reports for a town with population size across age groups: , , , and . The data were analysed by [67] and are available via the Github page associated with [3]. For each age group ,
with conditionally independent increments: , , where
| (7.1) |
is a symmetric matrix with element representing the rate at which two individuals, one from the susceptible compartment of the th age group and the other from the infective compartment of the th age group come into effective contact.
The mean time spent in the exposed compartment and the mean recovery time are taken to be independent of age group and set to be days, following [3]. We assume that the model evolves daily with and that observations consist of cumulative weekly transitions from the to compartments for each age group, that is we have observation times at times for corresponding to the end of each week. In the setting of case (II) we denote observations where each element of each is equal to zero except the th element corresponding to transitions from compartment to which, conditional on , is distributed where has elements equal to zero except for the th entry which is equal to an age group dependant under reporting parameter which is to be estimated. We give details of how this model is written as an instance of the Latent Compartmental Model and the algorithm used to calculate the PAL in the supplementary material.
Hamiltonian Monte Carlo with automatic differentiation in Stan
We now consider MCMC sampling to approximate the posterior . The probabilistic programming language Stan [14] provides a framework for implementing HMC – a type of MCMC algorithm which uses auxiliary “momentum” variables to help explore the posterior – in which the user only needs to specify priors and provide a function which evaluates the likelihood for the model. Stan uses Automatic Differentiation (AD) to compute gradients and update the auxiliary HMC variables without the need for user input. Since the PAL consists of recursive compositions of elementary linear algebra operations, it is a natural candidate for AD.
Results
We implemented a Stan program incorporating the PAL, details of which are given in section C.4 of the supplementary material. We stress that here we do not correct for the fact that the PAL is only an approximation to the true likelihood, so Stan is targeting an approximation to the true intractable posterior, although in a separate example in the supplementary material we explore corrections using Delayed-Acceptance MCMC methods.
The parameters to be estimated are , the initial state for each age group is assumed known as , , , . We used vague gamma priors for and a vague truncated normal prior for . The HMC sampler was run to produce a chain of length iterations, a burn-inperiod of size was discarded and the remaining was thinned to produce a sample of . We report approximate posterior distributions and trace plots in section C.4 of the supplementary material, these show no signs of unsatisfactory mixing. Figure 2 reports the posterior predictive distributions and credible intervals, we see good coverage of observed data.
We repeated the analysis using an ODE version of the same age-structured SEIR model, from [3], with a Poisson reporting model: we use as emission distribution a Poisson distribution with rate given by the ODE solution scaled by an under-reporting parameter. This was implemented in the Stan framework using the code available in [3], we again sampled a chain of length iterations, discarded a burn-inperiod of size , and thinned the remaining to produce a sample of . To calculate the reproduction number for stratified models such as this, one must calculate the so called next generation matrix [66] which has elements given by where is the population size of the th age group. is then given by the largest modulus of the eigenvalues of the next generation matrix [19]. Using this definition, we can produce approximate posterior distributions of using each of the PAL and ODE procedures, which we report in figure 1. The approximate posteriors concentrate around using the PAL and using the ODE model. This disparity in estimates can be related to the features of the posterior predictive distributions reported in figures 2 and 3: the distribution of trajectories in figure 3 appears to ‘overshoot’ the data in comparison to those in figure 2, reflecting the higher force of infection implied by the ODE procedure in contrast to the PAL procedure. These posterior predictive plots also exhibit the inherent inflexibility of the ODE model: since the latent process is deterministic, random variations in the data away from the ODE trajectory must be explained as observation error. As is apparent in the age group, this rigidity in modelling results in overconfidence and a poor fit compared to that of the stochastic model combined with the PAL procedure.


7.2 Pedagogical over-dispersed SEIR example
To demonstrate inference for an over-dispersed model using PALSMC we consider a simple SEIR model for which the latent population evolves according to transition matrix (3.1), with immigration and emigration parameters, and , combined with the observation model . We assume and are known. We can cast this model in the form discussed in section 6 by identifying , , and choosing to make i.i.d. according to a truncated normal distribution , with , and . We give the details of a PALSMC scheme for this model in section C.1 of the supplementary material, including the design efficient, data-informed proposals by Laplace approximation to (6.9), inspired by the theory from section 5.


Filtering and parameter estimation simulation study
To assess the ability of the PALSMC scheme to recover ground truth quantities, we simulated data from the model with , , and . The first two rows of figure 4 explore the performance of PALSMC with increasing population size and using the data-generating values of . This collection of plots was created by first sampling a single draw of latent variables , then for each value of , generating data from the model conditional on , and running the PALSMC algorithm. We see that the effective sample size (ESS) is high across all values of population size , indicating a good approximation to the r.h.s. of (6.6); this reflects the careful choice of proposal distribution. As in (6.8), for each , the PALSMC algorithm yields a Monte Carlo approximation . The first row of plots in figure 4 demonstrates that these PALSMC filtering approximations concentrate on the true as the population size grows. This is in keeping with the theory of section 5, which tells us that converges to the data generating in the large population limit .
We also explored the ability of the procedure to recover the data generating hyperparameters ; in the bottom plots of figure 4. Here each boxplot summarises estimates, each estimate was obtained as follows: (1) simulate and data from the model with population size , (2) construct a 2-dimensional grid of candidate values for estimation of , (3) run PALSMC with input for each grid point, with particles and set to the DGP, (4) at time-steps report as an estimate of the value on the grid for which the largest value of was obtained across the PALSMC runs. We see from these boxplots that, for increasing time horizon , the maximum PALSMC estimators obtained across simulations converge towards the data generating with little bias.
Overall, these simulation results illustrate that, even in an over-dispersed setting, a large population can be useful in estimating , whilst a large time horizon can be useful in recovering hyperparameters .
7.3 Comparison of over-dispersion mechanisms in a model of rotavirus
In this section we explore a model selection task in which an equi-dispersed model is nested within a larger class of models including over-dispersion, using the approach of section 6. The rotavirus data and model we consider are inspired by [63], who assessed the fit of a family of continuous time, stochastic models with varying degrees of over-dispersion using the Akaike Information Criterion (AIC).
Models
The data considered consist of weekly incidence counts of rotavirus infections in Germany for age groups over the year period -. We consider a discrete-time version of the model of [63] which compartmentalises a population of into an age stratified SIR model comprising age groups: , , and . Given the number of susceptibles in age group at time after immigration, which we denote , and the number of infected individuals in each age group , for the number of new infected individuals in each age group at time step is conditionally distributed:
| (7.2) |
where with denotes the force of infection experienced by age group , and denotes a deterministic seasonality component with amplitude , phase , and period length , which we set to correspond to year. Other details of the latent compartmental model are given in section C.5 of the supplementary materials. We assume an aggregated transmission model, with weekly observations coming at times for . For each age group observations are conditionally distributed .
We consider three variants of this model:
- EqEq:
-
a fully equi-dispersed model, in which , and is assumed known as in [63];
- EqOv:
-
an equi-dispersed latent compartmental model and an over-dispersed observation model, the same as EqEq except that where is to be estimated;
- OvOv:
-
over-dispersion in both the latent and observation models, the same as EqOv except that we augment in equation (7.2) to where for , are multiplicative disturbances with mean and is to be estimated.
Inference
The parameters we estimate in each instance of the model are given by: EqEq: ; EqOv: with and ; OvOv: with and . The PALSMC algorithm for this model is given section C.5 in the supplementary material. For parameter estimation the approximate likelihoods of each of the models EqEq, EqOv, OvOv, obtained from PALSMC were maximised using a finite-difference coordinate ascent algorithm; we ran the optimisation times, initialised randomly over a range of feasible values. Plots evidencing convergence are in section C.5 of the supplementary materials. The algorithm was implemented using R and Rcpp on a node of the University of Bristol’s BluePebble cluster, although we did exploit parallelization.
We note that a PAL, e.g. the exponential of the r.h.s. of (4.8), is a valid likelihood function associated with a product of vector-Poisson distributions whose intensity parameters are defined through the corresponding filtering algorithm, e.g. algorithm 1. Similarly the output from PALSMC, e.g. (6.8) from algorithm 5, is a Monte Carlo approximation to a valid likelihood for a mixture of products of vector Poisson distributions. This validity justifies the use of AIC for model comparison but with the log-PAL, or the log-output from PALSMC, substituted in place of the usual log-likelihood.
| Model | AIC | Ave. comp. time |
| EqEq | 98866.65 | 30 sec |
| EqOv | 15154.75 | 2 hr |
| OvOv | 13778.08 | 3 hr |
| [63] | 20134.38 | 11 hr |
| Parameter | EqEq | EqOv | OvOv |
| 12.15 | 12.74 | 11.48 | |
| 0.22 | 0.21 | 0.25 | |
| 0.34 | 0.31 | 0.35 | |
| 0.017 | 0.14 | 0.14 | |
| 0.022 | 0.19 | 0.16 | |
| n/a | 0.042 | 0.021 | |
| n/a | n/a | 66.89 |
As a benchmark comparison, we fitted an ARMA(2,0,1) model to the log-transformed data, which gives an AIC of 23043 (details are given in the supplementary materials section C.5). Table 1 gives the AIC values for each of our models, along with the best AIC value reported by [63], which was for a model with over-dispersion in the transition model in the form of multiplicative gamma distributed noise, and over-dispersion in the observation model through negative-binomial reporting. This model of [63] is therefore qualitatively most similar to our model OvOv. The average computation times were calculated over runs of the coordinate ascent procedure. We find that, whilst we can fit EqEq with high computational efficiency, our two over-dispersed models achieve a substantially better AIC score, indicating a much better fit with increasing over-dispersion. Both EqOv and OvOv outperform [63] AIC and computation time, although of course the latter is implementation-dependent. Figure 5 demonstrates the increase in goodness of fit that an over-dispersed model provides for the rotavirus data, we see that prediction intervals for OvOv drastically outperform those for EqEq in terms of coverage.
The estimated values of and we find for all three models EqEq, EqOv and OvOv (table 2) are quite similar to those reported by [63], but we find a slightly lower value of . For EqOv and OvOv we find a similar seasonal amplitude but slightly larger phase than [63]. The seasonal ranges for each model are: EqEq ,EqOv , and OvOv compared to obtained by [63]. The better fit of EqOv and OvOv compared to [63] may thus be attributed to some combination of quite subtle differences in estimates of parameters related to disease transmission, together with the difference between the negative binomial observation model in [63] and the way EqOv and OvOv treat the as latent variables.

7.4 Evaluating the role of unit-specific parameters in a meta-population model of measles
In this section we illustrate how the PAL framework can be used to calibrate a more complex, larger-scale model, and compare the fit of sub-models with different levels of unit-specific parameters.
Model
We consider a discrete time version of a measles model originally presented by [71], subsequently extended into a spatio-temporal framework by [29] and recently explored by [55] using guided intermediate resampling filter (GIRF) techniques.
The model describes the evolution of recurrent pre-vaccination measles epidemics in cities across the UK over the year period . The model has susceptible , exposed , infective , and removed compartments for each of the cities. For each city the initial state of the epidemic is given by , where the probability vector is a possibly city -specific initial distribution parameter, and for denotes time varying population size. For each city the population evolves twice per week with the following dynamic:
where and model emigration (deaths) and immigration (births), respectively; and and are binomially distributed (details in the supplementary material). The term represents the number of new infections in the th city and is distributed
where:
| (7.3) |
for , . Here denotes a possibly city-specific seasonal transmission coefficient and , for , is mean- multiplicative noise which achieves over-dispersion in the marginal distribution of .
The summation term in (7.3) encodes the intercity interaction under a ‘gravity model’ – see [65] for background on these kind of models in epidemiology. The strength of the interaction is computed as:
where is called the ‘gravitational’ constant parameter, is the average of the initial populations, is the average inter-city distance and denotes the distance between cities and . The interpretation of the gravity model is thus that the strength of the interaction between two cities is directly proportional to their populations and inversely proportional to their distance.
The observations are aggregated incidence data in the form of cumulative fortnightly transitions from infective to recovered for each of the cities, at times for . Our observation model, which allows for over-dispersion, is described in section C.6 of the supplementary material, along with the distributions of , , , and , and an explanation of how we write the model as an instance of the Latent Compartmental model with days, corresponding to bi-weekly transitions.
We consider three variants of this model all with over-dispersion in both the dynamics and observation mechanisms, but with increasing levels of city-specific parameters:
- A:
-
the initial distribution vectors and force of infection parameters are shared across cities, i.e. constant in ;
- B:
-
is city-specific and is shared across cities;
- C:
-
and are city-specific.
Here we are inspired by an investigation conducted by [32], where sub-models with increasing numbers of city-specific parameters were fitted to a dataset on a smaller spatial scale, comprising cities compared to the we consider. [32] suggested that approximation techniques may be needed to analyse larger data sets, our application of the PAL framework is a step in that direction. However we note that the -city dataset analysed by [32] is not a subset of the -city dataset we consider here, so direct comparisons of model fit may not be made. Never-the-less we shall compare our results to those obtained by [55] for a model in which parameters are shared across cities, fitted to the same -city dataset we consider.
Inference
In section C.6 of the supplementary material we give the details of a PALSMC algorithm in which the PAL is embedded within a block particle filter [56, 32], to numerically approximate the log-likelihood. We used data-informed proposals and lookahead resampling to improve efficiency. For each of the models A,B,C, the approximate log-likelihood obtained from this PALSMC algorithm with particles was maximized with respect to the model parameters through Sequential Least Squares Programming. The procedures were implemented using Python and TensorFlow on a 32gb Tesla V100 GPU available on the HEC (High-End Computing) facility from Lancaster University.
Table 4 details PALSMC approximate log-likelihood and AIC values for each of the models A,B,C, along with an approximate log-likelihood reported by [55] for comparison. The GIRF used by [55] consists of a simulator for a continuous in time latent process combined with a particle filter which uses guide functions for intermediate propagation and resampling, parameters of the model are estimated via an iterated filtering scheme. Together with Monte Carlo adjusted profile methodology [31] they are able to generate profile likelihood estimates for confidence interval estimation. Frequentist uncertainty interval calculation is out of the scope of the current work and would require results on the asymptotic distribution of the maximum PAL estimator, see section 7.5 for a discussion.
Our model A is similar to that of [55] in the sense that both these models have parameters shared across cities, but we find model A performs better in terms of log-likelihood and AIC. As we move to from model A to models B and C, by making more parameters city-specific, we see an improvement in log-likelihood and AIC. We also note that the computation time for fitting model A is orders of magnitude smaller than that of [55]. The computation time is of course implementation-dependent, but we note that we have not devised a bespoke optimization algorithm to maximize the PALSMC approximation, but rather applied a standard ‘black-box’ optimizer. As prompted by an anonymous reviewer, we fitted an ARMA(2,0,1) model to the log-transformed data for a benchmark comparison; this gave a log-likelihood of -69168 (details are given in the supplementary materials section C.6).
Estimates of the city-specific parameters in model C can be used to estimate city-specific values, calculated as in [32]. We find that across the cities these estimated values lie in the range . The fitted mean latent and infective periods for model were and respectively; these values are in line with previous inferences on the behaviour of measles epidemics [28], [18]. Full details of our numerical results are in the supplementary materials section C.6.
| Model | No. parameters | Log-likelihood (sd) | AIC | Comp. time |
| A | 45 min | |||
| B | 10 hr | |||
| C | 24 hr | |||
| [55] | 30 hr∗ |
Figure 6 shows projected case numbers for the fortnights following the end of the data record, obtained using model C with parameters fixed to the estimated values, full details are in the supplementary materials section C.6. We see a general increase in forecast uncertainty as the time horizon increases, this reflecting the over-dispersed nature of model C. We also see that the forecasts generally exhibit higher certainty for cities with a larger population, as might be expected if a larger sub-population size allows latent variables and parameters which are specific to that sub-population to be estimated more accurately.

7.5 Opportunities for further research
In the examples from section 7.3 and 7.4 we have not devised special optimisation techniques to estimate parameters, but rather just plugged PALSMC likelihood function evaluations into ‘black-box’ optimisers. There may be opportunities here to even further increase computational efficiency, for example by embedding PALSMC within an iterated filtering scheme [30].
Recently [34] devised sophisticated SMC algorithms to fit agent-based models in which individuals in the population each carry covariates influencing, for example, the probabilities that they come into contact, and hence the probabilities of disease spreading from one individual to the next. When these covariates are discrete and take only finitely many distinct values, or can be discretised into that form, for example the subdivision of the population into age groups as in the age-structured example from section 7.3, they can be handled in the latent compartmental modelling framework by introducing extra compartments and specifying an appropriate observation model. However, covariates taking infinitely many distinct values cannot be handled this way, or necessitate further approximations. [58] have suggested methods related to PALs to construct efficient proposal distributions for SMC in individual-based models. Further research may expand the applicability of PAL-like approximations in this direction.
8 Acknowledgements
Michael Whitehouse is supported by a studentship from Compass – the EPSRC Centre for Doctoral Training in Computational Statistics and Data Science. Lorenzo Rimella is supported by EP- SRC Grant EP/R018561/1 (Bayes for Health). The authors are grateful to Nikolas Kantas for pointing them to the measles model, Patrick Cannon and colleagues at Improbable for discussion of automatic differentiation and David Greenwood for discussions of agent-based models.
References
- [1] Linda JS Allen. A primer on stochastic epidemic models: Formulation, numerical simulation, and analysis. Infectious Disease Modelling, 2(2):128–142, 2017.
- [2] Hakan Andersson and Tom Britton. Stochastic epidemic models and their statistical analysis, volume 151. Springer Science & Business Media, 2012.
- [3] Jair Andrade and Jim Duggan. An evaluation of Hamiltonian Monte Carlo performance to calibrate age-structured compartmental SEIR models to incidence data. Epidemics, 33:100415, 2020.
- [4] Donald WK Andrews. Generic uniform convergence. Econometric theory, 8(2):241–257, 1992.
- [5] Christophe Andrieu, Arnaud Doucet, and Roman Holenstein. Particle Markov chain Monte Carlo methods. Journal of the Royal Statistical Society: Series B (Statistical Methodology), 72(3):269–342, 2010.
- [6] Anon. Influenza in a boarding school. The British Medical Journal, page 587, 1978.
- [7] Frank Ball, Tom Britton, Thomas House, Valerie Isham, Denis Mollison, Lorenzo Pellis, and Gianpaolo Scalia Tomba. Seven challenges for metapopulation models of epidemics, including households models. Epidemics, 10:63–67, 2015.
- [8] Maurice Stevenson Bartlett. An introduction to stochastic processes. University Press Cambridge, 1966.
- [9] MS Bartlett. Some evolutionary stochastic processes. Journal of the Royal Statistical Society. Series B (Methodological), 11(2):211–229, 1949.
- [10] NG Becker. Martingale methods for the analysis of epidemic data. Statistical Methods in Medical Research, 2(1):93–112, 1993.
- [11] Carles Bretó and Edward L. Ionides. Compound markov counting processes and their applications to modeling infinitesimally over-dispersed systems. Stochastic Processes and their Applications, 121(11):2571–2591, 2011.
- [12] Tom Britton. Stochastic epidemic models: a survey. Mathematical biosciences, 225(1):24–35, 2010.
- [13] François Caron, Pierre Del Moral, Arnaud Doucet, and Michele Pace. On the conditional distributions of spatial point processes. Advances in Applied Probability, 43(2):301–307, 2011.
- [14] Bob Carpenter, Andrew Gelman, Matthew D Hoffman, Daniel Lee, Ben Goodrich, Michael Betancourt, Marcus Brubaker, Jiqiang Guo, Peter Li, and Allen Riddell. Stan: A probabilistic programming language. Journal of statistical software, 76(1), 2017.
- [15] Simon Cauchemez and Neil M Ferguson. Likelihood-based estimation of continuous-time epidemic models from time-series data: application to measles transmission in london. Journal of the Royal Society Interface, 5(25):885–897, 2008.
- [16] Nicolas Chopin, Omiros Papaspiliopoulos, et al. An introduction to sequential Monte Carlo, volume 4. Springer, 2020.
- [17] JR Davies, AJ Smith, EA Grilli, and TW Hoskins. Christ’s hospital 1978–79: An account of two outbreaks of influenza a h1n1. Journal of Infection, 5(2):151–156, 1982.
- [18] Paul L Delamater, Erica J Street, Timothy F Leslie, Y Tony Yang, and Kathryn H Jacobsen. Complexity of the basic reproduction number (r0). Emerging infectious diseases, 25(1):1, 2019.
- [19] Odo Diekmann, Johan Andre Peter Heesterbeek, and Johan AJ Metz. On the definition and the computation of the basic reproduction ratio r 0 in models for infectious diseases in heterogeneous populations. Journal of mathematical biology, 28(4):365–382, 1990.
- [20] Vanja Dukic, Hedibert F Lopes, and Nicholas G Polson. Tracking epidemics with Google flu trends data and a state-space SEIR model. Journal of the American Statistical Association, 107(500):1410–1426, 2012.
- [21] Paul Fearnhead, Vasilieos Giagos, and Chris Sherlock. Inference for reaction networks using the linear noise approximation. Biometrics, 70(2):457–466, 2014.
- [22] Jonathan Fintzi, Jon Wakefield, and Vladimir N Minin. A linear noise approximation for stochastic epidemic models fit to partially observed incidence counts. Biometrics, 2021.
- [23] Sebastian Funk, Shweta Bansal, Chris T Bauch, Ken TD Eames, W John Edmunds, Alison P Galvani, and Petra Klepac. Nine challenges in incorporating the dynamics of behaviour in infectious diseases models. Epidemics, 10:21–25, 2015.
- [24] Andrew Gelman, John B Carlin, Hal S Stern, and Donald B Rubin. Bayesian data analysis. Chapman and Hall/CRC, 1995.
- [25] Gavin J Gibson and Eric Renshaw. Estimating parameters in stochastic compartmental models using markov chain methods. Mathematical Medicine and Biology: A Journal of the IMA, 15(1):19–40, 1998.
- [26] Andrew Golightly, Daniel A Henderson, and Chris Sherlock. Delayed acceptance particle MCMC for exact inference in stochastic kinetic models. Statistics and Computing, 25(5):1039–1055, 2015.
- [27] Christian Gourieroux and Joann Jasiak. Temporally local maximum likelihood with application to sis model. arXiv:2107.06971, 2021.
- [28] Fiona M Guerra, Shelly Bolotin, Gillian Lim, Jane Heffernan, Shelley L Deeks, Ye Li, and Natasha S Crowcroft. The basic reproduction number (r0) of measles: a systematic review. The Lancet Infectious Diseases, 17(12):e420–e428, 2017.
- [29] Daihai He, Edward L Ionides, and Aaron A King. Plug-and-play inference for disease dynamics: measles in large and small populations as a case study. Journal of the Royal Society Interface, 7(43):271–283, 2010.
- [30] Edward L Ionides, Anindya Bhadra, Yves Atchadé, and Aaron King. Iterated filtering. The Annals of Statistics, 39(3):1776–1802, 2011.
- [31] Edward L Ionides, C Breto, J Park, RA Smith, and Aaron A King. Monte carlo profile confidence intervals for dynamic systems. Journal of The Royal Society Interface, 14(132):20170126, 2017.
- [32] Edward L Ionides, Ning Ning, and Jesse Wheeler. An iterated block particle filter for inference on coupled dynamic systems with shared and unit-specific parameters. arXiv preprint arXiv:2206.03837, 2022.
- [33] Valerie Isham. Stochastic models for epidemics. Oxford statistical science series, 33:27, 2005.
- [34] Nianqiao Ju, Jeremy Heng, and Pierre E Jacob. Sequential Monte Carlo algorithms for agent-based models of disease transmission. arXiv preprint arXiv:2101.12156, 2021.
- [35] David G Kendall. Deterministic and stochastic epidemics in closed populations. In Proceedings of the Third Berkeley Symposium on Mathematical Statistics and Probability, Volume 4: Contributions to Biology and Problems of Health, pages 149–165. University of California Press, 1956.
- [36] Maurice George Kendall et al. The advanced theory of statistics. The advanced theory of statistics., 1(2nd Ed), 1946.
- [37] William Ogilvy Kermack and Anderson G McKendrick. A contribution to the mathematical theory of epidemics. Proceedings of the royal society of london. Series A, Containing papers of a mathematical and physical character, 115(772):700–721, 1927.
- [38] Aaron A King, Matthieu Domenech de Cellès, Felicia MG Magpantay, and Pejman Rohani. Avoidable errors in the modelling of outbreaks of emerging pathogens, with special reference to Ebola. Proceedings of the Royal Society B: Biological Sciences, 282(1806):20150347, 2015.
- [39] Aaron A. King, Dao Nguyen, and Edward L. Ionides. Statistical Inference for Partially Observed Markov Processes via the R Package pomp. Journal of Statistical Software, 69(12):1–43, 2016.
- [40] John Frank Charles Kingman. Poisson processes, volume 3. Clarendon Press, 1992.
- [41] Amanda A Koepke, Ira M Longini Jr, M Elizabeth Halloran, Jon Wakefield, and Vladimir N Minin. Predictive modeling of cholera outbreaks in Bangladesh. The annals of applied statistics, 10(2):575, 2016.
- [42] Michał Komorowski, Bärbel Finkenstädt, Claire V Harper, and David A Rand. Bayesian inference of biochemical kinetic parameters using the linear noise approximation. BMC bioinformatics, 10(1):1–10, 2009.
- [43] Thomas G Kurtz. Solutions of ordinary differential equations as limits of pure jump Markov processes. Journal of Applied Probability, 7(1):49–58, 1970.
- [44] Thomas G Kurtz. Limit theorems for sequences of jump Markov processes approximating ordinary differential processes. Journal of Applied Probability, 8(2):344–356, 1971.
- [45] Phenyo E Lekone and Bärbel F Finkenstädt. Statistical inference in a stochastic epidemic SEIR model with control intervention: Ebola as a case study. Biometrics, 62(4):1170–1177, 2006.
- [46] Ming Lin, Rong Chen, and Jun S Liu. Lookahead strategies for sequential monte carlo. Statistical Science, 28(1):69–94, 2013.
- [47] David Lindenstrand and Åke Svensson. Estimation of the malthusian parameter in an stochastic epidemic model using martingale methods. Mathematical biosciences, 246(2):272–279, 2013.
- [48] Ronald PS Mahler. Multitarget Bayes filtering via first-order multitarget moments. IEEE Transactions on Aerospace and Electronic systems, 39(4):1152–1178, 2003.
- [49] A.G. McKendrick. Applications of mathematics to medical problems. Proceedings of the Edinburgh Mathematical Society, 44:98–130, 1925.
- [50] Trevelyan McKinley, Alex R Cook, and Robert Deardon. Inference in epidemic models without likelihoods. The International Journal of Biostatistics, 5(1), 2009.
- [51] Benjamin Nguyen-Van-Yen, Pierre Del Moral, and Bernard Cazelles. Stochastic epidemic models inference and diagnosis with Poisson random measure data augmentation. Mathematical biosciences, 335:108583, 2021.
- [52] Ning Ning and Edward L. Ionides. Iterated block particle filter for high-dimensional parameter learning: Beating the curse of dimensionality. arXiv preprint arXiv:2110.10745, 2021.
- [53] Philip D O’Neill. Introduction and snapshot review: relating infectious disease transmission models to data. Statistics in medicine, 29(20):2069–2077, 2010.
- [54] Philip D O’Neill and Gareth O Roberts. Bayesian inference for partially observed stochastic epidemics. Journal of the Royal Statistical Society: Series A (Statistics in Society), 162(1):121–129, 1999.
- [55] Joonha Park and Edward L Ionides. Inference on high-dimensional implicit dynamic models using a guided intermediate resampling filter. Statistics and Computing, 30(5):1497–1522, 2020.
- [56] Patrick Rebeschini and Ramon Van Handel. Can local particle filters beat the curse of dimensionality? The Annals of Applied Probability, 25(5):2809–2866, 2015.
- [57] Steven Riley, Ken Eames, Valerie Isham, Denis Mollison, and Pieter Trapman. Five challenges for spatial epidemic models. Epidemics, 10:68–71, 2015.
- [58] Lorenzo Rimella, Christopher Jewell, and Paul Fearnhead. Approximating optimal smc proposal distributions in individual-based epidemic models. To appear in Statistics Sinica, 2023.
- [59] Gareth O Roberts and Osnat Stramer. On inference for partially observed nonlinear diffusion models using the Metropolis–Hastings algorithm. Biometrika, 88(3):603–621, 2001.
- [60] Mick Roberts, Viggo Andreasen, Alun Lloyd, and Lorenzo Pellis. Nine challenges for deterministic epidemic models. Epidemics, 10:49–53, 2015.
- [61] Sumeetpal S Singh, Ba-Ngu Vo, Adrian Baddeley, and Sergei Zuyev. Filters for spatial point processes. SIAM Journal on Control and Optimization, 48(4):2275–2295, 2009.
- [62] Sumeetpal S Singh, Nick Whiteley, and Simon Godsill. Approximate likelihood estimation of static parameters in multi-target models. In D. Barber, A.T. Cemgil, and S. Chiappa, editors, Bayesian Time Series Models, chapter 11, pages 225–244. Cambridge University Press, 2011.
- [63] Theresa Stocks, Tom Britton, and Michael Höhle. Model selection and parameter estimation for dynamic epidemic models via iterated filtering: application to rotavirus in germany. Biostatistics, 21(3):400–416, 2020.
- [64] Tina Toni, David Welch, Natalja Strelkowa, Andreas Ipsen, and Michael PH Stumpf. Approximate bayesian computation scheme for parameter inference and model selection in dynamical systems. Journal of the Royal Society Interface, 6(31):187–202, 2009.
- [65] James Truscott and Neil M Ferguson. Evaluating the adequacy of gravity models as a description of human mobility for epidemic modelling. PLOS Comput. Biol, 8(e1002699), 2012.
- [66] Pauline Van den Driessche and James Watmough. Reproduction numbers and sub-threshold endemic equilibria for compartmental models of disease transmission. Mathematical biosciences, 180(1-2):29–48, 2002.
- [67] Emilia Vynnycky and WJ Edmunds. Analyses of the 1957 (Asian) influenza pandemic in the United Kingdom and the impact of school closures. Epidemiology & Infection, 136(2):166–179, 2008.
- [68] Nick Whiteley and Lorenzo Rimella. Inference in stochastic epidemic models via multinomial approximations. In International Conference on Artificial Intelligence and Statistics, pages 1297–1305. PMLR, 2021.
- [69] Paul S Wikramaratna, Adam Kucharski, Sunetra Gupta, Viggo Andreasen, Angela R McLean, and Julia R Gog. Five challenges in modelling interacting strain dynamics. Epidemics, 10:31–34, 2015.
- [70] Lee Worden and Travis C Porco. Products of compartmental models in epidemiology. Computational and mathematical methods in medicine, 2017, 2017.
- [71] Yingcun Xia, Ottar N Bjørnstad, and Bryan T Grenfell. Measles metapopulation dynamics: a gravity model for epidemiological coupling and dynamics. The American Naturalist, 164(2):267–281, 2004.
Appendix A Proofs and supporting results for section 4
Proof of Lemma 1.
For the first result, consider the probability mass function of :
and for ,
So that
and
which is the probability mass function associated with .
Now consider where , so that is the marginal probability mass function of . By the definition of , , where the rows of are conditionally independent given , and the th row of is distributed . Now we can write the moment generating function (m.g.f.) of as:
Now we notice that is the m.g.f. of so that
We recognise this is the moment generating function of a random vector. ∎
Proof of Lemma 2.
We have by the same reasoning as lemma 1. By definition , hence the moment generating function of is:
Which we recognise as the moment generating function of the , the first result of the lemma then follows from applying element-wise the fact that the intensity of the sum of two independent Poisson random variables is the sum of the intensities.
We start the proof of (4.7) by considering the decomposition of into the sum of random variables and where . Then, and are independent Poisson with intensity vectors and respectively, see [40][Sec. 1.2]. Since is independent of , we have that:
| (A.1) |
So, we need to characterise the distribution of given . Construct the random variable such that for , and row of are the counts . By this construction, for and for . Furthermore, the elements of are independently Poisson, see [40][Sec. 1.2], with intensity matrix defined as follows:
If, for some , , then we must have that for all so that . Otherwise we have that for and , conditioned on is distributed
Hence, given , has a Poisson-Binomial distribution with mean:
| (A.2) |
for , where we set the th term of the outer sum on the r.h.s to if since that achieves
Writing (A.2) in vector form and substituting into (A.1) completes the proof.
∎
Proof of Lemma 3.
Note . Let , then the moment generating function for is:
which we recognise as the moment generating function of a random matrix. ∎
Proof of Lemma 4.
We have:
furthermore:
So that:
and
Dividing by gives:
Giving the desired probability mass function of . ∎
Proof of Lemma 5.
By lemma 4 we have that for each , and:
Since is the sum of independent Poisson random variables , we have and given , is distributed . Hence by the tower law:
in the case that all elements of are strictly positive. Otherwise we have for any such that , since the latter equality implies , which in turn implies almost surely.
∎
Appendix B Proofs and supporting results for section 5
B.1 Laws of Large Numbers
B.1.1 Preliminaries
Lemma 6.
Let and for . Assume that for all , for some and , then there exist constants and such that:
furthermore
Proof.
By recurrence relations for the central moments of Poisson random variables, see e.g [36], we can write
| (B.1) | ||||
| (B.2) | ||||
| (B.3) |
for some since the curly bracketed term in (B.3) defines a convergent sequence. Hence, by the Minkowski inequality:
where b = and . Now let , by Markov’s inequality:
So that:
Then almost surely by the Borel-Cantelli lemma. ∎
Corollary 1.
If for a sequence such that there exists and such that for some , then for any vector there exists constants and such that:
Proof.
Apply lemma 6 in an element-wise fashion. ∎
Lemma 7.
Let be a filtration and for be random variables which are conditionally independent given , are bounded by a constant almost surely, and satisfy . Let be a non-negative integer valued random variable such that and assume there exist constants , , and such that for all :
Then there exists a constant such that:
Proof.
Recalling that a sum over an empty set is equal to zero by convention, we have that:
for some constant . The first equality holds by the multinomial theorem. The second equality holds through conditional independence of the . The third equality comes from the fact that all terms of the sum where for some disappear since ; hence, we need only count the terms with exclusively even ’s. The first term after the inequality arises since there are terms with a th power, each of which we can bound . The term comes from counting the number of terms with exactly 2 of the ’s equal to with the rest equalling ; there are such pairs, multiplying this by gives a total of , then we bound each of the for all . So we have:
| (B.4) |
by the Lyapunov inequality:
| (B.5) |
We now apply a tower law argument to the above to see that, for constant :
| (B.6) |
∎
Lemma 8.
Let , , , and . Then:
Proof.
If then the result is trivial. Now, for we have:
∎
B.1.2 Case (I)
Define the sequence of vectors:
Proof.
Explicit dependence of some quantities on and is omitted throughout the proof to avoid over-cumbersome notation where the dependence is unambiguous. We proceed to prove the above by induction on . At time we have for some and :
| (B.8) |
by assumption 4. Now for assume (B.7) holds for . Recall , and . We make the following decomposition:
| (B.9) | ||||
| (B.10) | ||||
| (B.11) |
Consider (B.9). We make the further decomposition:
| (B.12) | ||||
| (B.13) | ||||
| (B.14) | ||||
| (B.15) | ||||
| (B.16) | ||||
| (B.17) | ||||
| (B.18) | ||||
| (B.19) |
The term converges to in by assumption 2 and lemma 6, that is there exists an and such that:
| (B.20) |
Now, turning to (B.18), let and . See that:
| (B.21) | ||||
since, given , and, conditional on and , is a draw from the th row of ; and if then . Moreover:
| (B.22) |
Define:
The are conditionally independent and mean zero given , and . Also note that, since is equal to , we can invoke the induction hypothesis with test vector to see there exist constants and such that:
so that we satisfy the conditions of lemma 7. Hence there exists a constant :
| (B.23) |
Before analysing (B.10) and (B.11) we will prove an intermediary result. Consider the decomposition:
| (B.24) | ||||
| (B.25) |
The term in (B.25) converges to 0 in at the required rate by the induction hypothesis with test vector . Now for (B.24) see that:
| (B.26) |
and note that the are mean , bounded, and independent given so that by lemma 7 we have that (B.26) converges to in at the required rate. Combining this with the Minkowski inequality, we have that for some positive constants and :
| (B.27) |
Now we look at (B.10):
| (B.28) | ||||
The first inequality here uses Holder’s inequality and the second uses the fact that the row sums of the matrix are equal to . By (B.27) with in conjunction with the Minkowski inequality there exists and such that:
If then by lemmas 13 and 15, which we state and prove in section B.2, in which case the right hand side of the above is and therefore satisfies all positive bounds. Henceforth, assume . Consider:
| (B.30) | ||||
| (B.31) | ||||
| (B.32) | ||||
| (B.33) | ||||
| (B.34) | ||||
| (B.35) | ||||
| (B.36) | ||||
| (B.37) |
Where we use lemma 8 in line (B.34). We can again invoke (B.27) to give convergence of (B.36) and (B.37) at the required rate. We can now combine all of the above, along with the Minkowski inequality to show that:
| (B.38) |
where , and . ∎
Lemma 10.
Proof.
Explicit dependence of some quantities on and is omitted throughout the proof to avoid over-cumbersome notation where the dependence is unambiguous. First note that:
| (B.39) |
and
| (B.40) |
for some and by corollary 1 and assumption 2. Write:
| (B.41) | ||||
| (B.42) |
We have that
| (B.43) |
for some and by lemma 9 using test function .
Furthermore, we have:
| (B.44) |
where and indicates the compartment in which it is observed. Notice that for (B.41) :
| (B.45) | ||||
The are mean zero and independent conditioned on . Furthermore:
| (B.46) |
almost surely and where is defined as in lemma 9. An application of lemma 7, yields:
| (B.47) |
for some constants and . Combining (B.40), (B.43), and (B.47) with the Minkowski inequality yields:
| (B.48) |
where and .
∎
B.1.3 Case (II)
Define:
Lemma 11.
Proof.
Recall from section 4.2 that in case (II) there is no immigration or emigration, and hence also with probability for all .
Consider the decomposition:
| (B.51) | ||||
| (B.52) | ||||
| (B.53) | ||||
| (B.54) |
Notice that by assumption 2 with vectors and , there exists a constant such that the term (B.53) satisfies:
| (B.55) | ||||
| (B.56) | ||||
| (B.57) | ||||
| (B.58) | ||||
| (B.59) |
By the Minkowski inequality and lemma 9 there exist constants and such that:
| (B.60) |
Moreover, (B.54) is equal to:
| (B.61) |
therefore we can invoke lemma 9 with test vector , this tells us there exists constants and such that:
| (B.62) |
We now recall that , so that the term (B.52) is equal to:
| (B.63) |
Since, conditioned on , is a draw from the th row of , we have . Furthermore, given the are independent and . An application of lemma 7 yields that for some constants and :
| (B.64) |
Finally, use of the Minkowski inequality yields the result:
| (B.65) |
where and .
∎
Lemma 12.
Proof.
Write
| (B.66) | ||||
| (B.67) | ||||
| (B.68) |
By lemma 11 there exists and such that:
| (B.69) |
Now, we can write (B.68) as:
Where given (where is defined as in lemma 9) is distributed . Hence, . Furthermore, given the are independent and . An application of lemma 7 yields:
| (B.70) |
for some and . Use of the Minkowski inequality yields the result:
| (B.71) |
for
∎
B.2 Filtering intensity limits
B.2.1 Case (I)
Define the vectors, or :
| (B.73) | ||||
| (B.74) |
where by convention, if we encounter in the element-wise division operation we replace that ratio by .
Our main objective in section B.2.1 is to show these vectors are the -a.s. limits of the corresponding finite- quantities evaluated at , computed using algorithm 1. This is the subject of proposition 3.
The proof is postponed until later in section B.2.1.
Remark 1.
By writing out the above definitions it can be checked that , hence lemma 9 implies by a Borel-Cantelli argument ; and that is equal to the right hand side of (B.49) in proposition 1, hence . Therefore proposition 3 implies that if algorithm 1 is run with the model specified by the DGP , thus computing and , that when rescaled by these vectors converge as to the same -almost sure limits as and . We provide empirical evidence for this remark in section C.2.
As preliminaries to the proof of proposition 3 we need to verify that certain quantities in algorithm 1 and the vectors defined at the start of section B.2.1 are -a.s. well-defined and finite. This is the purpose of lemma 13 and lemma 14. In algorithm 1, if and , then line 3 would entail dividing a finite number by zero. Lemma 13 establishes that this happens with probability zero.
Proof.
Fix arbitrary and . All a.s. statements in the proof are with respect to . We will show that for all and , the following two implications hold:
| (B.75) | ||||
| (B.76) |
The proof is inductive in . To initialize the induction at , let and suppose that , i.e.,
then which by assumption 2 implies and hence , a.s. Furthermore, for all we must have that either:
- •
, which, since is a deterministic quantity, implies , in turn by assumption 4 this implies so that a.s. and a.s.; or
- •
, which by assumption 2 implies which means a.s.; or
- •
Hence we have for all either a.s. or a.s. Since, given , we must have that a.s., therefore we have that a.s. We have thus proved (B.75) in the case .
Now let us prove (B.76) in the case . Suppose that for some , , i.e.,
Then which by assumption 2 implies and hence a.s. Furthermore, for all we must have that either:
- •
, which implies a.s. which implies a.s.; or
- •
, which by assumption 2 implies that a.s.; or
- •
, which by assumption 2 implies .
Given, , . This means that a.s., and furthermore that a.s. This completes the proof of (B.76) in the case .
As an induction hypothesis suppose that (B.75) and (B.76) hold at . We shall show that a.s. Firstly we will show that, for all , which, by the induction hypothesis, would imply a.s. Suppose that for some , , i.e.,
Firstly, is almost surely well defined by the induction hypothesis, since the event and has probability for each . Now if the above displayed inequality holds we must have that either:
- •
, in which case we must have ; or
- •
, in which case we must have for all so that the sum is equal to with positive probability, and since is row-stochastic matrix, there must exist a such that , hence .
We have thus shown which by the induction hypothesis implies a.s. so that further a.s. Now if for some , , i.e.,
then , which by assumption 2 implies , hence a.s. Furthermore, for all we must have that either:
- •
, which implies a.s. a.s.; or
- •
, which by assumption 2 implies a.s.; or
- •
. We claim this implies that , a.s. Suppose, for contradiction, that and . Then there exist with and such that for all and all :
which implies:
By assumption 3 this implies:
i.e. there exists such that:
But since and this implies that:
This contradicts the observation in the first bullet point, hence a.s. Then by assumption 2 we have a.s.
Hence, similarly to the argument used in the case , we must have that a.s. so that a.s. Thus (B.75) holds with replace by .
It remains to show that (B.76) holds with replaced by . So suppose that for some , , i.e.,
then we must have which by assumption 2 implies hence a.s. Furthermore, for all we must have either:
- •
, which implies that a.s.; or
- •
, which by assumption 2 implies a.s.; or
- •
, which by assumption 2 implies .
Hence, using the same reasoning as in the case, we have a.s. and furthermore a.s. This completes the proof of (B.76) with replaced by . The induction is therefore complete. ∎
If and then would involve division of a finite number by zero. Lemma 14 establishes that this situation cannot arise.
Proof.
Fix arbitrary . By symmetry we only need to prove the implication in one direction. We will show that the following two implications hold for all and :
| (B.79) | ||||
| (B.80) |
For the case, if , i.e.,
then which by assumption 2 implies . Furthermore, for each we must have either:
Hence we have:
so (B.79) holds with . In order to establish (B.80) with , consider
hence , which by assumption 2 implies . Furthermore, for each we must have either:
- •
, which by the above implies ; or
- •
, which by assumption 2 implies ; or
- •
, which by assumption 2 implies .
Hence:
Thus we have shown that (B.80) holds with .
For the induction hypothesis, assume that (B.79) and (B.80) with hold for some . Then for each write:
This is well defined by the induction hypothesis choosing . Furthermore, we must have either:
- •
, in which case we must have ; or
- •
, in which case we must have a.s. for all so that the sum is equal to . Since is row-stochastic matrix, we know there must exist a such that and so we must have .
So we have , indeed the reverse implication is also true by definition of so that . Now consider
then and for all we must have either:
- •
, which implies by the above that ; or
- •
, which by assumption 2 that ; or
- •
Hence
Now, if for some :
then , which by assumption 2 implies and for all we have either:
The following lemma will be used in the proof of lemma 5.
Proof.
Fix arbitrary and . All almost sure statements in the proof are made with respect to . We will show by induction that the following two implications hold for all and .
| (B.82) | ||||
| (B.83) |
For consider:
then which by assumption 2 implies , and for all we must have either:
- •
, which by assumption 4 implies ; or
- •
; or
- •
Hence we have:
Now consider:
then , which by assumption 2 implies , furthermore for al we must have either:
- •
, which by the above implies ; or
- •
; or
- •
.
Hence:
For the induction hypothesis, assume (B.82) and (B.83) hold. Then for each ,
This is well defined by the induction hypothesis. Furthermore, in order for this equality with zero to hold we must have either:
- •
, in which case we must have which by the induction hypothesis implies ; or
- •
, in which case we must have for all so that the sum is equal to . Since is row-stochastic matrix, we know there must exist a such that and so we must have which by the induction hypothesis implies a.s.
So we have a.s., furthermore a.s. a.s.. Now if for some :
| (B.84) |
then which by assumption 2 implies and for each we must have either:
- •
, which we have already shown implies ; or
- •
; or
- •
, which together with assumption 3 implies .
Hence
Now, if
then which by assumption 4 implies and for all we have either:
- •
, which implies a.s.; or
- •
; or
- •
.
Hence
and the inductive proof is complete.
∎
Proof of Proposition 3.
Fix any . We proceed by induction to show that for all ,
with the other claims of the proposition proved along the way.
Using assumption 4 we have:
Now, for assume that . We have:
by the continuous mapping theorem (CMT) and assumptions 2 and 3. A further application of the CMT and assumption 2 yields:
Recalling from remark 1 that and applying the CMT, we have:
We note this limit is almost surely well defined since by lemma 14 for any ,
and by lemma 13 if with positive probability then , -a.s. In both these cases we are working under the convention . ∎
Proof.
Fix an arbitrary . Note that is continuous by assumption 4. We will now show that for any , continuity of implies continuity of , , and , from which the claim of the lemma follows.
Henceforth assume that is continuous and recall that by definition of ,
| (B.85) |
Continuity of and in holds directly by assumptions 2 and 4. By assumption 3 we know that is continuous in and . Hence, to show continuity of we shall show that is continuous in . The function is continuous everywhere except at , we now show that, by virtue of our assumptions, this discontinuity is immaterial. Consider the two following cases:
- •
- •
For all , . In this case the continuity of in on follows from the continuity of on .
Hence, is continuous. Recall that:
Due to the continuity of and assumption 2, this is a composition of continuous functions and hence is itself continuous. Now consider
Each component of this function is trivially continuous on except the term, we will now prove its continuity. By lemma 14, for each we need only consider the two cases:
- •
either for all , in which case we have by convention , which is continuous; or
- •
for all , in which case is continuous.
Hence we have elementwise continuity of which gives us continuity of .
We have shown that continuity of on implies continuity of , and on , which completes the proof. ∎
B.2.2 Case (II)
Define:
| (B.86) |
and for and ,
and
| (B.87) |
where if we encounter in the element-wise division operation we set the entry to by convention. The main result of section B.2.2 is proposition 4 concerning the convergence to the above of the associated finite- quantities computed using algorithm 3.
The proof is postponed until later in section B.2.2.
Remark 2.
Similarly to as in section B.2.1, in order to prove proposition 4 we need to check that certain quantities are almost surely well defined. For the update step of algorithm 3 to be -a.s. well defined for all we need that if occurs with positive probability then - a.s. This is established in the following lemma.
Proof.
Fix arbitrary and . All almost sure statements made throughout the proof are with respect to . We will prove by induction that for all we have that for all and , the following two implications hold.
| (B.88) | |||
| (B.89) |
Consider the case . We will first show that for all if, for some , then a.s. by induction on . Suppose that for some , , i.e,
This implies that either:
- •
, which since is deterministic implies that
which by assumption 4 implies that a.s.; or - •
Together this implies imply a.s.. Now let and assume that if, for some , then a.s.. Now suppose for some , , i.e.,
This implies that either:
- •
, which by the induction hypothesis implies a.s., which in turn implies a.s.; or
- •
which together imply a.s.. Now suppose for some , , i.e.,
then for all either:
- •
, which implies hence a.s.; or
- •
which by assumption 2 implies hence a.s.,
and hence a.s., this completes the proof of (B.88) and (B.89) for .
For the induction hypothesis, suppose that (B.88) and (B.89) hold for some . Notice that:
is almost surely well defined by the induction hypothesis since we divide positive by with probability 0. Now suppose, for some , that , then either:
- •
, which implies , so that the first term of the sum is with positive probability, which then implies by the induction hypothesis; or
- •
, which implies , so that the second term in the sum is with positive probability, which then implies a.s. by the induction hypothesis.
Using this and identical reasoning to that in the case completes the induction. ∎
If, for some , and , then would involve division of a finite number by zero. The following lemma implies this situation does not arise.
Proof.
It is enough to establish the implication in one direction for arbitrary . We will prove by induction that for all , and ,
Consider the case . We will first show that for all , by induction on . To this end suppose that for some :
Then either:
- •
, which by assumption 4 implies ; or
- •
Hence:
Now assume that for that , then if:
we must have either:
- •
, which by the induction hypothesis implies ; or
- •
We therefore find:
completing the intermediary induction on . Now consider:
then for all either:
- •
; or
- •
,
and hence:
completing the case.
Now assume that for all that and that . Then we have that if:
which is well defined by the inductive hypothesis, then either:
- •
, and then , hence the first term is , or
- •
, and then , so that the right hand term is .
This along with using the same reasoning used in the case gives:
implies
Using this and further using identical inductive reasoning to the case we see that for all , and further that . This completes the inductive proof. ∎
The following lemma is used in the proof of lemma 6.
Proof.
Fix arbitrary and . We will prove that for all , and the following two implications hold:
The induction is on and . Consider . We will first show that for all that by induction on . We have for case:
which implies that either:
- •
, in which case or
- •
, in which case ,
so that:
Now assume that given , then:
which in turn implies either:
- •
, which implies a.s.; or
- •
, which implies a.s..
Together we find:
completing the intermediary induction on . Now consider:
then for all either
- •
, which implies ; or
- •
,
and hence:
This completes the case .
Now assume that for all , , which implies and that , which implies . Then
and either:
- •
, which implies a.s., so that the first term is ; or
- •
which implies , a.s., so that the right hand term is .
This along with using the same reasoning used in the case tells us that given:
which implies
Using this and further using identical inductive reasoning to the case we see that for all we have a.s. and further that , which implies a.s. This completes the inductive proof. ∎
Proof.
Proof of Proposition 4.
The proof is by induction on . Consider . Note that by assumption 4. Now let and assume that . Then:
By the CMT, a further application yields:
Then by induction on we have that:
for all , this means that:
Now for general assume that . Using identical reasoning to the case, we find that for all :
which in turn implies by the CMT that:
Writing out the definition of , proposition 2 gives . Then by the CMT,
We note here that the left hand side of the above display is almost surely well defined since, by lemma 17, for all and if there is positive probability that then -a.s., in which case we invoke the convention . The right hand side of the limit is well defined since for all we have by lemma 18, in which case we again invoke the convection . A further application of the CMT gives:
This completes the proof. ∎
B.3 Contrast functions
Definition 1.
Let be a sequence of random functions where is a metric space. We say that are stochastically equicontinuous if there exists an event of probability , such that for all and , there exists and such that implies:
Lemma 21.
Assume is a compact metric space and let be a sequence of random functions . If there exists a continuous function such that for all we have , and are stochastically equicontinuous, then:
That is converges to almost surely as , uniformly in .
Proof.
See [4]. ∎
B.3.1 Case (I)
Proof.
For , we define a random function , as where:
with the convention . To see that is almost surely well defined, consider the following cases for each . If both and , -a.s., then the of the ratio of these terms is almost surely well defined. If or with positive probability, then -a.s. by lemma 13 and we invoke the convention .
We shall show that for ,
The proof consists of showing pointwise convergence and then stochastic equicontinuity of . Uniform almost sure convergence then follows by lemma 21.
Fix and note that by proposition 1 (see remark 1), and by proposition 3, . We claim that by the CMT:
| (B.92) | ||||
| (B.93) | ||||
| (B.94) | ||||
| (B.95) |
To see that the limit is well defined consider the cases for each , either:
- •
and In this case all functions in the sequence and its limit are well defined; or
- •
and , or and . This case is prohibited by lemma 14; or
- •
Hence we have shown the convergence of:
point-wise in .
Next we show that are stochastically equicontinuous. Let and such that . Let , , and . Firstly we will show the stochastic equicontinuity of for any . Let and write by the triangle inequality:
| (B.96) | ||||
| (B.97) | ||||
| (B.98) |
There exists such that for the first two terms are bounded by by proposition 3. Furthermore, since is continuous by lemma 16 there exists a such that:
Hence we have shown stochastic equicontinuity of . Now, consider :
| (B.99) | ||||
| (B.100) |
By what has been proven already we can choose and to bound (B.100) by . Let , by proposition 1 there exists such that for :
| (B.101) |
Furthermore, for each either:
- •
- •
and almost surely. Then by continuity of on there exists a such that for :
By stochastic equicontinuity of there exists and such that for
and we have that so that:
Hence choosing and we have that for
and :
Hence we have established the stochastic equicontinuity of . This along with the already proven pointwise convergence establishes uniform almost sure convergence by lemma 21 and completes the proof. ∎
B.3.2 Case (II)
We have:
Proof.
The details are similar to lemma 5. For define the sequence of random functions , , where:
With the convention . To see that this mapping is almost surely well defined, consider the following cases for each . If both , or , then the of each of these terms is almost surely well defined. If either , or with positive probability, then by lemma 17 and we invoke the convention .
It is enough to show that for each
We show pointwise almost sure convergence and then stochastic equicontinuity. Fix and note that by proposition 4 for all and . Furthermore by proposition 2 for all . We claim that by the CMT:
| (B.103) | ||||
| (B.104) | ||||
| (B.105) | ||||
| (B.106) | ||||
| (B.107) |
To see that this limit is indeed almost surely well defined consider the cases for each and
, either:
- •
and In this case all functions in the sequence and its limit are well defined. Or
- •
and , or and . This case is prohibited by lemma 14. Or
- •
Hence we have shown:
We now prove stochastic equicontinuity of . Firstly we will show the stochastic equicontinuity of for any vectors . Let and such that . Let , , and . Let and write by the triangle inequality:
There exists such that for the first two terms are bounded by by proposition 3. Furthermore, since is continuous by lemma 20 there exists a such that:
Hence we have shown stochastic equicontinuity of . Now, consider :
| (B.108) | ||||
| (B.109) |
By what has already been proven, for any we can choose and to bound (B.109) by . Let , by proposition 2 there exists such that for ,
Furthermore, for each either:
- •
or with positive probability. In this case the th terms disappear from the sum on the left hand side since with probability by lemma 17; or
- •
and almost surely, by continuity of on there exists a such that if then:
Then by stochastic equicontinuity of there exists and such that for and we have that
so that:
Choosing and we have that for and :
Hence we have established the stochastic equicontinuity of . This along with the already proven pointwise convergence establishes uniform almost sure convergence by lemma 21.
∎
B.4 Convergence of Maximum PAL estimators
Proof of Theorem 1.
Let be defined to be the r.h.s. of (B.91) and let be as in the proof of proposition 5. We have that for all . Furthermore for all . We can combine these inequalities to obtain:
| (B.110) | ||||
Hence .
Now assume for purposes of contradiction that there is some positive probability that does not converge to the set , i.e. assume that there is an event with such that for all there exists a such that for infinitely many we have is not in the open neighbourhood . Since is compact, the set is closed, bounded, and therefore compact. Furthermore, is continuous in . By the extreme value theorem this means that there exists a such that for all :
Furthermore, since there exists such that:
By our assumption we have for each there are infinitely many such that . But this implies that for each there are infinitely many such that:
which contradicts (B.110). Hence we must have that converges to the set -a.s. The proof for case (II) follows the same arguments but with and replaced by as in the proof of proposition 6 and defined to be the r.h.s. of (B.102). ∎
B.5 Identifiability
Proposition 7.
For any ,
Proof.
For the first equivalence in the statement, in order to prove the implication in the forward direction, assume that , i.e., , for all . Recall from the definitions in (B.73)-(B.74) that does not depend on , hence neither does , and so:
Now, for assume that and . Then we have that:
so that
and
By induction we have thus shown that for all and have completed the proof for the forward direction of the first implication in the statement.
For the backwards direction we need to show that , for all . Similarly as for the forwards direction:
Now, for assume that and . Then we have that:
so that
and
This completes the proof of the first implication in the statement of the proposition.
For the second implication, we will first show , for all . Recalling the definitions in (B.86)-(B.87), we have that for all , and hence:
| (B.111) | ||||
| (B.112) | ||||
| (B.113) |
Now let and assume that, for all , . Then:
This then implies that for all , , which in turn implies, as in (B.111) that . The reverse direction follows by similar reasoning, as in mirroring the proof of the backwards direction of the first implication in the statement of the proposition, so the details are omitted. ∎
Appendix C Supplementary material for section 7
C.1 Supplementary material for the pedagogical SEIR example
In this section we present the PALSMC algorithm used in the pedagogical SEIR example, given by algorithm 6. For notation purposes, define . The following section describes how one can make proposals informed by observations.
C.1.1 Deriving a proposal informed by observations
Let be the density associated with a random variable. We would like to make proposals informed by observations, to that end we seek a Laplace approximation to:
Suppressing dependence on the particle, let be calculated as per line 4 of algorithm 6. We have for some constant and :
| (C.1) | ||||
To get the mean of a Laplace approximation to (C.1) we must find it’s maximum w.r.t. , hence:
| (C.2) | ||||
For the variance we find the second derivative and evaluate it at :
| (C.3) | |||
To be congruent with the support of we truncate the proposal to be , denote its density as .
C.1.2 Comparison to a standard sequential Monte Carlo approach
In this section we perform a routine comparison of PALSMC evaluations and ‘exact’ particle filter likelihood estimates on a small simulated model for which a standard SMC approach, that is integrating out both the and the processes, is still viable. The model we use is the same as in the pedagogical SEIR example, except we introduce over-dispersion into the infection rate, that is the number of new exposed at time is distributed:
| (C.4) |
where is mean multiplicative noise. We simulated data using the same parameters as in the pedagogical SEIR example and . For the standard SMC approach we used joint proposals inspired by the PALSMC derivations.
We ran each of the filters with the data generating parameters as input with 1000, 5000, and 10000 particles. For each procedure and each particle size we ran generated 100 likelihood estimates and calculated the standard deviation. We found that, as expected, the variance shrinks for both procedures as the number of particles increases, and that PALSMC had a systematically lower variance with little bias.
| Number of particles | PALSMC (sd) | SMC (sd) |
| 1000 | -585.44 (0.26) | -585.51 (0.48) |
| 5000 | -585.39 (0.15) | -585.38 (0.27) |
| 10000 | -585.06 (0.11) | -585.10 (0.17) |
C.2 A simulation example
Consider the following SEIR model with immigration and emigration: and for all : , , , and
with DGP .
This observation model can be interpreted as follows: with probability each individual in compartment is tested for disease. Allowing to vary across could model, for example, infective individuals being more likely to be tested. The above choice of allows for false-positives (first row) and false-negatives (third row), where those testing positive are considered infective, and those testing negative are considered susceptible. Of course, other choices are possible.

The top two rows of plots in figure 7 show and simulated times from the model with population sizes . Note that in the top row, the fact that trajectories for compartment in are valued above in places is explained in terms of immigration into the compartment exceeding the combined effect of emigration from and individuals transitioning from to . With , the fact that some trajectories for the compartment are roughly increasing over time corresponds to the lack of an outbreak; for other trajectories which rise and then fall, an outbreak does occur.
Due to the choices of , and set out above, it is immediate that the vectors , and appearing in assumptions 4 and 2 exist. The convergence of and as to deterministic limits as discussed in section 5.3 is evident in figure 7.
The middle two rows of figure 7 show the behaviour of the scaled filtering intensities and obtained from algorithm 1 in the case of correctly specified parameters . It is evident that, as per the discussion of asymptotic filtering accuracy in section 5.3, as these quantities converge to the same deterministic limits as do and , respectively. On the other hand, as illustrated in the bottom two rows of figure 7, when the model is not correctly specified, then and converge to limits which are not equal to the limits of and .


Figure 8 illustrates the behaviour of the scaled log-PAL evaluated over a find grid of values fo (all other parameters held constant). Each purple surface in each plot corresponds to a different data set simulated from the model, as in the second row of figure 7. As grows, figure 7 evidences convergence of the maximum PAL estimates to the true parameter value, as per theorem 1.
C.3 Delayed Acceptance PMCMC for the boarding school influenza outbreak
This example illustrates the use of the PAL within delayed acceptance PMCMC, specifically the delayed acceptance Particle Marginal Metropolis Hastings (daPMMH) algorithm of [26].
Data and model
The data set is the well-known boarding school influenza outbreak data, recorded at a British boarding school in 1978 and reported in the British Medical Journal [6, 17]. The data are available in the R package “pomp” [39]. On day one there was one infection and over the course of the day epidemic a total of students reported symptoms from a population of . The observations are prevalence data: daily counts of the total number of symptomatic individuals. We cast this an instance of case (I), using a simple SIR model, where the initial state of the population is fixed to and we define the matrix as follows:
where and are to be estimated. Observations are modelled as binomially under-reported counts of infected individuals, that is, given , where is unknown and to be estimated. To connect with the notation of algorithm 1 we have and for .
Delayed Acceptance Particle Marginal Metropolis Hastings
In the standard PMMH algorithm [5], one calculates a particle filter approximation to the likelihood for each proposed parameter value, which is typically a computationally intensive operation. The daPMMH algorithm introduces an additional ‘pre-screening’ acceptance step based on an approximate likelihood which is assumed to be cheap to evaluate. Only if the proposed parameter is accepted in this initial step is a particle filter approximation to the likelihood then evaluated; thus in performing this additional step, one seeks to avoid running a particle filter for proposals which are likely to be rejected. Details of the validity of the scheme, in the sense that it indeed targets the true posterior distribution over the parameters, can be found in [26]. Algorithm 7 in section C.3.1 of the supplementary material illustrates how to use a PAL within a daPMMH.
We stress that, although for the SIR model the number of compartments is small (), and for the data set in question the population size is fairly small (), this actually presents a stern relative speed test for PALs versus particle filters: the particle filter element of the daPMMH and PMMH algorithms involves simulating from the latent compartmental model, and the overall cost of the particle filter, therefore, grows with both the number of compartments and the size of the population, as well as the number of particles. By contrast, evaluating the PAL involves no random number generation and has a cost independent of population size. Thus, if a relative speed gain using PALs can be demonstrated with a small population size and small number of compartments, it is reasonable to expect an even greater relative speed gain for models with larger numbers of compartments and larger populations.
Results
We compare the performance of three algorithms: PALMH: a Metropolis-within-Gibbs algorithm with the PAL substituted in place of the exact likelihood, i.e., targeting an approximation to the exact posterior distribution; PMMH: a standard Particle Marginal Metropolis-Hastings within Gibbs; daPMMH: a delayed acceptance Particle Marginal Metropolis-Hastings within Gibbs, in which we use the PAL for the delayed acceptance step. We apply these three methods to both a synthetic and a real dataset. For all three algorithms we use Gaussian random walk proposals independently for each element of . The random walk variances are tuned to ensure acceptance rates between 20% and 40%. The PMMH and daPMMH algorithms were each run with particles. All experiments were run on a single core of a 1.90 GHz i7-8650U CPU.
The parameters of the model are collected in the vector . We consider a fairly vague prior , where and are truncated Gaussian densities and is a truncated Gaussian density .
Simulated data.
We simulated an epidemic for 14 days with the parameter regime . For each of the PALMH, PMMH, and daPMMH we ran a length chain, discarded for burn in and then thinned to a sample of . Trace plots, autocorrelation plots, and posterior sample histograms for each scheme are presented in section C.3.1 of the supplementary material, the rates of decay of the ACFs with respect to lag for the daPMMH and PMMH algorithms are similar, the rate of decay for the PALMH algorithm is faster. The Monte Carlo approximations of the posterior marginals are closely matched across the three algorithms, see table 5 for summary statistics, and are concentrated around the data generating parameters. A single evaluation of the PAL took a mean time of seconds, the particle filter approximation to the likelihood took a mean time of seconds, both algorithms were implemented with Rcpp.
Real data.
On the real data we ran the PALMH, PMMH, and daPMMH for iterations each, with run times of 12.2 minutes, 4.5 hours, and 2.8 hours respectively, exhibiting the speed benefits of the PAL approach. Trace plots, autocorrelation plots, and approximate posterior sample histograms for each scheme are presented in section C.3.1, the rate of decay of the ACF with lag is similar for the daPMMH and PMMH algorithms, the rate of decay for the PALMH algorithm is faster. The daPMMH and PMMH algorithms yield very similar approximate posterior marginals as expected – see table 6. The posterior marginals obtained from the PALMH scheme exhibit modes in different locations to those from PMMH/daPMMH, with the following epidemiological interpretation. The approximate posterior marginals obtained from PALMH correspond to a fast growing outbreak (large ), with individuals spending longer in the infected state (small ) and a relatively lower reporting rate (relatively small ). By contrast, the PMMH/daPMMH marginals suggest a slower outbreak (smaller ) with less time spent in the infected compartment (larger ), but with a higher case reporting rate (relatively high ). Posterior predictive checks [24] show that, while having contrasting epidemiological interpretations (potentially due to model mis-specification), both PALMH and PMMH/daPMMH achieve good coverage of the data, see figure 9. The mean trajectories from these posterior predictive distributions reflect the above interpretations of posterior marginals. The posterior predictive means and credible regions were calculated from samples from the posterior predictive distributions produced by the PALMH and daPMMH respectively; each sample from the posterior predictive distribution was generated by: sampling a parameter from the approximate posterior; then using to simulate an epidemic trajectory and data record from the model.
We performed inference on this data set using a Linear Noise Approximation to the likelihood as described in section 4 of [21] within a Metropolis Hastings scheme, the full results can be found in the supplementary material. We find that, whilst the LNA and the PAL perform similarly in terms of parameter inference, the Latent Compartmental Model from which the PAL is derived is more congruent with reality than the SDE model, since the latter allows non-integer and negative counts of individuals in compartments. Furthermore, a single evaluation of the PAL was approximately times faster than a single evaluation of the LNA marginal likelihood for this dataset.
| Parameter | True value | PALMH | PMMH | daPMMH |
| 2 | 2.10 (1.88, 2.34) | 2.08 (1.85 2.35) | 2.08 (1.85,2.35) | |
| 0.5 | 0.51 (0.42, 0.63) | 0.53 (0.44 0.65) | 0.53 (0.43, 0.65 ) | |
| 0.8 | 0.81 (0.70, 0.94) | 0.82 (0.71, 0.96) | 0.82 (0.71, 0.96) |
| Parameter | PALMH | PMMH | daPMMH |
| 2.98 (2.60,3.30) | 2.30 (2.00,2.68) | 2.30 (2.00,2.68) | |
| 0.406 (0.35,0.47) | 0.58 (0.47,0.68) | 0.58 (0.47,0.68) | |
| 0.69 (0.62,0.77) | 0.90 (0.76,0.99) | 0.90 (0.76,0.99) |

PALMH: prior sensitivity analysis
Section C.3 explores Bayesian analysis on real data under vague priors, with results in table 6. Whilst both the PALMH and PMMH schemes result in identical inferences on simulated data, there are discrepancies on the real-world boarding school data - which could be attributed to a misspecified model. The estimated parameters under the PALMH suggest an of around (the PMMH estimates suggest an of around ) which is consistent with the entire population being infected at some point during the epidemic - one can question whether this is a realistic inference. Given the closed nature of this epidemic, along with the likelihood of close monitoring of the individuals in the system, one could afford to place stronger priors on . In this section, we explore the inferences one can make using the PALMH scheme under more informative priors. We consider the following scenarios:
- 1.
- the vague prior used in the original analysis.
- 2.
- an informative prior with mean and variance and mode .
- 3.
- a strongly informative prior with mean and variance and mode .
- 4.
- an atomic prior on (the mean inferred under the PMMH analysis).
- 5.
- an atomic prior on .
For each of these we ran a length chain, discarded for burn in and then thinned to a sample of , we summarise our findings in table 7. We find that as the prior belief in a high reporting rate is strengthened, the resulting estimated lowers. If one places strong prior belief in a high reporting rate, see the and columns, then the inferred falls in line with our findings using the PMMH procedure.
| Parameter | |||||
| 2.98(2.60,3.30) | 2.77(2.29,3.22) | 2.39(2.01,2.84) | 2.46(2.08,2.92) | 2.35(1.98,2.77) | |
| 0.41(0.35,0.47) | 0.44(0.35,0.57) | 0.58(0.49,0.68) | 0.55(0.48,0.63) | 0.59(0.52,0.68) | |
| 0.69(0.62,0.77) | 0.74(0.63,0.90) | 0.94(0.86,0.97) | 0.90 | 0.95 | |
| 6.91 | 6.47 | 4.14 | 4.52 | 4.05 |
To investigate the disparity between inferences using the PALMH procedure vs the PMMH procedure when applied to real data, exhibited in table 6, we repeated the analysis with a fixed (equivalent to the prior). The resulting posteriors for the PALMH and PMMH procedures still exhibited some differences, but were much more similar as a result of this stronger assumption:
- •
The prosterior mean and 95% credible interval for under the PMMH procedure was 2.14 (1.91,2.40), to be compared with 2.46( 2.08,2.92) for PALMH.
- •
The prosterior mean and 95% credible interval for under the PMMH procedure was 0.58 (0.53,0.64), to be compared with 0.55( 0.48,0.63) for PALMH.
- •
The posterior mean estimates for under the PMMH and PALMH procedures were 4.52 and 3.70, respectively.
C.3.1 Algorithm details for section C.3
The following algorithm describes how the PAL can be used within a delayed acceptance pmcmc scheme.
- •
Run algorithm 1 to produce a PAL approximation to and denote this as .
- •
With probability:
run a particle filter to produce an approximation to , denote this as and go to Stage 2. Otherwise, set , set and return to 4.
Time comparisons with the Linear Noise Approximation
For comparisons with the PAL we consider LNAMH: a Metropolis-within-Gibbs algorithm with a Linear noise approximation (LNA) to the likelihood of a stochastic differential equation model used in the accept/reject step, see [21] for details. We apply the LNAMH to the real dataset to compare and contrast to the PAL, for these comparisons we implement the PAL in base R, whereas the LNA computations use base R interfaced with fortran for cumbersome ODE solving calculations. The LNAMH implementation introduces an extra parameter in the variance of a Gaussian obsevation model, analogous to in section 4.2 of [21], which we will denote as ; we consider a vague truncated Gaussian prior of . We ran the chain for 100k iterations, discarded the first 20k and thinned to a sample of 25k to produce the posterior histograms.
The posterior predictive plot associated with the LNAMH sample, figure 10, demonstrates good coverage of the data, yet they help illustrate some of its shortfalls in comparison to the PAL approach: the Gaussian nature of the ingredients of the LNA permits non-integer and even allows negative valued observations, which is clearly not parsimonious with reality; further, modelling with a constant in time observation variance leads to underconfidence in the start and end of the data record. In order to circumvent these issues within the LNA framework, one would have to turn to sophisticaed and expensive methods; alternatively, one could avoid each of them for free through the use of PALs.

Figure 11 reports the mean time ratio between a single evaluation of the LNA likelihood and a single evaluation of the PAL for varying ODE solver intermediate time step choices for the LNA and analogous choice of for the PAL. The order of magnitude of the speed gains is around 100 for the PAL, demonstrating the significant speed benefits given by the simplicity of computations needed to compute the PAL in comparison to cumbersome ODE solution calculations. Experiments were performed on an Intel(R) Core(TM) i7-7700HQ CPU @ 2.80GHz processor.


C.4 Supplementary material for section 7.1
To write the age structured model of section 7.1 as an instance of the Latent Compartmental Model we take and identify vectors , and matrices:
where the are the elements of the vector on the l.h.s. of (7.1). Due to the block-diagonal structure of the matrix for this example, algorithm 3 can be simplified to avoid performing various multiplications by zero. The resulting procedure is algorithm 8.
| Parameter | ODE | PAL |
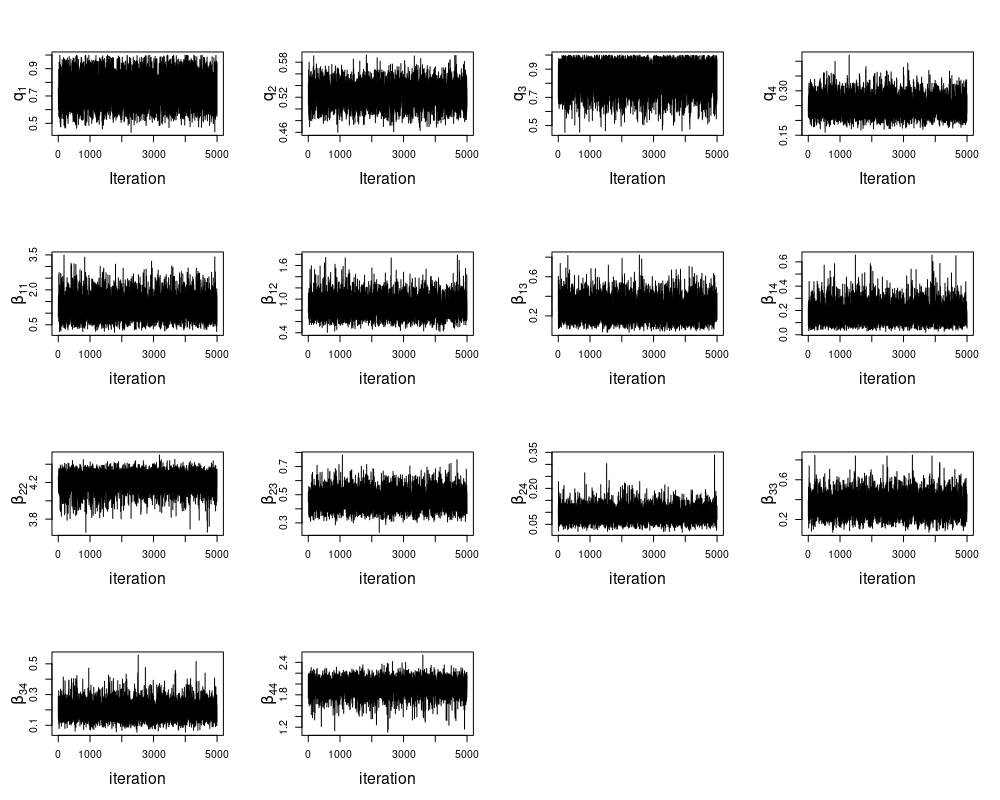


C.5 Supplementary material for section 7.3
C.5.1 Model
The evolution of the full age stratified rotavirus model at time is given by:
| (C.5) | ||||
| (C.6) | ||||
| (C.7) | ||||
| (C.8) | ||||
| (C.9) | ||||
| (C.10) | ||||
| (C.11) | ||||
| (C.12) | ||||
| (C.13) |
where at time : , for some represents new births, which is chosen according to historical birth record data; represents new infectives; represents recovering individuals; represents emigrating (dying) individuals; represents individuals experiencing waning immunity; and represents ageing individuals.
To align notation with the model descriptions in section 3 collect observations at time in the matrix which has elements equal to zero except for age groups , similarly collect reporting rates in which has elements equal to zero except for . Define . Identify the matrix:
| (C.63) | ||||
| (C.64) | ||||
| (C.65) | ||||
| (C.66) | ||||
| (C.67) | ||||
| (C.68) | ||||
| (C.69) | ||||
| (C.70) | ||||
| (C.71) |
Where for models EqEq and EqOv we have for , and for model OvOv we have for , in which case we will write .
For models EqOv and OvOv we have for :
corresponding to the reporting rate of new infectived individuals for each age group. Denote this prior density of as .
C.5.2 Inference
We assume that the values of and are known, we set them to the same values as assumed in [63], these are available on the GitHub page. All other parameters are to be estimated.
Laplace approximation proposals for the rotavirus example
Consider algorithm 9. We factorise the proposal of particles at time , , into sampling from its prior, then given this we seek a Laplace/PAL approximation to the distribution:
Surpressing dependence on the particle, let with calculated as per line 6 of algorithm 9, we have for some constants :
| (C.72) | ||||
To get the mean of a Laplace approximation to the above we must find it’s maximum w.r.t. , hence for :
| (C.73) | ||||
For the variance we find the second derivative and evaluate it at :
| (C.74) | |||
Hence, having proposed from its prior, we propose by setting all elements to be zero except:
| (C.75) |
Let be the proposal density associated with (C.75).
The resulting approximate likelihood estimate for algorithm 9 is:
| (C.76) |
Convergence plots for coordinate ascent algorithm
For each of EqEq EqOv, and OvOv, we performed a finite differencing coordinate ascent optimisation. That is, for each paramter: fix all others to their current value and approximate the sign of the gradient with finite differencing and take a step in positive gradient direction - cycle through parameters until convergence. Figures 24, 25, and 26 demonstrate the convergence of this procedure for each model EqEq, EqOv, and OvOv respectively.


C.5.3 Rotavirus ARMA comparison details.
The benchmark model consists of an ARMA(2,0,1) model fit to the series independently for each age group, taking care to apply the appropriate jacobian transform to the likelihood.
C.6 Supplementary material for section 7.4
C.6.1 Model
As in [71] and [55], we assume that follows the school year:
where is the proportion of the year taken up by school terms, is the mean transition rate for city , and is the relative effect of holidays on transmission. Finally, the new infected and new removed are:
with mean time spent in the exposed compartment and mean recovery time. Given the vectors and , we have:
modelling the new births (immigration) into the susceptible population and the deaths (emigration) across compartments. Since there is no reinfection mechanism in the model (a realistic assumption for measles modelling), it is important to have new individuals enter the population to model the recurrent epidemic peaks present in the data. As already mentioned, for the model to capture recurrent peaks, it must accommodate recruitment into the susceptible compartments. Birthrate data for each city of the model is used to do this — as in [71] — it is assumed that newborns enter the susceptible class after a delay of years, corresponding to the age an individual enters the high-risk school-age demographic. There is a further ‘cohort’ effect aspect to the model: it is assumed that at the start of the school year, a fraction of the lagged births enter the susceptible compartment, the remaining proportion enter at a constant rate throughout the year. This informs the assumed rate parameters and, similarly, death rate records inform choice of . The values used for and are reported in the data available on the GitHub page.
The observations are aggregated incidence data in the form of cumulative fortnightly transitions from infective to recovered for each of the cities subject to binomial under-reporting, at times for . Observations are modelled as transitions from infective to recovered compartments because, on discovery, cases are treated with bed rest and hence removed from the population [55]. Denoting observations as where each has each element equal to zero except for the th element which, conditional on , is distributed:
where consists of all zeros apart from the th entry, which is the reporting rate of transitions from infective to recovered. We assume that this rate follows for , denote this density with for the purposes of algorithm 10. The mean under-reporting rate parameters, , are assumed known for each city and are set to the same values as [55], which are available in the data on the GitHub page, is to be estimated.
C.6.2 Inference
To employ the algorithms described in the methodology section we need to specify the transition matrix , which in the case of this model is of size . To be more succinct, we can write out a matrix for each city . We define our matrices :
where
Proposals for algorithm 10
The details for the derivation of the proposals used in algorithm 10 lines 11 and 29 are similar to those of section C.5, so we omit them. Suppressing dependence on the particle, let with calculated as per line 7 (resp. 25) of algorithm 9 and define:
| (C.79) |
Inference
In each model instance, A,B, and C, described in 7.4, we can define , , and :
- •
A: , , and .
- •
B: , , and .
- •
C: , , and .
Each block, labelled , corresponds to a specific city. This block structure allows one to perform proposals and weighting locally to each block, avoiding explicit high-dimensional filtering. At time , the lookahead scheme consists of: performing a ‘regular’ particle propagation and reweighting step (the usual SMC iteration), then we propagate again each particle and run a PAL iteration for time , with ‘dummy’ particles (used purely for weighting purposes, denoted with tildes in algorithm 10), we then weight the original particles proportionally to the joint likelihood of the regular and dummy particles at times and - taking care to apply the appropriate correction in the likelihood calculation, dummy particles are then discarded. We found that this scheme greatly reduced Monte Carlo error. See algorithm 10 for our implementation.The resulting approximate log-likelihood estimate associated with algorithm 10 is:
C.6.3 Measles ARMA comparison details.
The benchmark model consists of an ARMA(2,0,1) model fit to the series independently for each each city, taking care to apply the appropriate jacobian transform to the likelihood.
Measles projection details.
The sample, size , of projected case numbers used to produce figure 6 in the main article were generated by the following workflow:
- 1.
Presampling with set to our point estimate, for , , and .
- 2.
Running our PALSMC scheme on the original dataset with 300 particles and parameters set to our point estimates, taking as output a sample of final time-point population state intensity vectors .
- 3.
For and , propagate the intensity vectors through the transition kernel using the iteration for (corresponding to 8 weeks):
(C.81) (C.82) Where and are chosen according to the assumption that birth rates and death rates remain constant.
- 4.
Simulate for corresponding to weeks and for each sample .

| City | ||||||||
| BIRKENHEAD | 143 | 0.07594 | 0.00007 | 0.00013 | 0.92387 | 8.47 | 8.49 | 9.53 |
| BIRMINGHAM | 1118 | 0.04575 | 0.00005 | 0.00013 | 0.95408 | 5.63 | 8.49 | 9.53 |
| BLACKPOOL | 150 | 0.07210 | 0.00005 | 0.00259 | 0.92525 | 12.93 | 8.49 | 9.53 |
| BOLTON | 169 | 0.09337 | 0.00007 | 0.00120 | 0.90537 | 9.44 | 8.49 | 9.53 |
| BOURNEMOUTH | 140 | 0.12166 | 0.00006 | 0.00005 | 0.87822 | 10.62 | 8.49 | 9.53 |
| BRADFORD | 294 | 0.08243 | 0.00004 | 0.00044 | 0.91708 | 10.22 | 8.49 | 9.53 |
| BRIGHTON | 158 | 0.07625 | 0.00008 | 0.00035 | 0.92332 | 14.66 | 8.49 | 9.53 |
| BRISTOL | 443 | 0.07355 | 0.00009 | 0.00206 | 0.92430 | 8.63 | 8.49 | 9.53 |
| CARDIFF | 245 | 0.09190 | 0.00005 | 0.00058 | 0.90747 | 7.81 | 8.49 | 9.53 |
| COVENTRY | 257 | 0.11602 | 0.00004 | 0.00018 | 0.88376 | 8.16 | 8.49 | 9.53 |
| DERBY | 143 | 0.11061 | 0.00006 | 0.00008 | 0.88925 | 10.46 | 8.49 | 9.53 |
| GATESHEAD | 115 | 0.08601 | 0.00007 | 0.00006 | 0.91386 | 8.28 | 8.49 | 9.53 |
| HUDDERSFIELD | 130 | 0.09003 | 0.00007 | 0.00022 | 0.90968 | 10.78 | 8.49 | 9.53 |
| HULL | 302 | 0.06856 | 0.00009 | 0.00083 | 0.93051 | 9.28 | 8.49 | 9.53 |
| IPSWICH | 104 | 0.08528 | 0.00009 | 0.00000 | 0.91463 | 9.03 | 8.49 | 9.53 |
| LEEDS | 510 | 0.09935 | 0.00006 | 0.00168 | 0.89891 | 5.92 | 8.49 | 9.53 |
| LEICESTER | 288 | 0.07103 | 0.00005 | 0.00133 | 0.92759 | 9.00 | 8.49 | 9.53 |
| LIVERPOOL | 802 | 0.05754 | 0.00004 | 0.00025 | 0.94217 | 5.63 | 8.49 | 9.53 |
| LONDON | 3389 | 0.04575 | 0.00006 | 0.00021 | 0.95399 | 5.63 | 8.49 | 9.53 |
| MANCHESTER | 704 | 0.05658 | 0.00003 | 0.00145 | 0.94193 | 7.29 | 8.49 | 9.53 |
| MIDDLESBOROUGH | 146 | 0.06662 | 0.00007 | 0.00067 | 0.93264 | 11.32 | 8.49 | 9.53 |
| NEWCASTLE | 295 | 0.07129 | 0.00005 | 0.00024 | 0.92843 | 9.19 | 8.49 | 9.53 |
| NORWICH | 120 | 0.10958 | 0.00005 | 0.00000 | 0.89037 | 12.78 | 8.49 | 9.53 |
| NOTTINGHAM | 307 | 0.05794 | 0.00004 | 0.00068 | 0.94133 | 11.54 | 8.49 | 9.53 |
| OLDHAM | 119 | 0.09814 | 0.00007 | 0.00092 | 0.90087 | 11.57 | 8.49 | 9.53 |
| PLYMOUTH | 209 | 0.08388 | 0.00006 | 0.00077 | 0.91529 | 13.37 | 8.49 | 9.53 |
| PORTSMOUTH | 240 | 0.07339 | 0.00007 | 0.00295 | 0.92359 | 9.39 | 8.49 | 9.53 |
| PRESTON | 120 | 0.06501 | 0.00007 | 0.00242 | 0.93251 | 7.52 | 8.49 | 9.53 |
| READING | 116 | 0.07686 | 0.00005 | 0.00137 | 0.92172 | 12.93 | 8.49 | 9.53 |
| SALFORD | 178 | 0.08982 | 0.00007 | 0.00109 | 0.90903 | 8.82 | 8.49 | 9.53 |
| SHEFFIELD | 515 | 0.07818 | 0.00006 | 0.00308 | 0.91869 | 8.10 | 8.49 | 9.53 |
| SOUTHAMPTON | 181 | 0.11018 | 0.00006 | 0.00391 | 0.88585 | 11.14 | 8.49 | 9.53 |
| SOUTHEND | 152 | 0.11816 | 0.00008 | 0.00043 | 0.88132 | 16.65 | 8.49 | 9.53 |
| ST.HELENS | 112 | 0.09871 | 0.00008 | 0.00256 | 0.89864 | 9.89 | 8.49 | 9.53 |
| STOCKPORT | 142 | 0.09721 | 0.00004 | 0.00231 | 0.90044 | 9.03 | 8.49 | 9.53 |
| STOKE | 276 | 0.07614 | 0.00006 | 0.00071 | 0.92310 | 8.62 | 8.49 | 9.53 |
| SUNDERLAND | 178 | 0.06698 | 0.00006 | 0.00088 | 0.93208 | 14.90 | 8.49 | 9.53 |
| SWANSEA | 162 | 0.08195 | 0.00006 | 0.00052 | 0.91748 | 12.59 | 8.49 | 9.53 |
| WALSALL | 115 | 0.08378 | 0.00009 | 0.00080 | 0.91533 | 13.75 | 8.49 | 9.53 |
| WOLVERHAMPTON | 162 | 0.06376 | 0.00006 | 0.00021 | 0.93597 | 8.57 | 8.49 | 9.53 |