Automated Driving Systems: Impact of Haptic Guidance on Driving Performance after a Take Over Request
Abstract
In conditional automation, a response from the driver is expected when a take over request is issued due to unexpected events, emergencies, or reaching the operational design domain boundaries. Cooperation between the automated driving system and the driver can help to guarantee a safe and pleasant transfer if the driver is guided through a haptic guidance system that applies a slight counter-steering force to the steering wheel. We examine in this work the impact of haptic guidance systems on driving performance after a take over request was triggered to avoid sudden obstacles on the road. We studied different driver conditions that involved Non-Driving Related Tasks (NRDT). Results showed that haptic guidance systems increased road safety by reducing the lateral error, the distance and reaction time to a sudden obstacle and the number of collisions.
I Introduction
The integration of Automated Driving Systems (ADS) in the roads is expected to be gradual due to the technical complexity and social acceptance challenges that they involve [1]. In this context Advanced Driver Assistance Systems (ADAS) with different levels of autonomy can support tactical and operational driving tasks [2]. At level 3 or conditional automation level, the ADS of the vehicle can perform most of the Dynamic Driving Task (DDT) under their Operational Design Domain (ODD), allowing users to engage in Non-Driving Related Tasks (NDRT). However, a response from the driver is still expected when a Take Over Request (TOR) is issued due to unexpected events, emergencies, or reaching the ODD boundaries [3]. In this context, actions to take over the control of the vehicle require to take into account the drivers’ cognitive load and/or attention level to the road as they will affect the time to respond to a TOR. In line with this, ADS and drivers can cooperate to guarantee a safe and pleasant transfer that diminish the effects of inattentive driving. For example, the ADS can issue the TOR through a warning buzzer while a haptic guidance system applies a slight counter-steering force to the steering wheel to guide the driver through the maneuver.
To contribute to the state of the art, we examined in this work the impact of haptic guidance systems on driving performance after a TOR was triggered. To this end, we defined a scenario in which sudden events forced drivers to perform maneuvers to avoid obstacles on the road. We also defined several automation scenarios and NDRT s as independent variables to manipulate and measure the dependent variables that related to the driving performance.
The remainder of this paper is organized as follows: the next section describes related studies in the field; section III details the experimental design; section IV presents the method used to acquire and process the data collected; sections V and VI present and discuss the obtained results. Finally section VII concludes the present study outlining future research.
II Related Work
Several works have described the key factors that affect driving performance after having the driver regained the control of an automated vehicle.
For example, results from driving simulation research showed that high traffic density decreased driving performance and increased the potential of maximum acceleration, leading to a lower time to avoid a collision
[4, 5].
Safety can be increased through collaboration approaches in which shared control policies help the driver and ADS to interact with each other [6]. In this context, haptic guidance systems [7] are often used
relying on driver’s intention prediction approaches and modules that assess the decision of the percentage of control that the ADS and driver have over the vehicle [8]. For example, in the work in [9], authors used an inductive Multi-Label Classification with Unlabeled data (iMLCU) [10] approach to classify drivers’ intent, which was then compared to the desired maneuver
to establish the degree of control between the driver and the car.
In an additional work, an architecture was proposed to calculate dynamic trajectories that took into account the driver’s decisions. Actions to track the calculated trajectories using a control design were then performed relying on the Lyapunov method and Takagi-Sugeno Fuzzy model-based techniques [11].
Furthermore, studies like the one in [12] concluded that haptic guidance systems in straight and curve roads lead to a decrease in lateral error. Several degrees of system authority that ranged from no torque to a 100% torque that was applied by the ADS were also studied in [13], showing the results an increase in acceptability in scenarios with low degrees of shared control and low visibility.
Even though the works mentioned above designed and studied shared control policies to track specific paths, most of them only considered non-emergency scenarios. An exception constitutes the paper in [14]. However, a state of driver distraction through NDRT was not considered in this work. The authors studied how different shared control policies affected drivers’ ability to avoid a sudden obstacle on the road. They found that driving performance increased as the system’s authority over the vehicle increased, being the best results in situations in which the driver had no control over the vehicle. Another finding of the study was that high system authority yielded lower driver comfort.
To the best of our knowledge, studies that analyze the influence of shared control on drivers that were performing NDRTs and are required to take over the control of the vehicle are scarce. Findings in the field very often refer to studies based on simulations, in which no drivers are involved. Therefore the resulting outcome is not applicable to real situations in which a control transfer to the driver is required.
Therefore, we contribute with this work to the body of research by assessing the impact of a haptic guidance system to avoid a sudden obstacle on the road after having a TOR been issued and having been the drivers involved in secondary tasks. To this end, we implemented a haptic guidance system in the driver-centric simulation module of the 3DCoAutoSim simulation platform. 11 1 10
III System Implementation Approach
We implemented a haptic guidance system to investigate its effect on driving performance after the driver was requested to take over the control of the vehicle. To this end we defined several NDRT s and a scenario that forced drivers to avoid sudden obstacles on the road. We expected a certain outcome as a result of the effect of the system on the driving performance that we measured through the following metrics: maximum acceleration, lateral deviation, and distance to an obstacle on the road. We additionally measured the reaction time to start the obstacle avoidance maneuver from the time the obstacle appeared on the road. A detailed definition of these metrics is provided in Section IV-A. We defined the potential outcome through the formulation of the following hypotheses:
- •
A) H0. Haptic-guidance systems do not have any effect on drivers reaction time to perform an obstacle avoidance maneuver after a TOR is issued.
H1.Haptic-guidance systems decrease drivers reaction time to perform an obstacle avoidance maneuver after a TOR is issued. - •
B) H0. Haptic-guidance systems do not have any effect on the lateral deviation after a TOR.
H1. Haptic-guidance systems decrease lateral deviation after a TOR. - •
C) H0. Haptic-guidance systems do not have any effect on the minimum distance to an obstacle while performing an avoidance maneuver after a triggered TOR.
H1. Haptic-guidance systems decrease the minimum distance to an obstacle while performing an avoidance maneuver after a triggered TOR. - •
D) H0. Haptic-guidance systems have no effect on the maximum acceleration applied by drivers after a TOR.
H1. Haptic-guidance systems decrease the maximum acceleration applied by drivers after a TOR. - •
E) H0. Haptic-guidance systems do not have any effect on the number of drivers that collide with an obstacle after a TOR is triggered.
H1. Haptic-guidance systems decrease the number of drivers that collide with an obstacle after a TOR is triggered TOR.
III-A Experimental setup and procedure
Before starting the experiment, the participants were informed about the setup and instructed about how to engage and disengage the ADS of the vehicle by pressing a button located in the steering wheel. To get familiarized with the simulator the participants were allowed to drive one lap through the road scenario. The total time to finalize the experiment was 30 minutes. Previously to activating the automated driving mode, the drivers had to maintain their position on the right lane of the road until the system activated the automated mode. In automated mode the vehicle was programmed to follow the center of the right lane at 80 km/h and the drivers were asked to perform an NDRT until a TOR was issued. When an obstacle appeared on the road the driver needed to avoid it by changing lanes and then returning to the right lane. The order of the conditions was alternated to avoid bias as depicted in Figure 1.
III-B Driving scenario
Figure 2(a) shows the created scenario which consisted of a 15 km two-way highway (three lanes per way) with fences and trees on the side of the road. Mountains and buildings completed the scenario to provide the required realism. Along the road, a sudden event was triggered to replicate obstacles that can unexpectedly fall on the road (e.g. cargo from a truck or stones from the side of a mountain). They were located at a distance of 100 meters from the vehicle and consisted of a pile of boxes that fell on the road and spread through the driving lane, forcing drivers to avoid them and change the lane to continue driving (see Figure 2(b)).
III-C Sample and simulation apparatus
A sample of 23 participants with a valid driving license performed the simulation-based experiment (average age of 29.12 (SD = 15.16)). None of them had previous experience with ADS.
As previously mentioned, we used the driver-centric module of the 3DCoAutoSim simulation framework [15, 16]. This framework is a Unity3D based simulator, composed of a physical steering wheel, pedals, gear shift, and a comfortable car seat for a realistic driving experience. Three 4k monitors were installed in front of the steering platform to provide a wider field of view. The 3DCoAutoSim framework can simulate large 3D models, while allowing developers to add custom experimental scenarios and features to the framework [17].


The NDRT s were performed using a Samsung S10 mobile phone that the participants held while performing the tasks. These tasks were programmed in Unity to work under an Android phone.
To collect the pertinent data we defined scenarios in which the participants were assisted by the haptic guidance system while performing NDRT in automated driving modus. To this end, we defined the system activation conditions and NDRT as independent variables as detailed below.
- 1.
Level 3: The ADS of the simulated vehicle was enabled. Participants were expected to take the control of the vehicle when a TOR was issued to avoid the upcoming obstacle. The driver was requested to perform different NDRT s. Driving without task in automated modus was evaluated as baseline condition.
- 2.
Level 3 + haptic guidance: The participants in the experiment regained control of the vehicle and avoided the obstacle with the assistance of the haptic guidance system when a TOR was issued. Prior to this action they were performing NDRT s. A baseline condition without any task was compared in this scenario, in which the ADS cooperated with the participants by applying a small counter force to the steering wheel, helping them to avoid the obstacle on the road.
To evaluate the effect of cognitive workload and eyes off the road on the driving performance the following NDRT s were performed relying on the field test presented in [19]:
- •
No Task: No task was performed while the vehicle was driven by the ADS.
- •
Visual: The Stroop Color and Word Test (SCWT) [20], was visualized on a provided mobile phone. The test consisted on speaking out loud the color in which a color name was written (e.g the work “purple” was written with a green font).
- •
Manual: Several M8x8 screws needed to be extracted from a bag filled with balls of 1 cm radius.
- •
Visual-Manual: A given text needed to be written backwards on the mobile phone.
We manipulated these described conditions to study their effect on the dependent variables that related to driving performance and TOR as described in section IV.
III-D Haptic guidance system and TOR
To perform the pertinent experiments we implemented a spring force feedback effect in the physical steering wheel of the simulator. We additionally implemented a custom software that served as interface between the simulation environment and the physical steering wheel. The torque applied to the steering was proportional to the angle between a given position and the current position of the steering.
IV Data Collection and Evaluation
We acquired driving-related data through the 3D CoAutoSim framework at a sampling rate of 10 Hz for the simulated GPS data, and 100 Hz for the simulated CAN data.
IV-A Driving parameters
We extracted and analyzed the following dependent variables:
- •
Reaction time (RT): Defined as the elapsed time between the issue of the TOR and the initiation of the obstacle avoidance maneuver [21].
- •
Lateral root mean square error (RMSE): Defined as root square mean of transverse error between the center of the lane and the position of the car [22].
- •
Distance to obstacle (DTO): Defined as the minimum distance required to collide with an obstacle [23].
- •
- •
Collisions: Defined as the number of participants that collided with the upcoming obstacle for each scenario and secondary task.
IV-B Data processing
The acquired data was synchronized in the 3DCoAutoSim framework using a Unity’s synchronization method between simulation processes. After this action, we calculated the maximum acceleration according to [24].
Given the longitudinal acceleration and lateral acceleration , the maximum acceleration is defined as:
| (1) |
It is important to mention that the obtained accelerations were simulated and might therefore differ from real scenarios.
To calculate the lateral RMSE after the issue of the TOR, we estimated an optimal lane change path using heuristic methods. We then compared the position of the vehicle and the path to obtain the lateral error () during each time frame (). The lateral RMSE for sampled points was calculated by:
| (2) |
To determine the reaction time to start the obstacle avoidance maneuver, we triggered a timer along with the sudden event that caused the TOR. The timer was stopped when the steering wheel was steered by at least 2 degrees [4, 26]. According to the literature, this was the value that signalized that an obstacle avoidance maneuver was being performed in a scenario without sudden events.
Finally, we obtained the minimum distance to obstacle () by the following means:
| (3) |
Being the position of the vehicle at time step after the TOR is triggered and the corresponding obstacle location.
We additionally obtained the number of collisions by checking if the position of the vehicle over the path coincided with the bounding box created by the obstacle, being the position of the center of the obstacle, and and the respective width and height of the obstacle.
| (4) |
| (5) |


IV-C Statistical Analysis
To analyze the acquired data and determine if there was a statistical significant relationship between the use of the haptic guidance system, secondary tasks variables and the dependent driving parameters, we performed a one Way ANOVA with a Bonferroni multiple post-hoc comparison. We then compared the effect of using or not the haptic guidance system for each secondary task with a paired t-test. Additionally, as data was obtained from repeated samples, we performed a Cochran Q non-parametric test for dependent samples with a McNemar’s post hoc test to examine the statistical relationship between the use of the system and NDRT on the number of drivers that collided with the obstacle for each test.
V Results
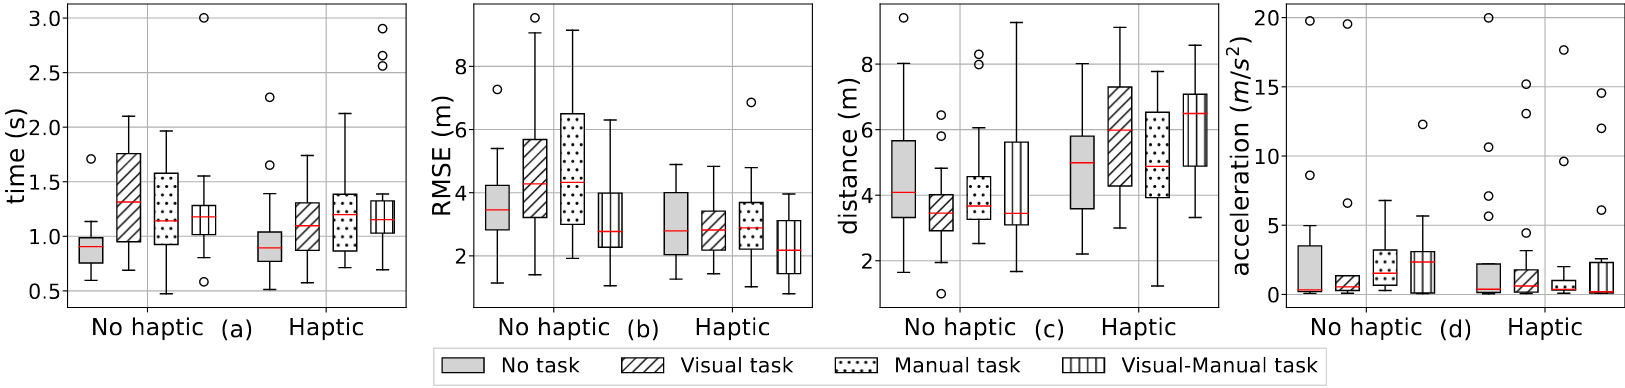
The results from the performed analyses when participants were exposed to a level 3 of automation with and without haptic guidance regarding reaction time (RT), lateral root mean square error (RMSE), minimum distance to obstacle (DTO), and maximum acceleration (MA) are depicted in Figure 4 and Figure 5.
Figure 6 depicts the obtained trajectories that each participant traveled in the different scenarios. Table I presents the mean and standard deviation values of each dependent variable at each scenario performed by the participants.
Tables I and II present the statistical relationship between the dependent variables and the use / not use of the haptic guidance system after a take over request for each secondary task. Table III shows if any particular NDRT benefits more from the activation of the haptic guidance system.
| Metric | No task | Visual task | Manual task | Visual-Manual task |
| No haptic | Haptic | No haptic | Haptic | No haptic | Haptic | No haptic | Haptic |
| SD | SD | SD | SD | SD | SD | SD | SD | |||||||||
| RT | 0.907 | 0.248 | 1.001 | 0.402 | 1.358 | 0.469 | 1.086 | 0.290 | 1.225 | 0.421 | 1.221 | 0.411 | 1.225 | 0.482 | 1.368 | 0.623 |
| RMSE | 3.555 | 1.332 | 3.004 | 1.182 | 4.820 | 2.166 | 2.901 | 0.953 | 4.987 | 2.374 | 3.087 | 1.360 | 3.234 | 1.436 | 2.256 | 0.898 |
| DTO | 4.388 | 1.958 | 4.839 | 1.501 | 3.536 | 1.354 | 6.130 | 1.985 | 4.237 | 1.771 | 5.392 | 1.628 | 4.244 | 2.019 | 6.251 | 1.339 |
| MA | 3.315 | 5.764 | 2.004 | 3.103 | 3.372 | 6.029 | 3.0886 | 4.685 | 2.562 | 2.356 | 2.476 | 4.831 | 2.480 | 3.243 | 2.985 | 4.708 |
| Metric | No task | Visual task ()*** | Manual task ()* | Visual-Manual task (**) |
| No haptic | Haptic | No haptic | Haptic | No haptic | Haptic | No haptic | Haptic |
| yes | no | yes | no | yes | no | yes | no | yes | no | yes | no | yes | no | yes | no | |
| Cols. | 15 | 8 | 9 | 14 | 20 | 3 | 6 | 17 | 18 | 5 | 9 | 14 | 15 | 8 | 4 | 19 |
| No haptic vs Haptic t-test ( =0.05) |
| Metric | No Task | Visual task | Manual task | visual-manual task |
| t(23) | p | t(23) | p | t(23) | p | t(23) | p | |
| RT | -0.978 | 0.342 | 2.278 | 0.036 | 0.981 | 0.340 | -0.685 | 0.502 |
| RMSE | 0.550 | 1.000 | 3.739 | 0.002** | 2.6 | 0.019* | 2.942 | 0.009** |
| DTO | -0.418 | 0.681 | -5.552 | .001*** | 1.388 | 0.183 | 2.570 | 0.020* |
| MA | 0.005 | 0.998 | 0.3891 | 0.766 | 0.991 | 0.121 | 0.046 | 0.964 |
| ANOVA ( =0.05) |
| Metric | Haptic |
| F(3) | p | |
|---|---|---|
| RT | 2.163 | 0.101 |
| RMSE | 1.963 | 0.128 |
| DTO | 2.380 | 0.077 |
| MA | 0.068 | 0.977 |
| Cochran’s Q test ( =0.05) |
| Metric | Haptic |
| F(23) | p | |
| Cols. | 3.857 | 0.277 |
V-A Reaction time
As depicted in Tables I and II, when comparing all the tasks with each other and the potential benefit of using the system, results from the paired sample student t-test showed that there was a statistical significant relationship between the reaction time to start the obstacle avoidance maneuver when participants were performing the visual task (1.358 s without haptic guidance vs 1.086 s with haptic guidance).
The results from the ANOVA test (Table III) showed that there was not a statistically significant relationship between the reaction time to avoid an obstacle when participants received guidance through the steering wheel and performing a NDRT.
V-B Lateral root mean square error
The analysis of the driving performance resulted in a statistically significant relationship between the lateral RMSE and the use of the system. Tables I and and II show that there were differences for the visual task (4.820 m without haptic guidance vs 2.901 m with haptic guidance), manual task (4.987 m without haptic guidance vs 3.087 m with haptic guidance) and visual-manual task (3.234 m without haptic guidance vs 2.256 m with haptic guidance).
The results from the ANOVA statistic test showed that there were no statistically significant differences between using the system after a take over request and the performance of secondary tasks in general (Table III).
V-C Minimum distance to obstacle
The results from comparing the minimum distance to the sudden obstacle on the road for each secondary task in scenarios without haptic guidance compared with haptic guidance, showed statistically significant differences when the participants were performing the visual task (3.536 m vs 6.130 m) and the visual-manual task (4.244 m vs 6.251 m). The effect of the use of the system on distance in the manual task was not statistically significant (see Tables I and II).
There were no statistically significant differences between the minimum distance to the obstacle on the road and the performance of NDRT in general when the guiding system was active (Table III).
V-D Maximum acceleration
V-E Obstacle collisions
Statistical significant differences could be found when aplying the McNemar’s test in the visual task (20 collisions without haptic guidance compared with 6 collisions using the haptic guidance system), manual task (18 collision vs 9 collisions) and visual-manual task (15 collisions vs 4 collisions) (Table I).
The Cochran Q test results obtained from comparing the number of collisions with the obstacle that suddenly appeared on the road, with the use of the guiding system showed that there were no statistical significant differences that related to the performance of secondary tasks (Table III).
.
VI Summary of Findings and Discussion
The data collected through the experiments performed in this study delivered interesting results regarding the effect of an assistance system to avoid an obstacle on the road after being the participants involved in NDRT s, while the vehicle was driving in a level 3 automated mode and the driver was requested to take the control of the vehicle. Results showed that their reaction times to start the avoidance maneuver were slower after having performed the visual task compared to the other NDRT s. Apparently, the visual task required more attentional resources than the other tasks. This difference was however not statistically significant.
In most cases, the activation of the guiding system improved the participants’ trajectories to avoid the obstacle. However, this was not always the case when no secondary task was performed. The performance of the driving task without NDRT resulted in a faster reaction to the TOR, and as a consequence a higher, safer distance to it. This was due to the fact that drivers started the avoidance maneuver faster and overrode the guidance system. However, the RMSE and MA values were still improved by the guidance system, even without being the driver involved in a secondary task.
In situations in which the drivers were engaged in the performance of secondary tasks, the time required for them to regain road situational awareness and obstacle avoidance readiness enabled the system to operate for a longer period of time without being overruled by the authority of the participants. As a result, the lateral errors during the avoidance maneuver were reduced.
The activation of the haptic guidance system when NDRT s were performed, also resulted in greater distances between the vehicle and the road obstacle, avoiding thus a possible collision. The same tendency could be seen in the manual task, being however the increased values not statistically significant.
It is noteworthy to mention that we designed the scenario to emulate critical situations on purpose. Thus, we expected a high collision rate. However, in the scenarios in which the haptic guidance system was enabled, we observed a higher rate of participants that successfully avoided the obstacle. The haptic guidance system took the control of the vehicle faster than the driver, starting thus the avoidance maneuver sooner.
These findings were in line with the findings reported in [14], in which a higher rate of maneuvers that avoided the obstacle occurred when the participants didn’t have the control of the vehicle.
Based on the analyses results, we reject the null hypotheses defined in section III, A, B, C and E and accept the alternative hypotheses H1 in those cases. Maximum acceleration was not affected by the use of haptic guidance systems. Therefore, we accept the null hypothesis defined in section III, D.
VII Conclusion and Future Work
In this work we studied the impact of haptic guidance systems on driver’s ability to take back the control of a level 3 vehicle and avoid an obstacle on the road. To this end, we defined different scenarios in which a sudden event triggered a TOR. We also exposed the participants to different secondary tasks to study the effect of visual and cognitive distraction on the driving performance. To this end, we defined as independent variables the haptic guidance system and the NDRT.
Results showed that the use of haptic guidance systems positively affected driving performance after a take over request in a variety of situations that involved secondary tasks, being these systems therefore helpful to promote road safety.
Future work will address different levels of haptic guidance that will be tailored to different scenarios. We will additionally explore realistic scenarios in field tests by relying on the use of a real vehicle.
ACKNOWLEDGMENT
This work was partially supported by the Austrian Science Fund (FWF), within the project ”Interaction of autonomous and manually-controlled vehicles (IAMCV)”, number P 34485-N and the Austrian Ministry for Climate Action, Environment, Energy, Mobility, Innovation and Technology (BMK) Endowed Professorship for Sustainable Transport Logistics 4.0., IAV France S.A.S.U., IAV GmbH, Austrian Post AG and the UAS Technikum Wien.
References
- [1] C. Olaverri-Monreal, “Promoting trust in self-driving vehicles,” Nature Electronics, vol. 3, no. 6, pp. 292–294, 2020.
- [2] ——, “Road safety: Human factors aspects of intelligent vehicle technologies,” in Smart Cities, Green Technologies, and Intelligent Transport Systems, B. Donnellan, C. Klein, M. Helfert, O. Gusikhin, and A. Pascoal, Eds. Cham: Springer International Publishing, 2019, pp. 318–332.
- [3] W. Morales-Alvarez, O. Sipele, R. Léberon, H. H. Tadjine, and C. Olaverri-Monreal, “Automated driving: A literature review of the take over request in conditional automation,” Electronics, vol. 9, no. 12, p. 2087, 2020.
- [4] N. Du, J. Kim, F. Zhou, E. Pulver, D. M. Tilbury, L. P. Robert, A. K. Pradhan, and X. J. Yang, “Evaluating effects of cognitive load, takeover request lead time, and traffic density on drivers’ takeover performance in conditionally automated driving,” in 12th International Conference on Automotive User Interfaces and Interactive Vehicular Applications, 2020, pp. 66–73.
- [5] A. Eriksson, S. M. Petermeijer, M. Zimmermann, J. C. F. de Winter, K. J. Bengler, and N. A. Stanton, “Rolling out the red (and green) carpet: Supporting driver decision making in automation-to-manual transitions,” IEEE Transactions on Human-Machine Systems, vol. 49, no. 1, pp. 20–31, 2019.
- [6] M. Marcano, S. Díaz, J. Pérez, and E. Irigoyen, “A review of shared control for automated vehicles: Theory and applications,” IEEE Transactions on Human-Machine Systems, 2020.
- [7] M. Steele and R. B. Gillespie, “Shared control between human and machine: Using a haptic steering wheel to aid in land vehicle guidance,” in Proceedings of the human factors and ergonomics society annual meeting, vol. 45, no. 23. SAGE Publications Sage CA: Los Angeles, CA, 2001, pp. 1671–1675.
- [8] S. M. Erlien, S. Fujita, and J. C. Gerdes, “Safe driving envelopes for shared control of ground vehicles,” IFAC Proceedings Volumes, vol. 46, no. 21, pp. 831–836, 2013.
- [9] M. Li, H. Cao, X. Song, Y. Huang, J. Wang, and Z. Huang, “Shared control driver assistance system based on driving intention and situation assessment,” IEEE Transactions on Industrial Informatics, vol. 14, no. 11, pp. 4982–4994, 2018.
- [10] L. Wu and M.-L. Zhang, “Multi-label classification with unlabeled data: An inductive approach,” in ACML, 2013.
- [11] A. Benloucif, A.-T. Nguyen, C. Sentouh, and J.-C. Popieul, “Cooperative trajectory planning for haptic shared control between driver and automation in highway driving,” IEEE Transactions on Industrial Electronics, vol. 66, no. 12, pp. 9846–9857, 2019.
- [12] H. Lee and S. Choi, “Combining haptic guidance and haptic disturbance: an initial study of hybrid haptic assistance for virtual steering task,” in 2014 IEEE Haptics Symposium (HAPTICS), 2014, pp. 159–165.
- [13] F. Mars, M. Deroo, and J.-M. Hoc, “Analysis of human-machine cooperation when driving with different degrees of haptic shared control,” IEEE Transactions on Haptics, vol. 7, no. 3, pp. 324–333, 2014.
- [14] A. Bhardwaj, Y. Lu, S. Pan, N. Sarter, and R. B. Gillespie, “Comparing coupled and decoupled steering interface designs for emergency obstacle evasion,” IEEE Access, vol. 9, pp. 116 857–116 868, 2021.
- [15] C. Olaverri-Monreal, M. Gvozdic, and B. Muthurajan, “Effect on driving performance of two visualization paradigms for rear-end collision avoidance,” in 2017 IEEE 20th International Conference on Intelligent Transportation Systems (ITSC), 2017, pp. 77–82.
- [16] A. Hussein, A. Díaz-Álvarez, J. M. Armingol, and C. Olaverri-Monreal, “3dcoautosim: Simulator for cooperative adas and automated vehicles,” in 2018 21st International Conference on Intelligent Transportation Systems (ITSC), 2018, pp. 3014–3019.
- [17] N. Smirnov, Y. Liu, A. Validi, W. Morales-Alvarez, and C. Olaverri-Monreal, “A game theory-based approach for modeling autonomous vehicle behavior in congested, urban lane-changing scenarios,” Sensors, vol. 21, no. 4, 2021. [Online]. Available: https://www.mdpi.com/1424-8220/21/4/1523
- [18] C. Olaverri-Monreal, S. Kumar, and A. Dìaz-Àlvarez, “Automated driving: Interactive automation control system to enhance situational awareness in conditional automation,” in 2018 IEEE Intelligent Vehicles Symposium (IV). IEEE, 2018, pp. 1698–1703.
- [19] W. Morales-Alvarez, M. Marouf, H. H. Tadjine, and C. Olaverri-Monreal, “Real-world evaluation of the impact of automated driving system technology on driver gaze behavior, reaction time and trust,” 2021.
- [20] A. R. Jensen and W. D. Rohwer Jr, “The stroop color-word test: a review,” Acta psychologica, vol. 25, pp. 36–93, 1966.
- [21] C. Gold, M. Körber, D. Lechner, and K. Bengler, “Taking over control from highly automated vehicles in complex traffic situations: The role of traffic density,” Human Factors, vol. 58, no. 4, pp. 642–652, 2016, pMID: 26984515. [Online]. Available: https://doi.org/10.1177/0018720816634226
- [22] C. Sun, X. Zhang, Q. Zhou, and Y. Tian, “A model predictive controller with switched tracking error for autonomous vehicle path tracking,” IEEE Access, vol. 7, pp. 53 103–53 114, 2019.
- [23] “Intelligent transport systems — Forward vehicle collision warning systems — Performance requirements and test procedures,” International Organization for Standardization, Geneva, CH, Standard, 2013.
- [24] C. Gold, D. Damböck, L. Lorenz, and K. Bengler, ““take over!” how long does it take to get the driver back into the loop?” Proceedings of the Human Factors and Ergonomics Society Annual Meeting, vol. 57, pp. 1938 – 1942, 2013.
- [25] J. W. Kim and J. H. Yang, “Understanding metrics of vehicle control take-over requests in simulated automated vehicles,” International journal of automotive technology, vol. 21, no. 3, pp. 757–770, 2020.
- [26] C. Gold, M. Körber, D. Lechner, and K. Bengler, “Taking Over Control From Highly Automated Vehicles in Complex Traffic Situations,” Human Factors: The Journal of the Human Factors and Ergonomics Society, vol. 58, no. 4, pp. 642–652, 6 2016. [Online]. Available: http://journals.sagepub.com/doi/10.1177/0018720816634226