Nematic fluctuations mediated superconductivity revealed by anisotropic strain in Ba(Fe1-xCox)2As2
Abstract
Anisotropic strain is an external field capable of selectively addressing the role of nematic fluctuations in promoting superconductivity. We demonstrate this using polarization-resolved elasto-Raman scattering by probing the evolution of nematic fluctuations under strain in the normal and superconducting state of the paradigmatic iron-based superconductor Ba(Fe1-xCox)2As2. In the parent compound BaFe2As2 we observe a strain-induced suppression of the nematic susceptibility which follows the expected behavior of an Ising order parameter under a symmetry breaking field. For the superconducting compound, the suppression of the nematic susceptibility correlates with the decrease of the critical temperature , indicating a significant contribution of nematic fluctuations to electron pairing. Our results validates theoretical scenarios of enhanced near a nematic quantum critical point.
In many iron-based superconductors (FeSC), such as Ba(Fe1-xCox)2As2 (denoted thereafter as Co:Ba122), superconductivity (SC) occurs around the end point of stripe-like antiferromagnetic (AF) and nematic phases, suggesting a link between SC and critical fluctuations associated with the proximity of a nematic or magnetic quantum critical point (QCP) Shibauchi et al. 2014; Fernandes et al. 2014; Kuo et al. 2016. Initially SC was believed to result from magnetic fluctuations Kuroki et al. 2008; Mazin et al. 2008; Scalapino 2012, but following the observation of strong nematic fluctuations through various probes Chu et al. 2012; Yoshizawa et al. 2012; Gallais et al. 2013; Gallais and Paul 2016; Böhmer et al. 2014; Böhmer and Meingast 2016; Ikeda et al. 2021 nematic degrees of freedom, which break the lattice rotation symmetry while preserving its translation symmetry, have been envisioned as a possible alternative source for the enhancement of the superconducting critical temperature Yamase and Zeyher 2015; Metlitski et al. 2015; Lederer et al. 2015; Maier and Scalapino 2014; Labat and Paul 2017; Eckberg et al. 2019; Lederer et al. 2020. Unfortunately, magnetic and nematic fluctuations are difficult to disentangle in most FeSC since both phases lie in close proximity. To assess the role of critical nematic fluctuations in enhancing , it is essential to correlate with nematic fluctuations close to the nematic QCP using a stimulus that selectively tune nematic degrees of freedom.
In this context, anisotropic strain provides an appealing tuning parameter to disentangle the role of magnetic and nematic degrees of freedom in promoting SC because it directly couples to the nematic order parameter provided it has the relevant symmetry, the representation in the case of FeSC Dhital et al. 2012; Dhital et al. 2014; Mirri et al. 2016; Tam et al. 2017; Kissikov et al. 2018; Pfau et al. 2021. This was demonstrated in the weak-field limit via elastoresistivity measurements which allowed the extraction of the nematic susceptibility Chu et al. 2012. In the strong field limit, anisotropic strain can also be used as a selective tool to induce or enhance nematic order while leaving the magnetic order comparatively less affected Kissikov et al. 2018; Sanchez et al. 2021; Philippe et al. 2022. This is because an uniform (=0) anisotropic strain couples linearly to , but to the finite wavevector magnetic order parameter only indirectly via higher orders couplings. Recently, Malinowski et al. Malinowski et al. 2020 have revealed in Co:Ba122 a large suppression of under anisotropic strain near the QCP, suggesting an intimate link between SC and nematicity. However, transport measurements cannot probe the nematic fluctuations in the superconducting state, so that the precise link between nematic fluctuations and SC remains to be established in this material.
Here we report an elasto-Raman spectroscopy study on Co:Ba122 establishing a link between nematic fluctuations and under anisotropic strain. In the parent compound Ba122 the effect of strain on nematic fluctuations displays the hallmarks of the susceptibility of an Ising order parameter under a symmetry breaking field. A strong and symmetric reduction of with strain is observed near the structural transition temperature resulting in a significant suppression of its temperature dependence. For the superconducting compound, a similar reduction of is observed under strain in both the superconducting and normal states. We further show that the reduction of scales linearly with , indicating a link between and nematic fluctuations at optimal doping. Our results showcase a dominant role for nematic fluctuations in boosting in Co:Ba122.
Two Co:Ba122 single crystals were investigated. Samples from the same batch were previously studied by transport measurements, from which superconducting , nematic and AF transition temperatures were determined, and by Raman scattering under nominally zero strain Rullier-Albenque et al. 2009; Chauvière et al. 2009; Chauvière et al. 2011; Gallais et al. 2013; Gallais et al. 2016. The first crystal is the parent compound, BaFe2As2 (=0), which displays a simultaneous magnetic (from paramagnetic to AF) and structural (from tetragonal to orthorhombic) transition at K and no superconducting state. The second crystal is close to the optimal doping and to the nematic QCP, with , K as determined by SQUID magnetometry on the same crystal. It presents no magnetic order and remains tetragonal down to low temperatures. We use an uniaxial piezoelectric cell (CS130 from Razorbill Instruments) to apply both compressive and tensile stress upon a sample glued between two mounting plates. The stress is applied along the long dimension being the [110] direction of the usual two Fe unit cell (that is along the Fe-Fe bonds and denoted hereafter), resulting in an anisotropic strain which couples to the nematic order parameter. All the Raman spectra have been corrected for the Bose factor and the instrumental spectral response. They are thus proportional to the imaginary part of the Raman response function . Additional experimental details are given in the Supplemental Material SI and in Ref. Philippe et al. 2022, where elasto-Raman phonon spectra obtained on the sample were already presented.
In the following, we consider an () frame with the axis parallel to the applied stress direction. We define as the nominal applied strain along the direction monitored in situ through the measured displacement of the mounting plates. The strain experienced by the sample along the stress direction differs from because of the imperfect strain transmission through the epoxy glue Philippe et al. 2022. Also due to finite Poisson ratio, the actual strain is triaxial, and can be decomposed under both two isotropic and one anisotropic components Ikeda et al. 2018. Throughout the paper, the data will be shown as a function of , but the effects of strain transmission will be taken into account when comparing the data on different samples.
All Raman spectra reported here were obtained using crossed polarizations along the principal directions of the 2-Fe unit cell ( geometry), and thus probe the representation of the point group (see Fig. 1). In this geometry the measured Raman response, denoted in the following, probes the dynamical nematic fluctuations associated to the order parameter . They can be related to the nematic static susceptibility through Gallais and Paul 2016:
| (1) |
We first present the results concerning the parent compound (Figure 1). Just above at 145 K, the Raman response is strongly reduced below 300 cm-1 both under positive and negative strains. The suppression occurs also at larger temperature (188 K), but is less pronounced. Below at 118 K, changes very little with strain. At lower temperature Raman fingerprints of AF spin-density-wave (SDW) induced gaps indicate a strengthening of the magnetic order under strain (shown in Fig. S6 of the Supplemental Material SI), in agreement with previous Nuclear Magnetic Resonance measurements Chauvière et al. 2011; Kissikov et al. 2018.

.
With Equation (1), the decrease of with strain can be interpreted as a suppression of the nematic fluctuations. Before computing the experimental spectra were extrapolated down to using a Drude lineshape (see Fig. S5 of the Supplemental Material SI). Because the Raman response does not decrease at high energy Gallais et al. 2013 we use an upper cut-off frequency cm-1 in the computation of , chosen as the upper limit above which no strain effect is observed at all temperatures. The impact of strain on for four temperatures around is displayed in Fig. 1-(g): we define as the nematic susceptibility at zero strain, and . Above , at T=145K, we obtain a clear and symmetric in suppression of with strain. The suppression significantly weakens as increases. Below , at 118 K, hardly displays any strain dependence. At 145 K a clear saturation behavior is observed under high tensile and compressive strains. The temperature dependence of under constant applied strain is depicted in Fig. 1-(h). At high strain, the Curie-Weiss-like divergence of at observed at low strain is strongly suppressed, and the maximum of is shifted to a higher temperature.
The behavior of under strain can be rationalized in the simple picture of an Ising nematic order parameter coupled to a symmetry breaking field. Using a Landau expansion of the free energy in a mean-field framework in both the nematic and elastic order parameters and , we obtain the following variation of with strain SI:
| (2) |
with the prefactor of the quartic term in the free energy expression, which we consider strain-independent. Restricting ourselves to the low strain regime and to , to quadratic order in the applied strain we obtain SI:
| (3) |
with the nemato-elastic coupling constant. and are the in-plane isotropic and shear elastic modulus which we define using Voigt notation SI.
Equation (3) qualitatively reproduces two key experimental findings of Figure 1. First, should indeed decrease upon strain, following a symmetric quadratic behavior with at low strain. Second, since increases as approaches Gallais et al. 2013; Kretzschmar et al. 2016, the suppression of with should be larger close to in agreement with our results. As shown in Figure 1(h) this picture also captures the temperature dependence of under strain, and in particular the upward shift of its maximum at strong strain SI. Significant deviations below at low strain are likely due to higher order terms in the free energy and/or the onset of AF order which are not included in the Landau expansion. Overall the behavior of for the parent compound thus fits very well the expectations of an Ising-nematic order parameter under a symmetry breaking field.
We now move to the results on the doped compound () (Fig. 2) whose composition lies slightly beyond the nematic QCP, located at Rullier-Albenque et al. 2009; Gallais and Paul 2016. At 9 K, below , the unstrained Raman response shows a relatively broad superconductivity-induced peak centered around 75 cm-1. This was observed before Muschler et al. 2009; Chauvière et al. 2010, and interpreted as a nematic resonance mode where the usual Raman pair-breaking peak at twice the SC gap energy, , is replaced by a collective mode below because of significant nematic correlations in the SC state Gallais et al. 2016; Thorsmølle et al. 2016; Adachi et al. 2020. Under compressive and tensile strains, the Raman response in the channel is strongly reduced at 9 K and 26 K, indicating a suppression of the nematic fluctuations below and just above . By contrast the spectra in the complementary symmetry channel (displayed in Fig. S4 of the Supplemental Material SI) hardly show any strain dependence. The strain variation of (Fig. 2 - (e)) at different temperatures shows a qualitatively similar behavior as for : a symmetric suppression of with respect to strain, and a weakening of the strain dependence at higher temperature which follows the behavior of under zero applied strain Gallais et al. 2013 as expected from Equation 3.

We stress that the suppression of in the superconducting state cannot be simply explained by a reduction of the SC gap magnitude by strain. Indeed in the absence of any nematic correlations, is just the normal state density of state at the Fermi energy weighted by the Raman vertex. It is therefore independent of the SC gap energy Labat et al. 2020, and the suppression of must be linked to the suppression of nematic fluctuations in the SC state SI. Moreover, the strain-induced suppression of the SC peak intensity further strengthens the nematic resonance hypothesis: the emergence of the SC peak below is closely linked to the presence of significant nematic correlations in the SC state close to the nematic QCP, as evidenced by the approximate scaling between the SC peak weight and under strain (see Fig. S2 of the Supplemental Material SI).

Our results suggest a connection between the suppression of in the superconducting state and the rapid fall of observed in transport measurements on a similarly doped sample Malinowski et al. 2020. In the case where SC pairing is promoted by nematic fluctuations as expected near a nematic QCP Lederer et al. 2015; Labat and Paul 2017, the fall of under strain is rationalized as a consequence of the suppression of these fluctuations.
Within a BCS type of theory Schrieffer 1964, with pairing mediated by the nematic fluctuations, we expect Lederer et al. 2015; Maier and Scalapino 2014; Labat and Paul 2017; Hirschfeld et al. 2011, where is an energy cut off and is the density of states at the Fermi energy. Thus, we expect the scaling (see SI for a discussion about the range of validity of this scaling).
To further evaluate this point, we plot on Fig. 3 as a function of the relative change of under strain, using strain as an implicit parameter. We find that over a significant range of strain: the close correlation between the two quantities clearly supports a nematic fluctuations driven SC scenario for Co:Ba122 close to the QCP. We stress that magnetic fluctuations, if anything, are expected to be enhanced by strain Cano and Paul 2012 as suggested by the enhanced SDW gap observed at (see Fig. S6 of the Supplemental Materials SI) and also by NMR and neutron diffraction measurements Kissikov et al. 2018; Tam et al. 2017. Our elasto-Raman data thus provide a clear distinction between magnetic and nematic fluctuations induced enhancement of in Co:Ba122. We note that in principle the suppression of with strain could result from the competition between the superconducting and strain-induced nematic orders. However, because nematic order does not significantly reconstruct the Fermi surface, competition between nematic and SC orders is likely weak although its strength and even its sign may depend on the details of the electronic structure Moon and Sachdev 2012; Labat et al. 2020; Chen et al. 2020. The weakness of the coupling between both orders is highlighted by the lack of detectable anomaly in the temperature dependence of upon crossing as zero strain (see SI. The competition scenario is further ruled out by the transport measurements Malinowski et al. 2020, which show that the fall of under strain weakens considerably away from the QCP, favoring a fluctuation effect rather than a mere static competition scenario.
Enhancement of close to a nematic QCP is not universally observed in Fe SC. A particular vexing case is FeSe1-xSx where is even suppressed close to the nematic QCP Reiss et al. 2017; Chibani et al. 2021. This was attributed to the coupling to the lattice which cuts off nematic fluctuations, and can significant quench the expected enhancement found in electron-only models Labat and Paul 2017; Chibani et al. 2021; Reiss et al. 2020. The strength of this coupling is embodied in the nemato-elastic coupling constant between the structural orthorhombic distortion to the nematic order parameter . Recently, elastocalorimetric measurements by Ikeda et al. Ikeda et al. 2021 found that strongly decreases upon approaching the nematic QCP in Co:Ba122, potentially explaining the observed nematic fluctuations enhanced SC in this compound. The comparison between the two samples in our study can also address this issue since appears as a prefactor of the relative variation of nematic susceptibility with strain (Eq. 3). However, a quantitative comparison of the two suppressions of with strain does not support a significant dependence of with (see Fig. S8 of the Supplemental Material SI). Given this, the origin of the different behaviors of across the nematic QCP in these two Fe SC materials remains an open question.
In conclusion, our elasto-Raman spectroscopy experiments have revealed a strong correlation between superconducting and nematic fluctuations near the nematic QCP of Co:Ba122. We have shown that combining anisotropic strain with a sensitive probe of the SC state like Raman allows to decouple the different fluctuation channels contributions to SC pairing. We expect that a similar methodology can be employed to reveal nematic fluctuations induced pairing in other materials.
Acknowledgements This work is supported by Agence Nationale de la Recherche (ANR grant NEPTUN and ANR grant IFAS).
References
- Shibauchi et al. (2014) T. Shibauchi, A. Carrington, and Y. Matsuda, Annual Review of Condensed Matter Physics 5, 113 (2014).
- Fernandes et al. (2014) R. M. Fernandes, A. V. Chubukov, and J. Schmalian, Nature Physics 10, 97 (2014).
- Kuo et al. (2016) H.-H. Kuo, J.-H. Chu, J. C. Palmstrom, S. A. Kivelson, and I. R. Fisher, Science 352, 958 (2016).
- Kuroki et al. (2008) K. Kuroki, S. Onari, R. Arita, H. Usui, Y. Tanaka, H. Kontani, and H. Aoki, Physical Review Letters 101, 087004 (2008), publisher: American Physical Society, URL https://link.aps.org/doi/10.1103/PhysRevLett.101.087004.
- Mazin et al. (2008) I. I. Mazin, D. J. Singh, M. D. Johannes, and M. H. Du, Physical Review Letters 101, 057003 (2008), publisher: American Physical Society, URL https://link.aps.org/doi/10.1103/PhysRevLett.101.057003.
- Scalapino (2012) D. J. Scalapino, Reviews of Modern Physics 84, 1383 (2012).
- Chu et al. (2012) J.-H. Chu, H.-H. Kuo, J. G. Analytis, and I. R. Fisher, Science 337, 710 (2012).
- Yoshizawa et al. (2012) M. Yoshizawa, D. Kimura, T. Chiba, A. Ismayil, Y. Nakanishi, K. Kihou, C.-H. Lee, A. Iyo, H. Eisaki, M. Nakajima, et al., Journal of the Physical Society of Japan 81, 024604 (2012).
- Gallais et al. (2013) Y. Gallais, R. M. Fernandes, I. Paul, L. Chauvière, Y.-X. Yang, M.-A. Méasson, M. Cazayous, A. Sacuto, D. Colson, and A. Forget, Physical Review Letters 111, 267001 (2013).
- Gallais and Paul (2016) Y. Gallais and I. Paul, Comptes Rendus Physique 17, 113 (2016).
- Böhmer et al. (2014) A. Böhmer, P. Burger, F. Hardy, T. Wolf, P. Schweiss, R. Fromknecht, M. Reinecker, W. Schranz, and C. Meingast, Physical Review Letters 112, 047001 (2014).
- Böhmer and Meingast (2016) A. E. Böhmer and C. Meingast, Comptes Rendus Physique 17, 90 (2016).
- Ikeda et al. (2021) M. S. Ikeda, T. Worasaran, E. W. Rosenberg, J. C. Palmstrom, S. A. Kivelson, and I. R. Fisher, Proceedings of the National Academy of Sciences 118, e2105911118 (2021).
- Yamase and Zeyher (2015) H. Yamase and R. Zeyher, Physical Review B 88, 180502 (2015).
- Metlitski et al. (2015) M. A. Metlitski, D. F. Mross, S. Sachdev, and T. Senthil, Physical Review B 91 (2015), ISSN 1098-0121, 1550-235X, URL http://link.aps.org/doi/10.1103/PhysRevB.91.115111.
- Lederer et al. (2015) S. Lederer, Y. Schattner, E. Berg, and S. A. Kivelson, Physical Review Letters 114, 097001 (2015).
- Maier and Scalapino (2014) T. A. Maier and D. J. Scalapino, Physical Review B 90 (2014), ISSN 1098-0121, 1550-235X, URL https://link.aps.org/doi/10.1103/PhysRevB.90.174510.
- Labat and Paul (2017) D. Labat and I. Paul, Physical Review B 96, 195146 (2017).
- Eckberg et al. (2019) C. Eckberg, D. J. Campbell, T. Metz, J. Collini, H. Hodovanets, T. Drye, P. Zavalij, M. H. Christensen, R. M. Fernandes, S. Lee, et al., Nature Physics pp. 1–5 (2019), ISSN 1745-2481, URL https://www.nature.com/articles/s41567-019-0736-9.
- Lederer et al. (2020) S. Lederer, E. Berg, and E.-A. Kim, Physical Review Research 2, 023122 (2020).
- Dhital et al. (2012) C. Dhital, Z. Yamani, W. Tian, J. Zeretsky, A. S. Sefat, Z. Wang, R. J. Birgeneau, and S. D. Wilson, Physical Review Letters 108, 087001 (2012).
- Dhital et al. (2014) C. Dhital, T. Hogan, Z. Yamani, R. J. Birgeneau, W. Tian, M. Matsuda, A. S. Sefat, Z. Wang, and S. D. Wilson, Physical Review B 89, 214404 (2014).
- Mirri et al. (2016) C. Mirri, A. Dusza, S. Bastelberger, M. Chinotti, J.-H. Chu, H.-H. Kuo, I. R. Fisher, and L. Degiorgi, Physical Review B 93, 085114 (2016).
- Tam et al. (2017) D. W. Tam, Y. Song, H. Man, S. C. Cheung, Z. Yin, X. Lu, W. Wang, B. A. Frandsen, L. Liu, Z. Gong, et al., Physical Review B 95, 060505 (2017).
- Kissikov et al. (2018) T. Kissikov, R. Sarkar, M. Lawson, B. T. Bush, E. I. Timmons, M. A. Tanatar, R. Prozorov, S. L. Bud’ko, P. C. Canfield, R. M. Fernandes, et al., Nature Communications 9, 1058 (2018).
- Pfau et al. (2021) H. Pfau, S. D. Chen, M. Hashimoto, N. Gauthier, C. R. Rotundu, J. C. Palmstrom, I. R. Fisher, S.-K. Mo, Z.-X. Shen, and D. Lu, Physical Review B 103, 165136 (2021).
- Sanchez et al. (2021) J. J. Sanchez, P. Malinowski, J. Mutch, J. Liu, J.-W. Kim, P. J. Ryan, and J.-H. Chu, Nature Materials 20, 1519 (2021).
- Philippe et al. (2022) J.-C. Philippe, J. Faria, A. Forget, D. Colson, S. Houver, M. Cazayous, A. Sacuto, and Y. Gallais, Physical Review B 105, 024518 (2022).
- Malinowski et al. (2020) P. Malinowski, Q. Jiang, J. J. Sanchez, J. Mutch, Z. Liu, P. Went, J. Liu, P. J. Ryan, J.-W. Kim, and J.-H. Chu, Nature Physics p. 1189 (2020).
- Rullier-Albenque et al. (2009) F. Rullier-Albenque, D. Colson, A. Forget, and H. Alloul, Physical Review Letters 103, 057001 (2009), publisher: American Physical Society, URL https://link.aps.org/doi/10.1103/PhysRevLett.103.057001.
- Chauvière et al. (2009) L. Chauvière, Y. Gallais, M. Cazayous, A. Sacuto, M. A. Méasson, D. Colson, and A. Forget, Physical Review B 80, 094504 (2009).
- Chauvière et al. (2011) L. Chauvière, Y. Gallais, M. Cazayous, M. A. Méasson, A. Sacuto, D. Colson, and A. Forget, Physical Review B 84, 104508 (2011).
- Gallais et al. (2016) Y. Gallais, I. Paul, L. Chauvière, and J. Schmalian, Physical Review Letters 116 (2016).
- (34) See Supplemental Material where Fujii et al. 2018 is cited for: additional experimental details on Raman experiments and single crystals, the computation of the strain dependence of the nematic order paramater and susceptibility, the impact of strain on the nematic resonance mode, the strain effect on the Raman response, additional details on the extrapolation of the spectra, results about the impact of strain on the magnetic order, and the doping dependence of the nemato-elastic coupling.
- Ikeda et al. (2018) M. S. Ikeda, T. Worasaran, J. C. Palmstrom, J. A. W. Straquadine, P. Walmsley, and I. R. Fisher, Physical Review B 98, 245133 (2018).
- Kretzschmar et al. (2016) F. Kretzschmar, T. Böhm, U. Karahasanović, B. Muschler, A. Baum, D. Jost, J. Schmalian, S. Caprara, M. Grilli, C. Di Castro, et al., Nature Physics 12, 560 (2016).
- Muschler et al. (2009) B. Muschler, W. Prestel, R. Hackl, T. P. Devereaux, J. G. Analytis, J.-H. Chu, and I. R. Fisher, Physical Review B 80, 180501(R) (2009).
- Chauvière et al. (2010) L. Chauvière, Y. Gallais, M. Cazayous, M. A. Méasson, A. Sacuto, D. Colson, and A. Forget, Physical Review B 82, 180521 (2010).
- Thorsmølle et al. (2016) V. K. Thorsmølle, M. Khodas, Z. P. Yin, C. Zhang, S. V. Carr, P. Dai, and G. Blumberg, Physical Review B 93, 054515 (2016).
- Adachi et al. (2020) T. Adachi, M. Nakajima, Y. Gallais, S. Miyasaka, and S. Tajima, Physical Review B 101, 085102 (2020), publisher: American Physical Society, URL https://link.aps.org/doi/10.1103/PhysRevB.101.085102.
- Barber (2018) M. E. Barber, Ph.D. thesis, University of St Andrews, United Kingdom (2018).
- Labat et al. (2020) D. Labat, P. Kotetes, B. M. Andersen, and I. Paul, Physical Review B 101, 144502 (2020).
- Schrieffer (1964) J. R. Schrieffer, Theory of Superconductivity, Frontiers in Physics (Addison-Wesley Publishing Company, Inc, 1964).
- Hirschfeld et al. (2011) P. J. Hirschfeld, M. M. Korshunov, and I. I. Mazin, Reports on Progress in Physics 74, 124508 (2011), URL https://doi.org/10.1088/0034-4885/74/12/124508.
- Cano and Paul (2012) A. Cano and I. Paul, Physical Review B 85, 155133 (2012).
- Moon and Sachdev (2012) E.-G. Moon and S. Sachdev, Physical Review B 85 (2012), ISSN 1098-0121, 1550-235X, URL https://link.aps.org/doi/10.1103/PhysRevB.85.184511.
- Chen et al. (2020) X. Chen, S. Maiti, R. M. Fernandes, and P. J. Hirschfeld, Physical Review B 102, 184512 (2020), publisher: American Physical Society, URL https://link.aps.org/doi/10.1103/PhysRevB.102.184512.
- Reiss et al. (2017) P. Reiss, M. D. Watson, T. K. Kim, A. A. Haghighirad, D. N. Woodruff, M. Bruma, S. J. Clarke, and A. I. Coldea, Physical Review B 96 (2017), ISSN 2469-9950, 2469-9969, URL https://link.aps.org/doi/10.1103/PhysRevB.96.121103.
- Chibani et al. (2021) S. Chibani, D. Farina, P. Massat, M. Cazayous, A. Sacuto, T. Urata, Y. Tanabe, K. Tanigaki, A. E. Böhmer, P. C. Canfield, et al., npj Quantum Materials 6, 37 (2021).
- Reiss et al. (2020) P. Reiss, D. Graf, A. A. Haghighirad, W. Knafo, L. Drigo, M. Bristow, A. J. Schofield, and A. I. Coldea, Nature Physics 16, 89 (2020), ISSN 1745-2481, URL https://www.nature.com/articles/s41567-019-0694-2.
- Fujii et al. (2018) C. Fujii, S. Simayi, K. Sakano, C. Sasaki, M. Nakamura, Y. Nakanishi, K. Kihou, M. Nakajima, C.-H. Lee, A. Iyo, et al., Journal of the Physical Society of Japan 87, 074710 (2018).
Supplemental Material
Single crystal characterization and details on Raman experiments
The doping level of the doped compound () was determined by wavelength-dispersive spectroscopy (WDS). It was also confirmed by the comparison of the Raman spectra of this sample (without applied strain) to Raman spectra of other samples with doping levels estimated (by WDS) between 6 and 8 %. The fact that the superconducting peak (centered around 75 cm-1) is slightly less pronounced in our sample than in less-doped samples confirms that this coumpound is slightly overdoped Chauvière et al. 2010.
The samples have dimensions 1.6 mm 700 m 80 m and 1.5 mm 300 m 50 m respectively for and , the stress being applied along the longest dimension. After mounting on the CS130 Razorbill cell, the unstrained suspended length was 1100 and 950 m respectively for and . Both samples were mounted on the cell with a 50 m thickness of epoxy glue at both ends of the sample, both under and above the sample. We used a Loctite Stycast 2850FT epoxy (with catalyst 24LV) cured at 50°C for two hours.
The strain transmission ratio was evaluated in a previous work for the parent compound using finite element simulations Philippe et al. 2022: based on the geometrical parameters and the elastic coefficients values: as the crystal strongly softens close to , this ratio is close to 1. With the same method, we obtain for the compound below 50 K. This transmission ratio was used to compare our results with ref. Malinowski et al. 2020 in Figure 3 of the main text.
The Raman scattering geometry was non-collinear, with the incoming photon wave vector arriving at 45° with respect to the normal of the sample surface plane, and the outgoing photon wave vector lying along the normal. A diode-pumped single longitudinal mode solid-state laser emitting at 532 nm was used for the excitation. The laser spot size is estimated to be less than 50 m, so we expect strain inhomogeneity to have less impact in our Raman measurements than in transport measurements performed in similar cells. The outgoing photons were collected using a X20 long working distance microscope objective (NA=0.28) and analyzed via a triple grating spectrometer equipped with a nitrogen cooled CCD camera. A laser power of 10 mW was used for all spectra for the sample. For the sample, the power was 6 mW for all spectra, except at 7 K at which it was 2 mW. Based on previous Raman measurements on Ba122, the laser heating was estimated to be about 1 K/mW Gallais et al. 2013; Kretzschmar et al. 2016. Comparison of spectra for the sample mounted on the uniaxial strain cell with no strain applied, with spectra for unmounted samples, showed that the cantilever geometry does not significantly affect the heating. The temperatures indicated in the main text and in this supplemental material were all corrected for this heating.
Nematic order parameter under constant uniaxial strain
We start from a Landau-Ginzburg expansion of the free energy in a mean-field framework describing a nemato-structural transition under uniaxial stress. To be consistent with the experimental conditions and the notations in the main text, the and axes are parallel to those of the the 2-Fe unit cell. In this notation the system experiences a stress along the direction, which can be expressed as , where are coordinates rotated with respect to . The stress tensor in the unprimed coordinates is related to that of the primed coordinates by , where
is the rotation matrix and is the angle of rotation. This leads to . Thus, in the coordinate the induced strain has both and contributions, while the nematic order parameter has symmetry. We write the free energy as
| (S4) |
where is the nematic order parameter, and are the longitudinal strains respectively along the and the axes, so that is the strain with the elastic coefficients , and is the shear associated with the elastic constant .
In the mean-field framework, we have , where is a temperature independent parameter and is the bare nematic transition temperature without electron-lattice coupling. Indeed, without applied stress, because of the electron-lattice coupling, the nematic transition is simultaneous to the structural transition at a temperature shifted from to Böhmer and Meingast 2016.
In our elasto-Raman spectroscopy experiments, it is not the stress but, rather, the strain which is a control parameter that is typically held constant while temperature is varied. So if we define , and , then, from the relation we have the constraint
| (S5) |
with a constant. Physically, we are in a regime of constant strain along , which is a combination of and strains in the coordinate, and the stress is a free parameter that can adjust itself depending on the mechanical response of the sample. The values of , and at equilibrium, which we denote (, , ) are the solutions of the following equations
| (S6) |
| (S7) |
| (S8) |
Eliminating using Eqs. (S7), (S8) and the constraint, we obtain
| (S9) |
Next, eliminating using (S6), we get
| (S10) |
Thus, is given by the solution of
| (S11) |
where
| (S12) |
| (S13) |
The solution of S11 has three regimes which are given by the following.
(i) If , then
| (S14) |
(ii) If and , then
| (S15) |
(iii) If and , then
| (S16) |
Note that in regimes (i) and (ii), is odd in , while in regime (iii), and has no particular parity in general.
Thermodynamic nematic susceptibility
We introduce a nematic force which appears in the free energy expression (S4) as an additional term , such that (S6) changes to
| (S17) |
while (S7) and (S8) remain the same. Let the solutions of (S7), (S8) and (S17) be (, , ), with the shifts (, , ) due to the introduction of . Then, to linear order in the shifts, we get
| (S18) |
Since is a constant, from (S9), we get
| (S19) |
which implies
| (S20) |
Thus, the thermodynamic nematic susceptibility under constant strain is given as:
| (S21) |
where is given by the solution of (S11).
Note that, for a spontaneous nemato-structural transition without applied stress the coupling of the electrons with the lattice shifts the bare thermodynamic nematic susceptibility from to . Here, since the experiment is at constant applied , the shift due to the lattice is not but .
Also, we can write , so that
| (S22) |
This implies that . Note that regime (i) defined above corresponds to . In practice, the difference between and can be small, and they remain unresolved in our experiment.
Dynamical nematic susceptibility

The nematic susceptibility measured by the Raman response is different from the thermodynamic one computed previously and given in (S21). To get the Raman nematic susceptibility we need to look at fluctuations at finite (, ), and then take the dynamical limit Gallais and Paul 2016. The nematic susceptibility in the dynamical limit (, with the Fermi velocity) is Gallais and Paul 2016:
| (S23) |
where is the Fermi wave vector, is the electron lifetime from impurity scattering, and the coefficients depend on the details of the band structure. Then, by the Kramers-Kronig relation, the static nematic susceptibility obtained in Raman spectroscopy as the area under the Raman conductivity (Raman response divided by the Raman shift) is
| (S24) |
Thus, the term that enters the thermodynamic nematic susceptibility (S21) is not present in the Raman nematic susceptibility . Note, however, that is given by the solution of (S11) and will follow thermodynamics.
In Fig. S1 we show the theoretical temperature dependence of for two different fixed uniaxial strains. The parameters were chosen to qualitatively fit the experimental data (Fig. 1(h) of the main text). We used: (Å)3, K/(Å)3, 93 GPa, 17 GPa, 30 GPa, 0.135 , 100 K. The elastic coefficients values are experimental ones obtained in Fujii et al. 2018, and is experimentally assessed through Raman spectroscopy in Gallais et al. 2013. Note that to ensure 138 K at zero strain, , and can not be chosen independently. To qualitatively fit the experimental data, we added to a strain and temperature independent constant (taken here as 0.35 a.u.).
At low uniaxial strain there is a well-defined peak in the temperature dependence of , which is due to the presence of nematic fluctuations that would be critical in the absence of uniaxial strain. The role of the uniaxial strain is to reduce the nematic correlation length and, therefore, to broaden the peak, as seen for high values of the strain. In the absence of the peak is expected at , which then gets shifted to higher temperatures as increases. This theoretical behavior captures qualitatively the trend seen in the experiments and reported in Fig. 1(h) of the main text.
We introduce with , and obtain
| (S25) |
It is this quantity which has been plotted in Figs. 1(g), 2(e) and 3 of the main text.
Next, we restrict ourselves to the case (regimes (i) and (ii) for the solution of (S11)), which is valid in particular for . In the low strain regime, where we can neglect the nonlinear term in Eq. (S11), we get
| (S26) |
By symmetry, is an even function of the applied strain . To quadratic order accuracy, we can replace in Eq. (S25) by . This implies
| (S27) |
Using we obtain:
| (S28) |
where is the shear modulus renormalized by nematic flcutuations: In other words in the low strain regime with a slope that strongly grows with the zero-strain nematic susceptibility .
Nematic resonance in the superconducting state under strain
In a fully gapped superconducting state, in the presence of nematic fluctuations, the usual pair breaking peak seen in Raman response at frequency gets transformed into a resonance feature at frequency . Here, we first briefly review the theory of the resonance Gallais et al. 2016, and then we consider the effect of strain.
For a fully gapped superconductor the frequency dependence of the nematic susceptibility is given by Gallais et al. 2016
| (S29) |
where is an interaction parameter that triggers the nematic transition in the appropriate regions of the phase diagram, and whose microscopic origin is not relevant for the current discussion. For systems in the clean limit , where is the impurity scattering induced electron lifetime, the bare nematic polarization is given by Gallais et al. 2016
where , and is the density of states, is the electron dispersion and is a form factor that transforms as .
Note that, since is independent of the superconducting gap , the zero frequency limit of the dynamical susceptibility is also independent of Labat et al. 2020.
The nematic resonance occurs at a frequency where the real part of the denominator in Eq. (S29) vanishes, i.e.:
| (S30) |
where , and . Since we consider the ground state of the system to be non-nematic, we have . On the other hand, the function diverges at . These two limiting behavior guarantees the existence of the resonance at a frequency . In the vicinity of the resonance the dynamical nematic susceptibility is given by , where the weight of the resonance is given by
| (S31) |
where , and . The advantage of working with the spectral weight scaled by the gap value will become evident below.
We consider now the effect of strain. We assume that the interaction is unchanged by strain. Thus, the main effect of strain is on the electronic dispersion and, hence, on . We consider the system is in a phase where in the absence of strain. Then, by making contact with the phenomenological Landau-Ginzburg theory we get that, in the absence of strain
where is the value of the nematic susceptibility without strain, and the Landau-Ginzburg parameter is defined through Eq. (S4). While, in the presence of strain
Comparing the two equations we get
| (S32) |
and
| (S33) |
Our next step is to deduce how the change affects the nematic resonance. For simplicity, in the following we assume that is unchanged by strain. Later we comment on effects of the change in due to the strain. By differentiating (S30), the shift in the resonance frequency can be expressed as
| (S34) |

This function diverges at , decreases to 0 at , and stays positive between 0 and 1. Since , we conclude that, with strain the resonance mode moves towards higher energy approaching . Furthermore, the strain induced change in the weight of the resonance can be obtained by differentiating (S31). We obtain
| (S35) |
is negative in the range , which implies . The weight (so the height and width) of the resonance mode decreases upon strain, which is consistent with our experimental observation. Finally, comparing the above equations we get the scaling relation
| (S36) |
where is a constant independent of strain.
Note, in the preceding lines we assumed that is constant with strain. In reality, around the nematic quantum critical point decreases strongly with strain, indicating that decreases also with strain. However, since Eqs. (S30) and (S31) involve scaling functions of , the effect of the change in is already included in these equations. In practice, we do not have access to the gap value , and so we scale by to get , which assumes that . Note also, that Eqs. S34 and S35 implicitly assume that, with application of strain, the variations are linearly related. Thus, the above scaling relation is valid only in the low strain regime where nonlinear effects can be neglected. In figure S2 we show that the above scaling relation between and is satisfied at low strain in the =0.07 crystal.
Nematic fluctuation mediated superconductivity
From a theory point of view, this topic has been discussed in the recent literature, see, e.g. Refs. Lederer et al. 2015; Labat and Paul 2017. In these scenarii the SC pairing of Fe SC is mediated via two channels: the first one is non-critical and might be of magnetic origin, while the second one is nematic. The latter is relevant only close to the QCP where the nematic fluctuations are expected to contribute to a significant fraction of the pairing strength. Within a Bardeen-Cooper-Schrieffer theory, the superconducting transition temperature is given by , where is the density of states at the Fermi level, a cut-off energy scale, and is the pairing interaction.
In general will have contributions coming from critical nematic fluctuations and non-critical (likely magnetic) fluctuations. = where are electronic susceptibilities in the corresponding channel in units of energy. Assuming anisotropic strain only influence we can write where is the nematic susceptibility at zero strain. Close to the QCP the SC pairing is dominated by the nematic fluctuations mediated pairing channel, and can be replaced by the nematic susceptibility Lederer et al. 2015. Neglecting non-critical fluctuations and assuming is small we can linearize:
| (S37) |
This is the scaling found in fig. 3 of the manuscript. We note that since reaches up to 0.2 in the experiment one can question the validity of the above linearization for such large . However, note that experimentally we use a finite high energy cut-off to extract . Therefore the absolute value of is underestimated, i.e. . Contrary to the ratio is thus only known up to a multiplication factor which is less than 1 since the energy range where changes is below the cut-off energy. Given the flat Raman continuum extending up to at least 1000 cm-1 (as observed for BaFe2As2) we can estimate to be at least 50% higher than . In addition non-critical fluctuations which contribute to will further affect the above approximation. To further evaluate the validity of the linearization in the more general case, we compare below the data with the theoretical expectation without relying on linearization. In the more general case we have:
| (S38) |
| (S39) |
We set , keep free and compare the equation above with our data in 4 scenarii. (1) and , (2) and , (3) and . (4) and . We note =0.3 is likely a lower bound for non-critical fluctuations given the sizable observed in Co-Ba122 even far away from the QCP. Larger values for will further extend the approximate linear regime. While a clear deviation for the last data point is observed for (1), adding non-critical fluctuation and/or taking into account the underestimation of both give good agreement with the data using .

Nematic susceptibility across at zero strain
In figure S4 we show the Raman response and calculated nematic susceptibility as a function of temperature for the crystal. Within our accuracy there is no detectable change in accross indicating weak competition between superconductivity and nematic order.

Strain effect on the Raman response in the channel
As Raman spectroscopy is a symmetry-resolved probe, the nematic susceptibility is measured only through spectra probing the nematic symmetry, that is for Co:Ba122 the symmetry. We probe this nematic channel by choosing the polarizations of the incident and scattered lights respectively along the [100] and [010] directions of the 2-Fe unit cell, and the resulting spectra and analysis are presented in the main text. In this section, we present the effect of strain on the Raman response in the symmetry, when the polarizations of the incident and scattered lights are respectively along the [110] and [10] directions of the 2-Fe unit cell (so along the and axes of the rotated frame we use to describe our experiments). From previous experiments Gallais et al. 2013, it is known that, in the parent compound and in this symmetry, the Raman spectra and so the dynamical Raman susceptibility change hardly across , showing that the susceptibility is featurless in this transverse symmetry.
On Figure S5, we compare the effect of strain on the compound at low temperature between the and the Raman responses. Across a wide range of mostly compressive strain, we observe no clear variation of the Raman spectra comparable to the one occurring on the same sample in the channel. This observation confirms our interpretation of the effect of strain in the nematic channel in terms of a decrease of the nematic fluctuations upon strain.

Low energy extrapolation and strain-induced deviation from the Drude lineshape
To compute the nematic susceptibility (Eq. (1) of the main text), we need to extrapolate the experimental spectra from the low frequency cut-off (around 15-20 cm-1 depending on the spectra) down to zero energy.
In the superconducting state, the shape of the Raman response depends strongly on the anisotropy of the superconducting gap. We extrapolated the spectra using a simple linear form, which seems appropriate for Co:Ba122, in which the gap is believed to display an anisotropic -type shape Chauvière et al. 2010.
In the metallic state, the standard Raman response follows a Drude-like expression at low energy, given by:
| (S40) |
with the relaxation rate of the charge carriers, and the static Raman response. In the presence of a nematic instability, this Drude form displays a strong temperature dependence close to , through both and Gallais and Paul 2016. From previous works, the zero strain Raman response is well fitted with such expression, at least at low energy below 150-200 cm-1 Gallais et al. 2013.
However, for the sample, we observed a strain-induced deviation from the Drude lineshape for our spectra close to , at 145 K. This phenomenon is depicted in Fig S6, with a tentative quantitative assessment. The deviation is not observed at higher temperature (188 K), but below at 118 K, we observe a significant deviation at all strains. For the compound in the metallic state, we do not observe any clear deviation from the Drude shape even under strain. The fact that this deviation from the Drude shape is seen below and above and close to under strain, and not in the compound, indicates an intrinsic origin, likely related to a strong static nematic order, but we lack theoretical insight to conclude more deeply about this phenomenon.

Strain effect on the SDW gap
In this section we present the effect of anisotropic strain on the SDW gap in BaFe2As2. The results are presented on Figure S7.

The magnetic order is an antiferromagnetic spin-density wave (SDW) order setting up in BaFe2As2 below K. The opening of the SDW gap produces characteristic features on the zero strain Raman spectra Chauvière et al. 2011, which we see on our low strain spectra (Fig. S7 - (a)). The loss of spectral weight below 700 cm-1 is a combination of both nematic and magnetic order effects. The specific traits of the opening of the SDW gap are the step-like feature around 350–450 cm-1 and the broad peak developping around 700–1000 cm-1.
Fig. S7 - (b) and (c) report the effect of anisotropic strain (the same as in the main text) at 17 K. We observe a frequency shift of both the step and the peak, both hardening when strain increases. Note that at this low temperature, the quasi-elastic peak from the nematic fluctuations is hardly observed and the nematic susceptibility is significantly reduced, which explains why, as at 118 K, we observe no modification of the low energy response with strain other than that of the SDW feature.
To try and quantify this effect, we define as the step energy, that we pinpoint at the slope discontinuity marking the signal loss at the step. At low strain, this discontinuity is located at around 380 cm-1, whereas at maximal compression we locate it at around 450 cm-1, which corresponds to a 20 % hardening at . The dependence of (renormalized to its zero-strain value) with strain is depicted in Fig. S7 - (d). The 10 % change of when is set to is consistent with the change in measured through nuclear magnetic resonance studies Kissikov et al. 2018.
This strain effect on the SDW gap shows that anisotropic strain tends to strengthen the magnetic order, consistently with previous nuclear magnetic resonance results Kissikov et al. 2018. We highlight however that the strains depicted on Fig. S7 correspond to rather high negative strains, up to (in absolute value). In particular, there is no visible effect for strains lower (in absolute value) than , whereas the effect on the nematic fluctuations in this low strain regime is strong. This further confirms that strain only acts indirectly on magnetic order.
Effect of an offset on the symmetrical behavior of the nematic scaling
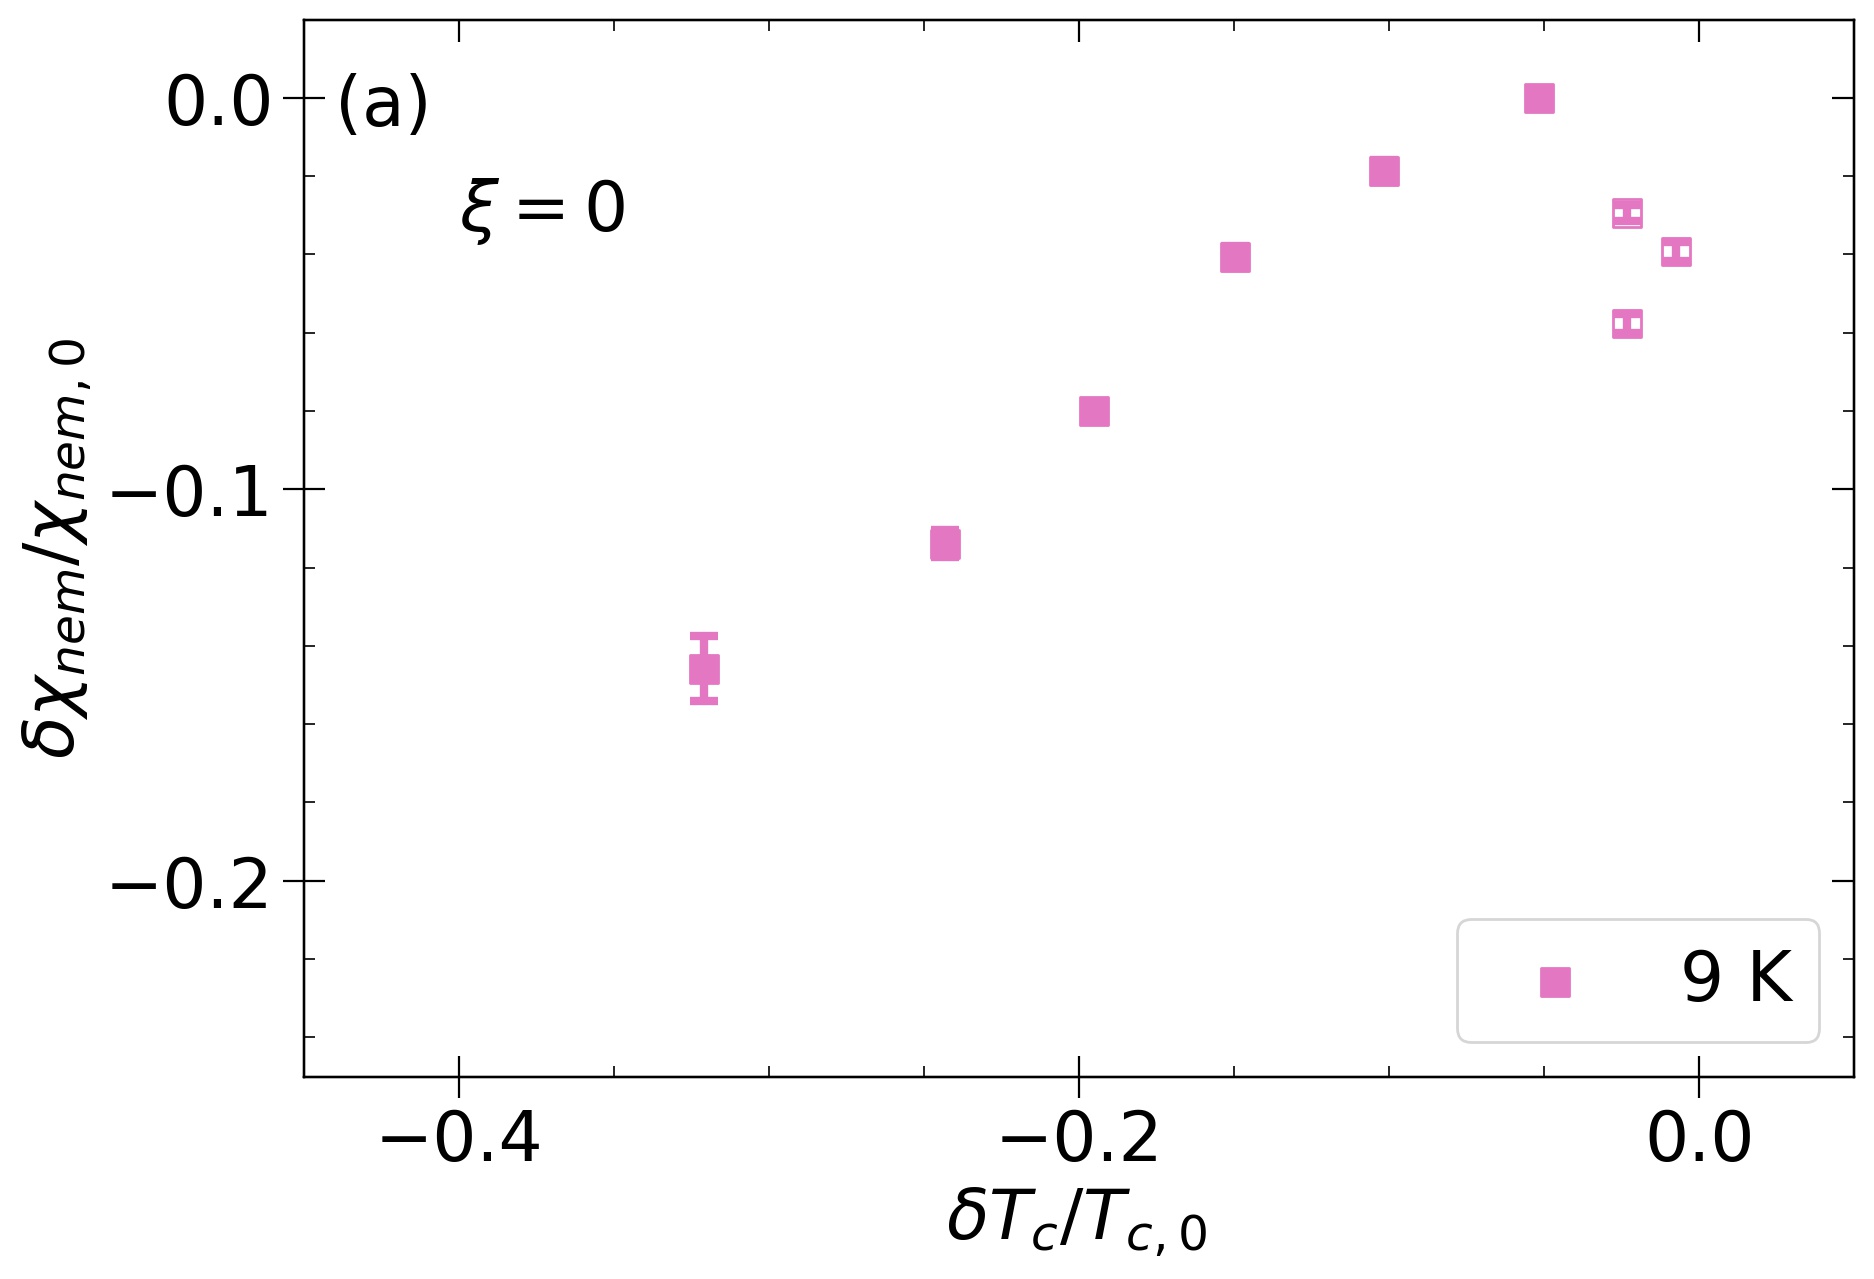
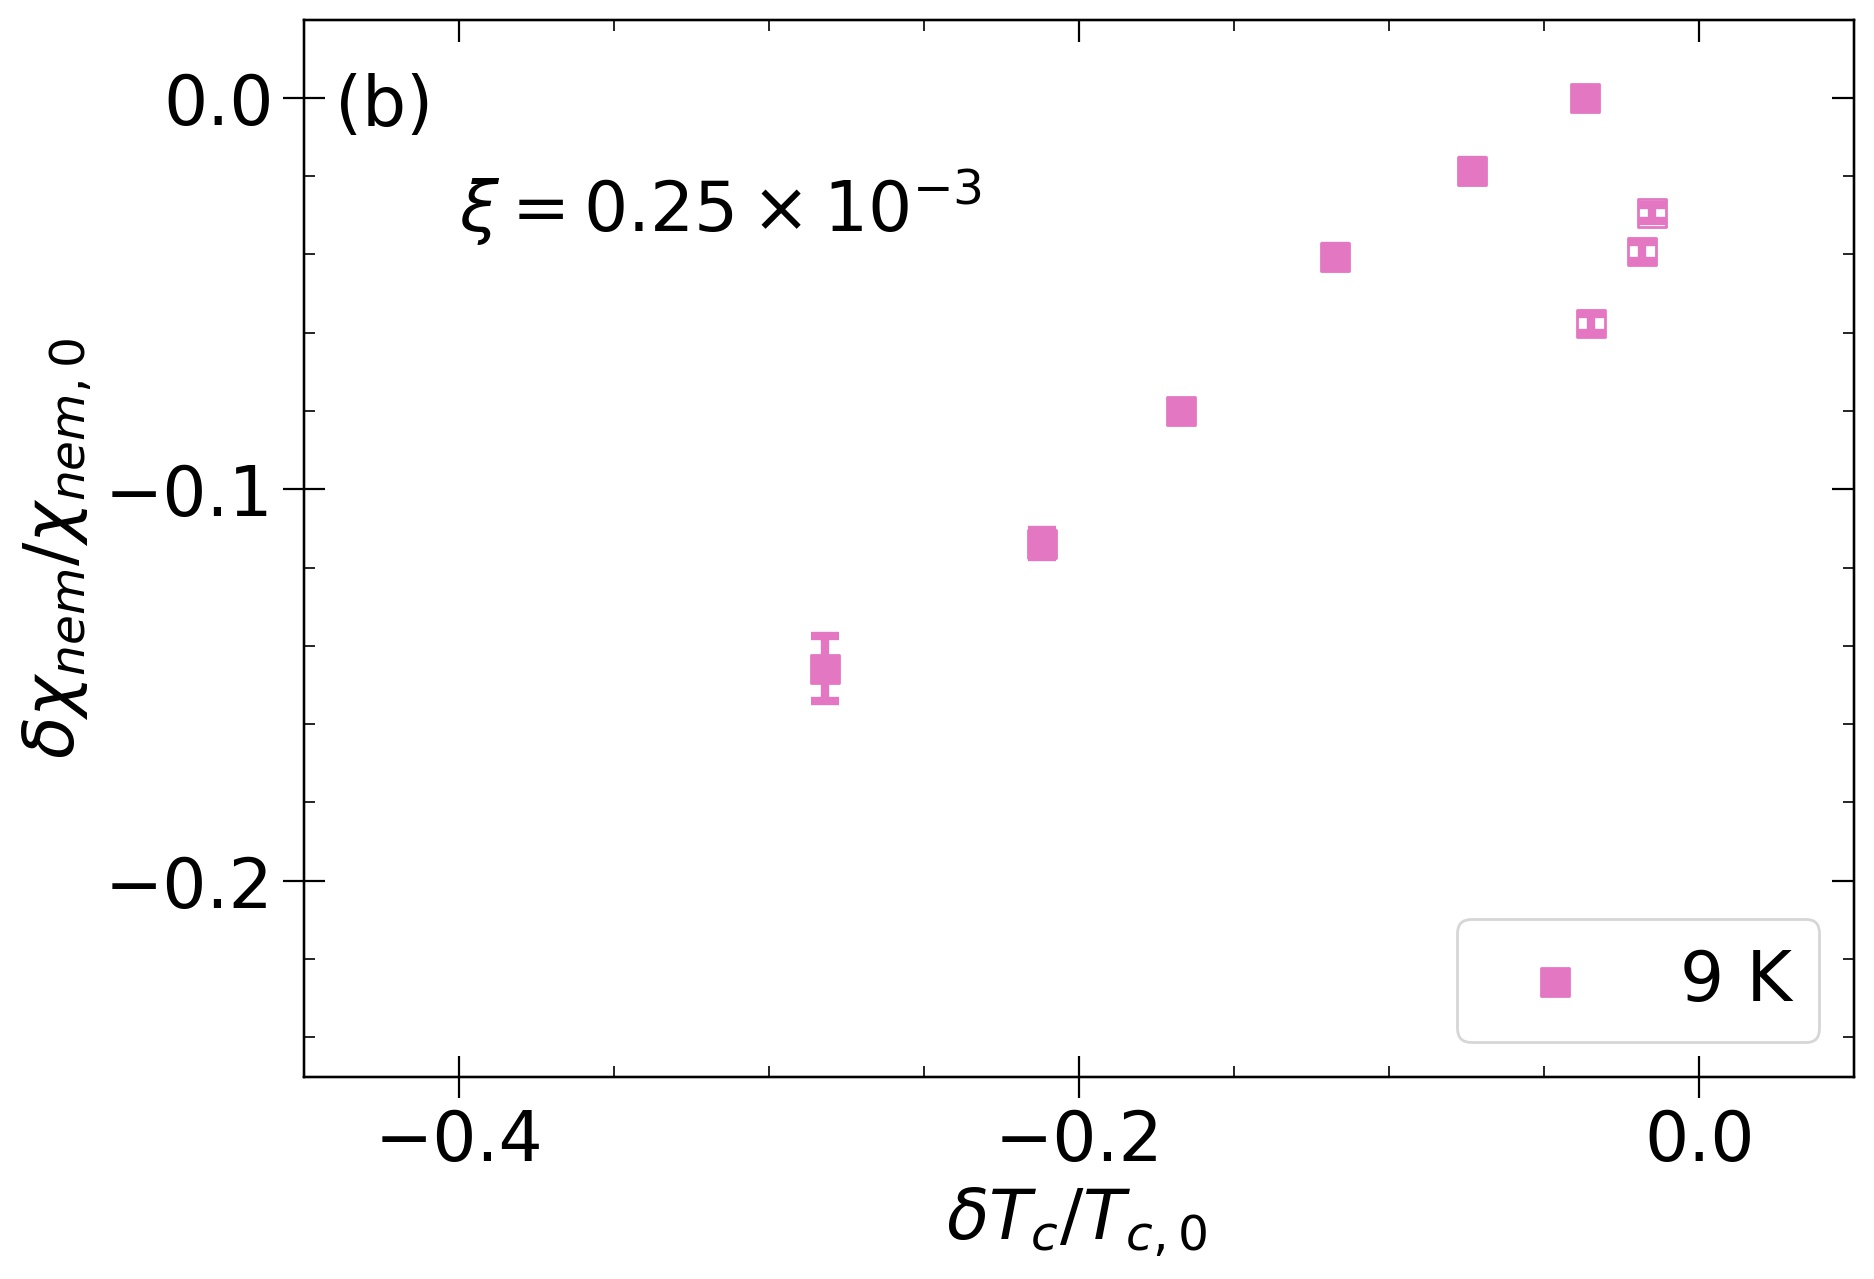
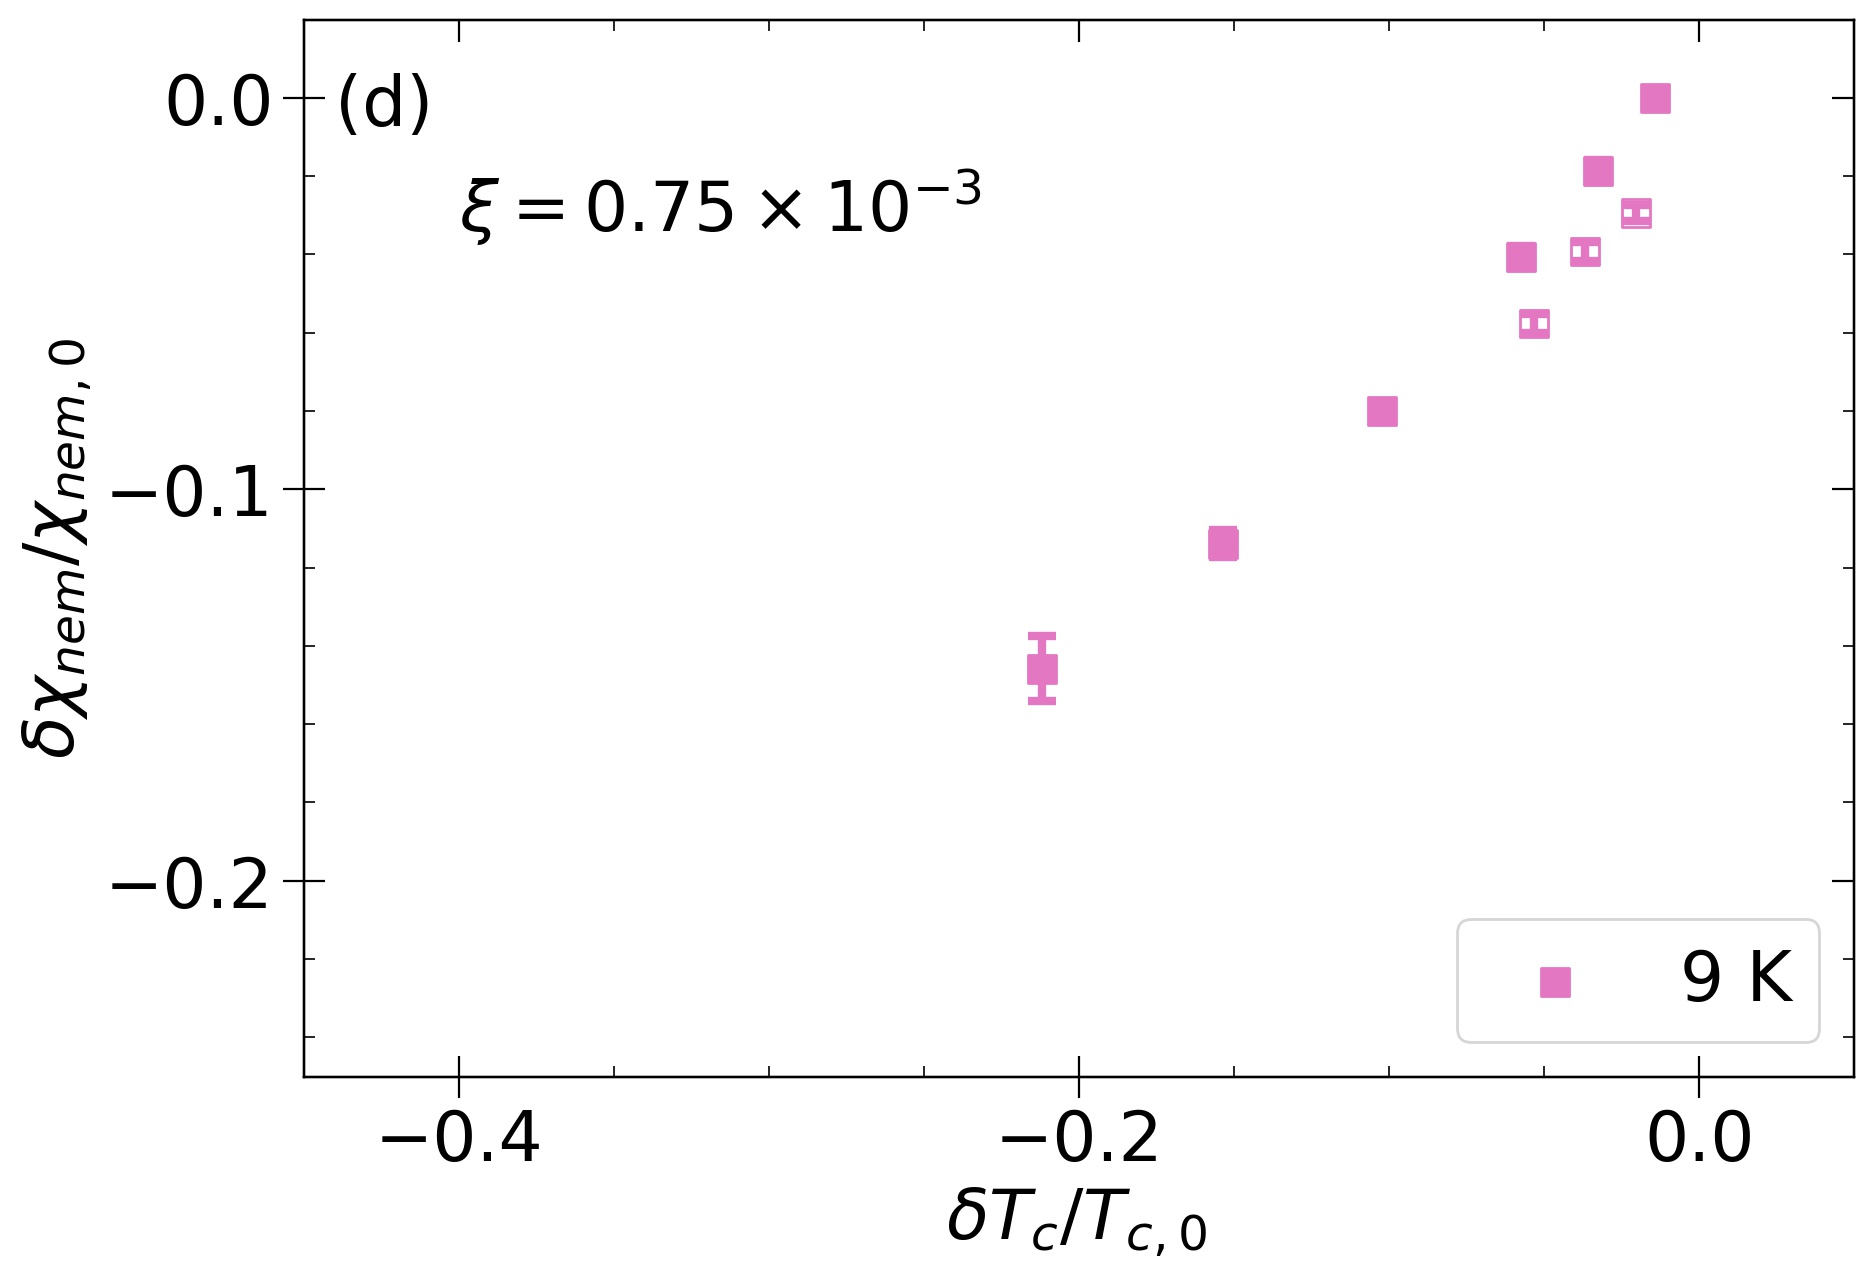
In Figure 3 of the main text, we show the scaling between the suppression of the nematic susceptibility and the decrease of under anisotropic strain. This scaling displays an asymmetry, with a clear offset between the negative strain data points and the fewer positive strain data points, both at 9 and 26 K. Even though an asymmetry could be expected through various effects (e.g. the effect of the strain component), we think that the observed asymmetry is mainly due to the experimental uncertainty in the zero strain position. Indeed, it can slightly differ from the nominal zero strain position of the strain cell because of plastic deformation of the glue and thermal cycling. Considering the maximum of as a good property of the zero strain point, we had to add an offset on the strain of + 0.5 10-3 in our analysis displayed in Figures 2 and 3 of the main text. In this section, we show that the offset observed in Figure 3 between positive and negative strain depends greatly on the choice of the offset. To illustrate this point, in Fig. S8, we plot the same quantities as in Figure 3 of the main text for the 9 K data, but we change the offset from 0 to + 0.75 10-3 from panel (a) to panel (d): within this range of offset, the maximum of stays very close to nominal zero strain point. So we conclude that in our data, the strong asymmetry between positive and negative strain in the scaling between the suppression of and the decrease of is likely due to the uncertainty in locating the zero-strain state.

Doping dependence of the nemato-elastic coupling
In nematic materials displaying superconductivity like Co:Ba122, nematic fluctuations are a possible origin for the enhancement of superconducting critical temperature near the nematic QCP Lederer et al. 2015. However, the coupling between the nematic and the lattice degrees of freedom can quench critical nematic fluctuations near the nematic QCP, thus limiting its impact on the increase of Labat and Paul 2017. The nemato-elastic coupling is measured through the coupling constant , which appears in the Landau-Ginzburg expansion of Eq. (S4).
has been experimentally assessed through several techniques. However, it is difficult to extract quantitative absolute values of , and moreover, theoretical works do not give precise values of beyond which nematic fluctuations can be quenched. In other words, the quantitative link between and is currently not theoretically established. A way to nevertheless address the issue of the quenching of the nematic fluctuations through the nemato-elastic coupling is to evaluate the doping dependence of : a strong dependence approaching the QCP is a hint of its role on the critical nematic fluctuations. Through the relation of to the structural transition temperature and the bare nematic transition temperature measured through the elastic coefficients Böhmer et al. 2014 or Raman spectroscopy Gallais et al. 2013; Gallais and Paul 2016, it was obtained that in Co:Ba122 hardly changes between and the QCP doping. However recently through elastocaloric measurements, Ikeda et al. Ikeda et al. 2021 obtained a drastic suppression of as doping increases, with a decrease by a factor of about 5. Thus no clear conclusion can be drawn from previous experimental results.
Through our elasto-Raman scattering measurements, we can also address this issue by comparing the suppression of the nematic fluctuations at the two probed doping levels. Indeed, as it appears in Eq. (3) of the main text, the relative variation of nematic susceptibility with strain goes as , with appearing in the prefactor.
In Figure S9, we compare the suppression of nematic fluctuations under strain in the two samples. To carefully compare the two samples, we renormalize the relative variation of susceptibility by the elastic coefficients factor (note that is the experimentally measured shear modulus, which is renormalized with respect to the bare shear modulus through the nemato-elastic coupling). For at 145 K and at both 9 K and 26 K, we took respectively equal to 55.5 and 70 GPa, and respectively equal to 5 and 20 GPa, from data by Fujii et al. Fujii et al. 2018. Also, for the abscissa axis we consider and not using the transmission ratio for the at 9K and 26K, and for =0 at 145 K (near ). By adopting a quadratic scale for the abscissa axis, the theoretical slope is equal to .

Despite a relative scatter in the data points, it is clear that the slopes do not appear to vary significantly with . We note that varies little between and with at most a 1.5 factor decrease, but as it appears to the power 3, even small changes can quantitatively impact the slope. Considering the extreme cases of no doping dependence for or a 1.5 factor decrease, we obtain for a maximum of 2.
Thus, unless the quartic coefficient increases significantly with doping which we believe is unlikely, our results tend to show that is not strongly suppressed towards the nematic QCP in Co:Ba122.