Towards Involving End-users in Interactive Human-in-the-loop AI FairnessDOI: 10.1145/1122445.1122456Journal: TiiSCCS: Human-centered computing Empirical studies in HCICCS: Computing methodologies Artificial intelligence
Abstract.
Ensuring fairness in artificial intelligence (AI) is important to counteract bias and discrimination in far-reaching applications. Recent work has started to investigate how humans judge fairness and how to support machine learning (ML) experts in making their AI models fairer. Drawing inspiration from an Explainable AI (XAI) approach called explanatory debugging used in interactive machine learning, our work explores designing interpretable and interactive human-in-the-loop interfaces that allow ordinary end-users without any technical or domain background to identify potential fairness issues and possibly fix them in the context of loan decisions. Through workshops with end-users, we co-designed and implemented a prototype system that allowed end-users to see why predictions were made, and then to change weights on features to "debug" fairness issues. We evaluated the use of this prototype system through an online study. To investigate the implications of diverse human values about fairness around the globe, we also explored how cultural dimensions might play a role in using this prototype. Our results contribute to the design of interfaces to allow end-users to be involved in judging and addressing AI fairness through a human-in-the-loop approach.
Keywords:
AI fairness, loan application decisions, end-users, human-in-the-loop, explanatory debugging, cultural dimensions1. Introduction
Many organizations are now using artificial intelligence (AI) systems to support their decision making, for example, in clinical decision support systems (Cai et al. 2019) and in bail decisions (Mallari et al. 2020). However, these AI systems might be biased and therefore decisions might be unfair, or even discriminatory (Kirkpatrick 2016). A common focus has been to make AI decisions fairer by relying on machine learning (ML) experts. Many toolkits and systems have been developed to help ML experts to investigate fairness (Adebayo 2016; Bellamy et al. 2019; Friedler et al. 2019; Wexler et al. 2020; Cabrera et al. 2019; Ahn and Lin 2019; Yan et al. 2020a; Galhotra et al. 2017; Holstein et al. 2019; Aggarwal et al. 2019), often through quantitative fairness measures, and then removing fairness issues through algorithmic means, for example, by re-balancing the training data set or changing weights on attributes (Friedler et al. 2019; Aggarwal et al. 2019; Galhotra et al. 2017; Barocas and Selbst 2016). However, approaching fairness only through quantitative means is challenging as it is difficult to choose the appropriate metric to use for a specific context, and the qualitative and value-driven aspects of human fairness perceptions.
Relying only on ML experts ignores the perspectives that end-users can bring to AI fairness. Recent work has explored what end-users consider fair and how this could be expressed in fairness metrics (Srivastava et al. 2019). Alongside this strand of research exploring human perceptions of fairness in decision-making, the need to directly involve end-users in assessing the fairness of AI systems and making ML models fairer has recently been emphasized (Binns et al. 2018; Dodge et al. 2019; Holstein et al. 2019; Veale et al. 2018; Yan et al. 2020a; Yu et al. 2020). There is already some work that aims to include end-users in the AI development process through value sensitive design practices (Kirkham 2020a; Ballard et al. 2019), technology demonstrators (Wouters et al. 2019), or through participatory design practices (Lee et al. 2019b). However, our work aims to build interpretable and interactive human-in-the-loop tools that allow end-users without any technical or domain background to assess the fairness of an AI system, and to find and fix issues if necessary.
Our research draws inspiration from Explainable AI (XAI) research to make AI models interpretable (Doshi-Velez and Kim 2017). We are particularly focused on making these systems work for end-users without a background in fairness, AI or domain knowledge. Our work specifically uses explanatory debugging for interactive machine learning (Kulesza et al. 2015) as a lens through which to approach human-in-the-loop fairness tools. Explanatory debugging aims to help end-users to identify and correct "bugs" (i.e. mispredictions that fail to meet the user’s expectations) in an AI model. The approach includes a tightly coupled cycle of interactions with a user interface (UI) to explain to the end-user how the ML model makes its decisions and then provide an opportunity for the user to make necessary corrections. This framework also proposes eight principles for designing UIs. We leverage this existing framework for AI fairness; we provide explanations of how the ML model made its decisions so that end-users can identify and correct fairness issues that do not meet their expectations. We believe that this can provide a fresh viewpoint for the design of interpretable and interactive human-in-the-loop AI fairness tools.
In this paper we focus on the design a human-the-loop AI system for loan decisions and we investigate how end-users, i.e. people without any special technical or domain knowledge who are the receiving end of loan decisions, use this system to identify potential fairness issues and improve fairness. Because of recent work that has demonstrated the importance of cultural dimensions on human fairness perceptions (Silvernail 2016; Blake et al. 2015; Bolton et al. 2010; Mattila and Choi 2006; Kim and Leung 2007; Geiger and Meek 2005; Leung 2008), we also investigated potential cultural dimensions in the way that end-users assess fairness and try to fix perceived fairness issues using this human-in-the-loop system, by drawing on Hofstede’s Cultural Dimensions (CDs) framework (Hofstede 2011). This framework argues that human behavior is shaped by six dimensions that vary across cultures: Power Distance, Individualism, Masculinity, Uncertainty Avoidance, Long Term Orientation, and Indulgence. Our research questions were:
- (1)
How can we design interactive human-in-the-loop interfaces for end-users to help them identify and fix fairness issues?
- (2)
How do end-users assess whether an AI system is fair or unfair, using a human-in-the-loop interface?
- (3)
Can these end-users fix fairness issues through their feedback?
- (4)
Are there any cultural dimensions to fairness assessments and use of the prototype?
To answer these research questions, we designed a prototype human-in-the-loop system, inspired by principles of explanatory debugging (Kulesza et al. 2015) and drawing on requirements from end-users who took part in a series of workshops in the United States of America (USA), the United Kingdom (UK), and Japan with 12 participants. This was then followed by an online empirical study of 388 participants using the prototype.
Through our work, we advance the continuing conversation around building tools to investigate fairness and including end-users in the AI development process. In particular, we contribute to:
- (1)
a better understanding of how end-users assess fairness, and their requirements for tools that support them,
- (2)
extending our knowledge of how cultural dimensions influence how end-users make fairness assessments and use these tools in making these assessments,
- (3)
designing new interactive human-in-the-loop interfaces to support end-users in making AI fairness assessments,
- (4)
increasing end-users ability to be directly involved in shaping AI systems and potentially making them fairer.
The structure of this work is as follows. We first provide an overview of related work in AI fairness, explainable AI (XAI) and explanatory debugging, and cultural dimensions. We then present a prototype that was designed based on co-design workshop findings. Next, we present an empirical online study of the prototype system. We finish the paper with a discussion of the wider implications of our work.
2. Related Work
We provide an overview of previous work which has started to investigate what fairness is, how it can be measured objectively, and how humans perceive AI fairness. We describe existing tools which aim to help ML experts to produce fair AI systems, and review work that has started to involve end-users in building fair AI systems. We then outline the explanatory debugging approach, and its relevance to AI fairness. We conclude with details of the cultural dimensions framework, which underlies our research into cultural aspects of AI fairness.
2.1. Fairness in Human Decision-making and AI
Fairness is often associated with group fairness and individual fairness (Binns 2020). Group fairness (Verma and Rubin 2018) means that the same treatment is provided to people belonging to protected groups, defined by sensitive attributes such as race or gender, as to other groups. Individual fairness (Bellamy et al. 2019) focuses on providing the same treatment for individuals having similar or same characteristics or sensitive attributes.
To determine if something is fair, many quantitative fairness metrics have been proposed (Verma and Rubin 2018); for example, independence (e.g. demographic parity or statistical parity); separation (e.g. equality of opportunity, equality of odds, other variations); and sufficiency (e.g. predictive parity, predictive quality). Demographic parity is sometimes termed disparate impact in legal contexts, which is the demographic parity of the protected group divided by that of the privileged group. According to US law, if disparate impact is less than 0.8, there is discrimination on a protected attribute (Feldman et al. 2015). Currently, demographic parity is considered as a ‘gold’ standard baseline statistical measurement (Wachter et al. 2020), however which particular fairness metric to use depends on the use case or the business problem at hand; in short, the metrics need to be applied in context.
Hence, recent work relevant to intelligent user interfaces has studied fairness from the perspective of human judgement, and the values and criteria that are applied by humans in judging fairness. Many of these research efforts have been directed at understanding what humans consider fair, and how individuals’ demographics impact fairness assessments or cause biases. Recent work found that non-experts’ ideas of fairness in the context of criminal risk and skin cancer risk prediction most closely matches demographic parity (Srivastava et al. 2019). In another study (Woodruff et al. 2018), end-users rejected the use of sensitive attributes and the ’stereotyping’ of groups of individuals. In the context of financial decisions, there has been some work to involve users in assessing the credit risk, for example, to investigate decision-making (Green and Chen 2019), or to examine people’s fairness perceptions and definitions (Saxena et al. 2019). One such study found that people tended to give preferential treatment to the people belonging to a protected group (Saxena et al. 2019). This echoes findings from experiments conducted to better understand fairness perceptions (Wang et al. 2020a) which showed that algorithms that predict in people’s favour are likely to be rated as fairer despite having bias against particular demographic groups. Lee (Lee 2018) measured perceived fairness from people’s perceptions of algorithms in decision making for different tasks (i.e., ones that require mechanical skills and human skills) and revealed that with tasks requiring human skills, algorithmic decisions were perceived as less fair. Mallari et al. (Mallari et al. 2020) examined the impact of racial information on human decision making with respect to users’ judgements of recidivism and found that race of the defendants (black defendant vs. white defendants) had significant impact on the user’s decision about the defendants. Overall perception of AI fairness has been found to be related to individuals’ computer-based knowledge and privacy concerns (Araujo et al. 2020).
All of above studies highlight the importance of exploring perceived fairness and fairness criteria in decision-making processes. In section 3.2, we describe the results of conducting workshops with end-users to explore their criteria and process when assessing fairness, and how we instantiated this in a prototype. Further, in section 4.5, we explore how people consider fairness in the context of loan decisions using this prototype through a online user study. Thus, we aim to extend the discussion of fairness criteria and clarify how the criteria vary depending on cultures, which underpins research in human-in-the-loop fairness.
2.2. Algorithms and Interfaces to Support Fairness
With the proliferation of algorithmic decision-making systems in public and private sectors, it becomes crucial to evaluate and address their social impact, such as bias or discrimination. Thus, a lot of research has been conducted into developing fair decision-making algorithms (Chouldechova and Roth 2020; Friedler et al. 2019; Aggarwal et al. 2019; Galhotra et al. 2017; Barocas and Selbst 2016). These approaches often apply quantitative fairness metrics (see section 2.1) that test for and then remove fairness issues, for example, by re-balancing the training data set (Friedler et al. 2019) or setting weights on attributes (Aggarwal et al. 2019; Galhotra et al. 2017) or even masking bias (Barocas and Selbst 2016).
Several bias mitigation tools including open source libraries have been developed to help ML experts with developing fair AI models, for example, FairML (Adebayo 2016), AI Fairness 360 (Bellamy et al. 2019), Fairness comparison (Friedler et al. 2019), and Google’s What-if tool (Wexler et al. 2020). In addition to these industrial tools, there are some tools developed in a research context. For example, a visual analytics system, FairSight (Ahn and Lin 2019), has been designed to evaluate fairness through understanding, measuring, diagnosing and mitigating biases. Silva (Yan et al. 2020a) is a fairness optimisation tool for exploring potential sources of unfairness in datasets or machine learning models using causality or causal graphs. Additionally, Cabrera et al. (Cabrera et al. 2019) developed a visual analytics system called FairVis for discovering intersectional bias. These tools support ML experts (or users familiar with AI) with an organizational stake in fairness to investigate performance, biases, and typically use standard fairness metrics.
However, these systems are not targeted at end-users who are the receiving end of the decisions being made. The need to design and develop systems and interfaces to help end-users identify AI biases has been well-recognised (Jr. et al. 2020; Holstein et al. 2019; Veale et al. 2018). Studies have explored the needs from practitioners in industry (Holstein et al. 2019) or public sector (Veale et al. 2018). To involve end-users in AI development processes, Lee et al. (Lee et al. 2019a; Lee et al. 2019b) attempted to enable people to build algorithmic policy for on-demand food donations (Lee et al. 2019b), and also gave end-users the opportunity to improve algorithmic fairness through AI interfaces guaranteeing procedural justice (Lee et al. 2019a). Work has also been conducted to elicit the fairness preferences of stakeholders and then build them into an optimisation algorithm (Zhang et al. 2020).
Consequently, designing and building interactive human-in-the-loop AI fairness tools for end-users is thus far underexplored. To our knowledge, only Silva (Yan et al. 2020a) has been evaluated with non-ML experts, and it does not allow fixing of fairness issues. The prototype we present in section 3.2 shows how an interface can be designed targeted at end-users so that they can investigate potential fairness issues, based on requirements gathered during co-design. Moreover, our prototype allows end-users to feed back to the AI model, in order to fix potential fairness issues. We show the feasibility of this approach in section 4.5.2.
2.3. Explainable AI (XAI) and Explanatory Debugging
Our work is aligned with some of the concerns of Explainable AI (XAI) to make AI systems interpretable (Doshi-Velez and Kim 2017). Providing explanations of ML systems is important for end-users so that they can understand why decisions were made, improve their mental models (Kulesza et al. 2012) and to calibrate their trust in the system (Gunning et al. 2019). Much work has been focused on how to make the AI model more transparent, for example, by showing important features of individual decisions of the AI model (Ribeiro et al. 2016). It has been argued that explanations should be provided to answer users’ questions around What, Why, Why Not, How, What-if (Lim et al. 2009; Bellotti and Edwards 2001) by following a transparency design process (Eiband et al. 2018). There have also been increasing efforts to design explanations through a user-centered Human-Computer Interaction (HCI) perspective. It has been argued that explanations can be presented in various ways (Wang et al. 2019), such as textual, graphical or hybrid explanations, depending on user expertise (Szymanski et al. 2021). Some work has warned that explanations can be misleading and can influence users to over-rely on AI decisions (Bussone et al. 2015; Chromik et al. 2021). There has been lots of work on how to evaluate explanations with users, for example in terms of trust and mental model soundness (Kulesza et al. 2013; Hoffman et al. 2018), and the choice of tasks that play a role in evaluating AI systems (Buçinca et al. 2020).
Clearly, much of this work also applies to interfaces to investigate fairness, because an AI model has to be interpretable for the user to be able to understand how fair it is. Many of the tools discussed in section 2.2 already use XAI mechanisms and explanations in their design implicitly, however, there are very few research efforts that have investigated fairness from an explicit XAI angle. A notable exception is Dodge et al. (Dodge et al. 2019) who examined the role of ’templated’ explanations to support end-users in judging the fairness of AI systems, noting that there is no one ’right’ explanation style but that both global and local explanations might be necessary to make fairness assessments.
In our work, we explicitly adopt a user-centered XAI approach. We use explanatory debugging for interactive machine learning (Kulesza et al. 2010; Kulesza et al. 2015) as a lens through which to approach human-in-the-loop fairness tools. Explanatory debugging aims to help end-users to identify and correct ’bugs’ (i.e. mispredictions that fail to meet the user’s expectations) in an AI model (Stumpf et al. 2009; Kulesza et al. 2010; Groce et al. 2014). The approach includes a tightly coupled cycle of interactions with a user interface (UI) to explain to the end-user how the ML model makes its decisions (Kulesza et al. 2012) and then provide an opportunity for the user to make necessary corrections (Kulesza et al. 2009). We extend this approach to explanatory fairness debugging, where a user aims to identify and correct biases that do not conform to their expectations of fairness (i.e. ’fairness bugs’) through a tight cycle of interaction with an interface.
To help design explanatory debugging interfaces, eight principles have been proposed (Kulesza et al. 2015). Explanations should be 1) iterative, 2) be sound, 3) be complete but 4) do not overwhelm. This means that explanations should be concise, interactive, and in-situ, are truthful to the underlying model and show as much information that the system uses in making predictions, but this needs to be carefully traded off against what users can process and understand. The feedback to the system should 5) be actionable, 6) be reversible, 7) honored, and 8) be shown through incremental changes. This can be achieved by allowing users to make interactive corrections on the explanations provided, undo their corrections, integrating their feedback into the model, and being able to see if their corrections have the desired effect (or going toward the desired effect). We show in section 3.2 how we instantiated our human-in-the-loop fairness interface to follow these explanatory debugging principles.
2.4. Cultural aspects
In order to explore cultural differences in fairness assessments, we now discuss approaches for analysing culture. Culture, viewed as the characteristics, knowledge and behavior of a group of people, has been studied extensively, alongside cross-cultural aspects. These aspects in different cultures have been viewed and analysed in many different ways. For example, cultures can fall along a spectrum of ’high context’ and ’low context’ cultures depending on the importance of context in interpersonal communication (Hall 1976). Parsons and Shils (Parsons and Shils 1951) discussed differences between cultures in terms of five patterns of behaviors that are reflected at individual levels and social systems levels. Many more frameworks have been proposed but the most influential has been Geert Hoftstede’s framework of Cultural Dimensions (CDs).
In the 1970s, Hofstede started to develop a multi-dimensional cultural model, based on research on employees in IBM globally (Hofstede 2011). The model consists of six dimensions around which cultures differ (Hofstede and Minkov 2010; Hofstede 2011). These six dimensions are:
- •
Power Distance (PD) relates to the extent to which unequal power distribution, including inequality, is expected and accepted by the less powerful in society.
- •
Individualism (IDV) describes the degree to which people are integrated into groups and the strength of the ties within these groups. The other end of this dimension is Collectivism.
- •
Masculinity (MSC) refers to how assertive and competitive a society is, versus Femininity, which is more modest and caring.
- •
Uncertainty Avoidance (UA) describes a society’s tolerance for ambiguity, and unstructured, novel situations.
- •
Long Term Orientation (LTO) refers to societies which like to maintain time-honoured traditions and norms while viewing societal change with suspicion.
- •
Indulgence (IDG) is related to a society’s support for free gratification of basic and natural human drives related to enjoying life and having fun.
The framework allows quantitative comparison between cultures based on wide-scale surveys that focus not on the variations in individual responses but instead try to find tendencies at the country level11 1 https://geerthofstede.com/research-and-vsm/vsm-2013/. Hofstede makes it clear that the survey questions cannot be used to derive individual scores (Hofstede 2011), as it is not meant as a psychological personality instrument. As a result of applying these surveys over the last 50 years, country-based CD scores have been developed and are readily available22 2 Scores can be obtained from https://www.hofstede-insights.com/country-comparison/.
Hofstede’s work on Cultural Dimensions has not been without criticism in terms of methodology and conceptualization of culture on a national level (McSweeney 2002). It has often been accused of using unsound survey techniques among a limited group of participants, being reductive in terms of cultural differences that span national borders, or that it does not take into account sub-groups within a larger cultural framework. Hofstede (Hofstede 2002) has countered that the methodology has been validated across a very large sample of data, by other researchers, spanning more than 50 years, using a variety of research techniques. While he acknowledges that nationality is not the best unit for studying cultures, they are usually the only kind of units available for comparison. In any case, as he argued, dimensions should be seen as "constructs, which have to prove their usefulness by their ability to explain and predict behavior" (Hofstede 2002) and thus might not be the only way to understand people’s behavior.
Despite these criticisms, it is widely used to understand interactions with and design considerations for technology, for example, it has been employed to analyze cultural differences in mobile service design (Choi et al. 2005) and well as security behaviour (Sawaya et al. 2017). It has also been extensively validated (Hofstede et al. 2010) and used to understand how fairness is culturally dependent (Silvernail 2016; Blake et al. 2015; Bolton et al. 2010; Mattila and Choi 2006; Kim and Leung 2007; Geiger and Meek 2005; Leung 2008).
In this paper, we employ Hofstede’s framework to explore cultural differences in our empirical data, in order to investigate whether they can explain differences in fairness assessments. Instead of splitting participants into countries or regions in which they are based, we follow Hofstede’s suggested approach and map each participant’s CD scores from the country score given by Hofstede framework. We then compare across culture, by investigating differences between high and low CD scores of each dimension, as we explain further in section 4.4.
3. An Interactive Human-in-the-loop AI fairness prototype for End-users
In order to investigate how we can design interactive human-in-the-loop interfaces for end-users to help them identify and fix fairness "bugs" (RQ1), we obtained requirements from a series of co-design workshops and coupled them with principles of explanatory debugging. We first describe the setup of the workshops, then describe the prototype’s functionality and rationale for its design.
3.1. Co-Design Workshops
Following a co-design approach to interface design (Sanders and Stappers 2008; Stumpf et al. 2021) , we ran a series of workshops in the USA, UK, and Japan with a total of 12 end-users. We recruited 3 participants (2 women, 1 man, mean age 47.3) for the co-design workshops held in the USA, 5 participants (3 women, 2 men, mean age 34.2) in the UK, and 4 participants (3 women, 1 man, mean age 33.75) in Japan through social media and personal contacts. As end-users, these participants had no special technical or domain knowledge, and we only checked that they were engaged in the topic, by recruiting people who had previously applied for a loan. Since our work is meant to help people explore and assess fairness using their own criteria rather than pre-established fairness metrics, we also did not require previous knowledge or engagement with any fairness research. We paid an incentive of £40, or equivalent in the local currency. The study was approved by the City, University of London Computer Science Research Ethics Committee; all participants were over 18 years old and informed consent was obtained before they took part in the co-design workshops.
For each country, we held 2 co-design workshops; these two workshops were 3 weeks apart and each lasted 2 hours.Due to COVID-19 restrictions, we were unable to conduct face-to-face workshops, and thus held all workshops online. In workshop 1 we mainly investigated how end-users went about looking at fictitious loan application scenarios that we developed, and what information they wanted to identify potential fairness issues. Based on the feedback obtained in workshop 1, we then constructed an initial low-fidelity prototype UI, and evaluated and refined it during workshop 2. The workshops in the USA, and UK were conducted in English and in Japan conducted in Japanese by researchers who are native speakers of these languages. We recorded all workshops and used thematic analysis (Braun and Clarke 2006) to develop code sets around what information or cues they looked for to assess fairness, and how we could design and improve UIs for assessing fairness.

3.1.1. Workshop 1 procedure
In workshop 1, we explored how end-users explore fairness in loan decisions, using their own criteria. To investigate what attributes and information they might be looking for to assess the fairness of the applications’ outcomes decided by AI and potentially what they would change to make the decisions fairer, we developed 4 fictitious applications as scenarios to consider. We changed some of the application scenario details to localize them to each country (e.g. names, currency, dates, addresses) but otherwise kept them the same. The language of the slides is translated by a researcher carefully avoiding changing the meaning. The application details that we showed to end-users are typical of information collected as part of a loan application process, based on the application form of a well-known international bank. Credit scores of applicants are frequently obtained and used by financial institutions to assess the risk of lending applicants money.
Application 1 (USA/UK: Mark Benson or Japan: Kazufumi Takahashi, Fig. 1 A) was always approved, as it was a ’safe’ application, with a homeowner with a very good credit score applying for a small loan to buy a used car. Application 2 (USA/UK: Sadia Mohammed or Japan: Chihe Pak, Fig. 1 B) was rejected, as it was a more ’risky’ application with low income, part-time job and low credit score. We also included her application to investigate any potential minority or age biases. Application 3 (USA/UK: Jennifer Clary or Japan: Maika Suzuki, Fig. 1 C) was also rejected but crucially her details were very similar to application 1. This was to introduce an application that seemed, without any further information, to be clearly unfair. Finally, application 4 (USA/UK: Kwame Odejima or Japan: Dũng Nguyên, Fig. 1 D) was accepted although it seemed more ’risky’.
Each scenario was discussed in turn within each group. This discussion focused on exposing whether end-users thought the decision was fair and why, based on the information included in the application or their experience of the decisions they had seen, and what information would have been useful for them to assess fairness better.
3.1.2. Development of an initial prototype
We analyzed workshop 1 using a thematic code set that focused on information and cues for assessing fairness that were mentioned by participants during the discussion of the scenarios. We then mapped these codes to interface design elements to construct clickable wireframes to instantiate their suggestions in an interface (Fig. 2).

3.1.3. Workshop 2 procedure
In workshop 2, we structured our discussion on the clickable wireframes’ screens, using scenarios that explored a number of fictitious loan applications. Going through each screen’s functionality, we discussed what helped to understand if the application decisions were considered fair, what additional information would they like to determine fairness, and what feedback they would like to give to fix fairness issues.
We further analyzed the feedback during workshop 2 using thematic analysis (Braun and Clarke 2006) to develop and refine requirements for a human-in-the-loop prototype system, which we describe in detail next.
3.2. The Interactive Human-in-the-loop Prototype System

We now describe each panel and its functionality in more detail, justifying its design through requirements arising from our analysis of the workshops (shown in italics) and Explanatory Debugging principles relating to providing explanations (shown as font). While we also looked for patterns in the feedback that might indicate cultural differences in the information or functionality that should be included, we did not find any that affected the overall design.
An overview of the prototype system’s interface is shown in Fig.3. The prototype interface consists of 4 main panels: System-wide information (Fig.3 (A) and (B)), an overview of applications (Fig.3 (C)), more details of a currently selected application (Fig.3 (D)), and information comparing the currently selected application with other applications (Fig.3 (E)).
In order to align with Explanatory Debugging Principles 1) Be iterative and 4) Do Not Overwhelm, panels D and E are only revealed when a specific loan application is selected in panel C. While users can provide corrections to the model in panel F, our prototype does not yet integrate this feedback through an online learning process or is able to show any changes to the model based on these corrections to the user on-the-fly. Hence, we do not focus on justifications based on Explanatory Debugging principles dealing with how to integrate feedback. (We show how this user input can be used in off-line experiments in section 4.5.2).
As the machine learning model for this system, we use a logistic regression model with 26 attributes as explanatory variables. In this model, each attribute has its weights and each applicant has a specific value for each weight. Users can modify the weight for each attribute in each application with slide bars that we will explain in the part of Application Details - Suggest changes mode in this subsection. While we use logistic regression in our system, our interface is applicable to models that use linear functions with the weights for each attribute, such as Naive Bayes classifier or support vector machine. More details of the logistic regression model we used will be explained in Section 4.2.

System Overview: Participants in the workshops often used acceptance rates to judge fairness, through defining fairness as equality of opportunity, group fairness and individual fairness. The system-wide information (panel A, Fig. 4) shows the numbers of rejected and accepted applications and the numbers of applications that have been judged fair or unfair by the user. This panel provides a global explanation to the user about decisions that the system has made in terms of accepting or rejecting loan applications, and thus shows information against which to judge fairness. In addition, the panel follows Explanatory Debugging Principle 1) Be iterative , as it updates the overview of fairness ratings based on the user feedback.

How Our Algorithm Works: The design of this panel was based on feedback by participants as they wanted to know about the reasons for making the particular decision, and the underlying model for the decision-making. In panel B (Fig. 5), an explanation is provided about how the model algorithm works and model attribute information. The model algorithm explanation aims to explain in simple terms how a logistic regression model makes decisions, which is the model used in our example but this could be adjusted of a different model is used. To save screen space, the user can collapse or expand this explanation.
Participants wanted to know what information was used in the model to make decisions. They often feared that there might be other unknown attributes used in the decision-making, and they wanted full transparency of which attributes influenced the decision. In particular, co-designers were worried that protected attributes, such as gender, might be applied, or wondered whether (and how much) the monthly repayment amount mattered. They placed great importance on procedural fairness, in which protected, nonfactual or incorrect information is not used, and that the decision-making follows a logical and fair procedure. A co-designer stated that “unfair is being stereotyped, you’ve got a certain postcode so you must be from a certain community (UK101).”
They stated that knowing the importance and value distributions can give clues as to any potential biases in the decision-making. Participants were interested in the attribute weighting in the model. We showed this as the attribute absolute weight, represented as the size of a circle, and a bar chart of the distribution of attribute values with respect to the application decision. The attributes can be sorted based on their importance. For the value distribution, we divided the minimum to maximum values of continuous variables into five equal parts and showed the percentages of rejected and accepted applications categorized into each part as a stacked bar graph. We represented the percentage of the accepted applications with green, and that of rejected with yellow. The sum of the values in stacked bar graphs for each attribute is 100%.
In designing this panel we also took note of Explanatory Debugging principles 2) be sound, and 3) be complete. To instantiate 2) be sound, we worked with workshop participants and the research team to develop a simple way of explaining the logistic regression algorithm used in the decision-making while being faithful to the model. To address 3) be complete, we listed all of the attributes that the algorithm is using.

Applications Overview: In designing this panel, we reflected workshop participants’ requirements of wanting to know how sure the algorithm was in accepting or rejecting the application, or how close the decision was to being accepted or rejected. This implies that they are interested in the decision boundaries of the algorithm, which we represented as a "prediction confidence" percentage. In panel C, (Fig. 6), applications are shown with their ID, the results of the model’s prediction (i.e., reject or accept), the confidence of decision represented by percentages as well as a pie chart, and markup by the user of whether they considered the application to be fair or unfair. This percentage was calculated as the probability that an application was accepted. The probability is the value resulting from a sigmoid function where the variable is a linear utility function. The utility function is the inner product between weights for attributes and the values for the attributes plus a constant term. The weights and the constant term were calculated through optimization of the cost function for the logistic regression. When the percentage is more than 50%, the application is considered accepted.
Users can interact with this overview in a number of ways: they can filter applications based on attribute values, or they can sort the application list on ID number, predicted decisions, confidence, and the fairness evaluation by the participant.
Showing the prediction and its confidence instantiates Explanatory Debugging principle 2) be sound, and by its simplicity also 4) do not overwhelm. Highlighting a specific application brings up more detail about it, shown in panel D and E, and thus follows Explanatory Debugging principles 1) Be iterative and 4) Do Not Overwhelm.


|
Application Details - View mode: Users can check the details of each application in panel D ( Fig. 7). The user can mark up each application as fair or unfair, which is then also shown in the Applications Overview, panel C. The main part of the Application Details panel is a bar chart, to reflect the insights from the workshops.
Participants often looked at lots of different attributes such as annual income,loan amount, and employment status to determine whether the loan was affordable. In addition, they frequently looked in detail at the postcode/neigborhood, purpose of loan, residence status, and date of birth attributes that were given as part of the loan application to assess whether a loan decision was fair. We therefore showed each attribute and its value in this panel.
Participants in the co-design workshops wanted to know how important each attribute was to the decision, and what attribute values had positive or negative effects on the outcome. Alongside this, they requested details about which attributes had the most critical influence on the outcome. Consequently, the bar chart shows the weight for each attribute and the criticality for each attribute value. Both show the extent of influence an attribute has on the application’s prediction. An attribute’s weight is derived from the cost function of the logistic regression. The criticality is the product between the weight for an attribute and the chosen application’s value for the attribute. The weight for each attribute is shown in the bar chart as the direction and length of each bar, and criticality (i.e., to what degree each value has an effect on the final decision) with saturation of colors; the more saturated, the higher the effect on the decision (red represents negative effects, blue a positive effect). The bar graphs can be sorted based on the weight. Additional information about the provenance of each attribute value is displayed. The user can also mark up whether the application might need human input.
Provenance information was provided by hovering over an attribute information icon because many participants were also interested in but unclear about the credit score and its role in the decision-making, for example: “UK105: I don’t really know what a credit score of 921 is.”
Finally, the user can also suggest that the decision needs human input. This followed discussions during the workshops indicating that while they thought AI could make decisions fairer by reducing human bias, they also stated that some decisions might require some form of human judgement. This is because co-designers considered there are some ’gray’ areas which require a human to sort out, for example:”…AI is quite black and white and it doesn’t understand different nuances and biases and I think to make something fair or not fair, you kind of need a person (UK102).”
In designing this panel, we also followed Explanatory Debugging principles 1) be iterative 2) be sound and 3) be complete.

Application Details - Suggest changes mode: The design of this mode addresses workshop participants’ requirement to make changes to the attribute importance and weighting. After entering the ’suggest changes’ mode (Fig. 7), participants can change the weights for each attribute by dragging and dropping the bar graph.
This mode also follows Explanatory Debugging principle 5) be actionable, by allowing user feedback on explanations. They also partly align with Explanatory Debugging principle 6) be reversible, as any edits can be cancelled or overwritten.
Compare Current Application to Similar Application: Panel E (Fig. 8) supports users to further delve into evaluating the fairness of the decisions and the model. Workshop participants often wanted to compare applications in some way to do this. In particular, participants stated the need for knowing the number of similar applications with the same or different outcomes, being able to compare the details of similar applications and compare similar applications with different outcomes, especially if they crossed the decision boundary. To satisfy these requirements, we designed Panel E to allow the user to compare the currently selected application with other applications. Users see a scatterplot of applications based on their similarity to the currently selected application in panel C and their prediction confidence. Here, we calculated similarity between two applications as the average value of similarities of all attribute values. Applications are shown in green if they were accepted, and yellow if rejected. Participants can filter the applications based on the similarity between each application and the selected application with the slide bar below the scatter plot. Applications whose similarity is out of the range are grayed out and become unselectable. To further compare a particular application, the user can select it in the scatterplot. This then shows a comparison of the application details, and the respective attribute similarities.
This panel again was designed according to Explanatory Debugging principles 1) be iterative 2) be sound and 3) be complete.
4. An Empirical Study of Using the Prototype
In order to investigate how end-users assess whether an AI system is fair or unfair, using a human-in-the-loop interface (RQ2), whether they can fix fairness "bugs" through their feedback (RQ3) and to explore cultural dimensions to fairness assessments and use of the prototype (RQ4), we set up an online study that asked a large pool of participants to interact with an AI model through the prototype. Due to COVID-19 restrictions, we were unable to conduct face-to-face observational sessions.
4.1. Participants
We recruited 388 participants (129 female, 256 male, 2 Other and 1 preferred not to say) through Prolific33 3 https://www.prolific.co/, an online research platform, and paid them £3.50 for an expected 30-minute session. Again, as with the co-design workshops, we did not require any technical or domain knowledge of fairness in loan applications, however, more than a half of our participants had some programming experience (26.8%), familiarity with AI, machine learning or statistics (31.7%), or both (18.6%), and 146 participants had at least a Bachelor degree. These rather educated and tech-savvy participant profiles are in line with other crowd-sourcing studies (Ross et al. 2010).
We recruited globally but the majority of participants came from Europe (345 people). The remainder came from Latin America (18), North America (11), Africa (10), Asia (2) and the Middle East (2). To investigate cultural aspects, we extended participants’ data with Hofstede’s country scores for each Cultural Dimension based their reported country of birth and country of residence, as we explain in section 4.4. As we will explain in the section, the participants’ cultural scores vary a lot in each cultural dimension, even though they are drawn mainly from Europe.
The study was approved by the City, University of London Computer Science Research Ethics Committee and all participants had to be over 18 years of age and give their informed consent.
4.2. The AI model
Instead of using an open-source dataset, the AI system we developed was based on an anonymized loan decision dataset we obtained from a project partner that provides financial services. This dataset contains decisions made on 1000 loan applications and has 35 attributes including the label of whether the loan application was accepted or rejected. These attributes include demographic information of the applicant (age, gender, nationality, etc), financial information (household income, insurance, etc), loan information (amount of loan requested, purpose of loan, loan duration, monthly payments, etc), as well as some information of their financial and banking history (years of service with the bank, etc). There were also some attributes that related to internal bank procedures, such as a money laundering check and a credit score developed by the bank. We removed attributes that lacked more than 100 (10%) cases, or where multiple attributes had similar values. As a result, we used 26 attributes in our AI model. We then randomly split the dataset into 70% training data and 30% test data, and trained a logistic regression model. To train the model, we applied a limited-memory BFGS as an optimization algorithm and an L2 regularizer with default settings. The balanced accuracy of the resulting model was 0.618 for the test data.
Note that the model we developed was unfair; this unfairness in the model occurred naturally in the process of training the model and is one way how many AI model end up with fairness issues without explicit bias in the data. The particular attribute that caused unfairness was Nationality. This attribute has two values: ’citizen’ and ’foreign’, where citizen means the customer’s nationality is the same as the bank’s location, and foreign means that the applicant is from a different country. In our AI model, foreigners tended to be rejected more frequently than citizens. Recall that disparate impact, a widely used fairness metric, is calculated as the ratio of the percentage of the accepted people in the group of interest and the percentage in the other groups; anything below 0.8 is considered unfair. Using disparate impact as a fairness metric, our model is unfair (0.718) on Nationality. This is in contrast to the original dataset, where disparate impact of Nationality is 0.854, i.e. is considered fair.
4.3. Procedure
The study session consisted of four phases: pre-questionnaire, tutorial, use of the interface to assess fairness, and a post-questionnaire. First, in the pre-questionnaire (2.5 minutes), we asked participants for background information as well as to rate their general perception of AI fairness on a 7-point Likert scale. After the pre-questionnaire, we presented a tutorial page which explained the organisation and functionality of the interface to familiarise them with its use (5 minutes).
For the main part of the session, we asked participants to interact with the interface for 20 minutes. We did not give them specific task instructions; instead we asked them to consider whether the system makes fair decisions on loan applications by looking at applications it has made decisions on, interacting with the interface to give them information on applications that might help them to make this assessment, and also to make suggestions that might help to make the system better in the future. During this part, we presented the 300 applications in the test data along with the predicted label of whether to accept (predicted probability is more than 50%), or reject (predicted probability is the same as or less than 50%). Participants were free to use the interface as they wanted; after that time, participants were moved along to complete the post-questionnaire.
In the post-questionnaire (2.5 minutes), we asked again about their AI fairness rating but this time based on their experience of the AI system making decisions on loan applications. We then asked them to describe in their own words what strategies they used to assess the fairness of the system, any systematic fairness issues they had spotted, and their views on suggesting changes and addressing fairness. We then finished the session by asking them to rate their task load using the NASA-TLX questionnaire (Hart and Staveland 1988). All questionnaires are available in the electronic appendices.
4.4. Data analysis
We did not integrate explicit attention checks during the procedure so as not to disturb their interactions with the prototype. However, we removed 155 participants from the data analysis who completed the study in an infeasibly short time, who failed to interact with the prototype interface, or who did not complete the associated questionnaires. This resulted in 388 participants whose data we analyzed.
In order to analyze participants’ assessments and interactions with the system we drew on a rich tapestry of data using a mixed-methods approach. First, we gathered fairness ratings from the pre- and post-questionnaires, and responses to the NASA-TLX questions. We also logged interactions between the participants and our system, such as clicks and settings of interface elements, applications marked as Fair or Unfair, and the details of suggested changes for further analysis. All these measures lend themselves to quantitative analysis, and where appropriate, we conducted statistical non-parametric tests. Non-parametric tests are less susceptible to imbalanced groups and data which are not normally distributed which makes them appropriate to our data. We also analyzed participants’ post-questionnaire responses qualitatively using thematic analysis (Braun and Clarke 2006) to supplement and contextualize our quantitative findings.
To investigate the impact of any suggested changes by participants on fairness, we developed a new model off-line in which we aggregated the suggested weights by the participants. To do so, we first averaged the weight value for each attribute suggested by the participants on an application. We then applied the suggested weights as the weights for the attribute of the application and calculated the confidence based on the weights, keeping the original weights if no changes were suggested for an application. Once we had obtained these new weights, we calculated the disparate impact on nationality as a fairness metric for each of them.
Cultural Dimensions Data Analysis: We paid special attention to cultural dimension with respect to interactions with the prototype. As we described in Section 2.4, the cultural scores should not be applied on the individual level. Instead, we applied the following procedure. First, we used the participant’s country of birth or residence to look up the respective CD scores. We identified the country of residence of 354 participants (91.2%) from the information registered on Prolific. For 23 participants (5.9%) in those who had not registered the country of residence, we identified the country of birth registered on Prolific as their country. And for 10 participants (2.6%) who had not registered any country information on Prolific, we used country of residence registered in the pre-questionnaire as their countries. For only 1 participant (0.3%) who had not registered the above country information, we use the information of nationality written in our pre-questionnaire as her/his country. If CD scores were not available for a country, we calculated the CD score as the average CD score of countries next to the country. There was only one country (Afghanistan) whose CD score is unavailable.
We then assigned each participant into High and Low groups for each CD dimension, e.g. Power Distance High and Power Distance Low. To make that assignment, we calculated the mean score for each of Hofstede’s cultural dimensions based on the country-to-country scores in the publicly available dataset44 4 https://geerthofstede.com/research-and-vsm/dimension-data-matrix/ and then based the assignment on whether their country-based score was higher or lower than the mean score of the dimension. The mean scores are as follows: 59.33 for Power Distance, 45.17 for Individualism, 49.27 for Masculinity, 67.64 for Uncertainty Avoidance, 45.48 for Long-term Orientation, and 45.43 for Indulgence. For example, a participant from the UK has a Power Distance score of 35; this is lower than the PD mean of 59.33 and hence that participant would be assigned to the Power Distance Low (PD-L) group. As shown in Table 1, the participants’ cultural scores vary a lot in each cultural dimension, even though they are drawn mainly from Europe, allowing cross-cultural comparison.
To investigate the impact of suggested changes to the AI model based on cultural dimensions, we aggregated the weights as detailed previously for each of the High and Low score groups in the six dimensions.
| PD | IDV | MSC | UA | LTO | IDG | ||
|---|---|---|---|---|---|---|---|
| N | M (SD) | M (SD) | M (SD) | M (SD) | M (SD) | M (SD) | |
| All countries | - | 59.33 | 45.17 | 49.27 | 67.64 | 45.48 | 45.43 |
| All participants | 388 | 57.58 (12.98) | 57.05 (20.38) | 54.48 (17.37) | 82.29 (21.92) | 43.02 (13.88) | 41.83 (18.46) |
| From Africa | 10 | 51.1 (6.3) | 61 (12.0) | 62.7 (0.9) | 49.1 (0.3) | 34 (0.0) | 60.9 (6.3) |
| From Asia | 2 | 55.5 (1.5) | 37 (9.0) | 71 (24.0) | 78.5 (13.5) | 60 (28.0) | 31 (11.0) |
| From Europe | 345 | 57.60 (11.83) | 57.65 (19.95) | 53.70 (17.82) | 84.37 (21.54) | 44.48 (13.57) | 37.98 (13.86) |
| From Latin America | 18 | 77.222 (8.87) | 30.111 (4.43) | 63.722 (12.97) | 82.667 (1.49) | 24.717 (2.38) | 92.074 (11.75) |
| From North America | 11 | 39.273 (0.45) | 83 (4.9) | 54.727 (4.45) | 47.455 (0.89) | 33.228 (4.55) | 68.18 (0.14) |
| From Middle East | 2 | 13.0 (0.0) | 54.0 (0.0) | 47.0 (0.0) | 81.0 (0.0) | 38.0 (0.0) | 24.0 (0.0) |
4.5. Results and Findings
4.5.1. How participants assessed fairness (RQ2)
Overall, interactions with the interface were viewed positively by participants. From the post-questionnaires, we found that the options and functionalities provided within the interface appeared to be sufficient for participants, as over 75% of responses stated that there was nothing else that they wanted to see or do with the system. Many participants also mentioned that they liked the ability to suggest changes for an application to help make fairer decisions.
These findings are reinforced by the result of the NASA-TLX questionnaire (Fig. 9) where participants rated their taskload. Mean ratings for temporal demand, performance and frustration are around 50 which indicates a medium load, while physical demand is low. Mental demand and effort required is relatively high, probably because the interfaces encourages reflection, thinking and exploration which might increase the load in these respects.

We then investigated how participants made fairness assessments. In the post-questionnaire, participants noted that they were mainly looking at specific decisions (14%), and over 20% of participants stated that they relied on the graphs and stats provided in the user interface, such as confidence and value distributions. To carry out these assessments, they interacted with the prototype; the mean value that participants clicked UI components during the main task was 142.16 (SD=86.42). Participants frequently sorted on Confidence (33.7%) and Predicted Decision (28.3%) out of the number of clicks on all functions (ID Name, Confidence, Fairness rating, and Predicted Decision, 890 clicks in total). At the same time, 250 (64.4%) participants used the comparing function (Fig. 3 (E)) and 67 (17.3%) participants compared individual applications out of 388 participants. These interactions suggest that participants might be using this information to identify applications to further explore in terms of fairness, for example, by focusing on applications close to the decision boundary, looking at applications that were rejected perhaps unfairly, and contrasting applications that on the surface looked similar but that had contrasting outcomes.
Our next step was to explore how many individual application decisions they judged as fair or unfair. Across all participants, a mean of 27.8 applications (SD = 29.2) were judged as fair and a mean of 6.80 applications (SD = 7.86) as unfair, out of the 300 given to them. From this, we calculated the unfairness ratio as the ratio of applications judged unfair over all fair and unfair judgement made; the mean was 0.208 (SD = 0.164) across all participants. We then investigated how the unfairness ratio was related to each participants’ fairness rating in the post-questionnaire. To do this, we conducted a Pearson’s correlation analysis between the AI fairness rating of each participant in the post-questionnaire and their unfairness ratio. We found that there is a highly significant but weak negative relationship (r = -0.221, p <0.001), showing that as the unfairness ratio increases, their perception of the AI system’s fairness decreases.
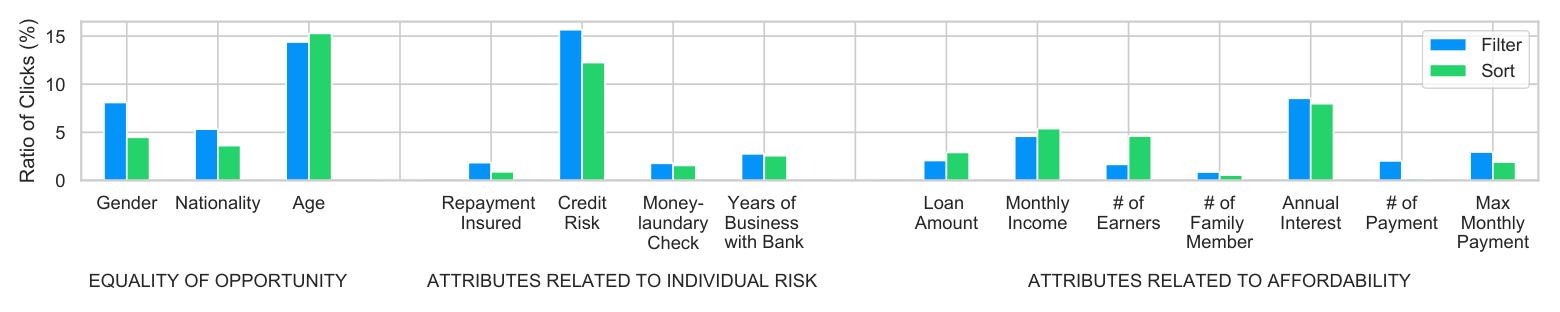
Next, we investigated if there were any patterns in how participants judged the fairness of each application using the prototype. The responses in the post-questionnaire showed that participants assessed fairness of the AI system by using affordability (mentioned by 26% of participants in the post-questionnaire), equality of opportunity (16%), and individual fairness (15%).
To check these criteria, they focused on particular attributes which is substantiated by our interaction logs (Fig. 10). For affordability, many participants chose to filter or sort on attributes that relate to this criteria, such as the annual interest, monthly income, number of earners, and loan amount. A second strategy, checking for equality of opportunity, involved sensitive attributes such as age, gender, and nationality which they frequently filtered and sorted on. Finally, assessing the individual risk of an applicant was carried out using attributes such as credit risk and years of business with the bank, and whether the loan repayment was insured.
However, participants also interacted with the prototype to investigate a large range of other attributes, especially the purpose of the loan and the loan type, to explore their impact on loan decision and hence fairness of these decisions. This shows that our prototype can support flexible fairness assessments because it allows a range of fairness criteria to be employed and associated attributes to be investigated.

Cultural Dimensions (RQ4): We did not find any strong patterns in the NASA-TLX responses which cultural dimensions could explain. This indicates that cultural dimensions have no significant effect on the usability of this tool.
However, we found strong evidence that the prototype might be used very differently across cultures, and that different fairness criteria might be applied. First, we delved deeper into cultural differences in terms of whether they judged applications as fair or unfair (Table 2). First, we looked for differences between all groups in how many applications were judged fair or unfair, and found that there was a significant difference (Kruskal-Wallis, H = 24.00, p = 0.013) in the number of applications judged unfair. As a result of a post-hoc Steel-Dwass test, we found there are significant differences between UA-H and UA-L groups (p = 0.044), and between IDG-L and UA-L groups (p = 0.028). Then, we looked for differences within dimensions in how many applications were judged fair or unfair (Table 2). We found that there were significant differences for fairness perceptions within the Masculinity, Uncertainty Avoidance, and Indulgence dimensions for applications judged as fair, unfair and the unfairness ratio. Here, participants in the MSC-H group judged significantly fewer application decisions as fair than the MSC-L group (Mann-Whitney U, U = 18786.5, p = 0.023), participants in the UA-H group judged more application decisions as unfair than the UA-L group (U = 9270.5, p <0.001), and finally participants in the IDG-H group judged fewer application decisions as unfair than the IDG-L group (U = 19046.0, p = 0.002). We did not find any significant differences between groups for the unfairness ratio (Kruskal-Wallis, H = 15.74, p = 0.151) but we found significant differences in the unfairness ratio within groups, where the UA-H group’s unfairness ratio was higher than that of UA-L group (Mann-Whitney U, U = 10020.5, p = 0.014), and that of participants in the IDG-H group was less than the IDG-L group (U = 18415.0, p = 0.011). Taken together, these results indicate that Masculinity, Uncertainty Avoidance, and Indulgence dimensions influenced fairness assessments, and that participants with High Masculinity, High Uncertainty Avoidance and Low Indulgence tended towards assessing the system as more unfair than others.
| Judged Fair | Judged Unfair | Unfairness Ratio | |||||||||||
| N | M | SD | U | p | M | SD | U | p | M | SD | U | p | |
| PD-L | 158 | 24.76 | 23.34 | 16899.0 | 0.242 | 6.30 | 7.96 | 16609.0 | 0.149 | 0.1998 | 0.16146 | 17268.5 | 0.406 |
| PD-H | 230 | 29.96 | 32.44 | 7.14 | 7.79 | 0.2135 | 0.1653 | ||||||
| IDV-L | 109 | 27.06 | 25.76 | 15883.5 | 0.495 | 6.58 | 7.37 | 14609.5 | 0.547 | 0.1986 | 0.1706 | 14323.0 | 0.374 |
| IDV-H | 279 | 28.14 | 30.42 | 6.88 | 8.06 | 0.2116 | 0.1610 | ||||||
| MSC-L | 125 | 31.07 | 29.59 | 18786.5 | 7.12 | 7.33 | 17177.5 | 0.472 | 0.1916 | 0.15499 | 15183.0 | 0.224 | |
| MSC-H | 263 | 26.30 | 28.88 | 6.64 | 8.11 | 0.2157 | 0.1674 | ||||||
| UA-L | 79 | 23.33 | 20.51 | 11182.0 | 0.250 | 4.54 | 4.77 | 9270.5 | 0.1664 | 0.1388 | 10020.5 | ||
| UA-H | 309 | 28.99 | 30.91 | 7.37 | 8.38 | 0.2186 | 0.1680 | ||||||
| LTO-L | 248 | 28.75 | 31.32 | 17706.0 | 0.745 | 7.04 | 8.88 | 17110.0 | 0.814 | 0.2061 | 0.1672 | 16786.5 | 0.589 |
| LTO-H | 140 | 26.22 | 24.90 | 6.37 | 6.53 | 0.2112 | 0.1578 | ||||||
| IDG-L | 271 | 29.04 | 31.76 | 16387.5 | 0.599 | 7.36 | 7.65 | 19046.0 | 0.2208 | 0.1657 | 18415.0 | ||
| IDG-H | 117 | 25.06 | 21.85 | 5.50 | 8.22 | 0.1781 | 0.1555 | ||||||
We then looked at the potential reasons for making these assessments from the post-questionnaire, based on cultural dimensions. More participants in the MSC-H group (34%) and the UA-H group (34%) mentioned assessing affordability than in the Low score counterparts (26% and 23%). This means that High Masculinity and High Uncertainty Avoidance tended to look for ’objective’ criteria to determine whether the loan is fair. We did not find a similar reason to distinguish Low Indulgence in our data.
Other cultural dimensions also seemed to play a factor in the reasons for making assessments and how the tool was used. There was a higher percentage of participants who stated that they checked for equality of opportunity and sensitive attributes in the IDV-L group (20%) versus IDV-H (12%), and also LTO-H group (24%) versus the LTO-L group (15%). This also seems to be partially borne out by the analysis of the interaction logs. In a quantitative analysis, we found that the LTO-H group interacted more with for maximum monthly payment (U = 15993.5, p = 0.019). Yet more evidence for the impact of cultural dimensions on the use of the prototype comes from the PD-L group which interacted significantly more with sensitive attributes such as gender (U = 19716.5, p = 0.045) and nationality (U = 19868.5, p = 0.020) than the PD-H group, and also with attributes such as number of maximum monthly payment (U = 19512.0, p = 0.025), income contributor (U = 19065.5, p = 0.044), and monthly income (U = 18818.0, p = 0.022). This means that equality of opportunity and attributes indicating this fairness criteria seemed to be especially important to Low Individualism, High Long Term Orientation and Low Power Distance.
4.5.2. Did Participants improve Fairness? (RQ3)
Recall that our AI model was unfair with respect to the Nationality attribute; foreigners were discriminated against by rejecting more of their applications. While many participants said in the post-session questionnaires that they could not find any systematic errors in the decision-making, many others interacted with the prototype to indicate possible problems with the AI model. One way to do this is to mark an application as unfair. There were significant correlations between an application’s unfairness ratio and where participants had interacted with the Credit risk attribute (r = 0.650, p<0.001) or Years of business with the bank (r = -0.260, p <0.001) within the prototype. Further, we also found that the unfairness ratio was significantly higher for applications involving foreigners (M = 0.243, SD = 0.134) than for citizens (M = 0.159, SD = 0.130) (U = 301.0, p <0.001). When we investigated the distribution of applications marked unfair for accepted and rejected applications by citizens and foreigners out of the total unfair judgement (2637), we found that unfair judgements accounted for 57.6% for accepted citizens, 20.1% for rejected citizens, 7.9% for accepted foreigners, and 14.4% for rejected foreigners. This means that participants overwhelmingly focused on accepted applications than rejected ones. Participants seemed to be able to successfully identify the fairness issue in the nationality, and convey this through the prototype.
To address any fairness issues, we gave participants the opportunity to suggest changes by adjusting the attribute weight. We found that 230 participants suggested weight changes, to 3.71 (SD = 7.58) applications on average.

An important consideration is whether these suggested changes make the AI system fairer, or in fact might make it even worse. Following the approach described in subsection 4.4, we found that across all participants’ changes, the value of disparate impact increased from 0.718 to 0.814 based on all participant feedback. We then also explored if individual end-users can improve the mode’s fairness. For this, we compared the original DI (0.718) with the DI of a model for each participant who changed weights, trained on their mean values of suggested weights across multiple applications. We found that 115 participants (50%) increased DI (M = , SD =) and 115 participants (50%)decreased DI (M = , SD =). Taken together, these results show that weight changes suggested by end-users can mitigate discrimination in a human-in-the-loop AI model, however, not all end-users give good feedback. Being unable to ’converge’ on a better model is an important limitation for human-in-the-loop learning and explanatory debugging which we will discuss further in section 5.2.
As a follow-up to investigating weight changes by individual participants, we also compared the weights suggested for each attribute between those participants who increased DI and those who decreased DI, using a Mann-Whitney U test. This allowed us to explore which attributes were possibly at the root of the increase or decrease in the DI. Surprisingly, we noted that there was not a significant difference in the suggested weights for Nationality (). However, we found four attributes had large differences in the suggested weights between these two group: Credit risk level ((M, SD): (-0.813, 0.35) for increase, (-1.0, <0.001) for decrease, , ), Has joint mortgage ((M, SD): (-0.143, 0.078) for increase, (0.134, 0.0245) for decrease, , ), Type of loan ((M, SD): (-0.0714, 0.047) for increase, (0.03584, 0.0604) for decrease, , ), and Years of business with the bank ((M, SD): (-0.214, 0.101) for increase, (0.187, 0.0697) for decrease, , ). This means that these attributes had a major influence on the fairness of the AI model.
Cultural dimensions (RQ4): We tried to determine if cultural dimensions played a role in making the system fairer. First, we investigated whether cultural dimensions meant they interacted differently with the prototype. We noted that the LTO-H group suggested weight changes for significantly more applications than the LTO-L group (U = 15258.0, p = 0.0392); otherwise we did not find any differences between either groups or within dimensions. Second, we also explored cultural differences in making the models fairer (Fig.11). We found that all groups made the AI model fairer, but the MSC-L (0.792), LTO-H (0.792) and PD-H (0.799) groups did not make it fair enough. We also noted that IDG-L and UA-H groups had the highest disparate impact score (0.888), which means that they made the AI model very fair. Recall from the previous section, that participants with Low Masculinity judged significantly fewer decisions as unfair than the High Masculinity group, while there were also differences in use of the prototype for High Long Term Orientation and Low Power Distance. This might explain why these dimensions might not made the system fair enough. Also recall that participants with Low Indulgence and High Uncertainty Avoidance judged more decisions as unfair. This could explain why these groups made the system fairest.
5. Discussion
5.1. Including end-users in fairness
With the development of tools such AI Fairness 360 (Bellamy et al. 2019), the What-if tool (Wexler et al. 2020) and interfaces such as Silva (Yan et al. 2020b), FairSight (Ahn and Lin 2019) and FairVis (Cabrera et al. 2019), human-in-the-loop fairness is becoming a reality. However, there is still a shortage of tools that involve end-users in assessing fairness, with most approaches squarely targeted at data scientists and ML experts.
To the best of our knowledge, our work is the first to consider how end-users could be involved in interactive human-in-the-loop fairness, by providing a prototype that makes decision-making more transparent and allows them to interactively explore decision-making to identify fairness "bugs", inspired by Explanatory Debugging (Kulesza et al. 2015) used in interactive machine learning. We found that end-users attended to a wide range of attributes to assess the fairness of a model, often going beyond sensitive attributes such as gender, age, etc. Making model and attribute information transparent through confidence, weights, attribute values helped them hone in on individual applications that might be problematic. They were able to compare these individual applications with other applications to narrow down on potential unfair decisions. Fairness criteria that were often used by end-users included affordability, equality of opportunity and individual fairness.
In contrast to many other tools, our prototype did not rely on or employ any fairness metrics in assessing fairness. Fairness metrics have attracted some criticisms as it is not clear which one is the right one to choose for a particular context, and that it has to be decided what fairness is a priori. Instead, our approach side-steps this problem; by identifying concrete fair or unfair instances, end-users are able to build up intuitive notions of fairness based explicitly in a given context.
It could be argued that it is not a good idea to involve end-users in fairness in the first place. Some might suggest that end-users are not technically savvy enough to make these decisions, or that fairness is a human right that should be universally and consistently applied (Kirkham 2020b). There is also evidence that end-users can be prone to bias (Wang et al. 2020b) and that their biases could be further replicated in AI. However, this ignores current practices where end-users have been effectively removed from any control over the ways that AI might impact them, and that instead algorithmic design is monopolised by a cadre of ML experts and data scientists. We see interactive human-in-the-loop fairness tools as providing back long-needed agency over AI decision-making to end-users.
To do so, we need to rethink the current AI development process, and particularly processes to ensure responsible AI. The need to directly involve end-users in assessing the fairness of AI systems and making ML models fairer has been emphasized (Binns et al. 2018; Dodge et al. 2019; Holstein et al. 2019; Veale et al. 2018; Yan et al. 2020a; Yu et al. 2020), and we believe our tool is a step in that direction. While end-users should not be the sole arbiters in developing fair AI, they might provide important input to other stakeholders in the development process. Further work is necessary to reconfigure responsible AI development processes and find suitable stages in which end-users’ feedback can be integrated. Recent research (Lee et al. 2019b) in algorithmic governance suggested a participatory approach to AI design, by building up individual AI belief models and collective aggregation. Our approach might have a place in this framework.
5.2. Integrating user feedback to fix fairness issues
Our prototype allowed end-users to make suggestions by changing the attribute weights. This helped in making the AI models fairer, using disparate impact as a fairness metric. Of course, as we pointed out earlier, this might not be the appropriate fairness metric to apply. Further work is needed to investigate how the participants’ feedback would fare using other fairness metrics, including the end-users’ own criteria.
Our work indicates that it is possible to improve fairness of an AI model using the suggestions that end-users give. Previous work in interactive machine learning (Kulesza et al. 2015; Stumpf et al. 2009; Fiebrink et al. 2011) has already highlighted the value of incorporating user feedback in improving the accuracy of AI models, however, allowing end-users to directly influence the fairness of an AI system has not received much consideration. Our work showed that across all users, changes to weights improved the fairness of the AI model. However, we also noted that some user input could make fairness worse. This is obviously a concern for human-in-the-loop learning as it is only as good as the input the end-user provides. Ideally, mechanisms will be developed to assess whether end-users give good feedback, or guard against incorporating bad input.
There are possible other ways to incorporate user feedback into these models (Yan et al. 2020a). For example, end-users could be allowed to change the predicted labels and train new models based on this adjustment. While is a direct way of obtaining user feedback, there is a risk that resulting models might not be fairer than previous versions as machine learning methods might not overcome inductive bias by incorporating only a few training examples. Another way is to introduce causal graphs into model development and provide end-users the ability to change causal relationships between attributes. This approach might be more suitable as it also lets end-users understand the detailed mechanisms of machine learning and provide feedback at the same time. Last, showing the impact of adjusting weights to end-users through fairness metrics might make their feedback more effective.
5.3. Cultural dimensions
To our knowledge, cultural dimensions in AI fairness assessment have not been considered, especially applied to the credit scoring or loan application domain. Our results showed that cultural dimensions can explain differences in perceiving, assessing and improving fairness. We found that especially High Masculinity, High Uncertainty Avoidance, and Low Indulgence matter in whether application decisions were assessed as unfair, and also making the AI system fairer.
This has important implications for understanding the contextual nature of fairness. What our results suggest is that fairness perceptions could change based on geographic location, as they underlie cultural dimensions. For example, end-users from countries such as Portugal (UA-H: 104, IDG-L: 33) and Sweden (UA-L: 29, IDG-H: 78) might make very different fairness assessments to each other due to their different respective Masculinity and Indulgence values; based on what we found, Portugese people might judge applications as unfairer than Swedes. However, currently we do not have enough data to confirm this and further studies would be needed to investigate whether there are indeed differences due to relatively small geographical distances.
Our findings on cultural dimensions have implications for the research, design and use of tools that involve end-users in fairness assessments. Our work cautions against conducting research in AI fairness with restricted user populations. In particular, studies in AI fairness should be extended to include non-WEIRD (Western, Educated, Industrialized, Rich, Democratic) participants (Henrich et al. 2010). In terms of design, tools such as ours seem to be usable universally across different cultures. However, they will be used in different ways to express nuanced perceptions of fairness with respect to cultural dimensions. This still begs the question of what to do once these nuanced notions of fairness have been be ’harvested’. We believe it might be possible to develop fair AI models by analyzing and considering these culturally dependent perspectives (and possibly counteract them) in the AI development process.
Our results also extend our understanding of Hofstede’s framework of cultural dimensions. We saw in our studies that there were combinations of cultural dimensions that appeared again and again in our findings. This could be explained by how Hofstede’s framework was developed: Indulgence was developed relatively recently by refining the Long Term Orientation dimension, while Power Distance might be correlated with Masculinity (Hofstede 2011). We look forward to future research to clarify how cultural dimensions might be related. With more data, our understanding of patterns of cultural differences and their impact on fairness assessments could also be refined.
5.4. Limitations
It could be argued that we are conflating debugging, debiasing, and mitigation. We agree that there are subtle but significant differences between these terms. In our view, explanatory debugging underpins the work of individual end-users to find and fix issues, in this case loan application decisions, that run counter to their expectations of fairness. However, this might not systematically expose or rectify bias in the AI model or the data. In addition, there are a number of ways that fairness issues can be robustly mitigated. As we described in section 2.2, there are a number of different mitigation approaches that have been proposed, based on quantitative fairness metrics. Our work has only investigated one technique of mitigation, by using weight adjustments of features, based on subjective user input.
While our prototype allowed interaction by end-users with the AI model to understand how it functioned, it was not a fully interactive ML system. Interactive ML relies on a tight cycle of user-system interaction, where user feedback is integrated into the AI model online, and any changes in the model are communicated back to the user immediately. In our prototype, we used user input on weight changes in an offline experiment, and thus we were not able to show the effects of model updates to end-users. Thus, we were also not able to follow all Explanatory Principles which might have affected the best use of the prototype, and give appropriate fairness assessments.
We were heavily influenced by Hofstede’s work on cultural dimensions. As already mentioned in section 2.4, this framework is not universally accepted, and researchers have instead opted for other kinds of analyses, including country-based comparisons. We believe that cross-cultural studies such as ours are still useful because they draw out similarities and differences in cultural interpretations, rather than geographic locations. While we have focused on cultural aspects across countries, we acknowledge that our participants came mainly from the European region. A larger, more geographically diverse sample would add further validity to our results.
Our work has investigated fairness in loan applications but there are other domains which our work could be applied to. For example, our prototype could be instantiated for recidivism or medical decision-making, and further studies could extend our understanding of fairness assessments in those domains.
5.5. Future Work
Our work showed that AI transparency is very important and intricately entwined with AI fairness. Unless a user can understand how a model works, it will be difficult to assess its fairness. Our results show that end-users were able to understand the model, the attributes, the weights, decision boundaries, confidence, and similarity, if communicated appropriately. However, it has been argued previously that different explanations are needed for end-users, business stakeholders, regulatory bodies, or data scientists (Gunning et al. 2019). It is still an open research question how to design appropriate interfaces to different stakeholders so that are understandable and usable to assess fairness.
We also anticipate that our prototype’s functionality could be improved to support fairness assessments. For example, there might be a need to extend comparisons of groups of applications, or to show casual graphs of attributes (Yan et al. 2020a). We look forward to further studies that improve the design of interactive human-in-the-loop fairness tools.
Additionally, we recognize that the feedback from end-users might change if there are other constraints on loan decisions, for example, if there is only a fixed amount that can be lent to customers, or that only a certain number of people can be loaned money from the bank. In such situations, end-users may judge fairness based on other attributes about who ’deserves’ the loan, perhaps involving loan amount or sensitive attributes. We hope that there will be further research to extend the knowledge on fairness in these situations.
6. Conclusion
In this paper, we have presented an interactive human-in-the-loop prototype that supports end-users in assessing the fairness of an AI system that makes loan decisions, and allows them to feedback changes to the AI model. We employed this prototype in an online study to investigate its use and effects on improving fairness. We paid attention to any cultural aspects in how end-users interacted with the prototype. We found that:
- •
End-users assessed fairness using model and attribute information, such as confidence, weights, and attribute values, and by investigating and comparing individual applications using graphical means.
- •
Our prototype allowed them to make suggestions by changing the attribute weights. This helped in making the AI models fairer.
- •
We found that cultural differences explained differences in assessing and improving fairness. The cultural dimensions that seemed to matter most were Masculinity, Uncertainty Avoidance and Indulgence.
Our work suggests future research avenues to study how humans can be involved in fairness. The results we presented form a significant step toward designing for deeper involvement of end-users in AI fairness.
References
- (1)
- Adebayo (2016) Julius A. Adebayo. 2016. FairML: ToolBox for Diagnosing Bias in Predictive Modeling. Master’s thesis. Massachusetts Institute of Technology.
- Aggarwal et al. (2019) Aniya Aggarwal, Pranay Lohia, Seema Nagar, Kuntal Dey, and Diptikalyan Saha. 2019. Black box fairness testing of machine learning models. In Proceedings of the 2019 27th ACM Joint Meeting on European Software Engineering Conference and Symposium on the Foundations of Software Engineering (ESEC/FSE 2019). Association for Computing Machinery, New York, NY, USA, 625–635. https://doi.org/10.1145/3338906.3338937
- Ahn and Lin (2019) Yongsu Ahn and Yu-Ru Lin. 2019. FairSight: Visual Analytics for Fairness in Decision Making. IEEE Transactions on Visualization and Computer Graphics (2019), 1–1. https://doi.org/10.1109/TVCG.2019.2934262
- Araujo et al. (2020) Theo Araujo, Natali Helberger, Sanne Kruikemeier, and Claes H De Vreese. 2020. In AI we trust? Perceptions about automated decision-making by artificial intelligence. AI & SOCIETY 35, 3 (2020), 611–623.
- Ballard et al. (2019) Stephanie Ballard, Karen M. Chappell, and Kristen Kennedy. 2019. Judgment Call the Game: Using Value Sensitive Design and Design Fiction to Surface Ethical Concerns Related to Technology. In Proceedings of the 2019 on Designing Interactive Systems Conference (San Diego, CA, USA) (DIS ’19). Association for Computing Machinery, New York, NY, USA, 421–433. https://doi.org/10.1145/3322276.3323697
- Barocas and Selbst (2016) Solon Barocas and Andrew D. Selbst. 2016. Big Data’s Disparate Impact. California Law Review 104, 3 (2016), 671–732. http://www.jstor.org/stable/24758720
- Bellamy et al. (2019) R. K. E. Bellamy, K. Dey, M. Hind, S. C. Hoffman, S. Houde, K. Kannan, P. Lohia, J. Martino, S. Mehta, A. Mojsilović, S. Nagar, K. N. Ramamurthy, J. Richards, D. Saha, P. Sattigeri, M. Singh, K. R. Varshney, and Y. Zhang. 2019. AI Fairness 360: An extensible toolkit for detecting and mitigating algorithmic bias. IBM Journal of Research and Development 63, 4/5 (2019), 4:1–4:15.
- Bellotti and Edwards (2001) Victoria Bellotti and Keith Edwards. 2001. Intelligibility and Accountability: Human Considerations in Context-aware Systems. Hum.-Comput. Interact. 16, 2 (Dec. 2001), 193–212. https://doi.org/10.1207/S15327051HCI16234_05
- Binns (2020) Reuben Binns. 2020. On the Apparent Conflict between Individual and Group Fairness. In Proceedings of the 2020 Conference on Fairness, Accountability, and Transparency (Barcelona, Spain) (FAT* ’20). Association for Computing Machinery, New York, NY, USA, 514–524. https://doi.org/10.1145/3351095.3372864
- Binns et al. (2018) Reuben Binns, Max Van Kleek, Michael Veale, Ulrik Lyngs, Jun Zhao, and Nigel Shadbolt. 2018. ’It’s Reducing a Human Being to a Percentage’: Perceptions of Justice in Algorithmic Decisions. In Proceedings of the 2018 CHI Conference on Human Factors in Computing Systems (CHI ’18). Association for Computing Machinery, Montreal QC, Canada, 1–14. https://doi.org/10.1145/3173574.3173951
- Blake et al. (2015) P. R. Blake, K. McAuliffe, J. Corbit, T. C. Callaghan, O. Barry, A. Bowie, L. Kleutsch, K. L. Kramer, E. Ross, H. Vongsachang, R. Wrangham, and F. Warneken. 2015. The ontogeny of fairness in seven societies. Nature 528 (November 2015), 258–261. https://doi.org/10.1038/nature15703
- Bolton et al. (2010) Lisa E. Bolton, Hean Tat Keh, and Joseph W. Alba. 2010. How Do Price Fairness Perceptions Differ across Culture? Journal of Marketing Research 47, 3 (2010), 564–576. https://doi.org/10.1509/jmkr.47.3.564
- Braun and Clarke (2006) Virginia Braun and Victoria Clarke. 2006. Using thematic analysis in psychology. Qualitative Research in Psychology 3, 2 (2006), 77–101. https://doi.org/10.1191/1478088706qp063oa
- Buçinca et al. (2020) Zana Buçinca, Phoebe Lin, Krzysztof Z. Gajos, and Elena L. Glassman. 2020. Proxy Tasks and Subjective Measures Can Be Misleading in Evaluating Explainable AI Systems. In Proceedings of the 25th International Conference on Intelligent User Interfaces (Cagliari, Italy) (IUI ’20). Association for Computing Machinery, New York, NY, USA, 454–464. https://doi.org/10.1145/3377325.3377498
- Bussone et al. (2015) A. Bussone, S. Stumpf, and D. O’Sullivan. 2015. The Role of Explanations on Trust and Reliance in Clinical Decision Support Systems. In 2015 International Conference on Healthcare Informatics. 160–169. https://doi.org/10.1109/ICHI.2015.26
- Cabrera et al. (2019) Á. A. Cabrera, W. Epperson, F. Hohman, M. Kahng, J. Morgenstern, and D. H. Chau. 2019. FAIRVIS: Visual Analytics for Discovering Intersectional Bias in Machine Learning. In 2019 IEEE Conference on Visual Analytics Science and Technology (VAST). 46–56.
- Cai et al. (2019) Carrie J. Cai, Emily Reif, Narayan Hegde, Jason Hipp, Been Kim, Daniel Smilkov, Martin Wattenberg, Fernanda Viegas, Greg S. Corrado, Martin C. Stumpe, and Michael Terry. 2019. Human-Centered Tools for Coping with Imperfect Algorithms During Medical Decision-Making. In Proceedings of the 2019 CHI Conference on Human Factors in Computing Systems (Glasgow, Scotland Uk) (CHI ’19). Association for Computing Machinery, New York, NY, USA, 1–14. https://doi.org/10.1145/3290605.3300234
- Choi et al. (2005) Boreum Choi, Inseong Lee, Jinwoo Kim, and Yunsuk Jeon. 2005. A Qualitative Cross-National Study of Cultural Influences on Mobile Data Service Design. In Proceedings of the SIGCHI Conference on Human Factors in Computing Systems (Portland, Oregon, USA) (CHI ’05). Association for Computing Machinery, New York, NY, USA, 661–670. https://doi.org/10.1145/1054972.1055064
- Chouldechova and Roth (2020) Alexandra Chouldechova and Aaron Roth. 2020. A Snapshot of the Frontiers of Fairness in Machine Learning. Commun. ACM 63, 5 (April 2020), 82–89. https://doi.org/10.1145/3376898
- Chromik et al. (2021) Michael Chromik, Malin Eiband, Felicitas Buchner, Adrian Krüger, and Andreas Butz. 2021. I Think I Get Your Point, AI! The Illusion of Explanatory Depth in Explainable AI. In 26th International Conference on Intelligent User Interfaces (College Station, TX, USA) (IUI ’21). Association for Computing Machinery, New York, NY, USA, 307–317. https://doi.org/10.1145/3397481.3450644
- Dodge et al. (2019) Jonathan Dodge, Q. Vera Liao, Yunfeng Zhang, Rachel K. E. Bellamy, and Casey Dugan. 2019. Explaining Models: An Empirical Study of How Explanations Impact Fairness Judgment. In Proceedings of the 24th International Conference on Intelligent User Interfaces (IUI ’19). ACM, New York, NY, USA, 275–285. https://doi.org/10.1145/3301275.3302310 event-place: Marina del Ray, California.
- Doshi-Velez and Kim (2017) Finale Doshi-Velez and Been Kim. 2017. Towards a rigorous science of interpretable machine learning. arXiv preprint arXiv:1702.08608 (2017).
- Eiband et al. (2018) Malin Eiband, Hanna Schneider, Mark Bilandzic, Julian Fazekas-Con, Mareike Haug, and Heinrich Hussmann. 2018. Bringing Transparency Design into Practice. In 23rd International Conference on Intelligent User Interfaces (IUI ’18). ACM, New York, NY, USA, 211–223. https://doi.org/10.1145/3172944.3172961
- Feldman et al. (2015) Michael Feldman, Sorelle A. Friedler, John Moeller, Carlos Scheidegger, and Suresh Venkatasubramanian. 2015. Certifying and Removing Disparate Impact. In Proceedings of the 21th ACM SIGKDD International Conference on Knowledge Discovery and Data Mining (Sydney, NSW, Australia) (KDD ’15). Association for Computing Machinery, New York, NY, USA, 259–268. https://doi.org/10.1145/2783258.2783311
- Fiebrink et al. (2011) Rebecca Fiebrink, Perry R. Cook, and Dan Trueman. 2011. Human Model Evaluation in Interactive Supervised Learning. In Proceedings of the SIGCHI Conference on Human Factors in Computing Systems (CHI ’11). ACM, New York, NY, USA, 147–156. https://doi.org/10.1145/1978942.1978965 event-place: Vancouver, BC, Canada.
- Friedler et al. (2019) Sorelle A. Friedler, Carlos Scheidegger, Suresh Venkatasubramanian, Sonam Choudhary, Evan P. Hamilton, and Derek Roth. 2019. A comparative study of fairness-enhancing interventions in machine learning. In Proceedings of the Conference on Fairness, Accountability, and Transparency (FAT* ’19). Association for Computing Machinery, New York, NY, USA, 329–338. https://doi.org/10.1145/3287560.3287589
- Galhotra et al. (2017) Sainyam Galhotra, Yuriy Brun, and Alexandra Meliou. 2017. Fairness Testing: Testing Software for Discrimination. In Proceedings of the 2017 11th Joint Meeting on Foundations of Software Engineering (ESEC/FSE 2017). ACM, New York, NY, USA, 498–510. https://doi.org/10.1145/3106237.3106277 event-place: Paderborn, Germany.
- Geiger and Meek (2005) Dan Geiger and Christopher Meek. 2005. Structured Variational Inference Procedures and their Realizations (as incol). In Proceedings of Tenth International Workshop on Artificial Intelligence and Statistics, The Barbados. The Society for Artificial Intelligence and Statistics.
- Green and Chen (2019) Ben Green and Yiling Chen. 2019. The Principles and Limits of Algorithm-in-the-Loop Decision Making. Proc. ACM Hum.-Comput. Interact. 3, CSCW, Article 50 (Nov. 2019), 24 pages. https://doi.org/10.1145/3359152
- Groce et al. (2014) Alex Groce, Todd Kulesza, Chaoqiang Zhang, Shalini Shamasunder, Margaret Burnett, Weng-Keen Wong, Simone Stumpf, Shubhomoy Das, Amber Shinsel, Forrest Bice, and Kevin McIntosh. 2014. You Are the Only Possible Oracle: Effective Test Selection for End Users of Interactive Machine Learning Systems. IEEE Transactions on Software Engineering 40, 3 (March 2014), 307–323. https://doi.org/10.1109/TSE.2013.59
- Gunning et al. (2019) David Gunning, Mark Stefik, Jaesik Choi, Timothy Miller, Simone Stumpf, and Guang-Zhong Yang. 2019. XAI—Explainable artificial intelligence. Science Robotics 4, 37 (Dec. 2019). https://doi.org/10.1126/scirobotics.aay7120
- Hall (1976) Edward Twitchell Hall. 1976. Beyond culture. Anchor.
- Hart and Staveland (1988) Sandra G. Hart and Lowell E. Staveland. 1988. Development of NASA-TLX (Task Load Index): Results of Empirical and Theoretical Research. In Advances in Psychology, Peter A. Hancock and Najmedin Meshkati (Ed.). Human Mental Workload, Vol. Volume 52. North-Holland, 139–183. http://www.sciencedirect.com/science/article/pii/S0166411508623869
- Henrich et al. (2010) Joseph Henrich, Steven J Heine, and Ara Norenzayan. 2010. Most people are not WEIRD. Nature 466, 7302 (2010), 29–29.
- Hoffman et al. (2018) Robert R. Hoffman, Shane T. Mueller, Gary Klein, and Jordan Litman. 2018. Metrics for Explainable AI: Challenges and Prospects. arXiv:1812.04608 [cs] (Dec. 2018). http://arxiv.org/abs/1812.04608 arXiv: 1812.04608.
- Hofstede (2002) Geert Hofstede. 2002. Dimensions do not exist: A reply to Brendan McSweeney. Human relations 55, 11 (2002), 1355–1361.
- Hofstede (2011) Geert Hofstede. 2011. Dimensionalizing cultures: The Hofstede model in context. Online readings in psychology and culture 2, 1 (2011), 2307–0919.
- Hofstede et al. (2010) Geert Hofstede, Gert Jan Hofstede, and Michael Minkov. 2010. Cultures and organizations: Software of the mind. Vol. 3. Mcgraw-hill New York.
- Hofstede and Minkov (2010) Geert Hofstede and Michael Minkov. 2010. Long- versus short-term orientation: new perspectives. Asia Pacific Business Review 16, 4 (2010), 493–504. https://doi.org/10.1080/13602381003637609 arXiv:https://doi.org/10.1080/13602381003637609
- Holstein et al. (2019) Kenneth Holstein, Jennifer Wortman Vaughan, Hal Daumé, Miro Dudik, and Hanna Wallach. 2019. Improving Fairness in Machine Learning Systems: What Do Industry Practitioners Need?. In Proceedings of the 2019 CHI Conference on Human Factors in Computing Systems (CHI ’19). Association for Computing Machinery, New York, NY, USA, 1–16. https://doi.org/10.1145/3290605.3300830
- Jr. et al. (2020) Lionel P. Robert Jr., Gaurav Bansal, and Christoph Lütge. 2020. ICIS 2019 SIGHCI Workshop Panel Report: Human– Computer Interaction Challenges and Opportunities for Fair, Trustworthy and Ethical Artificial Intelligence. AIS Transactions on Human-Computer Interaction 12, 2 (2020), 96–108.
- Kim and Leung (2007) Tae-Yeol Kim and Kwok Leung. 2007. Forming and reacting to overall fairness: A cross-cultural comparison. Organizational Behavior and Human Decision Processes 104, 1 (2007), 83 – 95. https://doi.org/10.1016/j.obhdp.2007.01.004
- Kirkham (2020a) Reuben Kirkham. 2020a. Using European Human Rights Jurisprudence for Incorporating Values into Design. Association for Computing Machinery, New York, NY, USA, 115–128. https://doi.org/10.1145/3357236.3395539
- Kirkham (2020b) Reuben Kirkham. 2020b. Using European Human Rights Jurisprudence for Incorporating Values into Design. In Proceedings of the 2020 ACM Designing Interactive Systems Conference. Association for Computing Machinery, New York, NY, USA, 115–128. https://doi.org/10.1145/3357236.3395539
- Kirkpatrick (2016) Keith Kirkpatrick. 2016. Battling Algorithmic Bias: How Do We Ensure Algorithms Treat Us Fairly? Commun. ACM 59, 10 (Sept. 2016), 16–17. https://doi.org/10.1145/2983270
- Kulesza et al. (2015) Todd Kulesza, Margaret Burnett, Weng-Keen Wong, and Simone Stumpf. 2015. Principles of Explanatory Debugging to Personalize Interactive Machine Learning. In Proceedings of the 20th International Conference on Intelligent User Interfaces (IUI ’15). ACM, New York, NY, USA, 126–137. https://doi.org/10.1145/2678025.2701399
- Kulesza et al. (2012) Todd Kulesza, Simone Stumpf, Margaret Burnett, and Irwin Kwan. 2012. Tell me more?: the effects of mental model soundness on personalizing an intelligent agent. In Proceedings of the 2012 ACM annual conference on Human Factors in Computing Systems (CHI ’12). ACM, New York, NY, USA, 1–10. https://doi.org/10.1145/2207676.2207678
- Kulesza et al. (2010) Todd Kulesza, Simone Stumpf, Margaret Burnett, Weng-Keen Wong, Yann Riche, Travis Moore, Ian Oberst, Amber Shinsel, and Kevin McIntosh. 2010. Explanatory Debugging: Supporting End-User Debugging of Machine-Learned Programs. In Proceedings of the 2010 IEEE Symposium on Visual Languages and Human-Centric Computing (VLHCC ’10). IEEE Computer Society, Washington, DC, USA, 41–48. https://doi.org/10.1109/VLHCC.2010.15
- Kulesza et al. (2013) T. Kulesza, S. Stumpf, M. Burnett, S. Yang, I. Kwan, and W. Wong. 2013. Too much, too little, or just right? Ways explanations impact end users’ mental models. In 2013 IEEE Symposium on Visual Languages and Human Centric Computing. 3–10. https://doi.org/10.1109/VLHCC.2013.6645235
- Kulesza et al. (2009) Todd Kulesza, Weng-Keen Wong, Simone Stumpf, Stephen Perona, Rachel White, Margaret M. Burnett, Ian Oberst, and Andrew J. Ko. 2009. Fixing the program my computer learned: barriers for end users, challenges for the machine. In Proceedings of the 13th international conference on Intelligent user interfaces. ACM, Sanibel Island, Florida, USA, 187–196. https://doi.org/10.1145/1502650.1502678
- Lee (2018) Min Kyung Lee. 2018. Understanding perception of algorithmic decisions: Fairness, trust, and emotion in response to algorithmic management. Big Data & Society 5, 1 (2018), 2053951718756684. https://doi.org/10.1177/2053951718756684 arXiv:https://doi.org/10.1177/2053951718756684
- Lee et al. (2019a) Min Kyung Lee, Anuraag Jain, Hea Jin Cha, Shashank Ojha, and Daniel Kusbit. 2019a. Procedural Justice in Algorithmic Fairness: Leveraging Transparency and Outcome Control for Fair Algorithmic Mediation. Proc. ACM Hum.-Comput. Interact. 3, CSCW, Article 182 (Nov. 2019), 26 pages. https://doi.org/10.1145/3359284
- Lee et al. (2019b) Min Kyung Lee, Daniel Kusbit, Anson Kahng, Ji Tae Kim, Xinran Yuan, Allissa Chan, Daniel See, Ritesh Noothigattu, Siheon Lee, Alexandros Psomas, and Ariel D. Procaccia. 2019b. WeBuildAI: Participatory Framework for Algorithmic Governance. Proc. ACM Hum.-Comput. Interact. 3, CSCW, Article 181 (Nov. 2019), 35 pages. https://doi.org/10.1145/3359283
- Leung (2008) Kwok Leung. 2008. How Generalizable Are Justice Effects Across Cultures? In Handbook of Organizational Justice, Jerald Greenberg and Jason A. Colquitt (Eds.). Psychology Press, New York, NY, USA, 555–586. https://psycnet.apa.org/record/2005-03594-021
- Lim et al. (2009) Brian Y. Lim, Anind K. Dey, and Daniel Avrahami. 2009. Why and why not explanations improve the intelligibility of context-aware intelligent systems. In Proceedings of the 27th international conference on Human factors in computing systems (CHI ’09). ACM, New York, NY, USA, 2119–2128. https://doi.org/10.1145/1518701.1519023
- Mallari et al. (2020) Keri Mallari, Kori Inkpen, Paul Johns, Sarah Tan, Divya Ramesh, and Ece Kamar. 2020. Do I Look Like a Criminal? Examining How Race Presentation Impacts Human Judgement of Recidivism. In Proceedings of the 2020 CHI Conference on Human Factors in Computing Systems (Honolulu, HI, USA) (CHI ’20). Association for Computing Machinery, New York, NY, USA, 1–13. https://doi.org/10.1145/3313831.3376257
- Mattila and Choi (2006) Anna S. Mattila and Sunmee Choi. 2006. A cross-cultural comparison of perceived fairness and satisfaction in the context of hotel room pricing. International Journal of Hospitality Management 25, 1 (2006), 146 – 153. https://doi.org/10.1016/j.ijhm.2004.12.003
- McSweeney (2002) Brendan McSweeney. 2002. Hofstede’s Model of National Cultural Differences and their Consequences: A Triumph of Faith - a Failure of Analysis. Human Relations 55, 5 (2002), 89–118. https://doi.org/10.1177/0018726702551004
- Parsons and Shils (1951) Talcott Parsons and Edward Shils. 1951. Toward a general theory of action. Harvard University Press.
- Ribeiro et al. (2016) Marco Tulio Ribeiro, Sameer Singh, and Carlos Guestrin. 2016. "Why Should I Trust You?": Explaining the Predictions of Any Classifier. In Proceedings of the 22Nd ACM SIGKDD International Conference on Knowledge Discovery and Data Mining (KDD ’16). ACM, New York, NY, USA, 1135–1144. https://doi.org/10.1145/2939672.2939778
- Ross et al. (2010) Joel Ross, Lilly Irani, M. Six Silberman, Andrew Zaldivar, and Bill Tomlinson. 2010. Who are the crowdworkers? shifting demographics in mechanical turk. In CHI ’10 Extended Abstracts on Human Factors in Computing Systems (CHI EA ’10). Association for Computing Machinery, New York, NY, USA, 2863–2872. https://doi.org/10.1145/1753846.1753873
- Sanders and Stappers (2008) Elizabeth B.-N. Sanders and Pieter Jan Stappers. 2008. Co-creation and the new landscapes of design. CoDesign 4, 1 (March 2008), 5–18. https://doi.org/10.1080/15710880701875068
- Sawaya et al. (2017) Yukiko Sawaya, Mahmood Sharif, Nicolas Christin, Ayumu Kubota, Akihiro Nakarai, and Akira Yamada. 2017. Self-Confidence Trumps Knowledge: A Cross-Cultural Study of Security Behavior. In Proceedings of the 2017 CHI Conference on Human Factors in Computing Systems (Denver, Colorado, USA) (CHI ’17). Association for Computing Machinery, New York, NY, USA, 2202–2214. https://doi.org/10.1145/3025453.3025926
- Saxena et al. (2019) Nripsuta Ani Saxena, Karen Huang, Evan DeFilippis, Goran Radanovic, David C. Parkes, and Yang Liu. 2019. How Do Fairness Definitions Fare? Examining Public Attitudes Towards Algorithmic Definitions of Fairness. In Proceedings of the 2019 AAAI/ACM Conference on AI, Ethics, and Society (Honolulu, HI, USA) (AIES ’19). Association for Computing Machinery, New York, NY, USA, 99–106. https://doi.org/10.1145/3306618.3314248
- Silvernail (2016) Kirk D. Silvernail. 2016. Cross-Cultural Organizational Justice: When Are Fairness Perceptions Universal or Culturally Dependent? Ph.D. Dissertation. University of Massachusetts - Amherst, Massachusetts, The United States of America.
- Srivastava et al. (2019) Megha Srivastava, Hoda Heidari, and Andreas Krause. 2019. Mathematical Notions vs. Human Perception of Fairness: A Descriptive Approach to Fairness for Machine Learning. Association for Computing Machinery, New York, NY, USA, 2459–2468. https://doi.org/10.1145/3292500.3330664
- Stumpf et al. (2009) Simone Stumpf, Vidya Rajaram, Lida Li, Weng-Keen Wong, Margaret Burnett, Thomas Dietterich, Erin Sullivan, and Jonathan Herlocker. 2009. Interacting meaningfully with machine learning systems: Three experiments. Int. J. Hum.-Comput. Stud. 67, 8 (2009), 639–662. http://portal.acm.org/citation.cfm?id=1555106
- Stumpf et al. (2021) Simone Stumpf, Lorenzo Strappelli, Subeida Ahmed, Yuri Nakao, Aisha Naseer, Giulia Del Gamba, and Daniele Regoli. 2021. Design Methods for Artificial Intelligence Fairness and Transparency. In Joint Proceedings of the ACM IUI 2021 Workshops. CEUR.org, College Station, TX.
- Szymanski et al. (2021) Maxwell Szymanski, Martijn Millecamp, and Katrien Verbert. 2021. Visual, textual or hybrid: the effect of user expertise on different explanations. In IUI ’21: 26th International Conference on Intelligent User Interfaces, College Station, TX, USA, April 13-17, 2021, Tracy Hammond, Katrien Verbert, Dennis Parra, Bart P. Knijnenburg, John O’Donovan, and Paul Teale (Eds.). ACM, 109–119. https://doi.org/10.1145/3397481.3450662
- Veale et al. (2018) Michael Veale, Max Van Kleek, and Reuben Binns. 2018. Fairness and Accountability Design Needs for Algorithmic Support in High-Stakes Public Sector Decision-Making. In Proceedings of the 2018 CHI Conference on Human Factors in Computing Systems (CHI ’18). Association for Computing Machinery, Montreal QC, Canada, 1–14. https://doi.org/10.1145/3173574.3174014
- Verma and Rubin (2018) Sahil Verma and Julia Rubin. 2018. Fairness Definitions Explained. In 2018 IEEE/ACM International Workshop on Software Fairness (FairWare). 1–7. https://doi.org/10.23919/FAIRWARE.2018.8452913
- Wachter et al. (2020) Sandra Wachter, Brent Mittelstadt, and Chris Russell. 2020. Why fairness cannot be automated: Bridging the gap between EU non-discrimination law and AI. Available at SSRN (2020).
- Wang et al. (2019) Danding Wang, Qian Yang, Ashraf Abdul, and Brian Y. Lim. 2019. Designing Theory-Driven User-Centric Explainable AI. In Proceedings of the 2019 CHI Conference on Human Factors in Computing Systems (CHI ’19). ACM, New York, NY, USA, 601:1–601:15. https://doi.org/10.1145/3290605.3300831 event-place: Glasgow, Scotland Uk.
- Wang et al. (2020a) Ruotong Wang, F. Maxwell Harper, and Haiyi Zhu. 2020a. Factors Influencing Perceived Fairness in Algorithmic Decision-Making: Algorithm Outcomes, Development Procedures, and Individual Differences. In Proceedings of the 2020 CHI Conference on Human Factors in Computing Systems (Honolulu, HI, USA) (CHI ’20). Association for Computing Machinery, New York, NY, USA, 1–14. https://doi.org/10.1145/3313831.3376813
- Wang et al. (2020b) Ruotong Wang, F. Maxwell Harper, and Haiyi Zhu. 2020b. Factors Influencing Perceived Fairness in Algorithmic Decision-Making: Algorithm Outcomes, Development Procedures, and Individual Differences. In Proceedings of the 2020 CHI Conference on Human Factors in Computing Systems (CHI ’20). Association for Computing Machinery, New York, NY, USA, 1–14. https://doi.org/10.1145/3313831.3376813
- Wexler et al. (2020) J. Wexler, M. Pushkarna, T. Bolukbasi, M. Wattenberg, F. Viégas, and J. Wilson. 2020. The What-If Tool: Interactive Probing of Machine Learning Models. IEEE Transactions on Visualization and Computer Graphics 26, 1 (2020), 56–65.
- Woodruff et al. (2018) Allison Woodruff, Sarah E. Fox, Steven Rousso-Schindler, and Jeffrey Warshaw. 2018. A Qualitative Exploration of Perceptions of Algorithmic Fairness. In Proceedings of the 2018 CHI Conference on Human Factors in Computing Systems (CHI ’18). Association for Computing Machinery, Montreal QC, Canada, 1–14. https://doi.org/10.1145/3173574.3174230
- Wouters et al. (2019) Niels Wouters, Ryan Kelly, Eduardo Velloso, Katrin Wolf, Hasan Shahid Ferdous, Joshua Newn, Zaher Joukhadar, and Frank Vetere. 2019. Biometric Mirror: Exploring Ethical Opinions towards Facial Analysis and Automated Decision-Making. In Proceedings of the 2019 on Designing Interactive Systems Conference (San Diego, CA, USA) (DIS ’19). Association for Computing Machinery, New York, NY, USA, 447–461. https://doi.org/10.1145/3322276.3322304
- Yan et al. (2020a) Jing Nathan Yan, Ziwei Gu, Hubert Lin, and Jeffrey M. Rzeszotarski. 2020a. Silva: Interactively Assessing Machine Learning Fairness Using Causality. In Proceedings of the 2020 CHI Conference on Human Factors in Computing Systems (CHI ’20). Association for Computing Machinery, New York, NY, USA, 1–13. https://doi.org/10.1145/3313831.3376447
- Yan et al. (2020b) Jing Nathan Yan, Ziwei Gu, Hubert Lin, and Jeffrey M. Rzeszotarski. 2020b. Silva: Interactively Assessing Machine Learning Fairness Using Causality. In Proceedings of the 2020 CHI Conference on Human Factors in Computing Systems (Honolulu, HI, USA) (CHI ’20). Association for Computing Machinery, New York, NY, USA, 1–13. https://doi.org/10.1145/3313831.3376447
- Yu et al. (2020) Bowen Yu, Ye Yuan, Loren Terveen, Zhiwei Steven Wu, Jodi Forlizzi, and Haiyi Zhu. 2020. Keeping Designers in the Loop: Communicating Inherent Algorithmic Trade-Offs Across Multiple Objectives. Association for Computing Machinery, New York, NY, USA, 1245–1257. https://doi.org/10.1145/3357236.3395528
- Zhang et al. (2020) Yunfeng Zhang, Rachel Bellamy, and Kush Varshney. 2020. Joint Optimization of AI Fairness and Utility: A Human-Centered Approach. In Proceedings of the AAAI/ACM Conference on AI, Ethics, and Society (New York, NY, USA) (AIES ’20). Association for Computing Machinery, New York, NY, USA, 400–406. https://doi.org/10.1145/3375627.3375862