MANIQA: Multi-dimension Attention Network for No-Reference
Image Quality Assessment
Abstract
No-Reference Image Quality Assessment (NR-IQA) aims to assess the perceptual quality of images in accordance with human subjective perception. Unfortunately, existing NR-IQA methods are far from meeting the needs of predicting accurate quality scores on GAN-based distortion images. To this end, we propose Multi-dimension Attention Network for no-reference Image Quality Assessment (MANIQA) to improve the performance on GAN-based distortion. We firstly extract features via ViT, then to strengthen global and local interactions, we propose the Transposed Attention Block (TAB) and the Scale Swin Transformer Block (SSTB). These two modules apply attention mechanisms across the channel and spatial dimension, respectively. In this multi-dimensional manner, the modules cooperatively increase the interaction among different regions of images globally and locally. Finally, a dual branch structure for patch-weighted quality prediction is applied to predict the final score depending on the weight of each patch’s score. Experimental results demonstrate that MANIQA outperforms state-of-the-art methods on four standard datasets (LIVE, TID2013, CSIQ, and KADID-10K) by a large margin. Besides, our method ranked first place in the final testing phase of the NTIRE 2022 Perceptual Image Quality Assessment Challenge Track 2: No-Reference. Codes and models are available at https://github.com/IIGROUP/MANIQA.
1 Introduction
Pristine-quality images could be degraded in any stage of the whole circulation, from acquisition, compression, storage, transmissionzhu2020metaiqa to restoration by GAN-based algorithmsgoodfellow2014generative; wang2018esrgan, which results in the loss of received visual information. These low-quality (LQ) images have adverse impacts on society. On the one hand, billions of photos are uploaded and shared on social media platforms such as Facebook, Instagram, etc, which means that LQ images could badly affect the user’s visual feelings. On the other hand, for the sake of security, LQ images sometimes impede the normal running of autonomous vehicleslou2019veri; chiu2020assessing. For these reasons, predicting the perceptual image quality accurately is crucial for industries and daily life.golestaneh2022no.
In general, objective quality metrics can be divided into full-reference (FR-IQA) and no-reference (NR-IQA) methods, according to the availability of reference imageswang2006modern. Previous general-purpose NR-IQA methods focus on quality assessment for distorted synthetic (e.g., Blur, JPEG, Noise) and authentic images (e.g., poor lighting conditions, sensor limitations)saad2012blind; mittal2012no; zhang2015feature. However, with the extensive application of GAN-based image restoration (IR) algorithms, although these methods can maintain consistency with human subjective evaluation in synthetic or authentic datasets, they show limitations when assessing the images generated by GAN-based IR algorithmsjinjin2020pipal. In this regard, Gu et al. jinjin2020pipal proposed an IQA benchmark including proportioned GAN-based distorted images and previously proposed NR-IQA methods which have shown, as could be expected, unsatisfying performance on the datasetGu_2021_CVPR. This gap stems from the inconformity of the Human Visual System and machine vision. Users mostly expect rich and realistic details while the machines focus on distinguishing the misalignment of degraded images and pristine-quality images. Specifically, the restored images often possess unreal lifelike textures that satisfy the human eyes’ perception but deviate from the prior knowledge learned by deep-learning models for IQA.
Considering the deficient methods for rating GAN-based distorted images, we propose the Multi-dimension Attention Network for no-reference Image Quality Assessment (MANIQA). The proposed method consists of four components: feature extractor using ViTdosovitskiy2020image, transposed attention block, scale swin transformer block, and a dual branch structure for patch-weighted quality prediction. We first extract and concatenate 4 layers’ features from ViT, then compute the weights of different channels through the proposed Transposed Attention Block (TAB). We apply self-attention (SA) algorithm across channel rather than the spatial dimension to compute cross-covariance across channels to generate an attention map in this module. Two advantages are provided by this module. First, 4 layers’ features from ViT contain different information in channels about the input image. TAB rearranges channels’ weight in terms of their importance to perceptual quality score. Second, the attention map generated by this block encodes the global context implicitlyzamir2021restormer, which is complementary to downstream local interaction. To strengthen the local interaction among patches of an image, the Scale Swin Transformer Block (SSTB) is applied. For stabilizing the training process, a scale factor is applied to adjust the residuals. These two modules (TAB and SSTB) apply attention mechanisms across the channel and spatial dimension, respectively. In this multi-dimensional manner, the modules cooperatively increase the interaction among different regions of images globally and locally. Finally, a dual branch structure consists of weighting and scoring branches for each patch’s importance and quality prediction is proposed to attain the final score of images. We assume the salient subjects which mostly in the center of images are noticeable for Human Visual System but not always high-quality. On account of the inconsistency of notable and high- quality regions, the final weighted maps balanced the difference of both via Hadamard Product.
To verify our method’s generalization, we have conducted experiments on the PIPAL and other four datasets (TID2013, LIVE, CSIQ, and KADID-10K). The results reveal the impressive performance of our proposed method. Our method outperforms state-of-the-art(SoTA) on all the above datasets by a large margin. Besides, our ensemble method ranked first place in the NTIRE 2022 Perceptual Image Quality Assessment Challenge Track 2: No-Reference (NTIRE 2022 NR-IQA Challenge) which indicates the effectiveness of handling GAN-based distortion of our model.

2 Related Work
No-Reference Image Quality Assessment. Unlike the full-reference (FR-IQA) methods, no-reference (NR-IQA) methods can only use low-quality (LQ) images as input to measure image quality without any reference directly. Previous general-purpose NR-IQA methods are mainly divided into natural scene statistics (NSS) based metrics saad2012blind; mittal2012making; zhang2015feature; moorthy2010two; moorthy2011blind; xu2016blind; ghadiyaram2017perceptual; gao2013universal and learning-based metrics ye2012no; ye2012unsupervised; ye2014beyond; zhang2014training; zhang2015som; ma2017dipiq. Based on the assumption for these hand-crafted feature-based approaches that the natural scene statistics (NSS) extracted from natural images are highly regular, the domain variation caused by synthetic distortions such as spatialmittal2012no; zhang2015feature; mittal2012making, gradientmittal2012no, discrete cosine transform (DCT)saad2012blind and waveletmoorthy2011blind, are detectable by these traditional methods. In contrast to synthetic distortions in which degradation processes are precisely specified and can be simulated in laboratory environments, authentic distortions collected in the wild have more types of complex distortions. However, the hand-crafted feature-based approaches performing well on type-specific distorted datasets have less ability to model real-world distortions. With the success of deep learning and Convolution Neural Network (CNN) in many computer vision tasks, CNN-based methods have significantly outperformed previous approaches in terms of real-world distortions by directly extracting discriminative features from LQ imageskang2014convolutional; bosse2017deep; lin2018hallucinated; talebi2018nima; ma2017end; zhang2018blind; bianco2018use; zhu2020metaiqa; su2020blindly; xia2020domain. kang2014convolutional; bosse2017deep; lin2018hallucinated; zhu2020metaiqa; su2020blindly leveraged the extracted features to predict the subjective score with the help of pre-trained CNN-based models. Hyper-IQAsu2020blindly separated the features into the low-level and high-level features and transformed the latter to redirect the former. Meta-IQAzhu2020metaiqa used meta-learning to train the network with separate distortion types for learning prior knowledge. Hallucinated-IQA lin2018hallucinated exploited the advantages of generative adversarial models. The model estimates the perceptual quality of images with reference images generated by a generative network.
IQA for GAN-based IR Algorithm. In recent years, GANgoodfellow2014generative has been widely used for restoring LQ images (e.g., deblur, denoise, super-resolution) and some works focus on measuring image restoration algorithms using IQA methodszheng2021learning; blau2018perception. On account of the mechanism of GAN, some unreal textures are lifelike, which are hard to distinguish by human eyes but easy for machines to perceiveqian2020thinking. Gu et al. jinjin2020pipal tested several existing algorithms and found algorithms’ tolerance toward spatial misalignment may be a key factor for their performances when assessing GAN-based images. In this light, we proposed a new model to handle the GAN-based distorted images in PIPAL.
Transformer for IQA. In recent years, CNNs have been the main backbone in most computer vision tasks, including FR-IQA and NR-IQA. Unfortunately, the internal disability of capturing non-local features and strong locality bias hinder the models to exploit the information across all regions of an image golestaneh2022no. Besides, the spatial translation invariance of shared convolution kernel weights makes CNNs powerless to handle complex combinations of features. Inspired by NLP, which applies Transformersvaswani2017attention to capture the global dependencies of features, great promotions in various computer vision tasks following the success of vision transformer(ViT)dosovitskiy2020image have been achieved. In IQA, IQT you2021transformer leveraged the reference and distortion image features extracted by CNNs as the input of Transformer for the quality prediction task. MUSIQ ke2021musiq used Transformer to encode 3 scales of distortion image features and settled the incompatibility of different input image sizes during training and testing. TReS applied relative ranking and self-consistency loss to utilize the rich self-supervisory information and reduce the sensitivity of the network. Different from these methods, we delve into the multi-dimension feature interaction and leverage the spatial and channel structure information to compute a non-local representation of the image. The results reveal that our method achieves best performance in five datasets.
Attention Mechanism. Attention mechanisms have been widely used in various computer vision tasks liu2017robust; vaswani2017attention; woo2018cbam; zamir2021restormer; cao2022vdtr. In NR-IQA, Yang et al. yang2019sgdnet proposed an end-to-end saliency-guided architecture and applied spatial and transposed attention to their model. Restormer zamir2021restormer applied attention mechanism in a new manner which interchanges the position of spatial and channel dimensions to reduce computation and implicitly fuse the global features. Inspired by this work, we proposed transposed attention block to capture the dependencies of features to attain weighted channel features of the input image.
3 Proposed Method
Our main goal is to develop a model that can handle multi-dimension information from the extracted image features. To use the information comprehensively from spatial and channel dimensions, we first present the overall pipeline of our MANIQA structure (see in Fig. 2). Then we describe the core components of the proposed model: (a) Transposed Attention Block(TAB), (b) Scale Swin Transformer Block(SSTB) and (c) a dual branch structure for patch-weighted quality prediction.
3.1 Overall Pipeline
Given a distorted image , where and denote height and width, our goal is to estimate its perceptual quality score. Let present the vision transformer(ViT)dosovitskiy2020image with learnable parameters , and denotes the features from the layer of ViT, where , denotes the batch size, and , , and denote the channel size, width, and height of the feature, respectively. We use 4 from the total 12 layers to extract features from different semantic degrees. Next we concatenate , where , and denote the output by .
Next, the transposed attention block is employed to boost the channel interaction among the extracted features. Then the feature will be sent to the scale swin transformer block to strengthen the interaction of the local information. More details of the two modules can refer to Sec. 3.2 and Sec. 3.3. The final feature map will be sent to the dual branch prediction module with the scoring branch and weighting branch. The final score can be computed by the multiplication of scores and weights of total patches as:
| (1) |
where N denotes the number of patches for one image.
3.2 Transposed Attention Block
Self-attention (SA) layer is vital for Transformervaswani2017attention. In conventional SAdosovitskiy2020image, the key-query dot-production interaction builds the global connection among patches in the spatial dimension. However, it ignores the rich information among different channels. To alleviate this issue, we propose Transposed Attention Block (TAB), shown in Fig. 3, which applies SA across channel rather than the spatial dimension to compute cross-covariance across channels to generate an attention map encoding the global context implicitly. From the concatenated feature , our TAB first generates query (Q), key (K) and value (V) projections, which are achieved by 3 independent linear projections, to encode the pixel-wise cross-channel context. Then, we reshape query and key projections such that their dot-product interaction generates a transposed-attention map A of size . Note that is numerically equal to . We remove the layer normalization and multi-layer perceptron from the original Transformervaswani2017attention. Overall, the TAB process is defined as:
| (2) | ||||
where indicates the spatial dimension of , and . As the dot-product is conducted across channel dimensions, we remove the layer normalization, which is used for pixel-wise channel-context normalization. Multi-layer perceptron in the original transformer blockvaswani2017attention is also removed in our proposed block as the increased complexity affects the generalization of the model. Two advantages are provided by this module. First, 4 layers’ features from ViT contain different information in channels about the input image. TAB rearranges channels’ weight in terms of their importance to perceptual quality score. Second, the attention map generated by the TAB encodes the global context implicitlyzamir2021restormer, which is complementary to downstream local interaction.
3.3 Scale Swin Transformer Block
As shown in Fig. 4, the Scale Swin Transformer Block consists of Swin Transformer Layers (STL)liu2021swin and a convolutional layer. Given the input feature , the SSTB first encodes the feature through 2 layers of STL:
| (3) |
where is the -th Swin Transformer layer in the -th stage of our block, . Then, a convolutional layer is applied before the residual connection. The output of SSTB is formulated as:
| (4) |
where is the Swin Transformer layer. denotes the scale factor of the output of STL. This design has two benefits. First, the convolutional layer with spatially invariant filters can enhance the translational equivarianceliang2021swinir. Second, the scale factor stabilizes the trainingszegedy2017inception through residual connection. In general we pick the constant between 0.1 and 0.2 to scale the residuals before adding them to the input.
3.4 Patch-weighted Quality Prediction
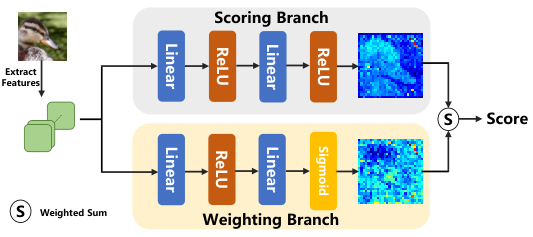
We designed a dual branch structure for patch-weighted quality prediction as shown in Fig. 5. This module consists of a scoring and weighting branch which predicts each patch’s score and weight respectively. Given the feature , we generate () and () projections, which are achieved by 2 independent linear projections. We believe the quality of an image is dependent on its different regions. So the final patch score of the distorted image is generated by multiplication of each patch’s score and weight, then the final score of the whole image is generated by the summation of final patch scores. In consideration of inhibiting the overfitting of the model, we believe the scoring and weighting branch create a mechanism of restraint. The final score has to take the balance of scoring and weighting branch into account.

4 Experiments
4.1 Datasets
PIPAL jinjin2020pipal is a recently proposed IQA dataset, which contains images processed by image restoration and enhancement methods (particularly the deep learning-based methods) besides the traditional distorting methods. The dataset contains 29k images in total, including 250 high-quality reference images, each of which has 116 distortions involving more than 1.13 million human judgments. It is challenging for existing metrics to predict perceptual quality accurately, especially the images generated by GAN-based IR methods. PIPAL is used for both the training and evaluation of the model, and we also conduct the experiments on LIVEsheikh2006statistical, CSIQlarson2010most, TID2013ponomarenko2015image and KADID-10Klin2019kadid. Tab. 2 shows the summary of the datasets that are used in our experiment.
| LIVE | CSIQ | TID2013 | KADID-10K | |||||
|---|---|---|---|---|---|---|---|---|
| PLCC | SROCC | PLCC | SROCC | PLCC | SROCC | PLCC | SROCC | |
| DIIVINEsaad2012blind | 0.908 | 0.892 | 0.776 | 0.804 | 0.567 | 0.643 | 0.435 | 0.413 |
| BRISQUEmittal2012no | 0.944 | 0.929 | 0.748 | 0.812 | 0.571 | 0.626 | 0.567 | 0.528 |
| ILNIQEzhang2015feature | 0.906 | 0.902 | 0.865 | 0.822 | 0.648 | 0.521 | 0.558 | 0.528 |
| BIECONkim2016fully | 0.961 | 0.958 | 0.823 | 0.815 | 0.762 | 0.717 | 0.648 | 0.623 |
| MEONma2017end | 0.955 | 0.951 | 0.864 | 0.852 | 0.824 | 0.808 | 0.691 | 0.604 |
| WaDIQaMbosse2017deep | 0.955 | 0.960 | 0.844 | 0.852 | 0.855 | 0.835 | 0.752 | 0.739 |
| DBCNNzhang2018blind | 0.971 | 0.968 | 0.959 | 0.946 | 0.865 | 0.816 | 0.856 | 0.851 |
| TIQAyou2021transformer | 0.965 | 0.949 | 0.838 | 0.825 | 0.858 | 0.846 | 0.855 | 0.850 |
| MetaIQAzhu2020metaiqa | 0.959 | 0.960 | 0.908 | 0.899 | 0.868 | 0.856 | 0.775 | 0.762 |
| P2P-BMying2020patches | 0.958 | 0.959 | 0.902 | 0.899 | 0.856 | 0.862 | 0.849 | 0.840 |
| HyperIQAsu2020blindly | 0.966 | 0.962 | 0.942 | 0.923 | 0.858 | 0.840 | 0.845 | 0.852 |
| TReSgolestaneh2022no | 0.968 | 0.969 | 0.942 | 0.922 | 0.883 | 0.863 | 0.858 | 0.915 |
| MANIQA(Ours) | 0.983 | 0.982 | 0.968 | 0.961 | 0.943 | 0.937 | 0.946 | 0.944 |
| Dataset | # of Dist. Images | # of Dist.Types |
|---|---|---|
| LIVE | 779 | 5 |
| CSIQ | 866 | 6 |
| TID2013 | 3,000 | 24 |
| KADID-10K | 10,125 | 25 |
| PIPAL | 23,200 | 116 |
4.2 Implementation Details
Our experiments are implemented on an NVIDIA GeForce RTX 3090 with PyTorch 1.8.0 and CUDA 11.2 for training and testing. We trained and tested our model on each of the five datasets. Considering the unconformity of input sizes of ViT and our datasets, we randomly cropped the images into size from the training dataset and randomly horizontally flipped the cropped images with a given probability .
We choose ViT-B/8dosovitskiy2020image as our pre-trained model which is trained on ImageNet-21k and fine-tuned on ImageNet-1k with the patch size set to . MANIQA contains two stages. Each stage includes Transposed Attention Block (TAB) and Scale Swin Transformer Block (SSTB). The first SSTB’s embedding dimension is set to and the second is set to . The hidden layer’s dimension of MLP , number of heads , and window size is set to , , and in each SSTB. We set scale in SSTB.
Following the standard training strategy from existing IQA algorithms, we randomly split each dataset into , times with selected 5 different seeds. for training and the rest for testing. During training, we set the learning rate to . The batch size is set to and we utilized the ADAM optimizer with weight decay and cosine annealing learning rate with the parameters and set to and . The training loss we use is Mean Square Error (MSE) Loss. During testing, we randomly cropped sized images times from the original one. The final score is generated by predicting the mean score of these images and all results are averaged by times split. We run the experiment times with different seeds and report the mean metrics for all of the reported results.
4.3 Evaluation Criteria
Following the prior works, we use Spearman’s rank-order correlation coefficient (SROCC) and Pearson’s linear correlation coefficient (PLCC) as the metrics to evaluate the performance of our models.The PLCC is defined as follows:
| (5) |
where and respectively indicate the ground-truth and predicted quality scores of -th image, and and indicate the mean of them. denotes the testing images. Let denote the difference between the ranks of -th test image in ground-truth and predicted quality scores. The SROCC is defined as:
| (6) |
Both metrics, PLCC and SROCC, are in [-1, 1]. A positive value means a positive correlation. Otherwise, the opposite. A higher value indicates better performance.
4.4 Results
Evaluation on five datasets. Tab. 1 shows the overall performance comparison on four datasets in terms of PLCC and SROCC. Our method outperforms the existing methods by a significant margin on almost every dataset. Besides, in Tab. 3, the results on PIPAL (also as the dataset of NTIRE 2022 NR-IQA competition) show that our method is powerful when assessing the GAN-based distortion.
Cross-dataset Evaluation on LIVE and TID2013. In Tab. 4, we conduct cross dataset evaluations and compare our model to the competing approaches. Training is performed on PIPAL without any finetuning or parameter adaptation. As shown in Tab. 4, our proposed method outperforms the other NR-IQA algorithm and has comparable performance with FR-IQA methods on each dataset, which indicates the strong generalization power of our model. The scatter plot is illustrated in Fig.7.
| IQA Name | Validation | Test | ||
|---|---|---|---|---|
| SROCC | PLCC | SROCC | PLCC | |
| PSNR | 0.250 | 0.284 | 0.269 | 0.303 |
| SSIMwang2004image | 0.332 | 0.386 | 0.377 | 0.407 |
| LPIPS-Alexzhang2018unreasonable | 0.581 | 0.616 | 0.584 | 0.592 |
| FSIMzhang2011fsim | 0.473 | 0.575 | 0.528 | 0.610 |
| NIQEmittal2012making | 0.005 | 0.115 | 0.03 | 0.112 |
| MAma2017learning | 0.129 | 0.131 | 0.173 | 0.224 |
| PIblau2018perception | 0.079 | 0.133 | 0.123 | 0.153 |
| Brisquemittal2011blind | 0.015 | 0.059 | 0.087 | 0.097 |
| MANIQA-S | 0.686 | 0.707 | 0.667 | 0.702 |
| MANIQA-E | - | - | 0.704 | 0.740 |
| Train on | PIPAL | ||||
|---|---|---|---|---|---|
| Test on | LIVE | TID2013 | |||
| PLCC | SROCC | PLCC | SROCC | ||
| FR | PSNR | 0.873 | 0.865 | 0.687 | 0.677 |
| WaDIQaMbosse2017deep | 0.883 | 0.837 | 0.698 | 0.741 | |
| RADNshi2021region | 0.905 | 0.878 | 0.747 | 0.796 | |
| NR | TReSgolestaneh2022no | 0.643 | 0.663 | 0.516 | 0.563 |
| MANIQA(ours) | 0.835 | 0.855 | 0.704 | 0.619 | |
4.5 NTIRE2022 IQA Challenge
Our method is originally proposed for participating in the NTIRE 2022 Perceptual Image Quality Assessment Challenge Track 2: No-reference. The task of predicting the perceptual quality of an image based on a set of prior examples of images and their perceptual quality labels. For the no-reference track, competitors are only allowed to submit algorithms that take only distorted images as input. We use the default settings described in Sec. 4.2. Besides, the scale factor is set to 0.13. Our ensemble approach ranked first place in the final private test phase.

4.6 Ablation Study
In Tab. 5 and Tab. 7, we provide ablation experiments to illustrate the effect of different backbones and each component of our proposed method by comparing the results on the PIPAL dataset. Result reported in Tab. 5 #1 gives the baseline performance when none of the components is used.
Feature Extractor. Tab. 7 shows that ViT serving as the feature extractor has a large edge over the CNN-based network, which means the long-range dependency modeled by transformers is crucial for images. For NR-IQA, pre-trained models trained with small patches are more competitive than the other ones.
Transposed Attention Block. The transposed attention block is proposed to enhance global interactions among all channels. Results in Tab. 5 show such interactions are indispensable for our method. Specifically, this module gains another 0.05 improvements on SROCC and PLCC, respectively when applied with the other two modules.
Scale Swin Transformer Block. The scale swin transformer block is proposed to enhance local interactions among all patches. By introducing SSTB, we can observe a clear performance gain in SROCC and PLCC. This demonstrates the effectiveness of local interactions. Besides, In Tab. 6, we test different scale factors on three datasets. Obviously, the model achieves the best performance when the scale factor is set to 0.1.
Patch-weighted Quality Prediction. A dual branch structure is proposed for estimating the weighted score from each patch. In Tab. 5, this module brings performance gain in SROCC and PLCC. We believe the dual branch struc- ture could suppress the high weight patches which reduce the risk of overfitting.
Combined with the above module we proposed, MANIQA significantly improves the evaluation performance.
| # | TAB | SSTB | Dual Branch | SROCC | PLCC |
|---|---|---|---|---|---|
| 1 | 0.593 | 0.607 | |||
| 2 | ✓ | 0.598 | 0.617 | ||
| 3 | ✓ | 0.610 | 0.603 | ||
| 4 | ✓ | ✓ | 0.604 | 0.623 | |
| 5 | ✓ | ✓ | 0.613 | 0.636 | |
| 6 | ✓ | ✓ | ✓ | 0.686 | 0.707 |
| Scale | SROCC | PLCC |
|---|---|---|
| 0.1 | 0.686 | 0.704 |
| 0.2 | 0.677 | 0.699 |
| 0.4 | 0.672 | 0.696 |
| 0.6 | 0.669 | 0.685 |
| 0.8 | 0.678 | 0.690 |
| 1.0 | 0.674 | 0.689 |

| Backbone | Para. | SROCC | PLCC |
|---|---|---|---|
| ViT-B/8 | 135.62M | 0.686 | 0.707 |
| ResNet50 | 72.98M | 0.512 | 0.532 |
4.7 Visualization
In Fig. 8, we visualize the patch weight, score, and final weighted maps of the test dataset of the NTIRE 2022 NR-IQA Challenge generated by our method. As can be seen, the patch weight maps focus on the salient subjects which are noteworthy regions for human eyes, while the patch score maps pay more attention to the regions with a better visual experience. When human observe an image, it is the subject itself that immensely affect our perception. So these patches are given high weights shown in Fig. 8. However, the high-quality regions are not always in such regions which contain important semantic information. On account of the inconsistency of notable regions and high-quality regions, the final weighted maps depend on both the patch weight and score maps. We believe the dual branch structure could suppress the high weight patches which reduce the risk of overfitting.
5 Conclusion
We proposed Multi-dimension Attention Network for no-reference Image Quality Assessment (MANIQA) and it is appropriately applied to a perceptual image quality assessment task by taking the advantage of the multi-dimension attention network. The method has verified the point that multi-dimension interaction in channel and spatial is vital for the perceptual quality assessment task. In the multi-dimensional manner, the modules cooperatively increase the interaction among different regions of images globally and locally. Experiment results on the four standard databases demonstrate outstanding performances compared to the other existing methods. Besides, our method showed the best performance for GAN-based distortion on PIPAL in the NR track of the NTIRE 2022 Perceptual Image Quality Assessment Challenge.
Despite the success of our method, there exists room for improvement. In general, not all the GAN-based distortion are annoying. Thus, defining particular distorted types of GAN-based distortions(e.g., pleasing unreal texture, unpleasing unreal texture, et al.) is crucial for further progress.
Acknowledgments. This work was supported partially by the Major Research Plan of the National Natural Science Foundation of China under Grant No. 61991450 and the Shenzhen Key Laboratory of Marine IntelliSense and Computation under Contract ZDSYS20200811142605016.
References
- (1) Simone Bianco, Luigi Celona, Paolo Napoletano, and Raimondo Schettini. On the use of deep learning for blind image quality assessment. Signal, Image and Video Processing, 2018.
- (2) Yochai Blau and Tomer Michaeli. The perception-distortion tradeoff. In Proc. of CVPR, 2018.
- (3) Sebastian Bosse, Dominique Maniry, Klaus-Robert Müller, Thomas Wiegand, and Wojciech Samek. Deep neural networks for no-reference and full-reference image quality assessment. IEEE Transactions on Image Processing, 2017.
- (4) Mingdeng Cao, Yanbo Fan, Yong Zhang, Jue Wang, and Yujiu Yang. Vdtr: Video deblurring with transformer. arXiv preprint arXiv:2204.08023, 2022.
- (5) Tai-Yin Chiu, Yinan Zhao, and Danna Gurari. Assessing image quality issues for real-world problems. In Proc. of CVPR, 2020.
- (6) Alexey Dosovitskiy, Lucas Beyer, Alexander Kolesnikov, Dirk Weissenborn, Xiaohua Zhai, Thomas Unterthiner, Mostafa Dehghani, Matthias Minderer, Georg Heigold, Sylvain Gelly, et al. An image is worth 16x16 words: Transformers for image recognition at scale. arXiv preprint arXiv:2010.11929, 2020.
- (7) Xinbo Gao, Fei Gao, Dacheng Tao, and Xuelong Li. Universal blind image quality assessment metrics via natural scene statistics and multiple kernel learning. IEEE Transactions on neural networks and learning systems, 2013.
- (8) Deepti Ghadiyaram and Alan C Bovik. Perceptual quality prediction on authentically distorted images using a bag of features approach. Journal of Vision, 2017.
- (9) S Alireza Golestaneh, Saba Dadsetan, and Kris M Kitani. No-reference image quality assessment via transformers, relative ranking, and self-consistency. In Proceedings of the IEEE/CVF Winter Conference on Applications of Computer Vision, 2022.
- (10) Ian Goodfellow, Jean Pouget-Abadie, Mehdi Mirza, Bing Xu, David Warde-Farley, Sherjil Ozair, Aaron Courville, and Yoshua Bengio. Generative adversarial nets. Proc. of NeurIPS, 2014.
- (11) Jinjin Gu, Haoming Cai, Chao Dong, Jimmy S. Ren, Yu Qiao, Shuhang Gu, and Radu Timofte. Ntire 2021 challenge on perceptual image quality assessment. In Proc. of CVPR, 2021.
- (12) Jinjin Gu, Haoming Cai, Chao Dong, Jimmy S. Ren, Radu Timofte, et al. NTIRE 2022 challenge on perceptual image quality assessment. In Proc. of CVPR, 2022.
- (13) Gu Jinjin, Cai Haoming, Chen Haoyu, Ye Xiaoxing, Jimmy S Ren, and Dong Chao. Pipal: a large-scale image quality assessment dataset for perceptual image restoration. In Proc. of ECCV, 2020.
- (14) Le Kang, Peng Ye, Yi Li, and David Doermann. Convolutional neural networks for no-reference image quality assessment. In Proc. of CVPR, 2014.
- (15) Junjie Ke, Qifei Wang, Yilin Wang, Peyman Milanfar, and Feng Yang. Musiq: Multi-scale image quality transformer. In Proc. of ICCV, 2021.
- (16) Jongyoo Kim and Sanghoon Lee. Fully deep blind image quality predictor. IEEE Journal of Selected Topics in Signal Processing, 2016.
- (17) Eric Cooper Larson and Damon Michael Chandler. Most apparent distortion: full-reference image quality assessment and the role of strategy. Journal of electronic imaging, 2010.
- (18) Jingyun Liang, Jiezhang Cao, Guolei Sun, Kai Zhang, Luc Van Gool, and Radu Timofte. Swinir: Image restoration using swin transformer. In Proc. of ICCV, 2021.
- (19) Hanhe Lin, Vlad Hosu, and Dietmar Saupe. Kadid-10k: A large-scale artificially distorted iqa database. In 2019 Eleventh International Conference on Quality of Multimedia Experience, 2019.
- (20) Kwan-Yee Lin and Guanxiang Wang. Hallucinated-iqa: No-reference image quality assessment via adversarial learning. In Proc. of CVPR, 2018.
- (21) Ding Liu, Zhaowen Wang, Yuchen Fan, Xianming Liu, Zhangyang Wang, Shiyu Chang, and Thomas Huang. Robust video super-resolution with learned temporal dynamics. In Proc. of ICCV, 2017.
- (22) Ze Liu, Yutong Lin, Yue Cao, Han Hu, Yixuan Wei, Zheng Zhang, Stephen Lin, and Baining Guo. Swin transformer: Hierarchical vision transformer using shifted windows. In Proc. of ICCV, 2021.
- (23) Yihang Lou, Yan Bai, Jun Liu, Shiqi Wang, and Lingyu Duan. Veri-wild: A large dataset and a new method for vehicle re-identification in the wild. In Proc. of CVPR, 2019.
- (24) Chao Ma, Chih-Yuan Yang, Xiaokang Yang, and Ming-Hsuan Yang. Learning a no-reference quality metric for single-image super-resolution. Computer Vision and Image Understanding, 2017.
- (25) Kede Ma, Wentao Liu, Tongliang Liu, Zhou Wang, and Dacheng Tao. dipiq: Blind image quality assessment by learning-to-rank discriminable image pairs. IEEE Transactions on Image Processing, 2017.
- (26) Kede Ma, Wentao Liu, Kai Zhang, Zhengfang Duanmu, Zhou Wang, and Wangmeng Zuo. End-to-end blind image quality assessment using deep neural networks. IEEE Transactions on Image Processing, 2017.
- (27) Anish Mittal, Anush K Moorthy, and Alan C Bovik. Blind/referenceless image spatial quality evaluator. In Proc. of ASILOMAR, 2011.
- (28) Anish Mittal, Anush Krishna Moorthy, and Alan Conrad Bovik. No-reference image quality assessment in the spatial domain. IEEE Transactions on Image Processing, 2012.
- (29) Anish Mittal, Rajiv Soundararajan, and Alan C Bovik. Making a “completely blind” image quality analyzer. IEEE Signal Processing Letters, 2012.
- (30) Anush Krishna Moorthy and Alan Conrad Bovik. A two-step framework for constructing blind image quality indices. IEEE Signal processing letters, 2010.
- (31) Anush Krishna Moorthy and Alan Conrad Bovik. Blind image quality assessment: From natural scene statistics to perceptual quality. IEEE Transactions on Image Processing, 2011.
- (32) Nikolay Ponomarenko, Lina Jin, Oleg Ieremeiev, Vladimir Lukin, Karen Egiazarian, Jaakko Astola, Benoit Vozel, Kacem Chehdi, Marco Carli, Federica Battisti, et al. Image database tid2013: Peculiarities, results and perspectives. Signal processing: Image communication, 2015.
- (33) Yuyang Qian, Guojun Yin, Lu Sheng, Zixuan Chen, and Jing Shao. Thinking in frequency: Face forgery detection by mining frequency-aware clues. In Proc. of ECCV, 2020.
- (34) Michele A Saad, Alan C Bovik, and Christophe Charrier. Blind image quality assessment: A natural scene statistics approach in the dct domain. IEEE Transactions on Image Processing, 2012.
- (35) Hamid R Sheikh, Muhammad F Sabir, and Alan C Bovik. A statistical evaluation of recent full reference image quality assessment algorithms. IEEE Transactions on Image Processing, 2006.
- (36) Shuwei Shi, Qingyan Bai, Mingdeng Cao, Weihao Xia, Jiahao Wang, Yifan Chen, and Yujiu Yang. Region-adaptive deformable network for image quality assessment. In Proc. of CVPR, 2021.
- (37) Shaolin Su, Qingsen Yan, Yu Zhu, Cheng Zhang, Xin Ge, Jinqiu Sun, and Yanning Zhang. Blindly assess image quality in the wild guided by a self-adaptive hyper network. In Proc. of CVPR, 2020.
- (38) Christian Szegedy, Sergey Ioffe, Vincent Vanhoucke, and Alexander A Alemi. Inception-v4, inception-resnet and the impact of residual connections on learning. In Proc. of AAAI, 2017.
- (39) Hossein Talebi and Peyman Milanfar. Nima: Neural image assessment. IEEE Transactions on Image Processing, 2018.
- (40) Ashish Vaswani, Noam Shazeer, Niki Parmar, Jakob Uszkoreit, Llion Jones, Aidan N Gomez, Łukasz Kaiser, and Illia Polosukhin. Attention is all you need. Proc. of NeurIPS, 2017.
- (41) Xintao Wang, Ke Yu, Shixiang Wu, Jinjin Gu, Yihao Liu, Chao Dong, Yu Qiao, and Chen Change Loy. Esrgan: Enhanced super-resolution generative adversarial networks. In Proc. of ECCV, 2018.
- (42) Zhou Wang and Alan C Bovik. Modern image quality assessment. Synthesis Lectures on Image, Video, and Multimedia Processing, 2006.
- (43) Zhou Wang, Alan C Bovik, Hamid R Sheikh, and Eero P Simoncelli. Image quality assessment: from error visibility to structural similarity. IEEE Transactions on Image Processing, 2004.
- (44) Sanghyun Woo, Jongchan Park, Joon-Young Lee, and In So Kweon. Cbam: Convolutional block attention module. In Proc. of ECCV, 2018.
- (45) Weihao Xia, Yujiu Yang, Jing-Hao Xue, and Jing Xiao. Domain fingerprints for no-reference image quality assessment. IEEE Transactions on Circuits and Systems for Video Technology, 2020.
- (46) Jingtao Xu, Peng Ye, Qiaohong Li, Haiqing Du, Yong Liu, and David Doermann. Blind image quality assessment based on high order statistics aggregation. IEEE Transactions on Image Processing, 2016.
- (47) Sheng Yang, Qiuping Jiang, Weisi Lin, and Yongtao Wang. Sgdnet: An end-to-end saliency-guided deep neural network for no-reference image quality assessment. In Proc. of ACM MM, 2019.
- (48) Peng Ye and David Doermann. No-reference image quality assessment using visual codebooks. IEEE Transactions on Image Processing, 2012.
- (49) Peng Ye, Jayant Kumar, and David Doermann. Beyond human opinion scores: Blind image quality assessment based on synthetic scores. In Proc. of CVPR, 2014.
- (50) Peng Ye, Jayant Kumar, Le Kang, and David Doermann. Unsupervised feature learning framework for no-reference image quality assessment. In Proc. of CVPR, 2012.
- (51) Zhenqiang Ying, Haoran Niu, Praful Gupta, Dhruv Mahajan, Deepti Ghadiyaram, and Alan Bovik. From patches to pictures (paq-2-piq): Mapping the perceptual space of picture quality. In Proc. of CVPR, 2020.
- (52) Junyong You and Jari Korhonen. Transformer for image quality assessment. In Proc. of ICIP, 2021.
- (53) Syed Waqas Zamir, Aditya Arora, Salman Khan, Munawar Hayat, Fahad Shahbaz Khan, and Ming-Hsuan Yang. Restormer: Efficient transformer for high-resolution image restoration. arXiv preprint arXiv:2111.09881, 2021.
- (54) Lin Zhang, Zhongyi Gu, Xiaoxu Liu, Hongyu Li, and Jianwei Lu. Training quality-aware filters for no-reference image quality assessment. IEEE MultiMedia, 2014.
- (55) Lin Zhang, Lei Zhang, and Alan C Bovik. A feature-enriched completely blind image quality evaluator. IEEE Transactions on Image Processing, 2015.
- (56) Lin Zhang, Lei Zhang, Xuanqin Mou, and David Zhang. Fsim: A feature similarity index for image quality assessment. IEEE Transactions on Image Processing, 2011.
- (57) Peng Zhang, Wengang Zhou, Lei Wu, and Houqiang Li. Som: Semantic obviousness metric for image quality assessment. In Proc. of CVPR, 2015.
- (58) Richard Zhang, Phillip Isola, Alexei A Efros, Eli Shechtman, and Oliver Wang. The unreasonable effectiveness of deep features as a perceptual metric. In Proc. of CVPR, 2018.
- (59) Weixia Zhang, Kede Ma, Jia Yan, Dexiang Deng, and Zhou Wang. Blind image quality assessment using a deep bilinear convolutional neural network. IEEE Transactions on Circuits and Systems for Video Technology, 2018.
- (60) Heliang Zheng, Huan Yang, Jianlong Fu, Zheng-Jun Zha, and Jiebo Luo. Learning conditional knowledge distillation for degraded-reference image quality assessment. In Proc. of ICCV, 2021.
- (61) Hancheng Zhu, Leida Li, Jinjian Wu, Weisheng Dong, and Guangming Shi. Metaiqa: Deep meta-learning for no-reference image quality assessment. In Proc. of CVPR, 2020.