Noisy detectors with unmatched detection efficiency thwart identification of single photon emitters via photon coincidence correlation
Abstract
Single photon emitters (SPEs) are often identified with a Hanbury Brown and Twiss intensity interferometer (HBTII) consisting of a 50:50 beamsplitter and two time-correlated single photon counters. For an SPE, the cross-correlation of photon arrival time between the two detectors, , shows a hallmark dip to zero at . One common heuristic for identifying SPEs is by measuring a system to have . Here in, we use stochastic methods to simulate the case of a SPE observed with non-ideal detectors and optics. We show that identification of SPEs is thwarted when the detectors have asymmetric detection efficiency, and when detector background noise is more than half the true SPE signal rate.
Single photon emitters (SPEs) play a crucial role in many extant and proposed quantum information technologies.Aharonovich et al. 2016; O'Brien et al. 2009 Categorization of an emitter as a SPE is usually accomplished by measuring the degree of second-order temporal coherence, , of the emission. For photons described by Fock states, , of number , the second-order coherence isLoudon 2000; Paul 1982
| (1) | ||||
| (2) |
If only one photon exists at a time then , and if two photons exist at a time then ; this analysis implies that if an emitter is found to have , that emitter must be a SPE.Michler et al. 2000; Högele et al. 2008
In order to measure , most labs employ variants of the Hanbury Brown and Twiss intensity interferometer (HBTII) consisting of a 50:50 beamsplitter which feeds two detector arms equipped with time correlated single photon counters.Brown and Twiss 1956 In terms of the long-time average intensity, , the normalized second order coherence isLoudon 2000; Paul 1982; Kimble et al. 1977
| (3) |
which has properties of for thermal emission and for coherent (random, Poissonian) emission. Classical (not quantized) light exhibits bunching while quantum light exhibits antibunching . Experimentally, a conspicuous dip of near heralds the existence of a quantized phenomena.Walls 1979 Figure 1 shows simulated correlation functions when the emitters are excited by continuous (Figure 1a) or pulsed (Figure 1b,c) sources.

Traditionally, background counts originating from scattered excitation light, or detector shot noise are understood to uniformly increase the value of measured by a HBTII.Kimble et al. 1977; Brouri et al. 2000; Kuhn et al. 2002; Kurtsiefer et al. 2000 Simplistically, if a SPE measurement is saturated with truly random background noise, the coherent case of results.Brouri et al. 2000 While ubiquitous, background noise is not the only nonideality which can plague SPE measurements. In our lab, we have identified three phenomena which can possibly complicate the measurement of SPEs with our HBTIIs:
- •
high levels of random background noise logged by both photon counting modules,
- •
photon counting modules with different quantum efficiencies or beamsplitters which do not evenly feed the counting modules,
- •
and photon counting modules with intrinsically different background count rates.
This work computationally demonstrates how these three phenomena can conspire to make SPE identification impossible.
To model the role of these three nonidealities, we imagine an impulsive, pulsed source exciting a single, perfect SPE which emits exactly one photon per excitation pulse resulting in a photon emission rate of . As diagrammed in Figure 2, the stream of photons from the SPE is split into two streams, and , which excite two detectors, and , respectively. The beamsplitter is assumed to be lossless,
| (4) |
If the detectors are asymmetrically fed by the beamsplitter (e.g. it is not 50:50) or if they have different quantum efficiencies, , then the effective count rate is
| (5) | ||||
| (6) |
for and . For this work, we let .

To add noise to our model, we define a total background count rate, , in reference to the total signal rate,
| (7) |
with being the noise factor which connects the two rates. Just like the signal rate, the background rate is losslessly split and fed into the two detectors
| (8) | ||||
| (9) |
with being the background rate asymmetry between the two detectors.
This system of rates encodes in scalar factors the three detrimental phenomena previously listed:
- •
describes the background count rate relative to the signal count rate, it can be experimentally controlled by e.g. cooling the detectors;Hofbauer et al. 2018; Richardson et al. 2009; Kang et al. 2003; Spinelli and Lacaita 1997
- •
describes the asymmetry in signal rates between the two detectors, it can be experimentally controlled by e.g. adding neutral density filters in front of one of the detectors;
- •
describes the asymmetry in background rates between the two detectors, it is hard to experimentally control because it is caused by e.g. differences in trap concentration in the active elements of the detectors.Kang et al. 2003; Spinelli and Lacaita 1997
A HBTII instrument yields two streams of photons whose arrival times at the two detectors are recorded. We write the digital data streams from the detectors A and B as and where is laboratory time. () if a photon hits detector A (B) at time , while () if no photon hits detector A (B) at time . The normalized cross-correlation between the two data streams,11 1 For continuous functions the cross-correlation, , is given by, where is the complex conjugate of . For finite, 1D arrays the cross-correlation is instead for in which is the length of , and is zero-padded such that when is outside the range of then .
| (10) |
is analogous to Equation 3. For experiments conducted with pulsed excitation sources it is common to quantify using integrals over specific pulse periods () of the excitation laser
| (11) |
where is a small, positive integer. This is the definition of which we will use for the remainder of this work.
In order to simulate measurement of a SPE, we assume impulsive excitation, emission, and detection of the SPE with unity quantum efficiency. This Dirac-delta distribution nature of dynamic processes allows us to write the data streams, and , as simple 1D numerical arrays whose index is identical to the laser pulse period. To populate and , for each array index, , a random number, , is drawn from a uniform distribution, and the arrays are written as:
- •
If then and .
- •
If instead then and
To add noise into the data stream, the arrays are updated using two more random numbers, and :
- •
If then if not, ,
- •
If then if not, ,
with the generation of and being uncorrelated to ensure the background noise is not correlated between the two detectors. This iterative array population is accomplished for arrays of size . is both the number of pulse periods over which the experiment has run as well as the number of single photon emission events.
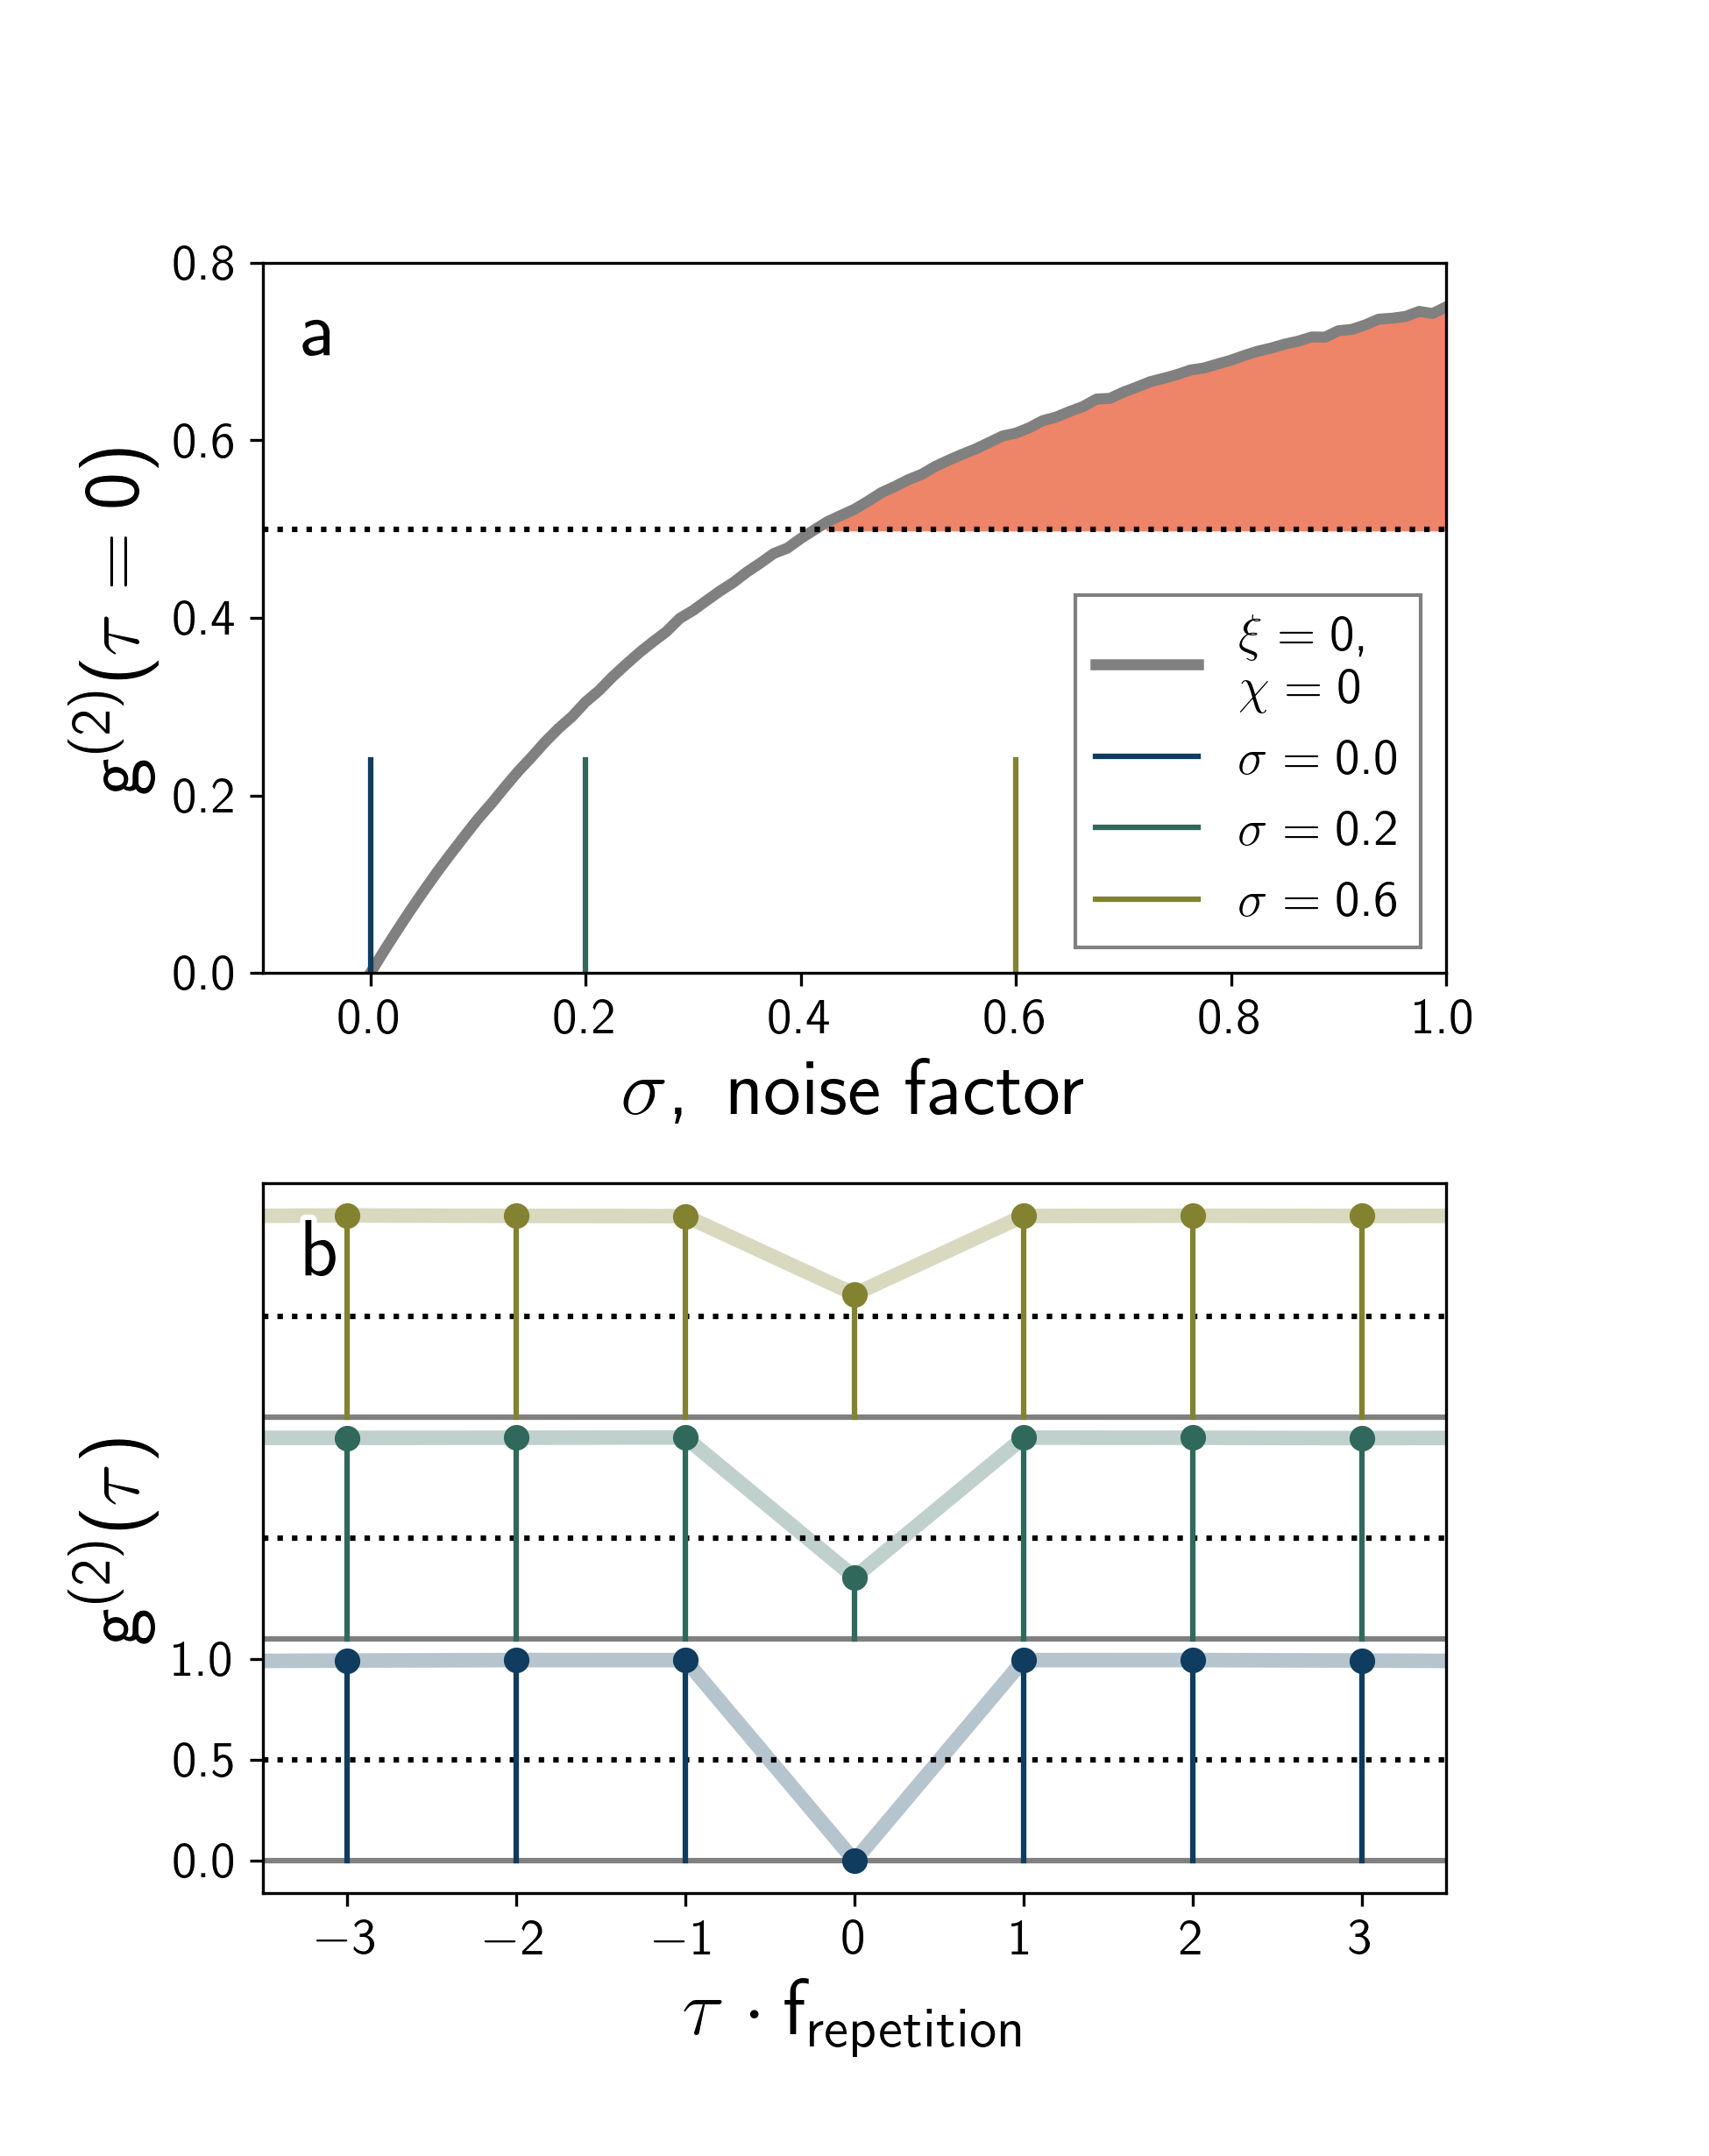
We first simulate the role that an increase in background noise plays in determining the value of when noise and signal counts are symmetrically distributed across the two detectors (). Figure 3a shows that with no background noise, , . As noise increases, smoothly increases until it passes at around ; above this point the simulation indicates that detector noise makes it impossible to identify SPEs using only the metric of . Figure 3b likewise shows how the temporal structure of smoothly evolves as background noise increases—note the resemblance of Figure 3b to a Dirac comb distribution. Figure 3 demonstrates that our model recovers the common observation that background noise pushes up the minimum achievable value of .Kimble et al. 1977; Brouri et al. 2000; Kuhn et al. 2002; Kurtsiefer et al. 2000
Next we model how asymmetry in the detection efficiency or noise distribution affects the observable values of . Figure 4a demonstrates that both background noise and detection efficiency asymmetry increase the observable value of . As an example, for (i.e. an 80:20 beamsplitter) a noise factor of a little more than causes our ideal SPE to not be identified as a SPE using the rule-of-thumb.

When there is no detection asymmetry, , increasing the asymmetry of noise, , between the two detectors does not greatly affect the cutoff value of noise for (Figure 4b). If only one detector has background noise () then the HBTII can still identify a SPE even with the noisy detector having the same signal and noise count rates. This effect may be rationalized by considering how a noise rate of on only one of the two detectors factors into Equation 11,
| (12) |
When noise and signal rates at one detector are similar (, , ) then . This observations yields a heuristic that SPE identification is severely hampered if the combined background noise rates of both detectors is greater than 50% of the combined signal rates.
In order to further investigate the inability to measure when , we simulate how changes jointly as a function of and while stepping through values of (Figure 5). Figure 5f shows that when there are no values of and which yields . As the noise factor decreases a region around the line begins to have . At low background noise levels, all but the largest signal detection asymmetries yield .

Taken together, this work allows us to bound the region of noise rates and detection asymmetry which can hamper SPE categorization with a HBTII. Because this work assumes the platonic ideal of both SPEs and HBTIIs with exactly one photon emitted and detected per excitation pulse period, the derived heuristics should be taken as an upper-bound on the non-idealities which can exist and still allow for categorization of SPEs.
For facile categorization of SPEs, the signal count rate at the individual detectors must be larger than the noise count rate for each detector. Asymmetry in signal detection efficiency should be ardently avoided; larger amounts of background noise compounds the detrimental nature of asymmetric signal detection. Conversely, asymmetry in background noise between the two detectors does not have a significant detrimental effect on a HBTII’s ability to categorize SPEs. If one does have asymmetric signal and noise rates between the two detectors, it is best to match them so one detector has both the highest signal and background noise rates.
Finally, we note that while is a fundamental characteristic of a SPE (Equation 2), imperfections in the HBTII characterizing the SPE can make it impossible to categorize the SPE as such. Much like recent work which indicated that, within experimental limitations, is a poor metric for categorizing the lasing threshold of microlasers,Carroll et al. 2021 here we stress that is only a good identifier for SPEs when background noise is less than half the fundamental signal rate and detectors are matched in efficiency.
This work was performed at the Center for Nanoscale Materials, a U.S. Department of Energy Office of Science User Facility, was supported by the U.S. DOE, Office of Basic Energy Sciences, under Contract No. DE-AC02-06CH11357.
References
- Aharonovich et al. (2016) I. Aharonovich, D. Englund, and M. Toth, Solid-state single-photon emitters, Nat. Photon. 10, 631 (2016).
- O'Brien et al. (2009) J. L. O'Brien, A. Furusawa, and J. Vučković, Photonic quantum technologies, Nat. Photon. 3, 687 (2009).
- Loudon (2000) R. Loudon, The quantum theory of light, 3rd ed. (Oxford University Press, 2000).
- Paul (1982) H. Paul, Photon antibunching, Rev. of Mod. Phys. 54, 1061 (1982).
- Michler et al. (2000) P. Michler, A. Kiraz, C. Becher, W. V. Schoenfeld, P. M. Petroff, L. Zhang, E. Hu, and A. Imamoǧlu, A quantum dot single-photon turnstile device, Science 290, 2282 (2000).
- Högele et al. (2008) A. Högele, C. Galland, M. Winger, and A. Imamoğlu, Photon antibunching in the photoluminescence spectra of a single carbon nanotube, Phys. Rev. Lett. 100, 217401 (2008).
- Brown and Twiss (1956) R. H. Brown and R. Q. Twiss, Correlation between photons in two coherent beams of light, Nature 177, 27 (1956).
- Kimble et al. (1977) H. J. Kimble, M. Dagenais, and L. Mandel, Photon antibunching in resonance fluorescence, Phys. Rev. Lett. 39, 691 (1977).
- Walls (1979) D. F. Walls, Evidence for the quantum nature of light, Nature 280, 451 (1979).
- Brouri et al. (2000) R. Brouri, A. Beveratos, J.-P. Poizat, and P. Grangier, Photon antibunching in the fluorescence of individual color centers in diamond, Opt. Lett. 25, 1294 (2000).
- Kuhn et al. (2002) A. Kuhn, M. Hennrich, and G. Rempe, Deterministic single-photon source for distributed quantum networking, Phys. Rev. Lett. 89, 067901 (2002).
- Kurtsiefer et al. (2000) C. Kurtsiefer, S. Mayer, P. Zarda, and H. Weinfurter, Stable solid-state source of single photons, Phys. Rev. Lett. 85, 290 (2000).
- Hofbauer et al. (2018) M. Hofbauer, B. Steindl, and H. Zimmermann, Temperature dependence of dark count rate and after pulsing of a single-photon avalanche diode with an integrated active quenching circuit in 0.35 m CMOS, Journal of Sensors 2018, 1 (2018).
- Richardson et al. (2009) J. Richardson, L. Grant, and R. Henderson, Low dark count single-photon avalanche diode structure compatible with standard nanometer scale CMOS technology, IEEE Photonics Technology Letters 21, 1020 (2009).
- Kang et al. (2003) Y. Kang, H. X. Lu, Y.-H. Lo, D. S. Bethune, and W. P. Risk, Dark count probability and quantum efficiency of avalanche photodiodes for single-photon detection, Appl. Phys. Lett. 83, 2955 (2003).
- Spinelli and Lacaita (1997) A. Spinelli and A. Lacaita, Physics and numerical simulation of single photon avalanche diodes, IEEE Transactions on Electron Devices 44, 1931 (1997).
- (17) For continuous functions the cross-correlation, , is given by, where is the complex conjugate of . For finite, 1D arrays the cross-correlation is instead for in which is the length of , and is zero-padded such that when is outside the range of then .
- Carroll et al. (2021) M. A. Carroll, G. D’Alessandro, G. L. Lippi, G.-L. Oppo, and F. Papoff, Thermal, quantum antibunching and lasing thresholds from single emitters to macroscopic devices, Phys. Rev. Lett. 126, 063902 (2021).