The State of the Molecular Gas in Post-Starburst GalaxiesAstropy (Astropy Collaboration et al. 2013; Astropy Collaboration et al. 2018), CASA (McMullin et al. 2007), Matplotlib (Hunter 2007), NumPy (Harris et al. 2020)
Abstract
The molecular gas in galaxies traces both the fuel for star formation and the processes that can enhance or suppress star formation. Observations of the molecular gas state can thus point to when and why galaxies stop forming stars. In this study, we present ALMA observations of the molecular gas in galaxies evolving through the post-starburst phase. These galaxies have low current star formation rates, regardless of the SFR tracer used, with recent starbursts ending within the last 600 Myr. We present CO (3–2) observations for three post-starburst galaxies, and dense gas HCN/HCO+/HNC (1–0) observations for six (four new) post-starburst galaxies. The post-starbursts have low excitation traced by the CO spectral line energy distribution (SLED) up to CO (3–2), more similar to early-type than starburst galaxies. The low excitation indicates that lower density rather than high temperatures may suppress star formation during the post-starburst phase. One galaxy displays a blueshifted outflow traced by CO (3–2). MaNGA observations show that the ionized gas velocity is disturbed relative to the stellar velocity field, with a blueshifted component aligned with the molecular gas outflow, suggestive of a multiphase outflow. Low ratios of HCO+/CO, indicating low fractions of dense molecular gas relative to the total molecular gas, are seen throughout post-starburst phase, except for the youngest post-starburst galaxy considered here. These observations indicate that the impact of any feedback or quenching processes may be limited to low excitation and weak outflows in the cold molecular gas during the post-starburst phase.
I Introduction
Multiwavelength observations of galaxies across cosmic time are revealing a detailed picture of how galaxies grow, evolve, and ultimately become quiescent. While some galaxies in the local Universe have gradually ended star formation over many Gyr, others show signs of a sudden end to star formation, having undergone rapid evolution from starbursting to quiescent (Schawinski et al. 2014, e.g.,). Such post-starburst galaxies display substantial populations of young A stars, yet little emission line flux from HII regions around O or B stars, indicating a recent starburst that has since ended (Dressler & Gunn 1983; Couch & Sharples 1987). Post-starburst galaxies provide evidence for fast evolution, likely driven by recent mergers (Zabludoff et al. 1996; Pawlik et al. 2015; Sazonova et al. 2021). At higher redshifts, large fractions of quiescent galaxies show signs of being post-starburst, suggesting that this process of rapid evolution is more common (Wild et al. 2009; Snyder et al. 2011; Whitaker et al. 2012; Wild et al. 2016; Rowlands et al. 2018; Belli et al. 2019; Wild et al. 2020; D’Eugenio et al. 2020). In order to match the high mass, quiescent end of the galaxy population, simulations must add in feedback from active galactic nuclei (AGN) to limit and ultimately end star formation (Di Matteo et al. 2005; Croton et al. 2006, e.g.,). Yet the process of how and if AGN feedback operates in its different regimes across galaxy type, and the contribution of stellar feedback, is not well understood.
Galaxies evolving through the post-starburst phase are laboratories for understanding how and when star formation ends, the role of feedback processes, and the connection between the evolution of galaxies and their supermassive black holes (see French 2021 for a recent review). In order to understand the changes in star formation, we must look to the molecular gas properties of evolving galaxies to study the potential fuel for that star formation. Previous work has uncovered high molecular gas fractions traced by CO (1–0) single dish observations in multiple samples of post-starburst galaxies at (French et al. 2015; Rowlands et al. 2015; Alatalo et al. 2016), contrary to expectations that these galaxies would already be devoid of gas.
The observation of large CO-traced molecular gas reservoirs remaining in post-starburst galaxies raises the question of why they have become quiescent and what prevents the CO-traced molecular gas from forming stars. If large gas reservoirs exist, but are in a relatively diffuse state, this would explain why star formation is no longer occurring at high rates. In previous work, we presented the non-detection of dense gas tracers in two post-starburst galaxies, with upper limits consistent with the low SFRs of these galaxies, indicating that these galaxies have stopped forming stars due to a lack of dense gas (French et al. 2018a). This absence of detected dense gas raises the new question of what physical properties in the diffuse molecular gas are preventing its collapse into forming stars: Is the gas heated? Is it kinematically disturbed? Is there evidence of energy injection from AGN? In order to address these questions, we require detections (rather than limits) of the dense gas tracers in post-starburst galaxies.
In this work, we aim to explore the molecular gas state of post-starburst galaxies by studying their CO excitation and by using multiple tracers of the dense molecular gas from observations with the Atacama Large Millimeter/submillimeter Array (ALMA). We present observations of CO (3–2) for three post-starburst galaxies with previous CO (1–0) and (2–1) observations, as well as observations of dense gas tracers HCN (1–0), HCO+ (1–0), and HNC (1–0) for four new post-starburst galaxies, which we combine with the previous sample of two measurements from French et al. 2018b. When needed, we assume a flat cosmology with and .
II Observations
II.1 Sample Selection
Our targets are selected from two parent samples of post-starburst galaxies with previous molecular gas detections, both of which were originally selected using SDSS spectroscopy. Galaxies from French et al. 2015; Smercina et al. 2018 are selected to have low H emission (H equivalent width Å in emission) and strong Balmer absorption (Lick at least above 4 Å; H (H) 4). Galaxies from Rowlands et al. 2015 were selected using a principal component analysis (PCA) from (Wild et al. 2007; Wild et al. 2009). These PCA components correspond roughly to and H. The PCA-selected post-starburst galaxies identify galaxies earlier in the post-starburst phase and with higher SFRs than post-starburst galaxies selected using a cut against H emission (Wild et al. 2009; French et al. 2018a).
We summarize our targets, their coordinates and redshifts, post-burst ages from French et al. 2018a, and ALMA dataset numbers in Table 1. We select our samples from previous studies of CO-traced molecular gas in post-starburst galaxies. We select two samples of galaxies for observing CO (3–2) (rest-frame GHz) in ALMA band 7 and for observing HCN (1–0) (Hydrogen Cyanide; rest-frame GHz), HCO+ (1–0) (Formylium; rest-frame GHz), and HNC (1–0) (Hydrogen Isocyanide; rest-frame GHz) in ALMA band 3. The CO (3–2) sample is a subset of the HCN/HCO+/HNC sample.
For the CO (3–2) observations, we select galaxies from the French et al. 2015; Smercina et al. 2018 sample with CO (1–0) and CO (2–1) detections, declinations observable with ALMA, and redshifts such that the CO (3–2) line is not in regions of high atmospheric absorption. Of the sample of four proposed galaxies, three were observed. Following the naming convention from French et al. 2015, these are H02, H03, and S02.
For the HCN (1–0), HCO+ (1–0), and HNC (1–0) observations, we select galaxies from French et al. 2015; Smercina et al. 2018 as well as from the sample of younger post-starburst galaxies from Rowlands et al. 2015. We require the galaxies to have declinations observable with ALMA and redshifts low enough to observe HCN (1–0) before it redshifts out of ALMA Band 3 (). We select galaxies to span the full range of post-starburst age. The inclusion of two galaxies from the Rowlands et al. 2015 sample allows for a wider post-starburst age baseline for this sample. The galaxies R02 and R05 are the second and fifth galaxies in the Rowlands et al. 2015 sample, respectively. From the French et al. 2015 sample, the galaxies H02 and S05 were previously observed with ALMA in various dense gas tracers, as reported in French et al. 2018b. We add an additional two galaxies from this sample: H03 and S02, for a total sample of six post-starburst galaxies with dense gas line measurements HCN (1–0), HCO+ (1–0), and HNC (1–0).
II.2 ALMA Observations
Observations of CO (3–2) for three post-starburst galaxies were taken during Cycle 5 (program 2017.1.00930, PI French). We use the Band 7 receiver and place the redshifted CO (3–2) line in a 1875 MHz wide spectral window with 3840 channels of width 1129 kHz. This corresponds to roughly 1700 km/s with channels of width 1 km/s for our objects. The requested spatial resolution was chosen to be arcsec, in order to obtain resolution elements per galaxy, assuming the galaxies had similar size to the CO (2–1) measurements of a partially-overlapping sample from Smercina et al. 2022. The data were pipeline calibrated using the CASA pipeline indicated in Table 2. Briggs weighting was used with the robust values chosen to best match the requested beam size and sensitivity.
Observations of several dense gas tracers were taken of four post-starburst galaxies during Cycles 5 and 6 (programs 2017.1.00935 and 2018.1.00948, PI French). We use the Band 3 receiver and three spectral windows to observe HCN (1–0), HCO+ (1–0), and HNC (1–0). We use wide spectral windows ( km/s), depending on the closeness of the lines to the edges of the Band 3 frequency range, and channel widths km/s. The requested spatial resolution was chosen to be 1 arcsecond, in order to match the total spatial extent of the dense gas emission estimated from CO (2–1) observations (Smercina et al. 2022) and dense gas observations in LIRGs. This resolution scale is larger than the typical size of dense gas emitting clumps, which we do not expect to measure individually. The data were pipeline calibrated using the CASA pipeline indicated in Table 2. Imaging parameters are chosen to best match the requested sensitivity and beam size. For the cases in which no lines are detected (HNC in R05 and all lines in S02), we manually re-image the data using updated continuum regions and natural weighting (robust = 2), but are unable to detect any additional emission. We also re-imaged these datasets using a UV taper of 3 arcseconds and are still unable to detect any additional emission. Two of the datasets (H03 and R02) were manually re-imaged by the ALMA pipeline scientists to refine the continuum subtraction.
Moment maps and extracted spectra for the both datasets are shown in Appendix A. We extract spectra from a 1.5 arcsec radius centered on the moment 0 map centroid. We integrate the flux density between from the CO (1–0) line measurements in French et al. 2015 and Rowlands et al. 2015. The continuum regions outside of the line regions are used to determine the uncertainty on the flux measurements. The integrated line fluxes are shown in Table 3. In cases where the signal to noise ratio is less than 3, we provide a 3 upper limit on the possible line flux.
| Galaxy | R.A. | Decl. | Post-burst Age | HCN/HCO+/HNC Dataset | CO (3–2) Dataset | |
|---|---|---|---|---|---|---|
| (deg) | (deg) | (Myr) | ||||
| H02 | 141.580 | 18.6781 | 0.0541 | 201 | (2016.1.00881; [1]) | 2017.1.00930 |
| H03 | 222.067 | 17.5517 | 0.0449 | 381 | 2017.1.00935 | 2017.1.00930 |
| S02 | 49.2288 | -0.0420 | 0.0231 | 522 | 2017.1.00935 | 2017.1.00930 |
| S05 | 146.112 | 4.49912 | 0.0467 | 259 | (2016.1.00881; [1]) | |
| R02 | 228.951 | 20.0224 | 0.0363 | -4 | 2018.1.00948 | |
| R05 | 244.398 | 14.0523 | 0.0338 | 10 | 2018.1.00948 |
| Target | Dataset | Beam size (″) | CASA Pipeline | robust |
|---|---|---|---|---|
| H03 HCO+ (1–0) | 2017.1.00935 | 1.26 1.06 | 5.1.1-5 | 0 |
| S02 HCO+ (1–0) | 2017.1.00935 | 0.97 0.88 | 5.4.0-68 | 2 |
| R02 HCO+ (1–0) | 2018.1.00948 | 1.03 0.86 | 5.4.0-68 | 1 |
| R05 HCO+ (1–0) | 2018.1.00948 | 1.16 0.80 | 5.4.0-68 | 2 |
| H02 CO (3–2) | 2017.1.00930 | 0.39 0.38 | 5.1.1-5 | 0.5 |
| H03 CO (3–2) | 2017.1.00930 | 0.39 0.34 | 5.4.0-68 | -0.5 |
| S02 CO (3–2) | 2017.1.00930 | 0.26 0.23 | 5.4.0-68 | 2 |
| Galaxy | HCN (1–0) | HCO+ (1–0) | HNC (1–0) | CO (3–2) |
|---|---|---|---|---|
| (Jy km/s) | (Jy km/s) | (Jy km/s) | (Jy km/s) | |
| H02 | ||||
| H03 | ||||
| S02 | ||||
| S05 | ||||
| R02 | ||||
| R05 |
II.3 Archival Data
We use H-based star formation rates (SFRs) for the post-starburst galaxies from French et al. 2015 and Rowlands et al. 2015 as this measurement is the least biased and most available SFR for our post-starburst sample. The H fluxes are from the SDSS (Strauss et al. 2002) MPA-JHU galSpec catalogs (Brinchmann et al. 2004; Tremonti et al. 2004), and have been corrected for extinction using the Balmer decrement. For the two Rowlands et al. 2015 galaxies (R02, R05), the SFRs are additionally corrected for the contribution from AGN contamination using the method from Wild et al. 2010, as these galaxies were selected without a cut against significant H emission (see §II.1). We correct for aperture bias using the galSpec SFR aperture bias corrections, which use photometry outside of the fiber aperture to estimate the required correction (Salim et al. 2007), and range from 3.5–6.3 corrections for the galaxies considered here. The impact of using different SFR indicators is discussed in SIV.1. For the sample of post-starburst galaxies with both H observations and Spitzer [NeII] 12.8m and [NeIII] 15.6m observations, we find no evidence that the H observations are missing star formation due to dust obscuration. If there was significant dust obscuration for this sample, we would expect to see Ne-based SFRs systematically above the H-based SFRs. Instead, we see no systematic shift between the two tracers. Thus, we use H-based SFRs throughout the main body of this work, and present the results if infrared tracers are used in Appendix B.
III Results
III.1 Gas Excitation
Observations of multiple CO lines trace the excitation of the molecular gas; the shape of the CO spectral line energy density (SLED) depends on the density, kinetic temperature, and observed column density of the gas (Weiß et al. 2007; Carilli & Walter 2013; Narayanan & Krumholz 2014; Bournaud et al. 2015; Kamenetzky et al. 2018). We combine the CO (3–2) measurements of three post-starburst galaxies from this survey with CO (2–1) and CO (1–0) measurements from the IRAM 30m from French et al. 2015. Resolved studies of CO (2–1) with ALMA of a subset of these galaxies from Smercina et al. 2022 show that the molecular gas in post-starburst galaxies is compact, on arcsec scales, such that the ALMA observations are not resolving out extended flux, and the single dish measurements are comparable to the ALMA measurements. We compare the ALMA CO(2–1) flux measurements from Smercina et al. 2022 to the IRAM 30m measurements from French et al. 2015 to estimate the uncertainties introduced from combining the measurements. For H02 and H03, the ALMA and IRAM CO (2–1) measurements differ by % (consistent within 1.5 of the combined uncertainty). For H02, the IRAM flux is larger than the ALMA flux; for H03 the ALMA flux is larger than the IRAM flux. We do not have ALMA CO (2–1) measurements for S02, so we assume it will have a similar uncertainty. These errorbars are reflected in Figure 1.
We compare the CO SLEDs of the three post-starburst galaxies with CO (3–2) measurements with other galaxy samples in Figure 1. The post-starburst galaxies have low CO excitation, consistent with the population of early type galaxies (Crocker et al. 2012; Bayet et al. 2013), slightly below the population of star forming galaxies (Leroy et al. 2021), and below most of the LIRGs (Papadopoulos et al. 2012). Even considering the uncertainties from combining ALMA and IRAM measurements, the post-starburst galaxies have low excitation.
Observations of CO (1–0) and CO (2–1) in post-starburst galaxies show low star formation efficiencies (SFEs), (French et al. 2015; Rowlands et al. 2015; Alatalo et al. 2016; Smercina et al. 2018; Smercina et al. 2022). The excitation of the CO-traced gas can be used to distinguish between two possible mechanisms that could suppress star formation in the molecular gas, leading to these low SFEs. The first possibility is high kinetic temperatures in the gas paired with low gas densities; in this case, we would expect to see high gas excitation throughout the post-starburst phase. High excitation could also arise from both high temperatures and high densities like those in starburst galaxies, but we would expect to see starburst-like SFRs if the densities were also high. The second possibility for why the post-starburst galaxies have low SFE is if the gas densities are low. In this case, we would expect to see low gas excitation, similar to early type galaxies, throughout the post-starburst phase. The observations of the post-starburst excitation presented here favor the second possibility, that the post-starburst galaxies have low densities and temperatures11 1 These low temperatures are indicative of the state of the CO, but are not sensitive to the large scale motions that appear to increase the velocity dispersion of the gas. Smercina et al. 2022 infer a source of turbulent heating from high velocity dispersions of CO (2–1) observations, yet this does not preclude the low CO excitation observed here.. The low density may explain the low SFEs.
We explore these possibilities more quantitatively by modelling the CO SLEDs with RADEX (van der Tak et al. 2007). RADEX is a non-LTE (non local thermodynamic equilibrium) code that solves for the radiative transfer of a given molecular species, assuming a geometry. Here, we assume a uniform sphere geometry22 2 Assuming alternate geometries of an expanding sphere or plane parallel slab will not provide substantially different results for this application (Krips et al. 2011). We address the case where the galaxy contains multiple components of gas later in this section.. We use a grid of logarithmically-spaced values in temperature (; K), density (; cm-3), and column density of CO (; cm-2), similar to that used by Krips et al. 2011. We generate the expected flux ratios of the CO (1–0), CO (2–1), and CO (3–2) lines for this grid of parameters and compare them to the observed line ratios.
The inferred density and temperature values are highly degenerate unless the full rise and turnover of the CO SLED can be sampled (Carilli & Walter 2013; Kamenetzky et al. 2018, e.g.,). We visualize these degeneracies by plotting the likelihoods for the temperature, density, and column density of each source in Figure 2. Densities of cm-3 and temperatures of K are favored, although clear degeneracies can be seen between the cases of low density with relatively unconstrained temperature and higher density with low temperature. These values are similar to molecular gas densities and temperatures in early type galaxies (Bayet et al. 2013), which have densities of cm-3 and temperatures of K. The post-starburst galaxies have both temperatures and densities less than typical LIRGs. LIRGs have a wide range of densities of cm-3 and temperatures of K (Greve et al. 2009; Papadopoulos et al. 2012, e.g.,).
We perform additional RADEX modeling of the dense gas tracers HCN (1–0) and HCO+ (1–0) in addition to the CO lines. This analysis is complicated by the need to assume an abundance ratio of either [HCO+/CO] or [HCN/CO]. For both dense gas tracers, we assume an abundance ratio with respect to CO of (Krips et al. 2008; Aalto et al. 2012, consistent with the range of measurements by)33 3 This assumption only affects the results shown in Figure 3; the results in Figure 2 are independent, as are the results described in subsequent sections. Due to the uncertainties in what is affecting the HCO+/HCN ratio (§III.6), we consider each dense gas tracer individually. In Figure 3, we show the parameter likelihood corner plots considering CO (1–0), CO (2–1), CO (3–2) and either HCO+ (1–0) or HCN (1–0) for the two post-starburst galaxies (H03, S02) with both datasets. For S02, neither dense gas tracer is detected, so we assume the dense gas flux ratios are just below the detection threshold. When the HCO+ constraints are included, the best-fit densities are similar, with sharp cutoffs in likelihood above , the effective excitation density of the dense gas tracers (Shirley 2015).
The cold molecular gas temperatures indicated by the low CO excitation do not preclude the existence of an additional component of warm or hot gas, as the low J CO lines cannot predict the full SLED in the event of a secondary component of high temperature molecular gas. In our RADEX analysis, we have assumed the molecular gas is composed of a single temperature component. However, studies of star-forming and starburst galaxies (Valentino et al. 2020, e.g.,) have found evidence for multiple components using higher CO lines than available here. A secondary component of high excitation molecular gas was also found for NGC 1266 by Pellegrini et al. 2013, better fit by shock models than PDR models. The post-starburst galaxies considered here may also have multiple components of molecular gas, which would require additional CO lines to uncover, and may have different filling fractions. Indeed, we expect that such a component exists, as traced by mid-IR H2 rotational lines (Smercina et al. 2018). The extremely high HTIR ratios observed by Smercina et al. 2018 are indicative of shocks heating a portion of the molecular gas to high temperatures, with a “high-soft” radiation field affecting the dust. By modeling the mass of H2 using the mid-IR warm H2 lines (Togi & Smith 2016) and extrapolating down in temperature to the low temperature regime probed by the CO lines, Smercina et al. 2018 find gas masses typically within a factor of the mass of cold gas inferred from CO (1–0). The higher temperature gas traced by the mid-IR lines comprises a relatively small fraction of the overall mass. By combining these observations, we conclude that the bulk of the gas by mass remains at temperatures lower than typical LIRGs, while a fraction of the molecular gas is highly excited.
We compare the CO (3–2) / CO (1–0) intensity ratio as a tracer of the molecular gas temperature to the mean interstellar radiation field (ISRF) intensity calculated from dust SEDs in Figure 4. The is closely coupled to the dust temperature. Smercina et al. 2018 used Draine & Li 2007 models to fit the infrared SEDs of post-starburst galaxies, including the galaxies considered here. We use the best-fit values of the minimum ISRF intensity and power law index from Smercina et al. 2018 and the conversion to from Draine et al. 2007 to calculate for H02, H03, and S02, respectively. Cross matching with the CO SLED data above, we obtain measurements for LIRGs from Liu et al. 2021 and for the star forming and early type galaxies from Draine et al. 2007. For normal star forming and star bursting galaxies, the CO excitation is correlated with . This is consistent with previous work, e.g., Liu et al. 2021 find the CO R52 ratio to be well correlated with . While the post-starburst galaxies have high values similar to the LIRGs, their low CO excitation is more consistent with star forming and early type galaxies. The post-starburst galaxies lie in an unusual region of this parameter space, having high values similar to LIRGs, but low CO excitation, indicating the dust and gas temperatures are not well-coupled. The decoupled dust and gas temperatures stand in contrast to the coupled time evolution observed during the post-starburst phase (Smercina et al. 2018; Li et al. 2019).


III.2 Spatially-resolved and velocity-resolved observations
We construct zeroth-, first-, and second- order moment maps for the three post-starburst galaxies with CO (3–2) observations, presented in Appendix A. The CO (3–2) emission for each of the three post-starburst galaxies observed has limited extent relative to the optical emission, consistent with the CO (2–1) results from Smercina et al. 2022, which assume a 2D Gaussian profile. The half-light radius of the CO (3–2) emission for each galaxy is shown in Table 4. The sizes range from 0.38–0.57 arcsec, or 367–400 pc. On average, the CO (3–2) sizes are 6.3 smaller than the -band sizes from the SDSS imaging. Two galaxies (H02 and H03) have both CO (3–2) and CO (2–1) observations; these galaxies have sizes consistent between the two tracers, although differences would be difficult to determine with these observations, as % of the flux is contained within a central unresolved beamsize in both tracers for both galaxies. The velocity and velocity dispersion maps are broadly consistent as well. The galaxy S02 has archival MaNGA (Bundy et al. 2015) IFU data. In Figure 5, we compare the CO (3–2) emission to the post-starburst region with high H absorption. Even with the coarser ″ resolution of MaNGA, the post-starburst region with strong H absorption is resolved, and extends over most of the half light ellipse of the galaxy. The molecular gas is smaller than the extent of the young stellar population traced by the H index.
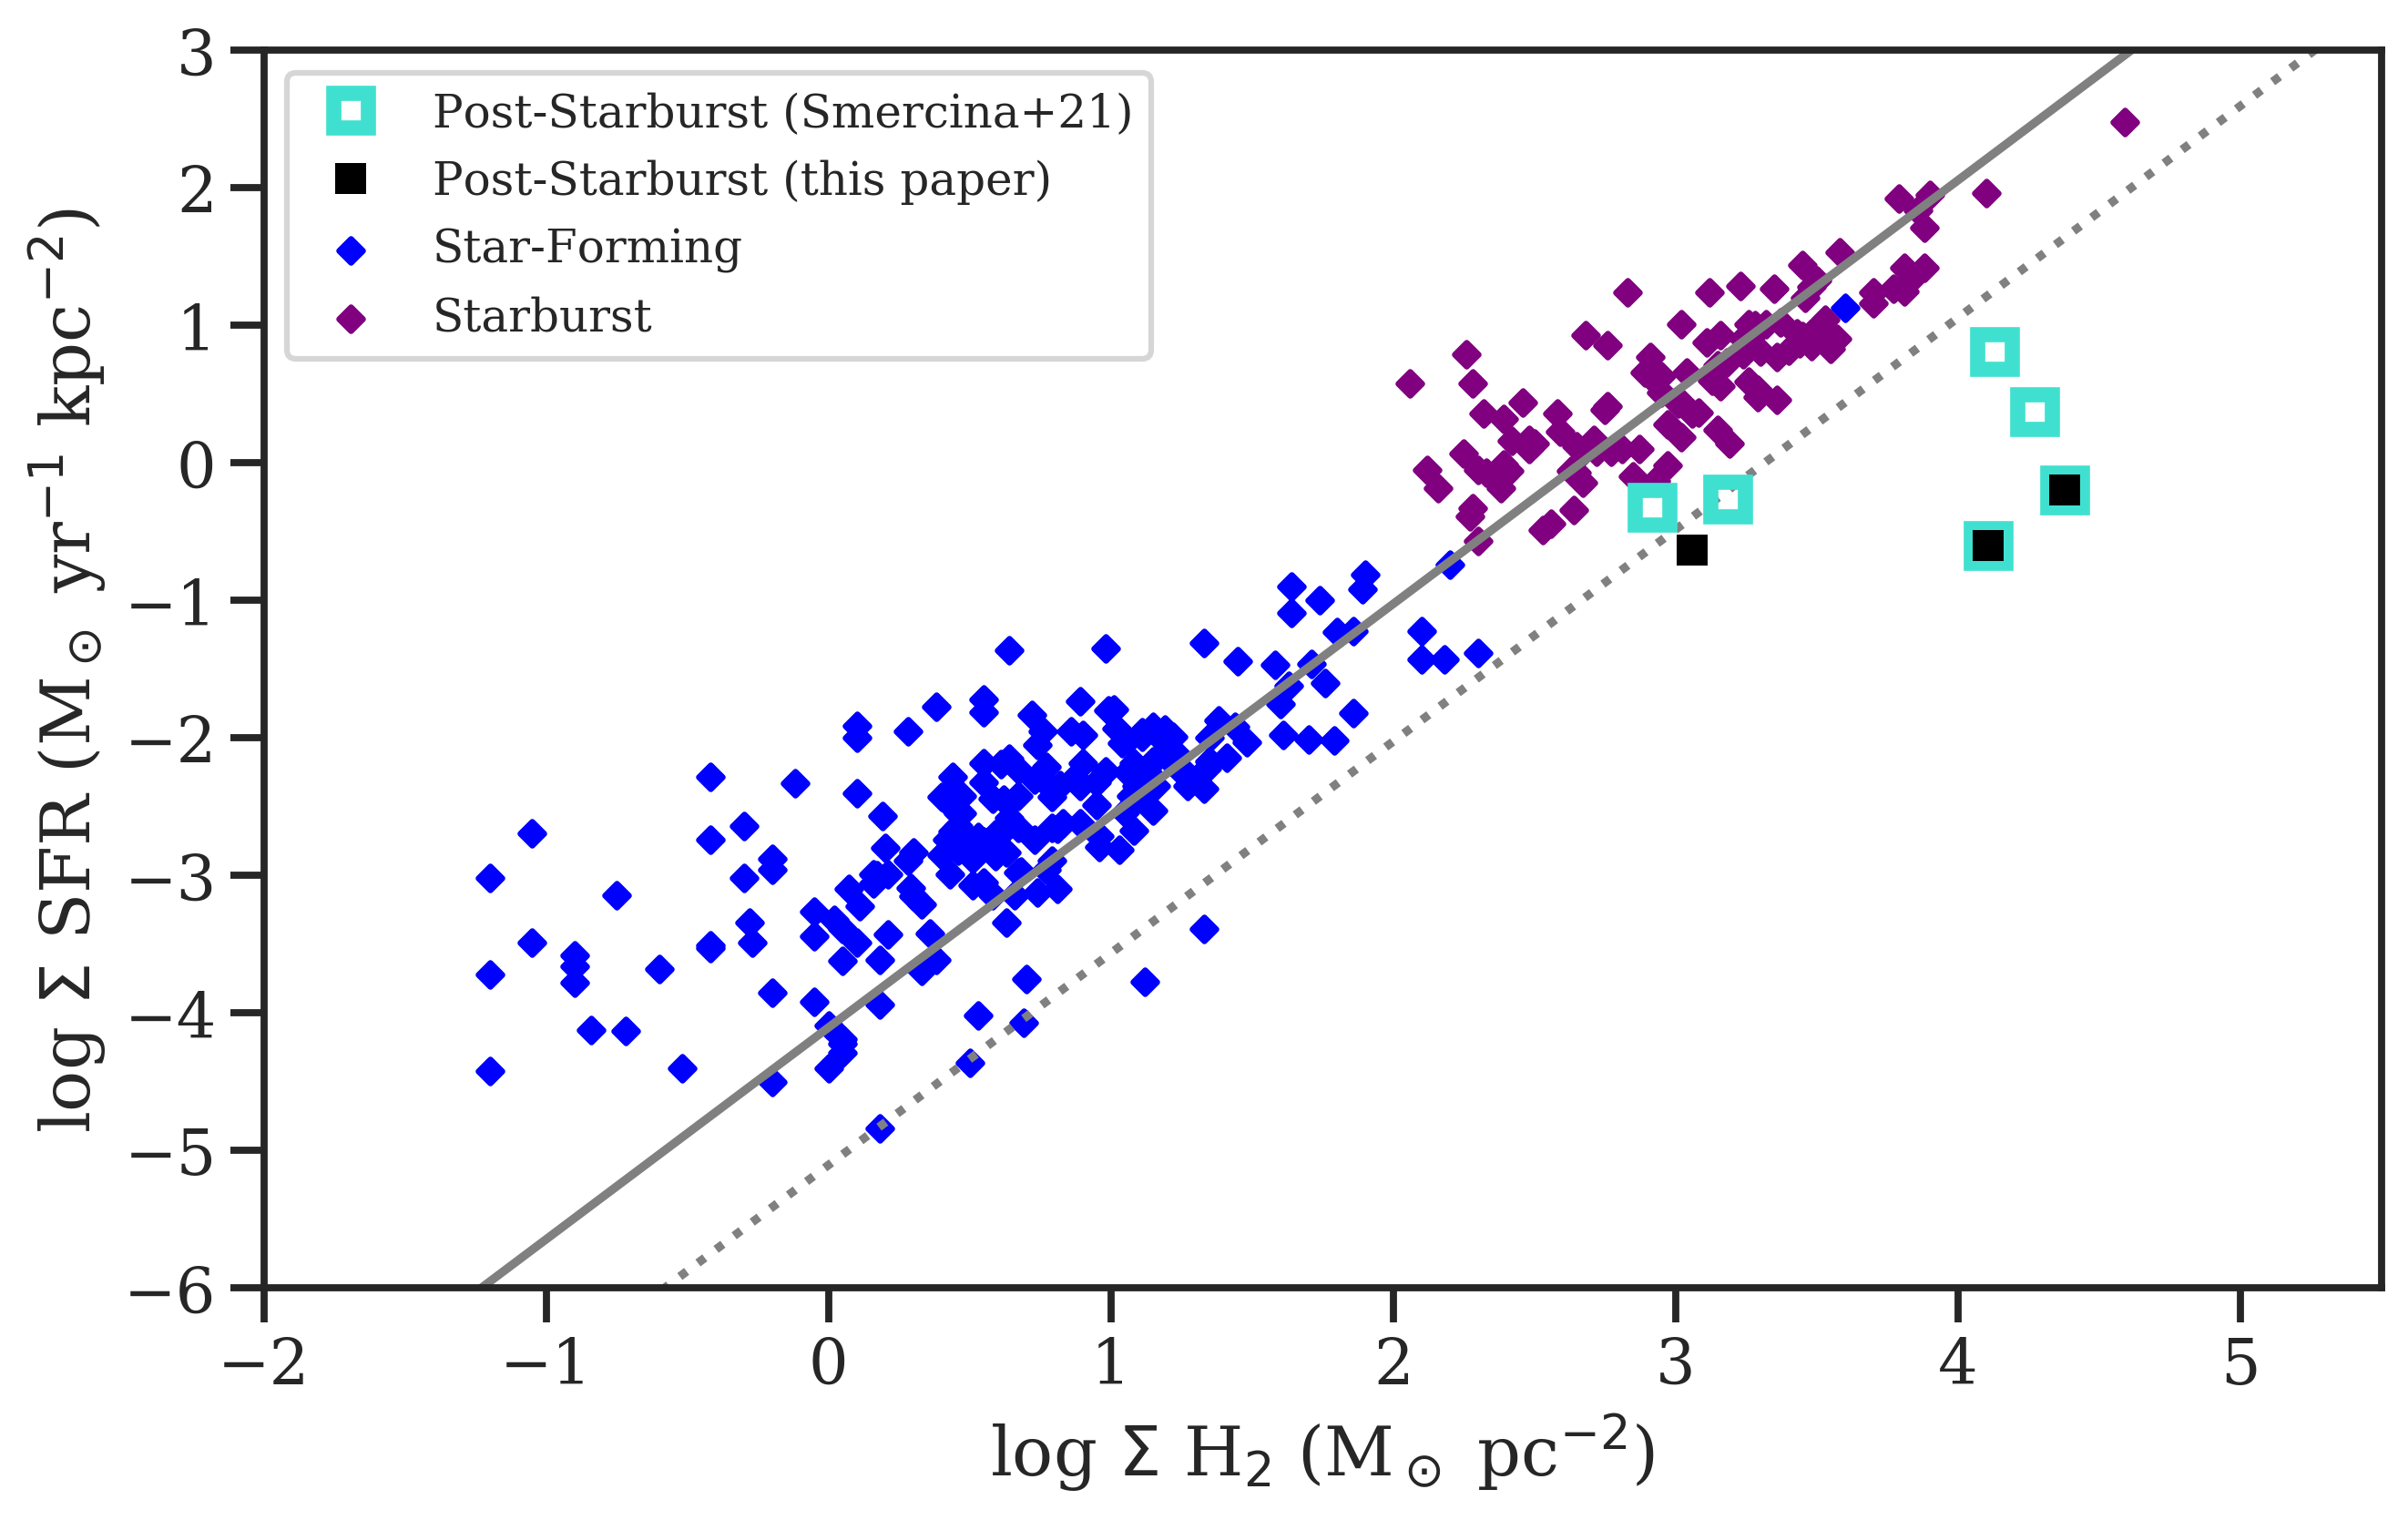
The small CO (3–2) and CO (2–1) sizes imply very high surface densities of molecular gas and residual star formation. Because of the consistency in sizes between the CO (3–2) measurements here and the CO (2–1) sizes measured by Smercina et al. 2022, we assume these sizes in calculating the molecular gas surface density from the CO (1–0) luminosities from French et al. 2015. Using the half-light sizes, we calculate the densities as:
| (1) |
| (2) |
We compare our observations to the samples of star-forming galaxies from de los Reyes & Kennicutt 2019 and starbursting galaxies from Kennicutt & De Los Reyes 2021 in Figure 6. This set of comparison galaxies is low redshift and covers a similar stellar mass range to the post-starburst galaxies presented here. While the comparison galaxies are on average at lower distance, the difference in average redshift is not enough to introduce cosmological effects. We use a CO-to-H2 conversion factor of 4 (K km s-1 pc2)-1 for all samples. The post-starburst galaxies have very high molecular gas surface densities, yet they lie below the comparison galaxies, with low star formation rate surface densities for their molecular gas surface densities. If we define the scatter in the star formation rate surface densities relative to the best-fit relation from Kennicutt & De Los Reyes 2021 as , the median post-starburst galaxy is 2.5 below the median for the comparison samples and 3.3 below the median for the starburst sample alone. The effects of star formation tracer on these results is explored further in §IV.1 and Appendix B; we observe qualitatively similar results using infrared tracers instead of the H SFR tracers used for the post-starburst galaxies here, even though the SFR derived from the TIR luminosity is biased high for the post-starbursts (see further discussion in §IV.1). When using the TIR luminosity to trace SFR, we find the median post-starburst galaxy to be 2.1 below the median for the comparison samples and 3.3 below the median for the starburst sample alone; when using the Neon-based SFRs, we find the median post-starburst galaxy to be 1.9 below the median for the comparison samples and 2.4 below the median for the starburst sample alone, using the scatter in the comparison sample to be as described above. Six of the seven galaxies presented in Figure 6 are the sample from Smercina et al. 2022; the addition of the measurement for S02 does not change the interpretation of this result. The values of and differ slightly from those presented by Smercina et al. 2022 due to the inclusion of the [CII] tracer and a different method for calculating the surface densities. but the qualitative conclusions are consistent. We use the half-light sizes, as these can be more robustly determined than outer sizes like the 95 percentile size used by de los Reyes & Kennicutt 2019 and Kennicutt & De Los Reyes 2021, though we verify that our qualitative conclusions do not change with the use of 95 percentile radii, regardless of SFR tracer. Because the relation between and is close to linear, changes to the size will not significantly affect the inferred offset from this relation.
Evidence of rotation is seen in the velocity fields of all three sources, though the peak velocity dispersion values are higher than the peak velocities. These behaviors are consistent with the range in CO (2–1) velocity and velocity dispersion maps seen by Smercina et al. 2022. The high CO(2–1) velocity dispersion and small size measured by Smercina et al. 2022 for H02 and H03, which led them to infer a high turbulent pressure, is also observed here. In the case of one galaxy, S02, we see evidence for a blueshifted outflow, which we explore further in the next section.
| Galaxy | CO (3–2) size | CO (3–2) size | -band R50a |
|---|---|---|---|
| (arcsec) | (pc) | (arcsec) | |
| H02 | 0.38 | 400 | 1.71 |
| H03 | 0.41 | 355 | 3.17 |
| S02 | 0.57 | 267 | 3.72 |

III.3 Blueshifted Outflow
S02 has a blueshifted component to the south east of the CO (3–2) centroid. We explore the nature of this component further in Figures 7, 8, and 9. A channel map of the CO (3–2) observations is shown in Figure 7, overlaid on the moment 0 map. The blueshifted component at velocities -64 – -108 km s-1 is roughly aligned with the rotational axis of the galaxy, but extends to larger radius (1″, 460 pc)) and does not have a symmetric redshifted component on the northwest side, as we would expect if this component were caused by rotation instead of an outflow.

We fit a series of tilted 3D ring models to S02 using Barolo (Di Teodoro & Fraternali 2015) to model the kinematics of the molecular gas. The position-velocity diagram of the data and best-fit model are shown in Figure 8. The best-fit kinematic major axis of the molecular gas is consistent with that of the stellar velocity. In the position-velocity diagram, the excess flux in the most blueshifted component at km s-1 can be seen, inconsistent with the model. This component can also be seen in the asymmetric double peak of the integrated spectrum shown in Figure 20.

We compare the CO (3–2) observations for S02 with archival HST imaging (PI: Zabludoff, ID 11643) and MaNGA (Bundy et al. 2015) IFU data in Figure 9. The stellar velocity field from MaNGA is aligned with the bulk of the molecular gas velocity. The southeastern component is blueshifted with respect to the surrounding stellar velocity field, indicative of an outflowing component. The ionized gas traced by the optical emission lines44 4 The velocities for all optical emission lines are fixed to one another during the fitting process (Westfall et al. 2019). is disturbed in morphology with respect to the stellar velocity, with the ionized gas blueshifted by km s-1 relative to the stellar velocity field. The ionized gas velocity can be measured with good signal to noise, with a median SNR over the entire MaNGA field of view, and SNR over the blueshifted component. The blueshifted CO component is aligned with the blueshifted ionized gas region, indicating a multiphase (both ionized and molecular gas) outflow. When we compare the location of this component to the HST image, it is aligned with a dust lane. It is unlikely that the dust lane is the source of the abnormal ionized gas velocity field due to extinction effects, as the blueshifted ionized gas component extends several arcseconds outside of the dust lane. Instead, the dust may be tracing the outflow similar to the case seen in the post-starburst galaxy IC 860 by Luo et al. 2022. Luo et al. 2022 observe a neutral gas outflow traced by NaD that aligns with a dust feature, with tentative evidence for a molecular gas outflow, consistent with the correlation of dust extinction and neutral gas outflows observed for AGN (Veilleux et al. 2005).


Thus, while the blueshifted component is aligned with the stellar velocity field and bulk rotation of the molecular gas, it is more likely to be an outflow than an extension of the molecular gas rotation due to (1) the spatially-distinct morphology of the outflow (see in Figure 7), (2) the asymmetric nature and lack of a counterpart on the northwest side, as evidenced by the excess flux above the best-fit Barolo model (see Figure 8), and (3) the velocity excess over the surrounding stellar velocity field (see Figure 9). The blueshifted component is unlikely to be a parcel of infalling gas from the recent merger, as the smooth stellar velocity field suggests any merger components have already coalesced. In gas-rich early type galaxies that have experienced a recent minor merger, position-velocity diagrams do not display as significant of asymmetric components as seen here (van de Voort et al. 2018), meaning a merger where the stellar field has coalesced more quickly than the molecular gas is unlikely.
We consider the bulk properties of this component, assuming a distance from the center of the galaxy of 1″(460 pc) and a velocity of 100 km s-1, based on the blueshifted component’s position in the channel map and position-velocity diagram. If this component is an outflow, its characteristic timescale is Myr. The south east component consists of % of the total flux. Scaling the CO (1–0) inferred molecular gas mass from French et al. 2015 by 15%, the expected mass in this outflowing component is 7.3 M⊙, and the average outflow rate over the timescale of the outflow is 16 M⊙ yr-1. This is consistent with the (large) range of typical molecular gas depletion rates inferred for the combined post-starburst population by French et al. 2018a. The mass traced by the molecular outflow will dominate over the mass in the ionized gas component, as ionized gas outflow rates are typically low M⊙ yr-1 (Baron & Netzer 2019).
In order to determine the likely fate of this outflowing gas, we compare the outflow velocity to the escape velocity at its radius of 1″(460 pc). We use the stellar mass from the SDSS (Strauss et al. 2002; Brinchmann et al. 2004; Tremonti et al. 2004) and the HST F625W observations to estimate the stellar mass profile of the galaxy. The fraction of stellar mass within the central 1″ is 0.17, which we use to scale the total mass from SDSS. The estimated stellar mass within this radius is M M⊙. The escape velocity is thus 195 km s-1. The outflow velocity of km s-1 is less than the escape velocity, but given inclination effects, if the angle of the outflow from our line of sight is , may exceed the escape velocity from the center of the galaxy.
The inferred outflow kinetic power using is erg s-1. The molecular outflow is comparable to those in star-forming galaxies and LINERs, and has less kinetic power than those in luminous AGN (Cicone et al. 2014). Another source of energy may be tidal disruption events (TDEs), which occur at higher rates in post-starburst galaxies than normal galaxies (French et al. 2016; French et al. 2020). As in Smercina et al. 2022, we consider the energy input of erg per TDE (Mockler & Ramirez-Ruiz 2021) and a typical TDE rate of per year per post-starburst galaxy (French et al. 2016), resulting in a total energy source of erg s-1. The feasibility for energy driving this outflow to come from intermittent AGN/LINER activity or from TDEs will depend heavily on the coupling of energy from the AGN/LINER or TDE to the molecular gas in these galaxies.
The MaNGA data for this source also allow us to investigate the nature of the LINER-like emission seen in the SDSS spectrum. Using the MaNGA data to construct a resolved BPT (Baldwin et al. 1981; Kewley et al. 2001; Kauffmann et al. 2003) diagram, most of the galaxy has low emission line fluxes such that the classification is ambiguous, but the spaxels that can be classified are in the LINER part of the BPT diagram (Figure 10). This LINER-like signature extends outside of the nucleus over arcsec (10 spaxels), significantly more than the 2.5 arcsec FWHM of MaNGA’s spatial resolution (Law et al. 2016). It is thus more likely to be caused by post-AGB stars (Sarzi et al. 2010; Yan & Blanton 2012) or shocks (Rich et al. 2015) than low luminosity AGN activity. However, if the “ring” like structure is a real feature, it could be an echo of previous nuclear activity. Given the light travel time from the nucleus to the edge of this feature, the echo would trace nuclear activity on a timescale of years ago. Further data would be required to determine if this ring like structure is real, due to the low signal to noise of these weak emission lines, especially for H and in the center of the galaxy.
While this galaxy does not show evidence for ongoing luminous AGN activity, the timescale for AGN to vary is much smaller than the characteristic timescale of this outflow. AGN are observed to change dramatically, turning on and off on timescales years (Keel et al. 2012; Sartori et al. 2018; Shen 2021). The molecular gas outflow we observe would have been launched 4.5 Myr ago, when the galaxy could have had now-faded AGN activity.

III.4 Evolution During the Post-Starburst Phase
The evolution of the molecular gas state during the post-starburst phase can provide more information than comparing the average properties to other classes of galaxies. We found in French et al. 2018a that the CO-traced molecular gas fraction declined during the post-starburst phase, after 90% of the starburst is complete, with a timescale of Myr. A similar decline has been seen in the CO-traced molecular gas in higher redshift post-starburst galaxies (Bezanson et al. 2021; Suess et al. 2021). The low SFRs during this period of decline cannot be responsible for depleting this gas via consumption or stellar feedback, suggesting that another mechanism like AGN feedback is operating late into the post-starburst phase. The dust fraction is also observed to decline during the post-starburst phase (Smercina et al. 2018; Li et al. 2019), with a timescale consistent with that of the CO-traced molecular gas (Li et al. 2019). Li et al. 2019 considered the evolution of the star formation efficiency (traced by SFR/( ), finding a rapid decline in SFE during the first 200 Myr of the post-starburst phase, which levels off to a shallower decline in after 200 Myr post-burst. This two-phase evolution in SFE implies a two-phase evolution in SFR and a faster initial timescale of SFR evolution compared to the CO-traced molecular gas.
Such a two-phase evolution in SFR with post-burst age was observed by Rowlands et al. 2015 in both the H and FIR-based SFRs. A short Myr decline was followed by a plateau of Myr. The overall timescale for the SFR to drop was Myr.
We illustrate the evolution of the specific SFR (sSFR) and various tracers of the molecular gas in Figure 11. We plot the sSFR traced by H for the three post-starburst samples from French et al. 2015; Rowlands et al. 2015; Alatalo et al. 2016. Post-burst ages are from French et al. 2018a and measure the time elapsed since the end of the recent starburst (the age since 90% of the stars were formed55 5 The post-burst age will be shorter than the time since the beginning of the burst and results in some cases of small negative ages in galaxies for which the best-fit SFH has a still-declining burst). The sSFR trend qualitatively appears to follow that expected from Rowlands et al. 2015 and Li et al. 2019, with a rapid initial decline that levels off at later times. Rowlands et al. 2015 observed a third phase of more rapid decline after 400 Myr in the H SFRs, which we do not observe here. We see no evidence of a significant correlation between age and sSFR for ages Myr using a Spearman or Pearson correlation test. This may be driven by differing treatments of the SFR in galaxies in the AGN portion of the BPT diagram in the limiting cases of very low SFR.
We explore the evolution during the post-starburst phase quantitatively by fitting the sSFR and CO-traced molecular gas fraction trends with two-component linear fits to , with the two lines required to meet in the middle. This model has four free parameters: the early slope, the late slope, the break point, and a y-offset. We assume a constant uncertainty in sSFR of 0.1 dex and take into account the measured molecular gas fraction uncertainties and upper limits. For this analysis, we do not include the uncertainty on age. For the sSFR - age comparison, the best fit early slope is 65 Myr, the best fit late slope is 480 Myr, and the pivot point is 77 Myr. The two-slope fit is significantly preferred over a single-slope fit using either the reduced ( vs. ) or Bayesian Information Criterion (BIC) ( vs. ) tests. The best fit early slope is comparable to the typical duration of the recent bursts (French et al. 2018a) and may be a continuation of the decline in SFR as the burst ended. Given the uncertainties on the derived parameters, the early and late slopes are significantly different. In contrast, fitting the same two-component function to the CO-traced gas fraction - age comparison, there is no significant difference between the early and late slope. We see no evidence to support a two-phase evolution in the decline of the CO-traced gas with time. These lines are overplotted on Figure 11.
The dense molecular gas to total molecular gas fraction, traced by the / ratio, is proportional to the fraction of the molecular gas reservoir in the denser states probed by HCO+. In several cases, the post-starburst galaxies show evidence that the luminosity is enhanced relative to the , similar to many AGN and ULIRGs (see further discussion in §III.6), so we consider here as a more accurate tracer of the dense gas mass. Most (5/6) of the post-starburst galaxies have low (/ ) fractions, except for R02, which is the youngest post-starburst galaxy in our ALMA-targeted sample. This may indicate a rapid ( Myr) decline in the dense gas fraction at the start of the starburst, but a larger sample will be required to determine whether this trend is significant, as it is driven by the observations for a single galaxy. If we instead consider the dense gas to stellar mass fraction, using an (K km s-1 pc2)-1, 66 6 The conversion factor will scale as , where is the density of H2 molecules and the brightness temperature (Papadopoulos 2007). Gao & Solomon 2004a use this argument to estimate the conversion factor for HCN given the expected conditions, resulting in a value of (K km s-1 pc2)-1. The dense gas luminosity to mass conversion factor should be similar for both HCO+ and HCN (1–0), as they trace similar gas conditions, so we use this same conversion factor for HCO+. The result shown in Figure 11 will only be affected by differences in if there is significant variation from source to source. this rapid decline is not observed. These differing trends may be caused by scatter in the CO-traced gas fraction amongst the sample. Observations of a larger sample will be required to determine whether the dense molecular gas has a rapid early decline similar to that seen in the sSFR, or a slower decline throughout the post-starburst phase more like the evolution seen in the CO-traced gas.

III.5 Star Formation in the Dense Gas
Previous work on the dense gas in post-starburst galaxies were motivated by the high CO luminosities relative to the low SFRs. In Figure 12, we plot vs. SFR for post-starburst galaxies and comparison samples of other galaxy types. The comparison star-forming and starbursting galaxies from Gao & Solomon 2004b, sub-regions of nearby star-forming galaxies from Usero et al. 2015 and early type galaxies from Crocker et al. 2012 show SFRs highly correlated with luminosities, despite the varying ranges of stellar masses and redshifts. We consider the H-traced SFRs for the post-starburst sample here; the impact of SFR tracer on our results is explored further in SIV.1 and in Appendix B. The post-starburst galaxies are systematically offset to higher relative to other quiescent galaxies (French et al. 2015). The two highest SFR post-starbursts shown are R02 and R05, from the Rowlands et al. 2015 sample, which uses a different selection method (see §II.1). These are also the youngest post-starburst galaxies considered here and have values consistent with the SFRs. The location of these young post-starbursts on the –SFR relation is consistent with the evolution of the star formation efficiency () seen by Li et al. 2019.

Our previous study of the dense gas in two post-starburst galaxies (French et al. 2018b, H02, S05) found low limits on and , consistent with their low SFRs. Here, we primarily consider the instead of to trace the dense gas, as the HCN is likely overestimating the dense gas mass (see further discussion in §III.6), although both are shown in Figures 12 and 13. For the four new post-starburst galaxies targeted in this study, we find that the two young post-starburst galaxies from the Rowlands et al. 2015 parent sample (R02 and R05) also have dense gas luminosities consistent with their SFRs (Figure 12). For the two older post-starburst galaxies from the French et al. 2015 parent sample, S02 is not detected in either HCN or HCN, at levels either consistent with its low SFR or slightly above. H03 remains offset from the –SFR relation, but the SFR of this galaxy is highly uncertain (see discussion in §IV.1).
We consider the ratio of dense molecular gas to total molecular gas traced by / in Figure 13. 5/6 of the post-starburst galaxies have low values of /, lower than at least 63% of the comparison galaxies, except for the youngest post-starburst galaxy in the sample, R02. As discussed in §III.4, this may be an evolutionary effect with post-burst age. In French et al. 2018b, we observed low HCN/CO ratios from two of the HCN limits plotted here. With the addition of the four new galaxies, as well as the addition of the comparison sample of star-forming galaxy components from Usero et al. 2015, we see that 5/6 of the post-starbursts have low HCN/CO ratios relative to the comparison samples, though there are some star-forming galaxy components with lower HCN/CO ratios. 5/6 of the post-starburst galaxies have HCN/CO ratios lower than at least 70% of the comparison samples, with the exception of H03. The post-starburst galaxy with high HCN/CO (H03) may have HCN luminosity increased via mechanical heating or cosmic ray heating, as it has a very high HCN/HCO ratio (see discussion in §III.6). Given the low HCO luminosity of this galaxy, it is likely that the dense gas fraction is low. We also compare the HCO/CO and HCN/CO ratios for the post-starbursts and comparison samples using a Mann-Whitney U test (Mann & Whitney 1947). We can exclude the possibility that the post-starbursts and comparison samples are drawn from the same distribution in HCO/CO at the level, but cannot exclude the possibility that the HCN/CO distributions are the same. The HCN/CO distributions may be more difficult to distinguish due to the high HCN/CO ratio observed for H03.

III.6 Dense Gas State

Ratios between the dense gas tracers HCN, HCO, and HNC (1–0) are sensitive to various mechanisms that affect the reliability of these lines as tracers of the dense gas mass. AGN and some ULIRGs have high HCN/HCO ratios (Kohno et al. 2001; Imanishi et al. 2004; Imanishi et al. 2007; Privon et al. 2015), which have been attributed to IR pumping, XDR (X-ray dominated region)-dominated chemistry, mechanical heating, or cosmic ray heating (Aalto et al. 2007; Loenen et al. 2008; Meijerink et al. 2011; Bayet et al. 2011; Privon et al. 2015; Privon et al. 2020).
We compare the HCN/HCO ratios of the three post-starburst galaxies with both line measurements with other types of galaxies in Figure 14. The HCN/HCO ratios of the post-starburst galaxies vary considerably, with scatter across the entire sample of comparison galaxies. This scatter is much larger than the uncertainty on the line ratio measurements. One of the PSBs (H03) has a very high HCN/HCO ratio (low HCO+/HCN), even compared to AGN and ULIRGs.
The HNC/HCN ratio is sensitive to the ionization state of the ISM, and can distinguish XDRs from PDRs (photon dominated regions). We plot the comparison of the HCN, HCO, and HNC (1–0) ratios in Figure 15. The PSBs have similar HNC/HCN values as most of the comparison starbursts and star-forming galaxies, and are consistent with PDR-dominated ionization.

IV Discussion
IV.1 Star Formation Rates
The measurement of current SFRs in post-starburst galaxies is complicated by a number of factors (see discussion in French 2021 §5). For this work, our goal is to measure the current SFR (over timescales Myr), with low contamination from other sources of excitation, and with accurate correction applied for dust extinction. Contamination from the young stellar populations, AGN, and shocks would cause SFRs to be over-estimated, while high dust obscuration beyond that probed by Balmer decrement corrections would cause the SFRs to be under-estimated. We consider here the comparison of the H-based SFRs used above (described in §II.3) to other SFR tracers to assess the possible biases in these measurements.
The combination of the [NeII] 12.8m and [NeIII] 15.6m lines traces HII regions with relatively low bias compared to other SFR tracers (Ho & Keto 2007; Whitcomb et al. 2020). Dust extinction scales as in the near- and mid-IR; using the extinction law measured by (Wang & Chen 2019), the extinction at the wavelengths of [NeII] and [NeIII] is lower than . Thus, the Neon-based SFRs will not be subject to underestimation due to dust obscuration, even in galaxies with ULIRG-like central dust obscuration. Smercina et al. 2018 measured Neon-based SFRs for a sample of 15 post-starburst galaxies, two of which (S02 and S05) are studied in this work. We compare the Neon-based SFRs to H-based SFRs in Figure 16. For the sample of seven post-starburst galaxies with Neon detections, we observe no systematic bias between the H- and Neon-based SFRs. Of the two galaxies considered here, the measurements of S02 agree well, and the Neon-based SFR for S05 is lower than the H SFR. This indicates that neither galaxy has significant obscured star formation. In section B, we consider the impact of using Neon-based SFRs on the Kennicutt-Schmidt relation, finding the post-starburst galaxies to lie offset from the relation formed by star forming and starburst galaxies, consistent with the results from using H-based SFR tracers.
The TIR luminosity is also sensitive to obscured star formation, yet the TIR traces star formation on longer timescales, which can be comparable to the time since the recent starburst. Smercina et al. 2018 found that TIR-based SFRs overestimate the SFR traced by Neon for post-starburst galaxies. For the seven post-starburst galaxies with Neon detections and eight galaxies with upper limits, the ratio of SFR-TIR to SFR-Neon is . Luo et al. 2022 observed a TIR-based SFR 20 higher than the Neon-based SFR for the post-starburst galaxy IC 860. In Figure 17, we compare the SFRs from TIR and Neon for post-starburst galaxies, stacks of starbursting galaxies with varying AGN properties from Stone et al. 2022, and the best-fit relation from star-forming galaxies from Ho & Keto 2007. Each of the Neon-detected post-starburst galaxies and all but one of the upper limits are consistent with SFR-TIR SFR-Neon. In contrast, the starburst galaxy stacks from Stone et al. 2022 scatter evenly around the Ho & Keto 2007 relation calibrated on star-forming galaxies. We use linmix (Kelly 2007) to further quantify the offset observed for the post-starburst sample (including IC 860) by fitting a linear relation to log(SFR-TIR) vs. log(SFR-Neon). If we consider only the post-starburst galaxies with Neon detections, the best-fit line indicates a factor offset below the 1:1 line, consistent with our estimate from the median values. If we include information from the upper limits for Neon non-detections, the best fit line indicates a factor offset for the range of SFR-TIR values77 7 Excluding IC 860, we observe a offset for the Neon detections and a offset for the censored fit including non-detections.. This comparison suggests the TIR overestimates the SFR that would be measured with the Neon lines by in post-starburst galaxies. Because this effect is not present in the starbursting sample, it may be due to the longer duration of TIR as a SFR tracer being contaminated by the recent starburst for the post-starburst galaxies. For the analysis of SFR-TIR of the post-starburst galaxies, we thus adopt a correction factor to decrease the SFR-TIR by a factor of 2.
We compare the H-based SFRs to TIR-based SFRs from Smercina et al. 2018 for the galaxies from French et al. 2015 and full SED fit SFRs (including Herschel photometry) from Rowlands et al. 2015 for R02 and R05 in Figure 16. The TIR-based SFRs are divided by a factor of two as described above, to account for the likely overestimate due to the longer duration of this tracer. With this correction, there is no systematic bias between the two SFR indicators, although the scatter is large. We note that for H02 and H03, the large offset indicates there may be obscured star formation. Recently, Baron et al. 2022 found that some samples of post-starburst galaxies have high SFRs M⊙ yr-1 when traced by their IR luminosity. The samples most heavily affected are post-starburst samples chosen to optimize for young post-starburst ages or to not select against AGN activity. We note that the SFRs for the post-starburst galaxies considered here have significantly lower SFRs, even using the highest estimates from the TIR luminosity.
We compare the H-based SFRs to 1.4 GHz based SFRs using data from the VLA FIRST survey (Becker et al. 1995). We convert the 1.4 GHz fluxes and flux limits to SFRs following Nielsen et al. 2012 by using the calibrations from Condon 1992; Yun et al. 2001. Of the galaxies considered here, R02, R05, and H03 are detected by FIRST, and the rest of the galaxies are not detected. The 1.4 GHz flux is likely to be contaminated by any AGN or LINER activity in the post-starbust sample (Morić et al. 2010, e.g.,), especially for H03, given the large offset between the 1.4 GHz and Br indicators.
Another infrared line used to calculate SFRs with minimal effects from dust attenuation is the Br line (Pasha et al. 2020, see). We have conducted a survey of NIR spectroscopy of the parent samples considered here from French et al. 2015; Rowlands et al. 2015; Smercina et al. 2018 using Magellan/FIRE (Tripathi, French et al. in preparation). Using the calibration from Kennicutt 1998, we compare the Br SFRs to the H SFRs in Figure 16. Br is detected for R02 and R05. Our data provide useful upper limits on the SFRs for H03 and S0288 8 Unfortunately, the faint K-band magnitude of H02 prohibited its inclusion in the FIRE sample.. Despite the high SFR M⊙ yr-1 for H03 that would be inferred from its TIR or 1.4 GHz luminosities, H03 is not detected in Br, at a level consistent with its H flux. This unusual TIR/Br ratio is not seen for other galaxies, even those with extremely high extinction like Arp 220 (Pasha et al. 2020). Further observations, especially Near- and Mid- IR spectroscopy, will be required of these sources to determine the origin of the dust heating. While in French et al. 2018b we assigned an upper limit on the SFR for H02, here we use the H-based SFRs throughout, motivated by the consistency with the Br observations.
The Neon-based SFRs are the best available SFR tracer for this sample, as the Neon lines can trace obscured star formation even at the levels of ULIRGs, the contamination from other excitation sources is low, and the timescale for this SFR tracer is much shorter than the typical post-starburst ages (Ho & Keto 2007; Smercina et al. 2018). Unfortunately, mid-IR spectroscopy is required for this measurement, and not available for the entire sample considered here. We use the cases where both Neon and H SFRs are available to test the H SFRs for bias (Figure 16) and find the two tracers to be consistent. This consistency indicates that the post-starburst galaxy samples considered here do not typically have obscured star formation missed by the H tracer corrected using the Balmer decrement. Two galaxies (H02 and H03) have strong mismatches between the TIR SFR and H SFR, yet do not have mid-IR spectroscopy for which a Neon SFR can be measured. For one of these galaxies (H03), we have a strong limit on the Br SFR, which is consistent with H. While Br is less sensitive to dust obscuration than H, ULIRG-like central dust densities could still obscure a nuclear star-forming region. Such a mismatch between a quiescent host galaxy and a nuclear starburst would be unusual, as LIRGs and ULIRGs have star-forming regions visible outside of the central regions with high dust obscuration, but we cannot fully rule out the possibility of an obscured region with SFR M⊙ yr-1 in H02 and H03.
In order to assess the impact of SFR tracer on our conclusions, we reproduce the key figures in this work using the TIR-based SFRs in Appendix §B. The SFRs for four galaxies (S02, S05, R02, R05) are comparable, while the SFRs for two galaxies (H02 and H03) are higher. Considering the TIR SFRs instead of the H SFRs, our qualitative conclusions do not change. We find that the post-starburst galaxies still lie offset from the Kennicutt-Schmidt relation, and have high yet consistent and values for their SFRs.


IV.2 Interpretation
As galaxies evolve through the post-starburst phase, the galaxies with remaining molecular gas remaining experience an unusual transition in their gas properties. The gas is confined to the central kpc, more limited in extent than the optical light or even the young stellar populations. Yet the gas state is such that the typical density is low, as traced by both the lack of strong dense gas emission and by the low CO excitation. What then is suppressing this gas from collapsing to denser states?
The low CO excitation indicates that the bulk of the molecular gas is not being heated. The outflow observed in S02, as well as the outflow observed in CO (2–1) by Smercina et al. 2022 for another post-starburst, provide a clue that relatively low velocity outflows, lower than or close to the escape velocity, may prevent the gas from re-collapsing. The origin of these outflows is still unclear. We observe no strong AGN activity in these galaxies, yet because the timescale for AGN to vary is shorter than the timescale for us to observe these outflows, past AGN activity may have launched these outflows. Alternatively, weak, low-level AGN activity (if the LINER is a low luminosity AGN) may be enough to sustain quiescence during this phase and deplete the gas over 1–2 Gyr. If weak AGN activity is currently affecting these galaxies, it must be at such a low level as to not result in high CO excitation and not drive AGN-like emission line ratio maps. We speculate that if the energy coupling of TDEs to the molecular gas is efficient compared to AGN energy coupling, the high TDE rate during this phase may act to provide the energy source needed to keep this gas from collapsing to denser states and forming stars (Smercina et al. 2022, see further discussion in).
A key test for models of feedback in simulations aiming to re-create the galaxy population, including galaxies with rapidly-ending star formation, will be to predict the detailed evolution of the densest gas on scales of cm-3 and at cold temperatures K.
V Conclusions
Observations of large fractions of molecular gas remaining in galaxies with recently-ended starbursts have raised questions of what mechanisms act to drive galaxies to quiescence. In this study, we present new observations of CO (3–2) observations for three post-starburst galaxies and dense gas tracers for four post-starburst galaxies, combining with literature measurements for a total dense gas sample size of six.
- 1.
The post-starbursts have low excitation as traced by the CO spectral line energy distribution (SLED) up to CO (3–2), more similar to early-type than starburst galaxies. The low excitation indicates that lower density rather than high temperatures may suppress star formation during the post-starburst phase, as higher temperatures would result in excitation states more like starbursts. Radiative transfer modelling with RADEX supports this picture; the RADEX models favor low densities () and temperatures ( K), similar to early type galaxies and lower than typical starbursts. The low CO excitation is in contrast with the high ISRF intensity (and thus high dust temperatures) in these galaxies, suggesting the molecular gas temperature is decoupled from the dust.
- 2.
The post-starburst galaxies have small CO (3–2) sizes ( pc) compared to their optical sizes. The CO (3–2) sizes are on average 6.3 smaller than the -band optical sizes from SDSS images. This result is consistent with the findings of Smercina et al. 2022.
- 3.
Post-starburst galaxies have high molecular gas surface densities for their star formation rate surface densities, resulting in an offset from the Kennicutt-Schmidt relation, consistent with the findings of Smercina et al. 2022. We find this same result using both optical (H) and infrared SFR tracers (TIR luminosity and [NeII] 12.8m + [NeIII] 15.6m), indicating that this offset is not driven by the presence of dust-obscured star formation.
- 4.
One galaxy (S02) displays a blueshifted molecular gas outflow traced by CO (3–2). This galaxy has complementary HST and MaNGA observations, facilitating multiwavelength comparisons. The MaNGA observations show the ionized gas velocity is disturbed relative to the stellar velocity field, with a blueshifted component aligned with the molecular gas outflow, indicative of a possible multiphase outflow. The inferred mass loss rate is consistent with the CO depletion observed statistically in French et al. 2018a. The energy required to drive this outflow is consistent with lower luminosity AGN/LINERs or TDEs. The feasibility of energy from intermittent AGN activity or from TDEs will depend heavily on the coupling to the molecular gas in these galaxies.
- 5.
Low ratios of HCO+/CO, indicating low fractions of dense molecular gas relative to the total molecular gas, are seen throughout the post-starburst phase beginning 10-200 Myr after burst ends for 5/6 post-starbust galaxies. Most post-starbursts have low HCO+/CO ratios; the exception is the youngest post-starburst in our sample, suggesting early evolution. Rapid evolution in the dense gas would be consistent with the rapid evolution in sSFR during the early post-starburst phase. However, observations of a larger sample will be required to determine whether the dense molecular gas has a rapid early decline similar to that seen in the sSFR, or a slower decline throughout the post-starburst phase, more like the evolution seen in the CO-traced gas.
- 6.
Post-starburst galaxies have low -traced dense gas luminosities more consistent with their low SFRs than the CO luminosities would indicate, with the exception of the post-starburst galaxy H03 which has a highly uncertain SFR. This is consistent with our previous work (French et al. 2018b) and indicates that the low SFRs in the post-starburst phase are due to a lack of dense gas, in contrast to the large masses of total molecular gas traced by CO (1–0) (French et al. 2015; Rowlands et al. 2015; Alatalo et al. 2016). Our qualitative conclusions do not depend on the SFR tracer used.
- 7.
The three post-starbursts with measured HCN/HCO+ ratios show a large variation, spanning the entire range shown by AGN, ULIRGs, and star forming galaxies. This may be due to a range of either mechanical heating or cosmic ray heating of the HCN, but the origin is uncertain.
References
- Aalto et al. (2012) Aalto, S., Garcia-Burillo, S., Muller, S., et al. 2012, Astronomy and Astrophysics, 537, 44
- Aalto et al. (2007) Aalto, S., Spaans, M., Wiedner, M. C., & Hüttemeister, S. 2007, A&A, 464, 193
- Alatalo et al. (2016) Alatalo, K., Lisenfeld, U., Lanz, L., et al. 2016, The Astrophysical Journal, 827, 106
- Astropy Collaboration et al. (2013) Astropy Collaboration, Robitaille, T. P., Tollerud, E. J., et al. 2013, A&A, 558, A33
- Astropy Collaboration et al. (2018) Astropy Collaboration, Price-Whelan, A. M., Sipőcz, B. M., et al. 2018, AJ, 156, 123
- Baan et al. (2008) Baan, W. A., Henkel, C., Loenen, A. F., Baudry, A., & Wiklind, T. 2008, Astronomy & Astrophysics, 477, 747
- Baldwin et al. (1981) Baldwin, J. A., Phillips, M. M., & Terlevich, R. 1981, PASP, 93, 5
- Baron & Netzer (2019) Baron, D., & Netzer, H. 2019, MNRAS, 486, 4290
- Baron et al. (2022) Baron, D., Netzer, H., Lutz, D., Prochaska, J. X., & Davies, R. I. 2022, MNRAS, 509, 4457
- Bayet et al. (2011) Bayet, E., Williams, D. A., Hartquist, T. W., & Viti, S. 2011, MNRAS, 414, 1583
- Bayet et al. (2013) Bayet, E., Bureau, M., Davis, T. A., et al. 2013, MNRAS, 432, 1742
- Becker et al. (1995) Becker, R. H., White, R. L., & Helfand, D. J. 1995, ApJ, 450, 559
- Belli et al. (2019) Belli, S., Newman, A. B., & Ellis, R. S. 2019, The Astrophysical Journal, 874, 17
- Bezanson et al. (2021) Bezanson, R., Spilker, J. S., Suess, K. A., et al. 2021, arXiv e-prints, arXiv:2111.14877
- Bournaud et al. (2015) Bournaud, F., Daddi, E., Weiß, A., et al. 2015, A&A, 575, A56
- Brinchmann et al. (2004) Brinchmann, J., Charlot, S., White, S. D. M., et al. 2004, MNRAS, 351, 1151
- Bundy et al. (2015) Bundy, K., Bershady, M. A., Law, D. R., et al. 2015, ApJ, 798, 7
- Carilli & Walter (2013) Carilli, C. L., & Walter, F. 2013, ARA&A, 51, 105
- Cherinka et al. (2019) Cherinka, B., Andrews, B. H., Sánchez-Gallego, J., et al. 2019, AJ, 158, 74
- Cicone et al. (2014) Cicone, C., Maiolino, R., Sturm, E., et al. 2014, A&A, 562, A21
- Condon (1992) Condon, J. J. 1992, ARA&A, 30, 575
- Costagliola et al. (2011) Costagliola, F., Aalto, S., Rodriguez, M. I., et al. 2011, A&A, 528, A30
- Couch & Sharples (1987) Couch, W. J., & Sharples, R. M. 1987, Monthly Notices of the Royal Astronomical Society, 229, 423
- Crocker et al. (2012) Crocker, A., Krips, M., Bureau, M., et al. 2012, Monthly Notices of the Royal Astronomical Society, 421, 1298
- Croton et al. (2006) Croton, D. J., Springel, V., White, S. D. M., et al. 2006, MNRAS, 365, 11
- de los Reyes & Kennicutt (2019) de los Reyes, M. A. C., & Kennicutt, Robert C., J. 2019, ApJ, 872, 16
- D’Eugenio et al. (2020) D’Eugenio, F., van der Wel, A., Wu, P.-F., et al. 2020, MNRAS, 000, 1
- Di Matteo et al. (2005) Di Matteo, T., Springel, V., & Hernquist, L. 2005, Nature, 433, 604
- Di Teodoro & Fraternali (2015) Di Teodoro, E. M., & Fraternali, F. 2015, MNRAS, 451, 3021
- Draine & Li (2007) Draine, B. T., & Li, A. 2007, ApJ, 657, 810
- Draine et al. (2007) Draine, B. T., Dale, D. A., Bendo, G., et al. 2007, ApJ, 663, 866
- Dressler & Gunn (1983) Dressler, A., & Gunn, J. E. 1983, The Astrophysical Journal, 270, 7
- French (2021) French, K. D. 2021, PASP, 133, 072001
- French et al. (2016) French, K. D., Arcavi, I., & Zabludoff, A. 2016, ApJ, 818, L21
- French et al. (2020) French, K. D., Wevers, T., Law-Smith, J., Graur, O., & Zabludoff, A. I. 2020, Space Sci. Rev., 216, 32
- French et al. (2015) French, K. D., Yang, Y., Zabludoff, A., et al. 2015, The Astrophysical Journal, 801, 1
- French et al. (2018a) French, K. D., Yang, Y., Zabludoff, A. I., & Tremonti, C. A. 2018a, The Astrophysical Journal, 862, 2
- French et al. (2018b) French, K. D., Zabludoff, A. I., Yoon, I., et al. 2018b, The Astrophysical Journal, 861, 123
- Gao & Solomon (2004a) Gao, Y., & Solomon, P. M. 2004a, The Astrophysical Journal Supplement Series, 152, 63
- Gao & Solomon (2004b) —. 2004b, The Astrophysical Journal, 606, 271
- Greve et al. (2009) Greve, T. R., Papadopoulos, P. P., Gao, Y., & Radford, S. J. E. 2009, ApJ, 692, 1432
- Harris et al. (2020) Harris, C. R., Millman, K. J., van der Walt, S. J., et al. 2020, Nature, 585, 357
- Ho & Keto (2007) Ho, L. C., & Keto, E. 2007, ApJ, 658, 314
- Hunter (2007) Hunter, J. D. 2007, Computing in Science & Engineering, 9, 90
- Imanishi et al. (2004) Imanishi, M., Nakanishi, K., Kuno, N., & Kohno, K. 2004, AJ, 128, 2037
- Imanishi et al. (2007) Imanishi, M., Nakanishi, K., Tamura, Y., Oi, N., & Kohno, K. 2007, AJ, 134, 2366
- Jiménez-Donaire et al. (2019) Jiménez-Donaire, M. J., Bigiel, F., Leroy, A. K., et al. 2019, ApJ, 880, 127
- Kamenetzky et al. (2018) Kamenetzky, J., Privon, G. C., & Narayanan, D. 2018, ApJ, 859, 9
- Kauffmann et al. (2003) Kauffmann, G., Heckman, T. M., Tremonti, C., et al. 2003, MNRAS, 346, 1055
- Keel et al. (2012) Keel, W. C., Chojnowski, S. D., Bennert, V. N., et al. 2012, MNRAS, 420, 878
- Kelly (2007) Kelly, B. C. 2007, ApJ, 665, 1489
- Kennicutt (1998) Kennicutt, Robert C., J. 1998, ApJ, 498, 541
- Kennicutt & De Los Reyes (2021) Kennicutt, Robert C., J., & De Los Reyes, M. A. C. 2021, ApJ, 908, 61
- Kewley et al. (2001) Kewley, L. J., Dopita, M. A., Sutherland, R. S., Heisler, C. A., & Trevena, J. 2001, ApJ, 556, 121
- Kohno et al. (2001) Kohno, K., Matsushita, S., Vila-Vilaró, B., et al. 2001, in Astronomical Society of the Pacific Conference Series, Vol. 249, The Central Kiloparsec of Starbursts and AGN: The La Palma Connection, ed. J. H. Knapen, J. E. Beckman, I. Shlosman, & T. J. Mahoney, 672
- Krips et al. (2008) Krips, M., Neri, R., García-Burillo, S., et al. 2008, ApJ, 677, 262
- Krips et al. (2011) Krips, M., Martín, S., Eckart, A., et al. 2011, ApJ, 736, 37
- Law et al. (2016) Law, D. R., Cherinka, B., Yan, R., et al. 2016, AJ, 152, 83
- Leroy et al. (2021) Leroy, A. K., Rosolowsky, E., Usero, A., et al. 2021, arXiv e-prints, arXiv:2109.11583
- Li et al. (2019) Li, Z., French, K. D., Zabludoff, A. I., & Ho, L. C. 2019, The Astrophysical Journal, 879, 131
- Liu et al. (2021) Liu, D., Daddi, E., Schinnerer, E., et al. 2021, ApJ, 909, 56
- Loenen et al. (2008) Loenen, A. F., Spaans, M., Baan, W. A., & Meijerink, R. 2008, Astronomy and Astrophysics, 488, L5
- Luo et al. (2022) Luo, Y., Rowlands, K., Alatalo, K., et al. 2022, arXiv e-prints, arXiv:2208.08379
- Mann & Whitney (1947) Mann, H. B., & Whitney, D. R. 1947, The Annals of Mathematical Statistics, 18, 50
- McMullin et al. (2007) McMullin, J. P., Waters, B., Schiebel, D., Young, W., & Golap, K. 2007, in Astronomical Society of the Pacific Conference Series, Vol. 376, Astronomical Data Analysis Software and Systems XVI, ed. R. A. Shaw, F. Hill, & D. J. Bell, 127
- Meijerink et al. (2011) Meijerink, R., Spaans, M., Loenen, A. F., & van der Werf, P. P. 2011, A&A, 525, A119
- Mockler & Ramirez-Ruiz (2021) Mockler, B., & Ramirez-Ruiz, E. 2021, ApJ, 906, 101
- Morić et al. (2010) Morić, I., Smolčić, V., Kimball, A., et al. 2010, ApJ, 724, 779
- Narayanan & Krumholz (2014) Narayanan, D., & Krumholz, M. R. 2014, MNRAS, 442, 1411
- Nielsen et al. (2012) Nielsen, D. M., Ridgway, S. E., De Propris, R., & Goto, T. 2012, The Astrophysical Journal, 761, L16
- Papadopoulos (2007) Papadopoulos, P. P. 2007, ApJ, 656, 792
- Papadopoulos et al. (2012) Papadopoulos, P. P., van der Werf, P., Xilouris, E., Isaak, K. G., & Gao, Y. 2012, The Astrophysical Journal, 751, 10
- Pasha et al. (2020) Pasha, I., Leja, J., van Dokkum, P. G., Conroy, C., & Johnson, B. D. 2020, ApJ, 898, 165
- Pawlik et al. (2015) Pawlik, M. M., Wild, V., Walcher, C. J., et al. 2015, Monthly Notices of the Royal Astronomical Society, 456, 3032
- Pellegrini et al. (2013) Pellegrini, E. W., Smith, J. D., Wolfire, M. G., et al. 2013, ApJ, 779, L19
- Privon et al. (2015) Privon, G. C., Herrero-Illana, R., Evans, A. S., et al. 2015, ApJ, 814, 39
- Privon et al. (2020) Privon, G. C., Ricci, C., Aalto, S., et al. 2020, ApJ, 893, 149
- Rich et al. (2015) Rich, J. A., Kewley, L. J., & Dopita, M. A. 2015, ApJS, 221, 28
- Rowlands et al. (2015) Rowlands, K., Wild, V., Nesvadba, N., et al. 2015, Monthly Notices of the Royal Astronomical Society, 448, 258
- Rowlands et al. (2018) Rowlands, K., Wild, V., Bourne, N., et al. 2018, MNRAS, 473, 1168
- Salim et al. (2007) Salim, S., Rich, R. M., Charlot, S., et al. 2007, ApJS, 173, 267
- Sartori et al. (2018) Sartori, L. F., Schawinski, K., Trakhtenbrot, B., et al. 2018, MNRAS, 476, L34
- Sarzi et al. (2010) Sarzi, M., Shields, J. C., Schawinski, K., et al. 2010, MNRAS, 402, 2187
- Sazonova et al. (2021) Sazonova, E., Alatalo, K., Rowlands, K., et al. 2021, ApJ, 919, 134
- Schawinski et al. (2014) Schawinski, K., Urry, C. M., Simmons, B. D., et al. 2014, MNRAS, 440, 889
- Shen (2021) Shen, Y. 2021, arXiv e-prints, arXiv:2108.05381
- Shirley (2015) Shirley, Y. L. 2015, Publications of the Astronomical Society of the Pacific, 127, 299
- Smercina et al. (2018) Smercina, A., Smith, J. D. T., Dale, D. A., et al. 2018, The Astrophysical Journal, 855, 51
- Smercina et al. (2022) Smercina, A., Smith, J.-D. T., French, K. D., et al. 2022, ApJ, 929, 154
- Snyder et al. (2011) Snyder, G. F., Cox, T. J., Hayward, C. C., Hernquist, L., & Jonsson, P. 2011, The Astrophysical Journal, 741, 77
- Stierwalt et al. (2013) Stierwalt, S., Armus, L., Surace, J. A., et al. 2013, ApJS, 206, 1
- Stone et al. (2022) Stone, M., Pope, A., McKinney, J., et al. 2022, ApJ, 934, 27
- Strauss et al. (2002) Strauss, M. A., Weinberg, D. H., Lupton, R. H., et al. 2002, AJ, 124, 1810
- Suess et al. (2021) Suess, K. A., Kriek, M., Bezanson, R., et al. 2021, arXiv e-prints, arXiv:2111.14878
- Togi & Smith (2016) Togi, A., & Smith, J. D. T. 2016, ApJ, 830, 18
- Tremonti et al. (2004) Tremonti, C. A., Heckman, T. M., Kauffmann, G., et al. 2004, ApJ, 613, 898
- Usero et al. (2015) Usero, A., Leroy, A. K., Walter, F., et al. 2015, The Astronomical Journal, Volume 150, Issue 4, article id. 115, 40 pp. (2015)., 150, arXiv:1506.00703
- Valentino et al. (2020) Valentino, F., Daddi, E., Puglisi, A., et al. 2020, A&A, 641, A155
- van de Voort et al. (2018) van de Voort, F., Davis, T. A., Matsushita, S., et al. 2018, MNRAS, 476, 122
- van der Tak et al. (2007) van der Tak, F. F. S., Black, J. H., Schöier, F. L., Jansen, D. J., & van Dishoeck, E. F. 2007, A&A, 468, 627
- Veilleux et al. (2005) Veilleux, S., Cecil, G., & Bland-Hawthorn, J. 2005, ARA&A, 43, 769
- Wang & Chen (2019) Wang, S., & Chen, X. 2019, ApJ, 877, 116
- Weiß et al. (2007) Weiß, A., Downes, D., Neri, R., et al. 2007, A&A, 467, 955
- Westfall et al. (2019) Westfall, K. B., Cappellari, M., Bershady, M. A., et al. 2019, AJ, 158, 231
- Whitaker et al. (2012) Whitaker, K. E., Kriek, M., van Dokkum, P. G., et al. 2012, The Astrophysical Journal, 745, 179
- Whitcomb et al. (2020) Whitcomb, C. M., Sandstrom, K., Murphy, E. J., & Linden, S. 2020, ApJ, 901, 47
- Wild et al. (2016) Wild, V., Almaini, O., Dunlop, J., et al. 2016, Monthly Notices of the Royal Astronomical Society, 463, 832
- Wild et al. (2010) Wild, V., Heckman, T., & Charlot, S. 2010, MNRAS, 405, 933
- Wild et al. (2007) Wild, V., Kauffmann, G., Heckman, T., et al. 2007, Monthly Notices of the Royal Astronomical Society, 381, 543
- Wild et al. (2009) Wild, V., Walcher, C. J., Johansson, P. H., et al. 2009, Monthly Notices of the Royal Astronomical Society, 395, 144
- Wild et al. (2020) Wild, V., Taj Aldeen, L., Carnall, A., et al. 2020, MNRAS, 494, 529
- Yan & Blanton (2012) Yan, R., & Blanton, M. R. 2012, ApJ, 747, 61
- Yun et al. (2001) Yun, M. S., Reddy, N. A., & Condon, J. J. 2001, ApJ, 554, 803
- Zabludoff et al. (1996) Zabludoff, A. I., Zaritsky, D., Lin, H., et al. 1996, The Astrophysical Journal, 466, 104
Appendix A Spectra and Moment Maps
Moment maps for the both the CO (3–2) and HCN (1–0), HCO+ (1–0), and HNC (1–0) datasets are shown in Figures 18 and 19. Extracted spectra are shown in Figures 20 and 21. More information can be found in §II.2.


Appendix B Infrared Star Formation Rates
In Figures 22, 23 and 24, we consider the impact of using the TIR luminosity instead of H to trace the SFR in the post-starburst sample. A full comparison of the SFR tracers for this sample can be found in §IV.1. Our qualitative conclusions do not change, given this sample. We observe the post-starburst galaxies to lie offset in the CO-traced gas vs. SFR plot, while they lie consistent with the comparison samples in the HCO+ vs. SFR plot. Even when using the TIR luminosity as a SFR tracer, the offset observed in the left panel of Figure 23 is significant. Even if all of the CO upper limits placed the CO non-detected post-starbursts above the relation, with high star formation efficiencies, the chances of finding as many post-starbursts with low SFE yr-1 is low. Using the star-forming, starbursting, and early type galaxies to define the range of expected SFE and scatter, we use a Monte Carlo analysis to determine that we would find the large fraction of low SFE post-starbursts only 1.7% of the time.


