ALMA Survey of Orion Planck Galactic Cold Clumps (ALMASOP): How do dense core properties affect the multiplicity of protostars?Facilities: ALMA, JCMT, No: 45mastropy (Astropy Collaboration et al. 2013), CASA (McMullin et al. 2007), Starlink (Currie et al. 2014), MiSTree (Naidoo 2019)
Abstract
During the transition phase from a prestellar to a protostellar cloud core, one or several protostars can form within a single gas core. The detailed physical processes of this transition, however, still remain unclear. We present 1.3 mm dust continuum and molecular line observations with the Atacama Large Millimeter/submillimeter Array (ALMA) toward 43 protostellar cores in the Orion Molecular Cloud Complex ( Orionis, Orion B, and Orion A) with an angular resolution of 035 ( 140 au). In total, we detect 13 binary/multiple systems. We derive an overall multiplicity frequency (MF) of 28 4 and a companion star fraction (CSF) of 51 6, over a separation range of 300-8900 au. The median separation of companions is about 2100 au. The occurrence of stellar multiplicity may depend on the physical characteristics of the dense cores. Notably, those containing binary/multiple systems tend to show higher gas density and Mach number than cores forming single stars. The integral-shaped filament (ISF) of Orion A giant molecular cloud (GMC), which has the highest gas density and hosts high-mass star formation in its central region (the Orion Nebula cluster), shows the highest MF and CSF among the Orion GMCs. In contrast, the Orionis Giant Molecular Cloud (GMC) has a lower MF and CSF than the Orion B and Orion A GMCs, indicating that feedback from Hii regions may suppress the formation of multiple systems. We also find that the protostars comprising a binary/multiple system are usually at different evolutionary stages.
Keywords:
stars: formation; stars: protostars; (stars:) binaries: general; ISM: jets and outflowsI Introduction
Molecular clouds exhibit hierarchical structures at different levels from large to small scales. Dense cores lie at the terminus where stars are born through gravitational fragmentation (Heggie 1975; Cohen & Kuhi 1979; Shu et al. 1987; Bergin & Tafalla 2007; Kraus & Hillenbrand 2012; Duchêne & Kraus 2013; Reipurth et al. 2014). Isolated star formation has been investigated for decades in the context of star formation (di Francesco et al. 2007). The formation of binary/multiple star systems, however, has been not as well studied, though these systems are commonly seen in star associations and clusters (Kraus & Hillenbrand 2012; Lomax et al. 2015; Lee et al. 2020; Dutta et al. 2020; Reipurth et al. 2014).
Binary/multiple systems in the main sequence have been studied for decades. Indeed, star systems that have more than one star are as common as single star systems in the Milky Way (Lippincott 1978; Marcy & Benitz 1989; Duquennoy & Mayor 1991; Connelley et al. 2009; Raghavan et al. 2010). Previous near-infrared observational studies have concentrated on the multiplicity statistics for young stellar objects (YSOs) (Haisch Jr. et al. 2004; Duchêne et al. 2004; Duchêne et al. 2007; Connelley et al. 2008; Kraus & Hillenbrand 2007; Kraus et al. 2011; Daemgen et al. 2015; Kounkel et al. 2016; Ma et al. 2019). The high occurrence rates of multiple YSO systems revealed in these studies imply that stellar multiplicity is determined in the star formation process. In these surveys, the fraction of stars having companions (CSF) ranges from 16 4 to 62 14, and the fraction of systems having multiple YSOs (MF) ranges from 18 4 to 75. In the past 10 years, high resolution interferometric observations with the Submillimeter Array(SMA), Very Large array (VLA), and Atacama Large Millimeter/submillimeter Array (ALMA) of nearby clouds have systematically revealed the multiplicity of low-mass protostars in still earlier phases, notably the Class 0/I phase (Chen et al. 2013; Lee et al. 2015; Hatziminaoglou et al. 2018). These observations indicate that the CSF ranges from 71 to 91 5 while MF ranges from the 40 to 60 for young protostars with separations below 10,000 au. Recently, higher angular resolution ALMA and VLA observations by Tobin et al. 2022 revealed the multiplicity of Orion protostars that were previously identified in the Herschel Orion Protostar Survey (HOPS): the CSF is 44 3 and the MF is 30 3.
Although different theoretical models of binary/multiple systems at various evolutionary stages have been proposed, e.g, turbulent fragmentation (Goodwin et al. 2004; Fisher 2004) and disk fragmentation (Adams et al. 1989; Bonnell & Bate 1994), the most relevant scenario remains unclear. Nevertheless, some predictions can be tested. For example, turbulent fragmentation suggests a non-linear gravitational collapse, resulting in wider-separation binary/multiple systems (above 1000 au). On the other hand, disk fragmentation caused by gravitational instability is more likely to generate closer (below 600 au) binary/multiple systems (Beichman et al. 1986; Raghavan et al. 2010; Reipurth et al. 2007; Cohen & Kuhi 1979; Reipurth et al. 2014).
In a multiplicity study of all known protostars (94) in the Perseus molecular cloud, Tobin et al. 2016 found a bimodal distribution of separation among binary/multiple systems, with peaks at 75 au and 3000 au. The bimodal distribution was recently confirmed by a more detailed analysis of protostar separations in the Orion and Perseus molecular clouds (Tobin et al. 2022). Based on these results, Tobin et al. 2022 suggest that multiples with small separations (500 au) are likely produced by both disk fragmentation and turbulent fragmentation with migration, and those with wide separation ( au) result primarily from turbulent fragmentation. Lee et al. 2017 found a low-mass binary system in the earliest stages of formation with the rotation axes of its disks misaligned, suggesting that this binary system is likely formed due to turbulent fragmentation. This system, however, has small separation (860 au), which has probably been decreased by the migration of the protostars (Lee et al. 2020). Further, Tobin et al. 2016 detected a close triple system that was likely formed out of a protostellar disk undergoing gravitational instability.
However, previous investigations have rarely addressed how the properties of the host dense cores affect stellar multiplicity, even though they may play an important role. In this work, we explore the relation between the physical characteristics of dense cores and the formation of single or multiple stellar systems. This paper is structured as follows: Section II introduces our sample, and Section III describes the observational data from the surveys we use in the paper. In Section IV, we report the results of multiplicity analysis in binary/multiple systems. Section V discusses the origin of multiplicity, environmental effects, and the physical and chemical differences among protostars. Section VI provides a summary.
II The Sample
The Planck survey detected 13,188 Planck Galactic cold clumps (PGCCs) across the whole sky that exhibit extremely low temperatures (T 14 K) (Planck Collaboration et al. 2016). The PGCCs are therefore excellent targets for studying the very initial conditions of star formation (Planck Collaboration et al. 2011; Juvela et al. 2010; Wu et al. 2012; Montillaud et al. 2015; Planck Collaboration et al. 2016; Liu et al. 2018; Eden et al. 2019; Xu et al. 2020; Xu et al. 2021).
In follow-up observations, the James Clerk Maxwell Telescope (JCMT) large program SCOPE observed 1,300 PGCCs in the 850 m continuum to study the early evolution of dense cores, which targets high-column-density ( 51020cm-2 for a 5 beam of the Planck telescope) clumps (Liu et al. 2018; Eden et al. 2019). The SCOPE sample is important for statistically investigating evolution between the starless and protostellar star formation phases.
The Orion Molecular Cloud Complex is about 380-420 pc away from us, and it has been extensively studied with many observations (Kim et al. 2020; Sahu et al. 2021a). As a part of SCOPE, Yi et al. 2018 turned to the Orion giant molecular cloud (GMC) complex, and observed 58 PGCCs in the three GMCs (Orion A, Orion B and Orionis) with the JCMT in the 850 m continuum. Beyond those they included 38 other PGCCs, for which archival 850 m continuum data were available in the JCMT Science Archive. The sample of Yi et al. 2018 is complete for PGCCs with column densities higher than 51020cm-2 (for a 5 beam of the Planck telescope) in the Orion GMCs. In total, 119 dense cores were identified from JCMT SCUBA-2 observations of these Orion PGCCs, forming a unique sample of cold cores at similar distances for further studies.
As a follow-up observation of these Orion PGCCs, the ALMA Survey of Orion Planck Galactic Cold Clumps (ALMASOP) subsequently observed 72 out of the 119 dense Orion PGCCs at high resolution (140 au). This resolution is high enough to resolve close binary/multiple systems with separations of a few hundred astronomical units. These 72 cores are among the densest in these clouds and are arguably the closest to the onset of star formation (Dutta et al. 2020), i.e., those that have started to collapse or have already formed protostars. In previous work with ALMASOP survey data, we focused on the chemical evolution of hot corino sources (Hsu et al. 2020; Hsu et al. 2022), the fragmentation of prestellar cores (Sahu et al. 2021b), and outflow jets (Dutta et al. 2020).
Dutta et al. 2020 presented the 1.3 mm continuum emission maps in ALMASOP observations and identified protostars in 43 cores. Multiple protostars were frequently seen within a single core, but the multiplicity of these protostellar systems was not discussed in Dutta et al. 2020. The present paper investigates binary/multiple systems in ALMASOP, and focuses on how dense core properties relate to the multiplicity of protostars. The major limitation of this work is that very close binary systems with separation 140 au are not resolvable due to the angular resolution limits of the ALMASOP observation.
III Observations and data
III.1 ALMA Observations
ALMASOP (project ID: 2018.1.00302.S.; PI: Tie Liu), observed 72 extremely cold young dense cores in the Orion molecular clouds, including 23 starless core candidates and 49 protostellar core candidates, with ALMA Band 6 during 2018 October to 2019 January. The observations were performed in four spectral windows centered at 216.6, 218.9, 231.0 and 233.0 GHz each with a 1.875 GHz bandwidth, with a velocity resolution of 1.4 km/s. Three array configurations were used for the observations: 12m C43-5 (TM1), 12m C43-2 (TM2), and 7m Atacama Compact Array (ACA). Additional details of the observations are presented in Dutta et al. 2020. Several molecular line transitions were observed: CO(J=2-1), C18O(J=2-1), N2D+(J=3-2), DCO+(J=3-2), DCN(J=3-2), SiO(J=5-4). In this paper, we utilize the results from the 1.3 mm continuum and CO(J=2-1) data.
The acquired visibilities were calibrated with the standard pipeline in CASA (McMullin et al. 2007). The 1.3 mm continuum images were generated using the TCLEAN task of CASA with a threshold of 3 theoretical sensitivity in the three sets of continuum images with the ACA (beam size 5.8 arcsec) FWHM, TM2+ACA (beam size 1.2 arcsec) FWHM, and TM1+TM2+ACA (beam size 0.35 arcsec) FWHM combination. We applied the “hogbom” deconvolver, and Briggs weighting with a robust value of +0.5 to obtain high-resolution maps, which allow us to identify multiple components more precisely. The TM1+TM2+ACA combination provides the best resolution to distinguish multiple components. The typical sensitivity of 1.3 mm continuum emission ranges from 0.01 to 0.2 mJy beam-1 in the TM1+TM2+ACA data (Dutta et al. 2020). The corresponding 3 mass sensitivity is better than 0.002 M☉, assuming a dust temperature of 25 K and a distance of 400 pc.
III.2 JCMT SCUBA-2 Observations
The natal cores of the ALMASOP sources were observed in the 850 m continuum with JCMT/SCUBA-2, as a part of the JCMT legacy survey SCOPE, ”SCUBA-2 Continuum Observations of Pre-protostellar Evolution” (project ID: M16AL003, PI: Tie Liu). The beam size of JCMT at 850m is about 14. An analysis of the 850 m continuum emission of these dense cores was presented in Yi et al. 2018. The dense core parameters including the sizes, masses and H2 mean densities derived by Yi et al. 2018 are listed in Table 1 and Table 2. It is worth mentioning that we updated these parameters following new distance measurements as used in Kim et al. 2020, which are 380 pc for Orionis, 390 pc and 430 pc for Orion A, 390 pc and 420 pc for Orion B.
III.3 No: 45m observations
The ALMASOP sources were also observed in eight molecular lines (CCS(JN=87-76), CCS(JN=76-65), HC3N(J=9-8), N2H+(J=1-0), DNC(J=1-0), HN13C(J=1-0), N2D+(J=1-0), c-C3H2 J(212-1), NH3(J,K)=(1,1)) toward the 850 m intensity peak positions of the SCUBA-2 cores with the 45 m radio telescope at Nobeyama Radio Observatory (No:45m, project IDs: CG161004, LP177001; PI: K. Tatematsu) from 2015 December to 2019 May (Tatematsu et al. 2017; Kim et al. 2020; Tatematsu et al. 2021). The observations were conducted with the receivers TZ1, T70 and FOREST which are dual-polarization and two-sideband superconductor–insulator–superconductor receivers. The velocity resolution is 0.05-0.06 km/s for both TZ1 and T70, 0.1 km/s for FOREST and 0.05 km/s for H22. The details of No: 45m observations are described in Kim et al. 2020. Among the observed molecular lines, the N2H+ line emission exhibits a spatial distribution similar to that of the SCUBA-2 850 m dust continuum emission (Tatematsu et al. 2017; Tatematsu et al. 2021). Therefore, we adopt the Mach number, system velocity, and line width (FWHM) of N2H+(J=1-0) from Kim et al. 2020 for further analysis in this work, which are compiled in Table 1 and Table 2. In addition, there are 16 dense cores in the ALMASOP survey that were also mapped in N2H+(J=1-0) line emission (Tatematsu et al. 2017; Tatematsu et al. 2021). We also present the N2H+(J=1-0) maps for these cores in this work.
III.4 Infrared data
We used the Spitzer Enhanced Imaging Products (SEIP) from the Spitzer Heritage Archive (Megeath et al. 2012) and Wide-field Infrared Survey Explorer (WISE) data (Wright et al. 2010) to help classify protostars distributed throughout the region of the cores. The SEIP includes data from the four channels of the IRAC instrument (3.6, 4.5, 5.8 and 8 m) and the 24 m channel of the MIPS instrument. The WISE data were also observed in 3.4, 4.6, 12, and 22 m. In this paper, we mainly use the highest-resolution 3.6/4.5/8 m data in SEIP data observations or the highest-resolution 3.4/4.6/12 m data in the WISE observations.
IV Results
IV.1 Identification of binary/multiple systems
We focus on the 43 protostellar cores among 72 cores that were detected in 1.3 mm continuum emission in the ALMASOP survey (Dutta et al. 2020). The 1.3 mm continuum emission from these cores is relatively bright, and indicates that one or more compact objects, previously identified as young protostars (Dutta et al. 2020), have formed within them. Figure 1 presents the infrared and (sub)millimeter continuum images obtained with various instruments for an exemplar core G196.92-10.37. Multiple point sources are seen in the Spitzer image but some may be contamination from background/foreground stars or very evolved protostars because they do not show strong 1.3 mm continuum emission (Tobin et al. 2022). We will only consider young protostars with disks and envelopes, which should have strong 1.3 mm continuum emission, in further multiplicity analysis. From the highest-resolution ALMA 1.3 mm continuum image shown in the right panel, one can identify a triple protostellar system formed in the exemplar core G196.92-10.37. The image descriptions of the other cores are compiled in the Appendix A.
We identify binary/multiple systems within the SCUBA-2 cores, whose sizes are smaller than or comparable to the FOV of the ALMA 12 m array, following the same strategy used in previous works (Tobin et al. 2016; Tobin et al. 2022, e.g.,). The core sizes are listed in Table 1 and 2. In total, we identify 13 binary/multiple systems and 29 single systems, and one binary-system candidate (one of its members is a prestellar core). Here we note again that our observations cannot resolve systems with below 140 au separation, thus some single star systems could also be very close binary/multiple systems. Some ALMASOP sources were also observed in the VANDAM survey (Tobin et al. 2022, see Table 6;). We find that two single-protostar systems (G206.12-15.76 and G211.47-19.27S) in the ALMASOP survey were further resolved to very close binary/multiple systems in the VANDAM survey. However, the very close binary/multiple systems in G206.12-15.76 and G211.47-19.27S are apparently formed due to disk fragmentation, and hence their properties are not determined by the fragmentation of their natal dense cores. Therefore, they are treated as single stars in the below analysis of the relations between core properties and protostellar multiplicity. The other single stars in ALMASOP survey remain to be single in the VANDAM survey.

To quantify the multiplicity in each Orion GMC, we adopt the statistical parameters of MF and CSF from Batten (1973). They give a good indication of the proportion of binary/multiple systems and the average number of companions. The two quantities associated with the number of star systems and companions are given by
| (1) |
| (2) |
where S, B, T, and Q are the numbers of single, binary, triple, and quadruple systems in the sample, respectively. Figure 2 shows the MF and CSF of each of the three Orion GMCs, and the actual quantities are listed in Table 3. As the two subregions (separated by a -6 decl.) of the Orion A, the integral-shaped filament (ISF) and L1641, have very different physical environments and levels of star formation activity (Megeath et al. 2016), we also calculate their MF and CSF separately. The overall MF and CSF for the ALMASOP sample are 28 4 and 51 6, respectively. For comparison, Tobin et al. 2022 found that the overall MF and CF for the Orion HOPS protostars are and , respectively, which are broadly consistent with our statistical results. However, we note that their sample contains very close binary/multiple systems with separations smaller than 100 au, which cannot be resolved in our observations.
In our sample, the Orionis cloud shows the lowest MF and CSF, and the ISF region in Orion A shows the highest MF and CSF. When comparing the two subregions of Orion A, the ISF region, which contains the Orion Nebula cluster (ONC) has much higher multiplicity than L1641. The different occurrences of stellar multiplicity in the Orion GMCs may be caused by environmental effects such as stellar feedback, gas density, and turbulence levels, which we explore later in Section V.

IV.2 Properties of the natal dense cores
We are interested in how the properties of dense cores affect the multiplicity of the protostars that form within them. To explore this possible connection, we summarize detailed information of the 43 protostellar cores from previous studies and divide the cores into two groups: dense cores forming single stars and dense cores forming more than one protostar. As the assumptions and calculation procedures for many of the parameters have already been described in detail in previous works (Yi et al. 2018; Kim et al. 2020; Dutta et al. 2020), we simply describe the core parameters here. The core parameters of these two groups are listed in Table 1 and Table 2.
Yi et al. 2018 used the ClumpFind task in the STARLINK package to identify dense cores. The method was to fit the SCUBA-2 850 m continuum emission maps in a 2D Gaussian profiles with the threshold of 5 . ClumpFind limited the edge of the core according to the threshold, and extracted the sizes and fluxes relying on the full width half max(FWHM) brightness and the integrated fluxes of the core.
The flux density produced by the SCUBA-2 850 m dust emission can be expressed as:
| (3) |
The H2 column density of the cores can be therefore be derived from the flux density. The calculation of the following parameters, with flux density involved, follows the optically thin assumption:
| (4) |
where S is the beam-averaged flux density, is the dust optical depth, is the solid angle of the source, is the mean molecular weight and its value is 2.8, is the mass unit of atomic hydrogen, and is the Planck function of dust temperature , which is from the PGCCs catalog. The dust opacity per gram of gas is calculated following the equation from Beckwith et al. 1990: = cm2g-1, where is the dust emissivity spectral index from Planck Collaboration et al. 2016. The column densities of the 43 protostellar cores in the ALMASOP sample range from 0.4 0.1 1023 cm-2 to 11.7 2.5 1023 cm-2, with a median value of 2.5 1023 cm-2.
The mean H2 number densities of the cores are estimated from the H2 column densities based on the SCUBA-2 850 m dust continuum:
| (5) |
where is the core diameter and is calculated using , a and b being the major and minor axes of FWHM obtained with ClumpFind and converted to linear distances assuming source distances of Kim et al. 2020. The mean density of the cores ranges from 0.7 105 cm-3 to 40.8 105 cm-3, with a median value of 5.4 105 cm-3.
The core masses are inferred from the SCUBA-2 850 m continuum fluxes compiled in Yi et al. 2018:
| (6) |
likewise, where S is the flux density of cores from the SCUBA-2 850 m observations, and is the distance adopted by Kim et al. 2020. The dust opacity is adopted from Beckwith et al. 1990. As listed in Table 1 and Table 2, the mass of the cores ranges from 0.14 0.04 to 11.64 2.18 , with a median mass of 2.27 .
The high-resolution ALMA 1.3 mm continuum emission traces the total gas mass of the envelope and disk, , for each protostar. can be roughly estimated based on the integrated 1.3 mm continuum flux density under an optically thin assumption, which was already calculated in Dutta et al. 2020. The smallest gas mass of protostars in the whole sample is 0.009 and the largest mass is 2.312 , with an median mass of 0.3 . Firstly, we estimate the mass of the envelope+disk for individual protostars (). Secondly, we estimate the total envelope+disk masses () of all protostars within each core. We then calculate a ’compact gas fraction’ (CGF) to describe the fraction of gas that has been accumulated from the dense core into the protostellar envelope and disk:
| (7) |
The CGF is a ratio calculated after collecting all the in each core. The CGF is shown in the Column (14) of Table 1 and 2. The minimum and maximum values of the CGF for whole cores are 0.2 and 80, and the median value is 11.
Once the perturbations caused by self-gravity inside a molecular cloud are larger than the Jeans length, they can lead the region to become unstable. Hence, Jeans fragmentation may lead to substructures that become binary/multiple systems. The Jeans lengths of dense cores can be calculated via the following equations from Wang et al. 2014:
| (8) |
where is the dust temperature of the dense core from Kounkel et al. 2017, and is the mean column density of H2 from Yi et al. 2018. The Jeans lengths of dense cores in our sample range from 2500 au to 19,300 au with a median value of 7000 au.
The Mach number () is a measurement of turbulence within of dense cores. We adopt the Mach numbers from Kim et al. 2020, which are calculated using
| (9) |
where is the nonthermal velocity dispersion derived from = . Here, is the Boltzmann constant, the kinetic temperature, the N2H+ (J=1-0) line width (FWHM), the mass of N2H+ molecule, and the sound speed, which depends on the temperature assumed. The Mach number of the cores ranges from 0.6 0.1 to 2.4 0.1, with a median value of 1.1.
In order to examine whether the statistical properties of groups of dense cores harboring different types of protostellar systems differ from one another, we calculate the median and mean values of the above-derived core parameters in the two groups of cores, and list them in Table 4. Statistically, the , , , and of cores containing binary/multiple systems are larger than those of cores forming single stars. The and of individual protostars in those multiple systems are smaller than those of single systems. The core sizes of the two groups, however, do not show any noticeable difference.
We present the cumulative distribution functions of the core parameters of the two groups of cores in Figure 3. In addition, we use the Kolmogorov–Smirnov (KS) test to gauge whether or not these two groups of cores have the same underlying core parameter distributions. Overall, the distributions of H2 column density, H2 number density and Mach number of the two groups appear to differ substantially with p-value smaller than 10. In particular, the two groups show significant differences in H2 column density and Mach number with very low p-values () in the KS test of their distributions. In contrast, the distributions in , size, and of the two groups of cores are statistically similar, as indicated by the very high p-values () in the KS test. We find that the proportion of envelope+disk masses below 1 for protostars in binary/multiple systems is larger than that in single systems. We discuss these results more thoroughly in Section V below.
| N2H+ | ||||||||||||||
|---|---|---|---|---|---|---|---|---|---|---|---|---|---|---|
| Source | R.A.(J2000) | Decl.(J2000) | size | 2 | Vlsr | VHFS | VGA | Menve+disk | Mcore | CGF | Ljeans | |||
| (h:m:s) | (d:m:s) | (pc) | (K) | ( 1023cm-2) | ( 105cm-3) | (km s-1) | (km s-1) | (km s-1) | (M⊙) | (M⊙) | (au) | |||
| G196.92-10.37 | 05:44:29.56 | +09:08:50.20 | 0.22 | 14.8 ± 0.4 | 1.8 0.1 | 5.6 0.1 | 11.68 | 0.84 | 1.02 | 1.5 0.2 | 0.116 0.034 | 5.69 0.32 | 0.02 | 7000 |
| G205.46-14.56M1a | 05:46:08.06 | -00:10:43.71 | 0.09 | 12.5 0.9 | 8.7 0.8 | 35.9 1.7 | 9.99 | 0.73 | 1.18 | 1.4 0.1 | 2.309 0.96 | 6.36 1.33 | 0.36 | 2500 |
| G205.46-14.56M2a | 05:46:07.89 | -00:10:01.82 | 0.06 | 12.5 0.9 | 5.5 0.5 | 22.6 1.5 | 10.05 | 0.88 | 1.26 | 1.7 0.1 | 0.291 0.063 | 1.83 0.38 | 0.16 | 3200 |
| G205.46-14.56S1 | 05:46:07.05 | -00:13:37.78 | 0.13 | 12.5 0.9 | 6.7 0.6 | 27.4 1.7 | 10.31 | 1.18 | 1.23 | 2.4 0.1 | 0.542 0.179 | 11.64 2.18 | 0.04 | 2900 |
| G206.93-16.61E2 | 05:41:37.31 | -02:17:18.13 | 0.10 | 16.8 5.3 | 4.5 1.5 | 18.8 2.4 | 9.76 | 0.60 | 0.58 | 1.0 0.1 | 0.863 0.195 | 4.08 0.16 | 0.21 | 4000 |
| G207.36-19.82N1 | 05:30:50.94 | -04:10:35.60 | 0.06 | 11.9 1.4 | 3.5 0.5 | 5.7 1.1 | 10.52 | 1.13 | 1.48 | 2.3 0.1 | 0.124 0.048 | 1.15 0.46 | 0.10 | 6200 |
| G208.68-19.20N2 | 05:35:20.45 | -05:00:50.39 | 0.05 | 19.7 3.8 | 11.6 3.0 | 18.9 3.6 | 11.14 | 0.44 | 0.67 | 0.6 0.1 | 4.786 2.046 | 2.27 1.15 | 4400 | |
| G208.68-19.20N3 | 05:35:18.02 | -05:00:20.70 | 0.05 | 19.7 3.8 | 11.7 2.5 | 18.9 3.7 | 11.12 | 0.69 | 0.96 | 1.1 0.1 | 0.607 0.195 | 2.65 1.50 | 0.23 | 4400 |
| G208.68-19.20S | 05:35:26.32 | -05:03:54.39 | 0.09 | 19.7 3.8 | 4.6 1.0 | 7.6 1.4 | 10.35 | 0.95 | 0.94 | 1.5 0.1 | 0.464 0.190 | 3.55 1.03 | 0.13 | 6900 |
| G209.55-19.68N1 | 05:35:08.90 | -05:55:54.40 | 0.16 | 14.1 4.0 | 0.4 0.1 | 0.7 0.1 | 7.20 | 0.84 | 1.30 | 1.6 0.1 | 0.334 0.087 | 0.75 0.04 | 0.44 | 19300 |
| G210.49-19.79W | 05:36:18.86 | -06:45:28.03 | 0.11 | 11.8 2.7 | 11.3 2.9 | 18.4 0.2 | 9.01 | 0.60 | 0.77 | 1.2 0.1 | 0.209 0.086 | 6.62 0.25 | 0.03 | 3400 |
| G210.97-19.33S2 | 05:38:45.30 | -07:01:04.41 | 0.07 | 12.8 1.1 | 1.2 0.3 | 2.0 0.1 | 0.86 | 0.038 0.012 | 0.37 0.09 | 0.10 | 10900 | |||
| G211.47-19.27N | 05:39:57.18 | -07:29:36.07 | 0.07 | 12.4 1.1 | 4.1 0.4 | 6.6 0.3 | 3.99 | 0.52 | 0.97 | 1.0 0.2 | 0.105 0.035 | 1.54 0.43 | 0.06 | 5900 |
| G212.10-19.15N2 | 05:41:24.03 | -07:53:47.51 | 0.12 | 10.8 1.4 | 1.8 0.3 | 2.9 0.3 | 4.45 | 0.69 | 1.04 | 1.5 0.1 | 0.048 0.016 | 1.53 0.72 | 0.03 | 8300 |
Note. — Column(1): ALMASOP core name. Note that the marked a is different from the JCMT dense core name and those marked with * are dense core detected only in the ALMASOP survey. (2)-(3): coordinates in equatorial system (J2000) from (Yi et al. 2018) and (Dutta et al. 2020). (4): Core size from Yi et al. 2018. (5): Dust temperature comes from Kounkel et al. 2017. (6): H2 column density cited from Kim et al. 2020. (7): H2 number density from Yi et al. 2018. (8)-(10): N2H+(J=1-0) of systemic velocity, FWHM, and FWHM inferred by Gaussian fitting from Kim et al. 2020. (11): Mach number cited from Kim et al. 2020. (12): Gas mass of envelope and disk from (Dutta et al. 2020).
| N2H+ | ||||||||||||||
|---|---|---|---|---|---|---|---|---|---|---|---|---|---|---|
| Source | R.A.(J2000) | Decl.(J2000) | size | 2 | Vlsr | VHFS | VGA | Menve+disk | Mcore | CGF | Ljeans | |||
| (h:m:s) | (d:m:s) | (pc) | (K) | ( 1023cm-2) | ( 105cm-3) | (km s-1) | (km s-1) | (km s-1) | (M⊙) | (M⊙) | (au) | |||
| G191.90-11.21S | 05:31:31.73 | +12:56:14.99 | 0.10 | 14.7 4.1 | 0.7 0.2 | 2.2 0.5 | 10.53 | 0.41 | 0.38 | 0.7 0.1 | 0.079 0.034 | 0.93 0.09 | 0.085 | 11100 |
| G192.12-11.10 | 05:32:19.54 | +12:49:40.19 | 0.12 | 13.3 3.0 | 1.8 0.4 | 5.4 0.2 | 10.02 | 0.73 | 0.35 | 1.4 0.2 | 0.340 0.145 | 2.32 0.33 | 0.147 | 6800 |
| G192.32-11.88N | 05:29:54.47 | +12:16:56.00 | 0.06 | 17.3 6.0 | 1.1 0.4 | 3.4 0.4 | 12.12 | 0.66 | 0.59 | 1.1 0.2 | 0.408 0.174 | 0.51 0.05 | 0.800 | 9700 |
| G192.32-11.88S | 05:29:54.74 | +12:16:32.00 | 0.05 | 17.3 6.0 | 0.9 0.4 | 2.9 0.2 | 12.08 | 0.54 | 0.58 | 0.9 0.1 | 0.100 0.043 | 0.23 0.02 | 0.435 | 10500 |
| G200.34-10.97N | 05:49:03.71 | +05:57:55.74 | 0.09 | 13.5 0.9 | 0.8 0.1 | 2.5 0.6 | 13.36 | 0.45 | 0.51 | 0.8 0.1 | 0.068 0.029 | 0.81 0.06 | 0.084 | 10000 |
| G201.52-11.08 | 05:50:59.01 | +04:53:53.10 | 0.05 | 13.6 1.3 | 0.8 0.1 | 3.3 0.8 | 0.060 0.026 | 0.14 0.04 | 0.429 | 8800 | ||||
| G203.21-11.20W1 | 05:53:42.83 | +03:22:32.90 | 0.12 | 11.2 0.7 | 2.7 0.3 | 11.1 1.9 | 10.70 | 0.50 | 1.02 | 1.0 0.1 | 0.091 0.039 | 2.88 0.13 | 0.032 | 4300 |
| G203.21-11.20W2 | 05:53:39.62 | +03:22:24.90 | 0.10 | 11.2 0.7 | 3.2 0.4 | 13.4 1.5 | 10.11 | 0.50 | 0.72 | 1.0 0.1 | 0.034 0.015 | 2.57 0.19 | 0.013 | 3900 |
| G205.46-14.56N1a | 05:46:09.65 | -00:12:16.45 | 0.05 | 12.5 0.9 | 5.5 0.5 | 22.5 1.1 | 9.92 | 1.34 | 0.475 0.203 | 1.06 0.16 | 0.448 | 3200 | ||
| G205.46-14.56N2a | 05:46:07.49 | -00:12:22.42 | 0.03 | 12.5 0.9 | 4.7 0.4 | 19.2 1.9 | 10.29 | 0.70 | 0.75 | 1.4 0.1 | 0.223 0.095 | 0.49 0.09 | 0.475 | 3500 |
| G205.46-14.56S2 | 05:46:04.49 | -00:14:18.87 | 0.03 | 12.5 0.9 | 4.8 0.5 | 19.8 2.9 | 10.44 | 0.46 | 0.54 | 0.9 0.1 | 0.069 0.029 | 0.47 0.10 | 0.147 | 3400 |
| G205.46-14.56S3 | 05:46:03.54 | -00:14:49.34 | 0.04 | 12.5 0.9 | 5.0 0.5 | 20.4 1.9 | 10.36 | 0.61 | 0.81 | 1.2 0.1 | 0.167 0.072 | 0.88 0.16 | 0.190 | 3300 |
| G206.12-15.76 | 05:42:45.26 | -01:16:11.37 | 0.14 | 11.9 1.6 | 2.6 0.4 | 10.8 1.3 | 1.035 0.442 | 3.95 1.73 | 0.262 | 4500 | ||||
| G206.93-16.61W2a | 05:41:25.04 | -02:18:08.11 | 0.06 | 16.8 5.3 | 9.9 3.1 | 40.08 4.7 | 9.25 | 0.65 | 1.02 | 1.1 0.1 | 0.771 0.333 | 3.27 0.15 | 0.235 | 2800 |
| G208.68-19.20N1 | 05:35:23.37 | -05:01:28.70 | 0.09 | 19.7 3.8 | 10.9 2.4 | 17.7 3.4 | 11.13 | 0.72 | 0.96 | 1.1 0.1 | 2.312 0.988 | 7.79 2.53 | 0.297 | 4500 |
| G208.68-20.04E | 05:32:48.40 | -05:34:47.14 | 0.13 | 12.8 4.2 | 2.6 0.9 | 4.3 0.3 | 8.74 | 0.38 | 0.52 | 0.7 0.1 | 0.073 0.031 | 3.95 0.29 | 0.018 | 7400 |
| G208.89-20.04Walma* | 05:32:28.03 | -05:34:26.69 | 0.028 0.012 | |||||||||||
| G209.55-19.68S1 | 05:35:13.25 | -05:57:58.65 | 0.23 | 14.1 4.0 | 0.8 0.2 | 1.2 0.2 | 7.35 | 0.68 | 0.94 | 1.3 0.1 | 0.264 0.113 | 2.31 0.97 | 0.114 | 14800 |
| G209.55-19.68S2a | 05:35:08.96 | -05:58:26.38 | 0.16 | 14.1 4.0 | 1.0 0.3 | 1.6 0.5 | 8.11 | 0.45 | 0.51 | 0.8 0.1 | 0.084 0.036 | 1.52 0.26 | 0.054 | 12800 |
| G210.37-19.53S | 05:37:00.55 | -06:37:10.16 | 0.15 | 14.0 4.1 | 1.1 0.3 | 1.8 0.7 | 5.61 | 0.72 | 0.69 | 1.3 0.1 | 0.133 0.050 | 2.27 0.23 | 0.059 | 12000 |
| G210.82-19.47S | 05:38:03.67 | -06:58:24.141 | 0.08 | 0.4 0.1 | 0.7 0.8 | 0.010 0.004 | 0.22 0.125 | 0.600 | ||||||
| G211.01-19.54N | 05:37:57.23 | -07:06:56.72 | 0.10 | 14.7 8.4 | 2.5 1.4 | 4.1 0.2 | 6.03 | 0.83 | 0.79 | 1.5 0.1 | 0.130 0.056 | 2.16 0.36 | 0.060 | 8200 |
| G211.01-19.54S | 05:37:59.04 | -07:07:24.14 | 0.07 | 14.7 8.4 | 2.5 1.4 | 4.0 0.1 | 5.72 | 0.70 | 1.01 | 1.3 0.1 | 0.021 0.009 | 1.05 0.32 | 0.020 | 8300 |
| G211.16-19.33N2 | 05:39:05.83 | -07:10:41.52 | 0.10 | 12.5 1.8 | 0.8 0.1 | 1.2 0.1 | 3.49 | 0.46 | 0.70 | 0.9 0.1 | 0.016 0.007 | 0.48 0.20 | 0.033 | 13900 |
| G211.47-19.27S | 05:39:56.10 | -07:30:28.40 | 0.01 | 12.4 1.1 | 7.2 0.8 | 11.7 0.3 | 5.52 | 1.03 | 0.93 | 2.1 0.1 | 0.990 0.424 | 11.39 3.18 | 0.087 | 4500 |
| G212.10-19.15S | 05:41:26.39 | -07:56:51.81 | 0.15 | 10.8 1.4 | 1.9 0.3 | 3.0 0.4 | 3.78 | 0.38 | 0.74 | 0.6 0.1 | 0.237 0.101 | 2.41 1.00 | 0.098 | 8200 |
| G212.84-19.45N | 05:41:32.07 | -08:40:10.94 | 0.10 | 11.7 1.1 | 2.0 0.2 | 3.2 0.5 | 4.31 | 0.34 | 0.42 | 0.8 0.1 | 0.273 0.117 | 1.26 0.50 | 0.217 | 8300 |
| G215.87-17.62M | 05:53:32.52 | -10:25:05.99 | 0.24 | 12.2 1.2 | 0.5 0.1 | 0.8 0.1 | 8.96 | 0.35 | 0.46 | 0.7 0.1 | 0.065 0.028 | 2.50 0.64 | 0.026 | 16800 |
| G215.87-17.62N | 05:53:41.91 | -10:24:02.00 | 0.26 | 12.2 1.2 | 0.6 0.1 | 1.0 0.2 | 9.28 | 0.46 | 0.89 | 0.9 0.4 | 0.0090 004 | 3.96 0.84 | 0.002 | 15000 |
Note. — Column(1): ALMASOP core name. Note that the marked a is different from the JCMT dense core name and those marked with * are dense core detected only in the ALMASOP survey. (2)-(3): coordinates in equatorial system (J2000) from (Yi et al. 2018) and (Dutta et al. 2020). (4): Core size from Yi et al. 2018. (5): Dust temperature comes from Kounkel et al. 2017. (6): H2 column density cited from Kim et al. 2020. (7): H2 number density from Yi et al. 2018. (8)-(10): N2H+(J=1-0) of systemic velocity, FWHM, and FWHM inferred by Gaussian fitting from Kim et al. 2020. (11): Mach number cited from Kim et al. 2020. (12): Gas mass of envelope and disk from (Dutta et al. 2020).
| Subregions | MF | CSF | Sample Number | Sample Number | Sample Number | Sample Number | Sample Number |
|---|---|---|---|---|---|---|---|
| (Single System) | (Binary System) | (Triple System) | (Quadruple System) | (Five-star System) | |||
| Orionis | 20 8 | 40 15 | 4 | 0 | 1 | 0 | 0 |
| Orion B | 29 7 | 64 13 | 10 | 2 | 0 | 1 | 1 |
| Orion A | 35 7 | 48 8 | 15 | 5 | 2 | 1 | 0 |
| L1641 | 28 7 | 42 11 | 10 | 3 | 0 | 1 | 0 |
| ISF | 44 14 | 66 22 | 5 | 2 | 2 | 0 | 0 |
Note: G208.68-19.20N2 is not included in the statistics because it is a protobinary system candidate.
| Parameter | Core (Single Systems) | Core (Binary/Multiple Systems) | KS Test | ||||||||
|---|---|---|---|---|---|---|---|---|---|---|---|
| Number | Mean | Median | Sigma | Number | Mean | Median | Sigma | Statistic | p-value | ||
| (1023 cm-2) | 28 | 2.76 | 1.90 | 2.69 | 13 | 5.06 | 4.50 | 3.52 | 0.45 | 4.3 | |
| 2(105 cm-3) | 28 | 8.33 | 3.70 | 9.19 | 13 | 13.31 | 7.60 | 10.64 | 0.41 | 7.0 | |
| 24 | 1.06 | 1.00 | 0.34 | 12 | 1.51 | 1.50 | 0.43 | 0.50 | 3.0 | ||
| (10-2 pc) | 27 | 3.95 | 3.97 | 1.98 | 13 | 3.16 | 2.86 | 2.11 | 0.36 | 15.0 | |
| (M⊙) | 28 | 2.27 | 1.84 | 2.39 | 13 | 3.67 | 2.65 | 3.08 | 0.31 | 28.0 | |
| (M⊙) | 28 | 0.30 | 0.15 | 0.47 | 13 | 0.47 | 0.29 | 0.58 | 0.35 | 18.9 | |
| (M⊙) | 28 | 0.30 | 0.15 | 0.47 | 34 | 0.18 | 0.11 | 0.38 | 0.22 | 40.1 | |
| (10-1pc) | 28 | 1.02 | 1.00 | 0.60 | 13 | 1.02 | 0.90 | 0.45 | 0.22 | 89.7 | |
| (km/s) | 11 | 3.93 | 3.60 | 1.55 | 5 | 4.05 | 3.62 | 1.70 | 0.25 | 92.6 | |

IV.3 N2H+ maps of 16 protostellar cores
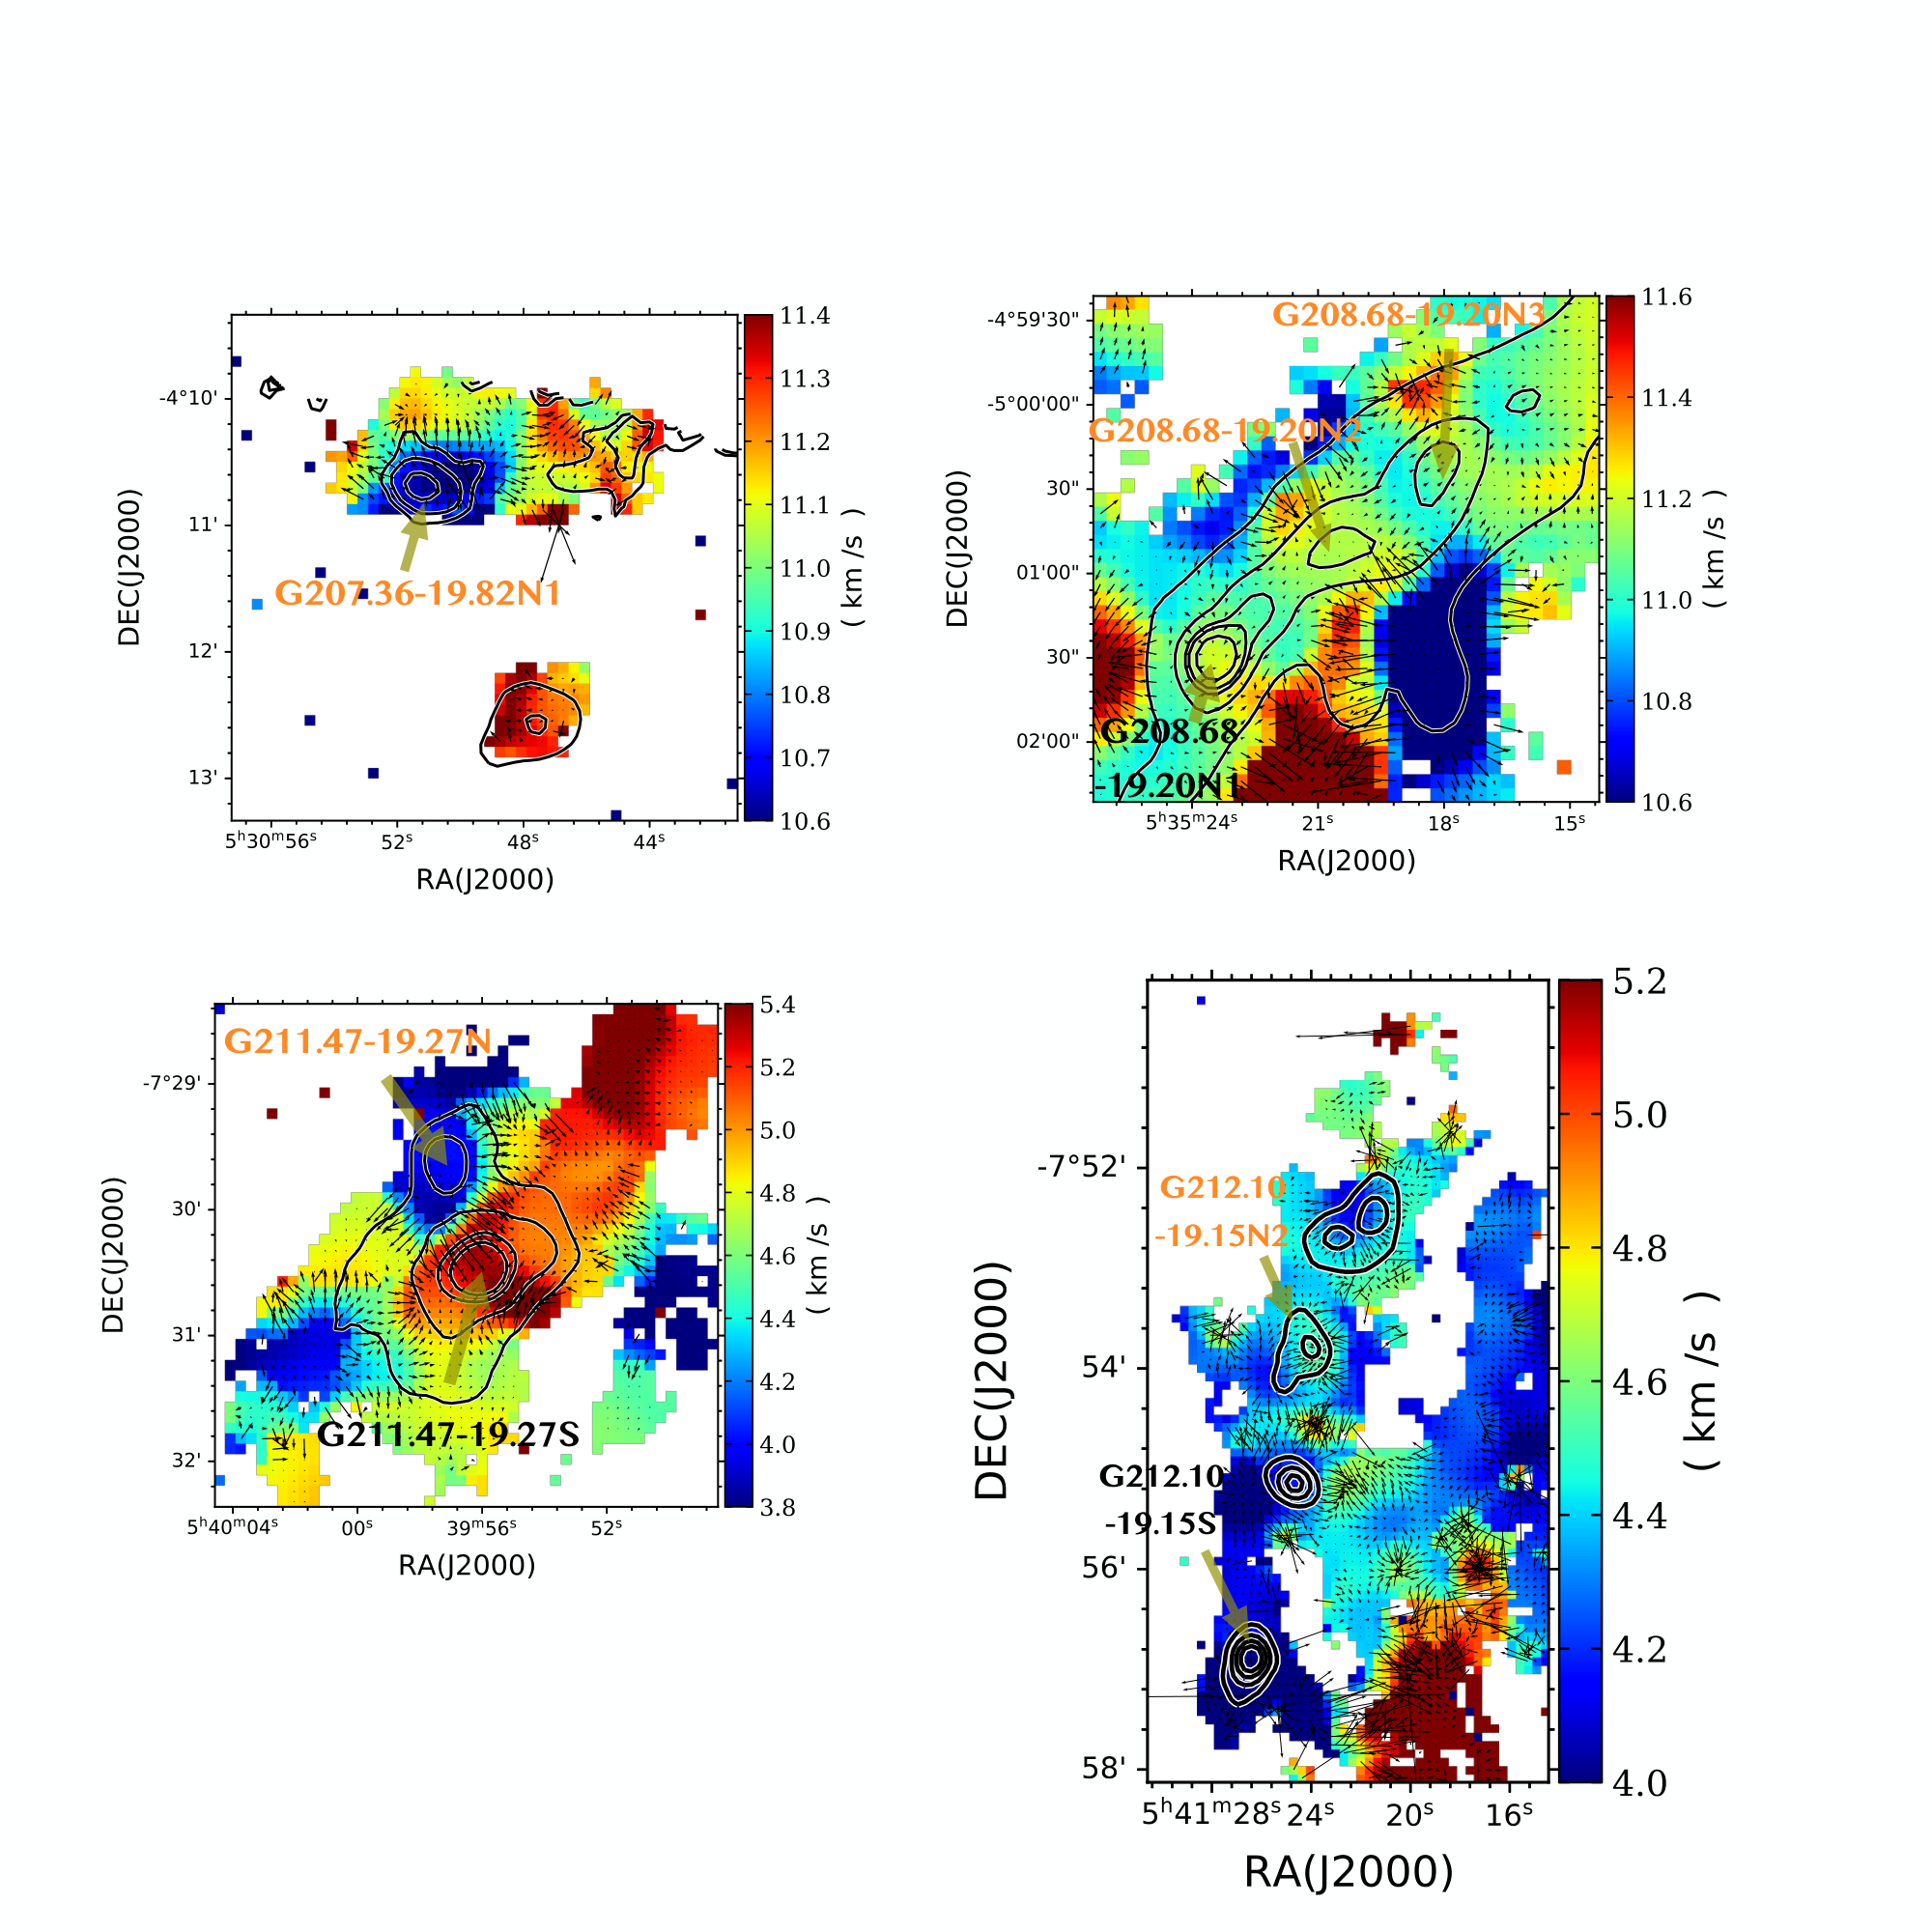
There are 16 protostellar cores in the ALMASOP survey that have been mapped in N2H+ J=1-0 line emission with the No: 45 m telescope (Tatematsu et al. 2021). Among the 16 cores, five are forming binary/multiple systems and the other 11 contain single protostars. We note that the fraction of binary/multiple systems in this small sample is similar to that of the whole ALMASOP sample. With these data, we can investigate whether or not there are significant differences in gas kinematics between the two groups of cores. We fit the hyperfine spectra to all N2H+ emission lines with signal-to-noise ratios (SNR) higher than 3, and finally derive the centroid velocity field maps of these cores. The velocity field maps of dense cores that are forming single systems are shown in Figure 4, while the maps of cores forming binary/multiple systems are shown in Figure 5. Most of the cores show velocity gradients in the N2H+ emission maps, no matter how many protostars have formed within them.
To evaluate the gas kinematics quantitatively, we derive local velocity gradients across these maps in steps of 10. The local velocity gradients are shown as arrows on the velocity field maps. In Table 4, we present the maximum, minimum, mean, and standard deviation of the local velocity gradients in these 16 dense cores. The median velocity gradient of the single-system cores ranges from 1.92 to 7.21 km s-1 pc-1, with a mean value of 3.94 km s-1 pc-1. For comparison, the median velocity gradient of the binary/multiple cores ranges from 1.90 to 7.08 km s-1 pc-1, with a mean value of 4.05 km s-1 pc-1. We also list the statistics of the velocity gradients in the Table 4. These statistics indicate that there is no significant difference in velocity gradient between the two groups of cores with a p-value in KS test of 92. These results, however, need to be tested with a much larger sample of cores from higher angular resolution observations, which may separate more clearly the core kinematics from those of the surroundings. The ALMASOP data, unfortunately, do not have high enough spectral resolution or suitable molecular line tracers for gas kinematics studies on the core scale.
| Core Name | Mean | Median | Min | Max | Std |
|---|---|---|---|---|---|
| ( km s-1 pc-1) | (km s-1 pc-1) | ( km s-1 pc-1) | (km s-1 pc-1) | (km s-1 pc-1) | |
| G192.32-11.88N | 2.49 | 2.51 | 0.39 | 4.14 | 1.10 |
| G192.32-11.88S | 1.87 | 1.92 | 1.55 | 2.33 | 0.29 |
| G203.21-11.20W1 | 2.42 | 2.07 | 0.48 | 5.57 | 1.57 |
| G203.21-11.20W2 | 3.40 | 2.75 | 1.25 | 7.44 | 1.67 |
| G206.12-15.76 | 3.89 | 4.60 | 0.22 | 8.09 | 2.45 |
| G206.93-16.61W3 | 4.04 | 3.60 | 0.27 | 10.99 | 2.53 |
| G208.68-19.20N1 | 5.14 | 5.20 | 1.52 | 9.80 | 2.01 |
| G208.89-20.04E | 3.36 | 3.50 | 0.99 | 5.23 | 1.02 |
| G211.16-19.33N2 | 4.42 | 4.58 | 2.82 | 5.84 | 0.73 |
| G211.47-19.27S | 10.80 | 7.21 | 0.13 | 67.64 | 12.05 |
| G212.10-19.15S | 5.39 | 5.39 | 2.02 | 10.08 | 2.43 |
| G207.36-19.82N1 | 8.20 | 7.08 | 1.60 | 16.39 | 4.41 |
| G208.68-19.20N2 | 2.12 | 1.90 | 0.49 | 4.67 | 1.22 |
| G208.68-19.20N3 | 4.17 | 4.32 | 0.63 | 8.26 | 1.97 |
| G211.47-19.27N | 8.57 | 3.62 | 1.02 | 27.99 | 8.86 |
| G212.10-19.15N2 | 3.55 | 3.32 | 0.95 | 8.44 | 1.69 |
Note. — The eleven cores above the dividing line are those containing only one protostar, and the remaining five binary/multiple cores are those containing binary/multiple systems.

IV.4 Separation of Protostars in Binary/Multiple Systems

We derive the projected separations among member protostars, for 36 protostars in the 13 binary/multiple-system cores. For high-order systems, we use the MiSTree (minimum spanning tree) package 11 1 https://joss.theoj.org/papers/10.21105/joss.01721.pdf to get the distance or separation between protostars. Figure 6 shows the distribution of separation in the binary/multiple systems. The projected separation between companion protostars of the whole sample ranges from 300 au to 8900 au, and the median projected separation is about 2100 au. Our result highlights a bimodal behavior in the projected separation distribution with one peak around 500 au and the other peak around 3500 au, similar in character to the bimodal distribution of projected separations presented in Tobin et al. 2016 and Tobin et al. 2022.
V Discussion
V.1 Origin of the multiplicity of protostars in dense cores

In Section 4.2, we statistically compare the physical properties of dense cores that form different systems. We find that dense cores forming binary/multiple systems are statistically denser and have higher and , and greater turbulence (higher ) than single-system cores. Dense cores with higher densities also show smaller Jeans lengths, and thus are more likely to fragment into substructures that could form a binary/multiple systems.
The higher Mach number of binary/multiple-system cores suggests that their turbulent motions are more prevalent in them than in single-system cores. Higher Mach numbers, however, may not reflect the initial turbulence levels before core fragmentation, because outflows from protostars may have injected energy to induce the observed core turbulence (Yun et al. 2021). However, as shown in Figure 9 in the appendix, in most cases, only one protostar in a binary/multiple system is drives a highly collimated and energetic bipolar outflow. In addition, the outflow properties (e.g., outflow velocities, masses, momenta, and energies) are not significantly different in various dense cores forming either single stars or binary/multiple systems (Dutta et al. 2020, see S. Dutta et al. 2022, in preparation; and). Therefore, the higher Mach numbers in dense cores forming binary/multiple systems may not be caused by outflow activity.
Furthermore, a higher Mach number may also reflect internal core accretion. Statistically, binary/multiple-system cores are more massive than single-system cores while the sizes of the two core groups are indistinguishable. This behavior may indicate that during gravitational collapse, binary/multiple-system cores accumulate more mass through the accretion of gas. The large accretion flows of dense cores may also induce more turbulence inside the cores. However, as shown in Figure 7, Mach numbers are not well correlated with core masses. In general, for dense cores with similar core masses, those cores forming binary/multiple systems have larger Mach numbers than those forming single stars, further suggesting that larger Mach numbers are not associated with larger core masses.
Higher Mach numbers of binary/multiple-system cores could also be related to other bulk motions such as core rotation. Indeed, rotation has been widely revealed in cores of the Orion GMCs (Tatematsu et al. 2016; Xu et al. 2020). In particular, hierarchical protostellar systems may form by rotation-driven fragmentation, as demonstrated in early numerical simulations (Boss 1987; Boss 1991; Chapman et al. 1992; Bonnell et al. 1992; Whitworth et al. 1995). From the single-dish N2H+ maps shown in Section 4.3, we do see clear velocity gradients across cores. Whether or not these velocity gradients are caused by core rotation, however, needs to be tested with higher spatial and spectral resolution observations. Here at least, we find no significant differences in velocity gradients among cores forming various numbers of stars.
Therefore, higher Mach numbers in dense cores likely arise from their initial turbulence levels, and binary/multiple systems tend to form in more turbulent cores. Significant levels of turbulence in cores can be a key trigger of fragmentation because turbulent fluctuations within a bound core can produce multiple nonlinear perturbations in density that exceed the local Jeans mass and causes the overdense region to collapse faster than the background core (Goodwin et al. 2004; Fisher 2004; Offner et al. 2010). In addition, turbulent fragmentation has been suggested to be the dominant channel for binary/multiple-system formation of low-mass stars in numerical simulations (Offner et al. 2010; Tobin et al. 2022).
To summarize, we find that the multiplicity of protostars that form in dense cores may be determined by the core gas density and Mach number. However, correlations between these parameters and time evolution need more refined analyses in future. We find that the protostars are at different evolutionary stages even in the same system, which makes the comparison more complicated (for more details on the evolutionary stages, see Section 5.3 below).
V.2 Environmental effects on the multiplicity of protostars
Figure 2 shows the multiplicity of the three GMCs: Orionis, Orion B, and Orion A, of which Orionis has the lowest MF and CSF. Several previous observations indicated that the physical properties of the three GMCs are markedly diverse. Yi et al. 2018 showed that the mean column densities of dense cores in these clouds can be ranked as Orionis, Orion A, and Orion B, from lowest to highest. Furthermore, cores in Orionis have the highest dust gas temperatures of the three clouds. Orion A has the most numerous young stars, while Orion B is probably an even younger cloud than Orion A (Yi et al. 2018; Bally 2008). The median core volume density of Orion B is greater than that of Orion A, although the temperatures are similar in the two subregions (Yi et al. 2018). The higher core volume density reduces the Jeans length in the Orion B cloud, resulting in an overall higher CSF compared to the Orion A cloud. The northern part of Orion A, the ISF, however, stands out in the Orion complex due to its intense star formation (Megeath et al. 2016) and extremely high gas density (Hacar et al. 2018; Schuller et al. 2021; Yun et al. 2021). It is the most massive filament among the Gould Belt clouds (Bally et al. 1987; Schuller et al. 2021). The ISF region, with high-mass star formation in its dense center (the ONC), shows the highest MF and CSF among Orion GMCs. In contrast, the southern part of Orion A, L1641, containing only low-mass star formation, shows a comparable MF and smaller CSF when compared with Orion B GMC. These results indicate that binary/multiple systems form more frequently in high-density clouds.
Meanwhile, the Orionis cloud, which has a unique ringlike structure, is composed of an Hii region and OB associations in the center. The Orionis dense cores that we observed in the ALMASOP survey are exposed to the strong UV radiation from the Hii region, where the ionization front heats the cores. In addition, the shock and energy input to the environment from supernova explosion feedback and stellar feedback from the OB association, for example, UV radiation and photoevaporation, can also influence the star formation process in these bright-rimmed dense cores, consequently limiting the star formation rates therein (Cunha & Smith 1996; Maddalena & Morris 1987; Liu et al. 2016; Kounkel 2020; Yi et al. 2021). In simulations, the radiative feedback of OB stars or an Hii regions has been shown to be efficient in suppressing fragmentation in dense gas (Myers et al. 2013). However, we note that binary/multiple systems could also form in some dense cores (such as G196.92-10.37 in the B35 cloud) in the Orionis GMC because these cores are mostly shielded from the UV radiation due to their high density and large mass. Such cores, however, are very rare in the Orionis GMC (Yi et al. 2018), which may explain the overall low formation rate of binary/multiple stars in the Orionis GMC. In contrast, although the ISF region in Orion A is also exposed to strong UV radiation from OB clusters, the ISF shows a very high MF and CSF because of its extremely high density.
V.3 Different evolutionary stages of protostars in Binary/Multiple Systems
The physical properties of protostars in binary/multiple-system cores are discussed in the appendix. We find that the protostars in most multiple systems are not at identical stages of evolution, as judged by their infrared emission. Interestingly, we find that in some systems (such as G196.92-10.37, G205.46-14.56M1, G205.46-14.56S1, G208.68-19.20N2, G208.68-19.20N3 and G210.49-19.79W) infrared-brighter member protostars, which are more evolved, tend to be located farther from the SCUBA-2 core centers than these less evolved member protostars. This may indicate that protostars will migrate out of their natal cores as they evolve. These wide binary/multiple systems are very likely to become gravitationally unbound as they evolve. Previous statistical studies have also found that the MF and CSF decrease from Class 0 to Class I, and to Class II protostars and field stars (Chen et al. 2013; Tobin et al. 2022), indicating that a large fraction of binary/multiple systems formed in early evolutionary stages will become unbound finally. The ALMASOP data, however, do not have high enough spectral resolution or suitable molecular line tracers for investigating the kinematics and dynamics of member protostars. Therefore, with the present data, we cannot judge whether the binary/multiple systems are gravitationally bound or not. Future more sensitive and higher spectral resolution molecular line observations with ALMA will help determine the gravitational stability or even orbital motions of these systems.
Figure 9 in the appendix presents the CO outflow maps for these systems. In most cases, only one member protostar in a binary/multiple system drives a highly collimated bipolar outflow, which is commonly seen for Class 0 protostars. The other protostars, however, are not associated with energetic outflows, indicating that they could be at a more evolved phase. This difference also implies that protostars in binary/multiple systems could have very different accretion histories or they could have competed for gas to accrete from their natal cores in their formation process.
In the turbulent fragmentation model, multiple protostars can form in the same core with unevenly sized substructures created by turbulent fluctuation. In this scenario, the evolution timescale of each member protostar in the same core could also be very different. Therefore, the turbulent fragmentation model can well explain the different evolutionary stages of member protostars in binary/multiple systems, as witnessed here.
VI Summary
We studied 43 low-mass protostellar cores in the Orion Molecular Cloud Complex that were observed in ALMASOP. We used 1.3 mm continuum emission to detect protostars. We investigated the stellar multiplicity of these cores, and analyzed how the different properties of the dense cores may influence the formation of single systems or binary/multiple systems. Our main results are summarized as follows:
(1) From 1.3 mm continuum emission, we identified 13 binary/multiple systems, 1 binary-system candidate, and 29 single-star systems. The overall MF and the CSF of the ALMASOP sample in the Orion complex ( Orionis, Orion B, and Orion A) are 28 and , respectively. Among the Orion GMCs, Orionis has the lowest multiplicity (MF and CSF), while the northern part of Orion A (the ISF) has the highest MF and CSF.
(2) We have determined the separation of companions in each dense core. The median separation is about 2100 au for the 13 binary/multiple systems. A bimodal distribution is seen in companion separation with one peak at 500 au and the another peak at 3500 au.
(3) We found evidence that the properties of the dense core have an effect on binary/multiple-system formation. Specifically, we suggest that the gas density and Mach number of cores may be key factors that promote binary/multiple-star formation in the early stages of dense core to stellar system evolution.
(4) The low multiplicity in Orionis may be due to further environmental effects. There, strong UV radiative feedback from the giant Hii region in Orionis may destroy dense cores and suppress the formation of binary/multiple stellar systems.
(5) We found that protostars in each binary/multiple system are usually at very different evolutionary stages. Some protostars drive highly collimated CO outflows and are likely at the Class 0 stage, while other protostars without strong outflows are likely at later stages. More evolved member protostars tend to be located farther from the dense core centers than these less evolved member protostars, indicating that protostars will migrate out of their natal cores as they evolve.
We note that our studies are limited by the small sample, and also limited by the relatively poor spatial and spectral resolution. Our results could be further tested using future higher spatial and spectral resolution observations toward a more complete dense core sample in various molecular clouds that are in widely different environments.
Appendix A APPENDIX: Description of individual Binary/Multiple systems
In this appendix, we provide maps for the 14 dense cores containing binary/multiple systems and discuss the properties of member protostars based on near- and mid-infrared data from Spitzer (3.6 m, 4.5 m and 8 m) or WISE (3.4 m, 4.6 m and 12 m) data, JCMT 850 m data, ALMA 1.3 mm dust continuum data, and CO outflows. Figure 8 shows the infrared and dust continuum images of these systems, and each row of Figure 8 shows one source. Figure 9 presents their CO outflow maps. Table 6 lists the ALMASOP sources that were also observed in the VANDAM survey.
| ALMASOP sources | HOPS | Class of HOPS |
|---|---|---|
| Binary/Multiple Systems | ||
| G205.46-14.56M1A | HOPS-317-A | 0 |
| G205.46-14.56M1B | HOPS-317-B | 0 |
| G205.46-14.56M2A | HOPS-387-B | I |
| G205.46-14.56M2B | HOPS-387-A | I |
| G205.46-14.56M2C | HOPS-386-A | I |
| G205.46-14.56M2D | HOPS-386-B | I |
| G205.46-14.56M2E | HOPS-386-C | I |
| G205.46-14.56S1A | HOPS-358-A | 0 |
| G205.46-14.56S1B | HOPS-358-B | 0 |
| G206.93-16.61E2A | HOPS-298-A | I |
| G206.93-16.61E2B | HOPS-298-B | I |
| G208.68-19.20N2B | HOPS-89 | Flat |
| G208.68-19.20N3B | HOPS-92-A-A | Flat |
| G208.68-19.20N3C | HOPS-92-B | Flat |
| G208.68-19.20SA | HOPS-84-A | I |
| G208.68-19.20SB | HOPS-84-B | I |
| G209.55-19.68N1B | HOPS-12-B-A | 0 |
| G209.55-19.68N1C | HOPS-12-A | 0 |
| G210.49-19.79WA | HOPS-168-A | 0 |
| G210.97-19.33S2A | HOPS-377 | 0 |
| G210.97-19.33S2B | HOPS-144 | I |
| G211.47-19.27NA | HOPS-290-B | 0 |
| G211.47-19.27NB | HOPS-290-A | 0 |
| G212.10-19.15N2A | HOPS-263 | I |
| G212.10-19.15N2B | HOPS-262 | Flat |
| Single-star Systems | ||
| G205.46-14.56N1 | HOPS-402 | 0 |
| G205.46-14.56N2 | HOPS-401 | 0 |
| G205.46-14.56S2 | HOPS-385 | Flat |
| G205.46-14.56S3 | HOPS-315 | I |
| G206.12-15.76* | HOPS-400-B | 0 |
| G206.93-16.61W2 | HOPS-399 | 0 |
| G209.55-19.68S1 | HOPS-11 | 0 |
| G209.55-19.68S2 | HOPS-10 | 0 |
| G210.37-19.53S | HOPS-164 | 0 |
| G210.83-19.47S | HOPS-156 | I |
| G211.01-19.54N | HOPS-153 | 0 |
| G211.01-19.54S | HOPS-152 | 0 |
| G211.16-19.33N2 | HOPS-133 | I |
| G211.47-19.27S* | HOPS-288-A-A | 0 |
| G212.10-19.15S | HOPS-247 | 0 |
| G212.84-19.45N | HOPS-244 | 0 |
Note. — The two sources marked with * are identified in the VANDAM survey as binary/multiple systems. HOP-400 contains two protostars, A and B, are separated by 180 au. HOPS-288 contains three protostars; the remaining two protostars are 60 au and 250 au away from HOPS-288-A-A.
A.1 G196.92-10.37
G196.92-10.37 is located in an isolated dark nebula named B35A (LDN 1594), which is part of the Orionis molecular cloud. Several YSOs were found in B35A through the 37 m telescope of the Haystack Observatory and the 43-m telescope of NRAO (Benson & Myers 1989). Connelley et al. 2008 discovered a protobinary system using the UH 2.2 m infrared telescope near the dense core. The Two Micron All Sky Survey (2MASS) and the Spitzer Legacy Program found two YSO candidates, which are identified as protostars B and C in this dense core in our observation (Cutri et al. 2003; Evans et al. 2003; Noble et al. 2013).
As shown in Figure 1 (a), G196.92-10.37 is a cometary bright-rimmed core that is forming a small cluster. From the zoomed-in image in Figure 1 (b), we find three infrared point sources in the ALMA FOV. The eastern infrared point source is further resolved into a close binary (B and C) in ALMA observations, as shown in Figure 1 (c). The southwest infrared point source is also detected in the ALMA 1.3 mm continuum, and is labeled as A in Figure 1 (c). The infrared point source that is located to the north of A has not been detected in 1.3 mm continuum emission, indicating that it may be a foreground/background star or a very evolved protostar.
The three protostars detected by ALMA are at very different phases of evolution (Dutta et al. 2020). G196.92-10.37A is a Class 0 source with an envelope+disk mass of 0.069 0.029 . The ALMA 1.3 mm dust continuum observations show an extended structure around this protostar. The G196.92-10.37B protostar is in the Class I phase, and its envelope+disk mass is 0.042 0.018 . The separation between A and B is 4700 au. G196.92-10.37C is a Class I protostar with a low thermal luminosity and an envelope+disk mass of 0.005 0.002 . B and C form a close binary with a projected separation of only 300 au. The two Class I protostars B and C are located away from the center of the SCUBA-2 core. In contrast, the youngest protostar A is located at the center.
As shown in Figure 9, G196.92-10.37A drives a strong and large-scale wide-angle outflow, while the outflows detected in the vicinity of 196.92-10.37B and G196.92-10.37C are very weak.
A.2 G205.46-14.56M1
G205.46-14.56M1 is located in the L1630 region of Orion B. Many Herbig-Haro objects such as HH 24-26 YSOs have been found near the dense core (Phillips et al. 2001). Among them, HH 24 MMS is identified as a binary system driving a bipolar jet discovered by VLA. The 6.9 mm continuum emission reveals that the protostellar system is still in the early phase (Kang et al. 2008). The separation of the companions is about 360 au. In addition, the VISTA/VIRCAM near-infrared survey and JCMT SCUBA-2 survey have found some additional YSOs around the core (Spezzi et al. 2015; Kirk et al. 2016).
Figure 8 presents maps for G205.46-14.56M1. Two protostars (A and B) are identified in our ALMA observation, as shown in panel (c). The G205.46-14.56MB, located at the center of the SCUBA-2 core, is not detected at infrared wavelengths, indicating that it is a prestellar core or in an extremely early stage of evolution. As shown in Figure 9, this object is not associated with an apparent outflow, further suggesting that it is more likely a prestellar core. Its total gas mass is 2.245 0.960 . G205.46-14.56M1A is a Class I protostar with an envelope+disk mass of 0.064 0.028 . It is near the edge of the SCUBA-2 core. However, it is still drives a very collimated outflow as shown in Figure 8. The distance between these two objects is 2300 au.
A.3 G205.46-14.56M2
G205.46-14.56M2 is also located in the L1630 region of Orion B. Some YSOs have been previously identified by 2MASS, Spitzer, and JCMT SCUBA surveys (Cutri et al. 2003; Megeath et al. 2012; Kirk et al. 2016). This dense core is surrounded by a well-known HH 24 complex and the two Class 0 protostars SSV63E and SSV63W (Ozawa et al. 1999).
In G205.46-14.56M2, we find a rare multiple system containing five protostars. Among them, AB and CD seem to form a pair of twin binary systems. From the ALMA 1.3 mm dust continuum image, it seems that the four protostars are not connected to protostar E, as shown in Figure 8 (c). G205.46-14.56M2A and G205.46-14.56M2B are the closest companions of all, with a separation of only 700 au. G205.46-14.56M2 is in unknown stage and G205.46-14.56M2B is in the Class I phase with envelope+mass masses of 0.037 0.016 and 0.124 0.053 , respectively. G205.46-14.56M2C and G205.46-14.56M2D are relatively close, and their separation is 1000 au. G205.46-14.56M2C is in unknown stage and G205.46-14.56M2D is in the Class I phase with envelope+disk masses of 0.091 0.039 and 0.028 0.01 2 . The distance between these two pairs is 3800 au. In our analysis, we find that G205.46-14.56M2E, located 5000 au away from the other four protostars, has an unknown evolutionary stage with an envelope+disk mass of 0.011 0.005 .
As shown in Figure 9, G205.46-14.56M2 and G205.46-14.56M2D drive weak but well-collimated outflows. G205.46-14.56M2A and G205.46-14.56M2C are also associated with weak outflows.
This multiple system will be discussed in a detailed paper by T. Liu et al. (2022, in preparation)
A.4 G205.46-14.56S1
G205.46-14.56S1 is located in the HH 24-26 region of Orion B. HH 25MMS, a Class 0 source studied extensively by the JCMT, VLA and IRAM, is situated near this dense core (Gibb & Davis 1998; Bontemps et al. 1995; Lis et al. 1999; Phillips et al. 2001; Gibb et al. 2004; Chen et al. 2013). In addition, several YSOs were discovered in the vicinity by Spitzer, AKARI, and JCMT SCUBA surveys (Megeath et al. 2012; Noble et al. 2013; Kang et al. 2015; Furlan et al. 2016; Kirk et al. 2016).
As shown in Figure 8 (a), no infrared sources are found at the center of the 850 m continuum emission map. Two protostars, however, are identified in the our ALMA observation. G205.46-14.56S1A and G205.46-14.56S1B are in the Class 0 phase with a separation of 5200 au and their envelope+disk masses are 0.151 0.065 and 0.391 0.167 , respectively.
Figure 9 shows a very collimated outflow traced by 12CO that is driven by G205.46-14.56S1B. On the other hand, G205.46-14.56S1A is drives a much weaker outflow, which seems to overlay the outflow from G205.46-14.56S1B.
A.5 G206.93-16.61E2
G206.93-16.61E2 in Orion B is found close to the reflection nebula NGC 2023. Several YSOs have been discovered in JCMT SCUBA-2, Spitzer, and 2MASS all-sky surveys near G206.93-16.61E2 (Cutri et al. 2003; Megeath et al. 2012; Kirk et al. 2016).
As shown in Figure 8 (a), a bright infrared source is detected in the ALMA FOV. In the ALMA image, as shown in Figure 8 (c), the infrared source is resolved into four protostars in this system. Since these four protostars cannot be separated in infrared band, their evolutionary stages are not well determined. Their envelope+disk masses are 0.280 0.120 , 0.112 0.048 , 0.219 0.097 and 0.252 0.110 , respectively. Three protostars (A, C and D) are close to one another with an average separation of 450 au, while the other protostar G206.93-16.61E2B is approximately 1000 au away from them. From Figure 9, one can see that the outflows of this core are very complicated, which seems to be caused by the orbital rotation of the member protostars in the multiple system. More details of this system will be presented in a following paper (Q. Luo et al. 2022, in preparatioin).
A.6 G207.36-19.82N1
G207.36-19.82N1 is located in Orion A. In the VISTA Orion A survey, a protostar candidate named 2MASS J05305129-0410322 was identified, which we regard as G207.36-19.82N1B ALMA data observation (Meingast et al. 2018). An HH 58 object was also discovered near the core (Tatematsu et al. 2017).
Figure 8 (a) shows an infrared source slightly offset from the center of the 850 m continuum, implying that the evolutionary stage of G207.36-19.82N1B may be similar to that of G207.36-19.82N1A. In our ALMA observation, we find a binary system in this dense core. The two protostars have envelope+disk masses of 0.113 0.048 and 0.011 0.005 and the separation between them is 5400 au. As shown in Figure 8 (c), G207.36-19.82N1A shows a flattened disklike structure.
Figure 9 reveals a high-velocity outflow with asymmetric structures in the vicinity of G207.36-19.82N1A, while G207.36-19.82N1B is not associated with an outflow. Both of them are likely at the Class II phase or an even later phase.
A.7 G208.68-19.20N2
G208.68-19.20N2 is located in Orion A and some YSOs were discovered to be associated with it in JCMT SCUBA and Green Bank Telescope 3.3 mm continuum emission observation (Di Francesco et al. 2008; Schnee et al. 2014).
A protobinary system candidate containing a starless core and a protostar is found in this dense core based on our ALMA 1.3 mm dust continuum observations. The starless core G208.68-19.20N2A is very dense and will collapse to form a new protostar (Sahu et al. 2021b). The protostar G208.68-19.20N2B is not associated with an outflow, indicating that it is likely an evolved Class I protostar. The envelope+disk mass of this protostar is just 0.009 0.001 .
A.8 G208.68-19.20N3
G208.68-19.20N3 is located in a filament in Orion A. As shown in Figure 8 (b), our ACA 1.3 mm continuum observations resolve the core into two subcores. The southern subcore is associated with an infrared object, which is further resolved into a close binary in our high-resolution ALMA observations shown in Figure 8 (c). In total, the ALMA 1.3 mm emission continuum reveals three protostars in this core. G208.68-19.20N3A is a Class 0 protostar and its distance from the other two protostars is 6000 au. G208.68-19.20NB and G208.68-19.20NC are only 600 au apart. Both of them are Class I protostars, and located offset from the center of the SCUBA-2 core. These three protostars have the envelope+disk masses of 0.436 0.189 , 0.078 0.033 , 0.093 0.040 , respectively. Figure 9 shows a collimated outflow from G208.68-19.20NA that is perpendicular to its extended disklike structure. The two remaining protostars are also associated with outflows but most of their outflows are located beyond our FOV.
A.9 G208.68-19.20S
G208.68-19.20S is in Orion A, and several protostars have been discovered there in the AzTEC 1.1 mm survey (Shimajiri et al. 2015).
As shown in Figure 8 (c), two Class I protostars are found in our ALMA observations, and they are close to each other with a separation of only 300 au. Their envelope+disk masses are 0.421 0.180 for the protostar A and 0.043 0.061 for the protostar B. As shown in Figure 9, the binary system drives an outflow along the east-west direction and the outflow is much weaker than other Class 0 outflows in the ALMASOP sample. Moreover, there is no obvious red-shift emission of the high-speed component of 12CO around the protostars.
A.10 G209.55-19.68N1
G209.55-19.68N1 is in Orion A, and a young star named HOPS-12 has been discovered near this dense core (Furlan et al. 2016).
From ALMA data, three protostars are detected in this dense core. Figure 8 (c) shows two substructures encasing the three protostars. G209.55-19.68N1B and G209.55-19.68N1C reside in the same substructure and are about 400 au apart. G209.55-19.68N1A lies in another substructure and is separated from G209.55-19.68N1B by 4800 au. Their envelope+disk masses are 0.141 0.060 , 0.061 0.027 , 0.132 0.057 M⊙ for components A, B and C, respectively.
As shown in Figure 9, G209.55-19.68N1A drives a very collimated outflow. The red lobe of outflow from G209.55-19.68N1B, however, is distinctly distorted. Moreover, the CO emission near G209.55-19.68N1C is weak and may be contaminated by the outflow from G209.55-19.68N1B.
A.11 G210.49-19.79W
G210.49-19.79W is in Orion A. In the vicinity of the dense core, past VLA observations have detected the VLA 4 source with an H2O maser (Rodríguez et al. 2000).
There are two protostars in different evolutionary stages in the dense core. G210.49-19.79WA is proved to be in Class 0 and its envelope+disk mass is 0.201 0.086 . G210.49-19.79WB is at a more evolved stage and its envelope+disk mass is 0.008 0.003 . The separation of one from the other is 2800 au. The younger protostar G210.49-19.79WA is located at the center of the SCUBA-2 core, while the older protostar is clearly offset from the core center.
As shown in Figure 9, G210.49-19.79WA drives a collimated wide-angle outflow. We do not detect 12CO emission in the surroundings of G210.49-19.79WB, which may imply that G210.49-19.79WB has stopped accretion.
A.12 G210.97-19.33S2
G210.97-19.33S2 is located in Orion A, and we have identified a protobinary system in its center. G210.97-19.33S2A is proved be an Class 0 protostar and G210.97-19.33S2B is an Class I protostar. Its envelope+disk masses are 0.020 0.009 and 0.018 0.008 respectively. The separation between the two protostars (A and B) is 3400 au. Furthermore, we have discovered two additional protostars in the outer part of the core: G210.97-19.33S2C and G210.97-19.33S2D. Figure 8 (c) shows that G210.97-19.33S2C and G210.97-19.33S2D are more widely separated from the core center. Their position is near the edge of the FOV, and their emission is weak.
According to the high-velocity 12CO emission map in Figure 9, we have only detected outflows near G210.97-19.33S2A. The CO emission around G210.97-19.33S2B is very faint. G210.97-19.33S2C and G210.97-19.33S2D do not exhibit any line emission.
A.13 G211.47-19.27N
G211.47-19.27N is a faint SCUBA-2 850 m source to the north of a star cluster in Orion A. Several YSOs have been found in its surroundings by Spitzer observations and the Bolocam Galactic Plane Survey (Megeath et al. 2012; Merello et al. 2015). The infrared source associated with G211.47-19.27N is very faint and diffuse, as shown in Figure 8 (a) and Figure 8 (b). As shown in Figure 8 (c), two protostars are identified in the ALMA data, and they share a common envelope. The distance between the two protostars is 300 au, indicating that they are forming a close binary system. These two protostars are in the Class 0 phase, and their envelope+disk masses are 0.067 0.030 and 0.039 0.019 , respectively.
From Figure 9, we can see that the two Class 0 protostars drive powerful outflows, but it is impossible to identify the outflow-driving source.
A.14 G212.10-19.15N2
G212.10-19.15N2 is in Orion A. Two YSOs were detected in this core in Spitzer and 2MASS all-sky observations (Cutri et al. 2003; Megeath et al. 2012).
We have identified two Class I protostars in this dense core. G212.10-19.15N2A has an envelope+disk mass of 0.034 0.014 , and G212.10-19.15N2B has an envelope+disk mass of 0.014 0.006 . They are 2800 au apart. According to Figure 9, neither of these two protostars exhibits a clear outflow.


References
- Adams et al. (1989) Adams, F. C., Ruden, S. P., & Shu, F. H. 1989, ApJ, 347, 959, doi: 10.1086/168187
- Astropy Collaboration et al. (2013) Astropy Collaboration, Robitaille, T. P., Tollerud, E. J., et al. 2013, A&A, 558, A33, doi: 10.1051/0004-6361/201322068
- Bally (2008) Bally, J. 2008, in Handbook of Star Forming Regions, Volume I, ed. B. Reipurth, Vol. 4, 459
- Bally et al. (1987) Bally, J., Langer, W. D., Stark, A. A., & Wilson, R. W. 1987, ApJ, 312, L45, doi: 10.1086/184817
- Beckwith et al. (1990) Beckwith, S. V. W., Sargent, A. I., Chini, R. S., & Guesten, R. 1990, ApJ, 99, 924, doi: 10.1086/115385
- Beichman et al. (1986) Beichman, C. A., Myers, P. C., Emerson, J. P., et al. 1986, ApJ, 307, 337, doi: 10.1086/164421
- Benson & Myers (1989) Benson, P. J., & Myers, P. C. 1989, ApJS, 71, 89, doi: 10.1086/191365
- Bergin & Tafalla (2007) Bergin, E. A., & Tafalla, M. 2007, ARA&A, 45, 339, doi: 10.1146/annurev.astro.45.071206.100404
- Bonnell et al. (1992) Bonnell, I., Arcoragi, J.-P., Martel, H., & Bastien, P. 1992, ApJ, 400, 579, doi: 10.1086/172020
- Bonnell & Bate (1994) Bonnell, I. A., & Bate, M. R. 1994, MNRAS, 269, L45, doi: 10.1093/mnras/269.1.L45
- Bontemps et al. (1995) Bontemps, S., Andre, P., & Ward-Thompson, D. 1995, A&A, 297, 98
- Boss (1987) Boss, A. P. 1987, ApJ, 319, 149, doi: 10.1086/165441
- Boss (1991) —. 1991, Natur, 351, 298, doi: 10.1038/351298a0
- Chapman et al. (1992) Chapman, S., Pongracic, H., Disney, M., et al. 1992, Natur, 359, 207, doi: 10.1038/359207a0
- Chen et al. (2013) Chen, X., Arce, H. G., Zhang, Q., et al. 2013, ApJ, 768, 110, doi: 10.1088/0004-637X/768/2/110
- Cohen & Kuhi (1979) Cohen, M., & Kuhi, L. V. 1979, ApJS, 41, 743, doi: 10.1086/190641
- Connelley et al. (2008) Connelley, M. S., Reipurth, B., & Tokunaga, A. T. 2008, ApJ, 135, 2526, doi: 10.1088/0004-6256/135/6/2526
- Connelley et al. (2009) —. 2009, ApJ, 138, 1193, doi: 10.1088/0004-6256/138/5/1193
- Cunha & Smith (1996) Cunha, K., & Smith, V. V. 1996, A&A, 309, 892
- Currie et al. (2014) Currie, M. J., Berry, D. S., Jenness, T., et al. 2014, in Astronomical Society of the Pacific Conference Series, Vol. 485, Astronomical Data Analysis Software and Systems XXIII, ed. N. Manset & P. Forshay, 391
- Cutri et al. (2003) Cutri, R. M., Skrutskie, M. F., van Dyk, S., et al. 2003, VizieR Online Data Catalog, II/246
- Daemgen et al. (2015) Daemgen, S., Bonavita, M., Jayawardhana, R., Lafrenière, D., & Janson, M. 2015, ApJ, 799, 155, doi: 10.1088/0004-637X/799/2/155
- di Francesco et al. (2007) di Francesco, J., Evans, N. J., I., Caselli, P., et al. 2007, in Protostars and Planets V, ed. B. Reipurth, D. Jewitt, & K. Keil, 17. https://arxiv.org/abs/astro-ph/0602379
- Di Francesco et al. (2008) Di Francesco, J., Johnstone, D., Kirk, H., MacKenzie, T., & Ledwosinska, E. 2008, ApJS, 175, 277, doi: 10.1086/523645
- Duchêne et al. (2007) Duchêne, G., Bontemps, S., Bouvier, J., et al. 2007, A&A, 476, 229, doi: 10.1051/0004-6361:20077270
- Duchêne et al. (2004) Duchêne, G., Bouvier, J., Bontemps, S., André, P., & Motte, F. 2004, A&A, 427, 651, doi: 10.1051/0004-6361:20041209
- Duchêne & Kraus (2013) Duchêne, G., & Kraus, A. 2013, ARA&A, 51, 269, doi: 10.1146/annurev-astro-081710-102602
- Duquennoy & Mayor (1991) Duquennoy, A., & Mayor, M. 1991, A&A, 500, 337
- Dutta et al. (2020) Dutta, S., Lee, C.-F., Liu, T., et al. 2020, ApJS, 251, 20, doi: 10.3847/1538-4365/abba26
- Eden et al. (2019) Eden, D. J., Liu, T., Kim, K.-T., et al. 2019, MNRAS, 485, 2895, doi: 10.1093/mnras/stz574
- Evans et al. (2003) Evans, Neal J., I., Allen, L. E., Blake, G. A., et al. 2003, PASP, 115, 965, doi: 10.1086/376697
- Fisher (2004) Fisher, R. T. 2004, ApJ, 600, 769, doi: 10.1086/380111
- Furlan et al. (2016) Furlan, E., Fischer, W. J., Ali, B., et al. 2016, ApJS, 224, 5, doi: 10.3847/0067-0049/224/1/5
- Gibb & Davis (1998) Gibb, A. G., & Davis, C. J. 1998, MNRAS, 298, 644, doi: 10.1046/j.1365-8711.1998.01568.x
- Gibb et al. (2004) Gibb, A. G., Richer, J. S., Chandler, C. J., & Davis, C. J. 2004, ApJ, 603, 198, doi: 10.1086/381309
- Goodwin et al. (2004) Goodwin, S. P., Whitworth, A. P., & Ward-Thompson, D. 2004, A&A, 423, 169, doi: 10.1051/0004-6361:20040285
- Hacar et al. (2018) Hacar, A., Tafalla, M., Forbrich, J., et al. 2018, A&A, 610, A77, doi: 10.1051/0004-6361/201731894
- Haisch Jr. et al. (2004) Haisch Jr., K. E., Greene, T. P., Barsony, M., & Stahler, S. W. 2004, ApJ, 127, 1747, doi: 10.1086/381952
- Hatziminaoglou et al. (2018) Hatziminaoglou, E., Farrah, D., Humphreys, E., et al. 2018, MNRAS, doi: 10.1093/mnras/sty2073
- Heggie (1975) Heggie, D. C. 1975, MNRAS, 173, 729, doi: 10.1093/mnras/173.3.729
- Hsu et al. (2020) Hsu, S.-Y., Liu, S.-Y., Liu, T., et al. 2020, ApJ, 898, 107, doi: 10.3847/1538-4357/ab9f3a
- Hsu et al. (2022) Hsu, S.-Y., Liu, S.-Y., Liu, T., et al. 2022, ApJ, 927, 218, doi: 10.3847/1538-4357/ac49e0
- Juvela et al. (2010) Juvela, M., Ristorcelli, I., Montier, L. A., et al. 2010, A&A, 518, L93, doi: 10.1051/0004-6361/201014619
- Kang et al. (2008) Kang, M., Choi, M., Ho, P. T. P., & Lee, Y. 2008, ApJ, 683, 267, doi: 10.1086/589819
- Kang et al. (2015) Kang, M., Choi, M., Stutz, A. M., & Tatematsu, K. 2015, ApJ, 814, 31, doi: 10.1088/0004-637X/814/1/31
- Kim et al. (2020) Kim, G., Tatematsu, K., Liu, T., et al. 2020, ApJS, 249, 33, doi: 10.3847/1538-4365/aba746
- Kirk et al. (2016) Kirk, H., Francesco, J. D., Johnstone, D., et al. 2016, ApJ, 817, 167, doi: 10.3847/0004-637X/817/2/167
- Kounkel (2020) Kounkel, M. 2020, ApJ, 902, 122, doi: 10.3847/1538-4357/abb6e8
- Kounkel et al. (2016) Kounkel, M., Megeath, S. T., Poteet, C. A., Fischer, W. J., & Hartmann, L. 2016, ApJ, 821, 52, doi: 10.3847/0004-637X/821/1/52
- Kounkel et al. (2017) Kounkel, M., Hartmann, L., Loinard, L., et al. 2017, VizieR Online Data Catalog, J/ApJ/834/142
- Kraus & Hillenbrand (2007) Kraus, A. L., & Hillenbrand, L. A. 2007, ApJ, 662, 413, doi: 10.1086/516835
- Kraus & Hillenbrand (2012) —. 2012, ApJ, 757, 141, doi: 10.1088/0004-637X/757/2/141
- Kraus et al. (2011) Kraus, A. L., Ireland, M. J., Martinache, F., & Hillenbrand, L. A. 2011, ApJ, 731, 8, doi: 10.1088/0004-637X/731/1/8
- Lee et al. (2017) Lee, J.-E., Lee, S., Dunham, M. M., et al. 2017, NatAs, 1, 0172, doi: 10.1038/s41550-017-0172
- Lee et al. (2015) Lee, K. I., Dunham, M. M., Myers, P. C., et al. 2015, ApJ, 814, 114, doi: 10.1088/0004-637X/814/2/114
- Lee et al. (2020) Lee, Y.-N., Offner, S. S. R., Hennebelle, P., et al. 2020, Space Sci. Rev., 216, 70, doi: 10.1007/s11214-020-00699-2
- Lippincott (1978) Lippincott, S. L. 1978, Space Sci. Rev., 22, 153, doi: 10.1007/BF00212072
- Lis et al. (1999) Lis, D. C., Menten, K. M., & Zylka, R. 1999, ApJ, 527, 856, doi: 10.1086/308105
- Liu et al. (2016) Liu, T., Zhang, Q., Kim, K.-T., et al. 2016, ApJS, 222, 7, doi: 10.3847/0067-0049/222/1/7
- Liu et al. (2018) Liu, T., Kim, K.-T., Juvela, M., et al. 2018, ApJS, 234, 28, doi: 10.3847/1538-4365/aaa3dd
- Lomax et al. (2015) Lomax, O., Whitworth, A. P., Hubber, D. A., Stamatellos, D., & Walch, S. 2015, MNRAS, 447, 1550, doi: 10.1093/mnras/stu2530
- Ma et al. (2019) Ma, J., Cooray, A., Nayyeri, H., et al. 2019, ApJS, 244, 30, doi: 10.3847/1538-4365/ab4194
- Maddalena & Morris (1987) Maddalena, R. J., & Morris, M. 1987, ApJ, 323, 179, doi: 10.1086/165818
- Marcy & Benitz (1989) Marcy, G. W., & Benitz, K. J. 1989, ApJ, 344, 441, doi: 10.1086/167812
- McMullin et al. (2007) McMullin, J. P., Waters, B., Schiebel, D., Young, W., & Golap, K. 2007, in Astronomical Society of the Pacific Conference Series, Vol. 376, Astronomical Data Analysis Software and Systems XVI, ed. R. A. Shaw, F. Hill, & D. J. Bell, 127
- Megeath et al. (2012) Megeath, S. T., Gutermuth, R., Muzerolle, J., et al. 2012, ApJ, 144, 192, doi: 10.1088/0004-6256/144/6/192
- Megeath et al. (2016) —. 2016, ApJ, 151, 5, doi: 10.3847/0004-6256/151/1/5
- Meingast et al. (2018) Meingast, S., Alves, J., & Lombardi, M. 2018, A&A, 614, A65, doi: 10.1051/0004-6361/201731396
- Merello et al. (2015) Merello, M., Evans, Neal J., I., Shirley, Y. L., et al. 2015, ApJS, 218, 1, doi: 10.1088/0067-0049/218/1/1
- Montillaud et al. (2015) Montillaud, J., Juvela, M., Rivera-Ingraham, A., et al. 2015, A&A, 584, A92, doi: 10.1051/0004-6361/201424063
- Myers et al. (2013) Myers, A. T., McKee, C. F., Cunningham, A. J., Klein, R. I., & Krumholz, M. R. 2013, ApJ, 766, 97, doi: 10.1088/0004-637X/766/2/97
- Naidoo (2019) Naidoo, K. 2019, The Journal of Open Source Software, 4, 1721, doi: 10.21105/joss.01721
- Noble et al. (2013) Noble, J. A., Fraser, H. J., Aikawa, Y., Pontoppidan, K. M., & Sakon, I. 2013, ApJ, 775, 85, doi: 10.1088/0004-637X/775/2/85
- Offner et al. (2010) Offner, S. S. R., Kratter, K. M., Matzner, C. D., Krumholz, M. R., & Klein, R. I. 2010, ApJ, 725, 1485, doi: 10.1088/0004-637X/725/2/1485
- Ozawa et al. (1999) Ozawa, H., Nagase, F., Ueda, Y., Dotani, T., & Ishida, M. 1999, ApJ, 523, L81, doi: 10.1086/312247
- Phillips et al. (2001) Phillips, R. R., Gibb, A. G., & Little, L. T. 2001, MNRAS, 326, 927, doi: 10.1046/j.1365-8711.2001.04502.x
- Planck Collaboration et al. (2011) Planck Collaboration, Ade, P. A. R., Aghanim, N., et al. 2011, A&A, 536, A22, doi: 10.1051/0004-6361/201116481
- Planck Collaboration et al. (2016) —. 2016, A&A, 594, A28, doi: 10.1051/0004-6361/201525819
- Raghavan et al. (2010) Raghavan, D., McAlister, H. A., Henry, T. J., et al. 2010, ApJS, 190, 1, doi: 10.1088/0067-0049/190/1/1
- Reipurth et al. (2014) Reipurth, B., Clarke, C. J., Boss, A. P., et al. 2014, in Protostars and Planets VI, ed. H. Beuther, R. S. Klessen, C. P. Dullemond, & T. Henning, 267, doi: 10.2458/azu_uapress_9780816531240-ch012
- Reipurth et al. (2007) Reipurth, B., Guimarães, M. M., Connelley, M. S., & Bally, J. 2007, ApJ, 134, 2272, doi: 10.1086/523596
- Rodríguez et al. (2000) Rodríguez, L. F., Delgado-Arellano, V. G., Gómez, Y., et al. 2000, ApJ, 119, 882, doi: 10.1086/301231
- Sahu et al. (2021a) Sahu, D., Liu, S.-Y., & Liu, T. 2021a, FrASS, 8, 137, doi: 10.3389/fspas.2021.672893
- Sahu et al. (2021b) Sahu, D., Liu, S.-Y., Liu, T., et al. 2021b, ApJ, 907, L15, doi: 10.3847/2041-8213/abd3aa
- Schnee et al. (2014) Schnee, S., Mason, B., Di Francesco, J., et al. 2014, MNRAS, 444, 2303, doi: 10.1093/mnras/stu1596
- Schuller et al. (2021) Schuller, F., André, P., Shimajiri, Y., et al. 2021, A&A, 651, A36, doi: 10.1051/0004-6361/202038259
- Shimajiri et al. (2015) Shimajiri, Y., Kitamura, Y., Nakamura, F., et al. 2015, ApJS, 217, 7, doi: 10.1088/0067-0049/217/1/7
- Shu et al. (1987) Shu, F. H., Adams, F. C., & Lizano, S. 1987, ARA&A, 25, 23, doi: 10.1146/annurev.aa.25.090187.000323
- Spezzi et al. (2015) Spezzi, L., Petr-Gotzens, M. G., Alcalá, J. M., et al. 2015, A&A, 581, A140, doi: 10.1051/0004-6361/201425417
- Tatematsu et al. (2016) Tatematsu, K., Ohashi, S., Sanhueza, P., et al. 2016, PASJ, 68, 24, doi: 10.1093/pasj/psw002
- Tatematsu et al. (2017) Tatematsu, K., Liu, T., Ohashi, S., et al. 2017, ApJS, 228, 12, doi: 10.3847/1538-4365/228/2/12
- Tatematsu et al. (2021) Tatematsu, K., Kim, G., Liu, T., et al. 2021, ApJS, 256, 25, doi: 10.3847/1538-4365/ac0978
- Tobin et al. (2016) Tobin, J. J., Looney, L. W., Li, Z.-Y., et al. 2016, ApJ, 818, 73, doi: 10.3847/0004-637X/818/1/73
- Tobin et al. (2016) Tobin, J. J., Kratter, K. M., Persson, M. V., et al. 2016, Natur, 538, 483, doi: 10.1038/nature20094
- Tobin et al. (2022) Tobin, J. J., Offner, S. S. R., Kratter, K. M., et al. 2022, ApJ, 925, 39, doi: 10.3847/1538-4357/ac36d2
- Wang et al. (2014) Wang, K., Zhang, Q., Testi, L., et al. 2014, MNRAS, 439, 3275, doi: 10.1093/mnras/stu127
- Whitworth et al. (1995) Whitworth, A. P., Chapman, S. J., Bhattal, A. S., et al. 1995, MNRAS, 277, 727, doi: 10.1093/mnras/277.2.727
- Wright et al. (2010) Wright, E. L., Eisenhardt, P. R. M., Mainzer, A. K., et al. 2010, ApJ, 140, 1868, doi: 10.1088/0004-6256/140/6/1868
- Wu et al. (2012) Wu, Y., Liu, T., Meng, F., et al. 2012, ApJ, 756, 76, doi: 10.1088/0004-637X/756/1/76
- Xu et al. (2021) Xu, F., Wu, Y., Liu, T., et al. 2021, ApJ, 920, 103, doi: 10.3847/1538-4357/ac1686
- Xu et al. (2020) Xu, X., Li, D., Dai, Y. S., Fuller, G. A., & Yue, N. 2020, ApJ, 894, L20, doi: 10.3847/2041-8213/ab8ad7
- Yi et al. (2021) Yi, H.-W., Lee, J.-E., Kim, K.-T., et al. 2021, ApJS, 254, 14, doi: 10.3847/1538-4365/abec4a
- Yi et al. (2018) Yi, H.-W., Lee, J.-E., Liu, T., et al. 2018, ApJS, 236, 51, doi: 10.3847/1538-4365/aac2e0
- Yun et al. (2021) Yun, H.-S., Lee, J.-E., Evans, N. J., et al. 2021, ApJ, 921, 31, doi: 10.3847/1538-4357/ac193e