VisCUIT: Visual Auditor for Bias in CNN Image Classifier
Abstract
CNN image classifiers are widely used, thanks to their efficiency and accuracy. However, they can suffer from biases that impede their practical applications. Most existing bias investigation techniques are either inapplicable to general image classification tasks or require significant user efforts in perusing all data subgroups to manually specify which data attributes to inspect. We present VisCUIT, an interactive visualization system that reveals how and why a CNN classifier is biased. VisCUIT visually summarizes the subgroups on which the classifier underperforms and helps users discover and characterize the cause of the underperformances by revealing image concepts responsible for activating neurons that contribute to misclassifications. VisCUIT runs in modern browsers and is open-source, allowing people to easily access and extend the tool to other model architectures and datasets. VisCUIT is available at the following public demo link: https://poloclub.github.io/VisCUIT. A video demo is available at https://youtu.be/eNDbSyM4R_4.

1 Introduction
Recently, data classification algorithms are widely used for practical applications, such as face recognition ParmarM14; TaigmanYRW14; WangD21a, autonomous driving PrabhakarKNK17; FujiyoshiHY19, and clinical trials Topol19; ShahKKGHLRS19; ZoabiDS21. Despite the fact that visual models outperform humans in some circumstances Buetti-DinhGBIHCBPWSVD19, several works have found that these classifiers are often biased with disparate performance across data subgroups AngwinLMK16; BuolamwiniG18; KrishnapriyaAVKB20; MehrabiMSLG21. Exploiting the biased classifiers for critical purposes can cause unintentional fairness violation and huge societal problems GarvieBF16; OsobaW17; ZweigWK18; Washington19.
Likewise, image classifiers based on deep convolutional neural networks (CNN), which have achieved state-of-the-art performance in various areas KrizhevskySH12; SzegedyLJSRAEVR15; HeZRS16; SharmaJM18; SultanaSD19, often suffer from biases KrishnapriyaAVKB20. To facilitate real-world applications of the state-of-the-art techniques, there have been attempts to understand AlbieroSVZKB20; DrozdowskiRDDB21; CavazosPCO21 and mitigate WangZYCO19; WangD20; DharGSCC20; Gong0021 the biases in CNN classifiers. However, most existing methods require humans to specify the attributes on which to audit the classifiers. As people tend to focus more on sensitive attributes (e.g., race, gender), less sensitive attributes (e.g., wearing glasses, hair color) that can correlate with biases and degrade the overall performance are easily missed. Existing approaches assume availability of additional attributes other than the class label for each image; thus, datasets without any additional attributes cannot be analyzed using these methods.
Krishnakumar et al. KrishnakumarPSH21 proposed UDIS, which automatically detects the data subgroups, on which a CNN classifier underperforms. While UDIS does not require additional attribute labels, the approach produces a large number of potentially biased subgroups which may or may not align with semantic concepts. This leads to ambiguous findings even after substantial manual inspection. Moreover, most aforementioned bias investigation approaches detect the source of biases in classifiers, primarily focusing on their training datasets, not how the neurons in the classifier are activated and generate biased outputs BuolamwiniG18; AlbieroSVZKB20; Derman21.
In this paper, we present VisCUIT, an interactive visualization system that reveals how and why a CNN image classifier is biased, without requiring users to pre-determine which attributes to inspect. VisCUIT’s major contributions include:
- •
Visual summarization of the undeperforming subgroups. VisCUIT highlights the data subgroups generated by UDIS KrishnakumarPSH21 on which a CNN classifier underperforms. This allows users to understand how the classifier is biased, not limiting the bias factors to the sensitive attributes. As VisCUIT summarizes the undeperforming subgroups as a list, users can easily characterize each subgroup. For each undeperforming subgroup, VisCUIT also displays its most similar subgroup with high accuracy, based on Euclidean distance in the feature space, enabling users to gain insights into the deviant features responsible for the biases KrishnakumarPSH21.
- •
Visual bias attribution in CNN image classifiers. VisCUIT demonstrates why a CNN classifier underperforms on each subgroup, by revealing image concepts responsible for activating neurons that contribute to the underperformances. Users can observe how the classifier is activated differently by the underperforming and well-performing subgroups, focusing on the high-level concepts in images. Moreover, for each image, VisCUIT displays Grad-CAM Window, which visually highlights features in an input image deemed relevant for classification SelvarajuCDVPB17.
- •
Open-sourced, web-based implementation. VisCUIT runs directly in modern browsers and is open-source,11 1 Code: https://github.com/poloclub/VisCUIT allowing people to easily access and extend the tool to other model architectures and datasets. Figure 1 illustrates the user interface of VisCUIT. VisCUIT is available at the following public demo link: https://poloclub.github.io/VisCUIT. A video demo is available at https://youtu.be/eNDbSyM4R_4.
2 Related Works
2.1 Identification of Biases in Algorithms
There have been many efforts to identify biases (i.e. the disparity in the performance among the data subgroups) in the state-of-the-art algorithms. Many of the face recognition algorithms have been proven to include racial and gender biases ZouS18; BuolamwiniG18; AlbieroSVZKB20; CavazosPCO21. Lambrecht et al. LambrechtT19 and Angwin et al. AngwinLMK16 revealed that the advertisement recommendation systems and legal decision making software are also biased against specific ethnicity or gender. However, all these approaches require people to predefine protected attributes to audit the algorithms; therefore, only few sensitive factors (e.g., race, gender) are considered. Moreover, these methods are inapplicable to the image classification tasks whose datasets do not contain any additional attributes, such as ethnicity and gender, other than the class labels.
To analyze biases in general image classifiers, Singh et al. SinghMGLFG20 investigated the co-occurence between objects and their contexts for each category and attempted to decorrelate them to reduce classifiers’ dependency on the contexts. UDIS KrishnakumarPSH21, which is developed to generate the image subgroups without human guides or additional attributes, clustered images based on the last-layer feature vectors from classifiers and extracted the subgroups with low accuracies. However, it is hard to define how a classifier is biased using these methods since numerous subgroups are generated and the characteristics of each subgroup is often unclear. Furthermore, most existing approaches BuolamwiniG18; AlbieroSVZKB20; Derman21 argue that the skewness in training datasets is the major source of biases but do not inspect how the neurons in the classifiers are activated and generate biased outputs. Different from the existing methods, VisCUIT visually summarizes the discovered subgroups to allows users to easily define each underperforming subgroup. Also, VisCUIT reveals which neurons and image concepts are responsible for making predictions for each subgroup, so that users can learn more about why the classifier underperforms on some subgroups.
2.2 Bias Analysis Toolkits
Since bias can hugely affect various people’s lives, the toolkits to help people without much background knowledge understand algorithmic biases have been actively developed. FairML Adebayo16 quantifies the relative significance of the inputs to a predictive model to evaluate the model’s fairness. While Aequitas SaleiroKSAHLG18 enables users to easily measure fairness of algorithms using various metrics, AI Fairness 360 BellamyDHHHKLMM19 integrates a number of state-of-the-art techniques for algorithmic biases, including bias assessment metrics, bias mitigation algorithms, and bias explanations. FairVis CabreraEHKMC19 allows users to generate and explore data subgroups based on their domain knowledge and suggests relevant subgroups. However, these approaches are applicable only for the datasets with abundant well-defined attributes (e.g. tabular data), and therefore cannot handle the models associated with image data unless additional attributes for the data are provided.
2.3 CNN Analysis Techniques
A growing body of research has proposed techniques to help people interpret the behaviors of CNN models. Earlier CNN interpretation approaches have made input-level explanations, which aim to reveal the features in inputs with major contribution to model behaviors SimonyanVZ13; SelvarajuCDVPB17. However, these approaches do not demonstrate which neurons in CNN models are responsible for the model behaviors. Recently, several methods propose neuron-level explanations fong2018net2vec; HohmanPRC20; ParkDDWSHC21. In parallel, some research attempts to interpret adversarial attack in CNNs das2020bluff; cantareira2021explainable; ma2021understanding, hyperparameter tuning optuna_2019; joo2021guided; jin2021keras, and model selection mostafa2021visualizing. VisCUIT focuses on biases in CNN models and investigates neuron activations in the model to understand why the model generates biased outputs.
3 System Design and Implementation
3.1 Overview
User Interface. VisCUIT aims to reveal how and why a CNN image classifier is biased. VisCUIT consists of the Subgroup Panel (Figure 1A) and the Neuron Activation Panel (Figure 1B). The Subgroup Panel displays image subgroups on which the CNN classifier underperforms and allows users to select a subgroup to explore. For a selected underperforming subgroup, the Subgroup Panel shows a well-performing subgroup similar to the selected underperforming subgroup, where similarity is determined based on the last-layer feature vectors from the classifier. At the bottom of the Subgroup Panel, the confusion matrices of the two subgroups are displayed. The Neuron Activation Panel (Figure 1B) helps users discover and characterize the cause of the underperformances, by revealing image concepts responsible for activating neurons that contribute to the subgroups’ predictions.
Dataset and Open-source System Implementation. In our demo, we investigate the ResNet50 HeZRS16 classifier that has been trained with the biased CelebA LiuLWT15; KrishnakumarPSH21 dataset to predict whether a person in an image is smiling and has achieved an accuracy of 92.1%. To verify the validity of VisCUIT, we intentionally increase the co-occurrence of the attribute black hair and the label smiling, so that the classifier would more likely use image features related to black hair to predict smiling; and VisCUIT would identify such biases. VisCUIT is open-source, and can be easily extended to support other model architectures and datasets. We have implemented VisCUIT using the standard HTML/CSS/JavaScript web technology stack and the D3.js BostockOH11 visualization library. CNN model training and inference are all implemented using PyTorch paszke2019pytorch.
3.2 Subgroup Panel
Underperforming Subgroups. The Subgroup Panel (Figure 1A), shows a list of underperforming subgroups, whose accuracies are much lower than the model’s overall accuracy of 92.1%. We adopt the UDIS KrishnakumarPSH21 subgroup discovery algorithm to identify these underperforming subgroups, which works by clustering the images based on their feature vectors from the last layer of the classifier, and then collecting the clusters with accuracies lower than half of the overall accuracy. Each subgroup’s accuracy and images are displayed, and the subgroups are sorted by accuracy. An image incorrectly predicted by the classifier is marked with a small red cross ( ).
Most Similar Subgroup with High Accuracy. When the user clicks an underperforming subgroup, VisCUIT displays its most similar subgroup with high accuracy, based on Euclidean distance in the feature space, enabling users to gain insights into the deviant features responsible for the biases KrishnakumarPSH21. We call this subgroup the “well-performing similar subgroup.” In more detail, to assess the similarity between subgroups, we compute the vector embedding of each subgroup, by averaging the last-layer feature vectors from the classifier of all the images in the subgroup. Using the obtained subgroup embeddings, we evaluate the Euclidean distances between subgroups and regard the well-performing subgroup closest to the selected underperforming subgroup as its most similar well-performing subgroup. The well-performing subgroup is summarized in the same format as the underperforming subgroup, displaying its accuracy and images.
Grad-CAM Window. When user clicks an image in the selected underperforming subgroup or its well-performing similar subgroup, a Grad-CAM Window pops up (Figure 2). The window contains the selected image’s prediction results and Grad-CAM SelvarajuCDVPB17 saliency visualizations. Grad-CAM is one of the most popular methods that visually highlights features in an input image deemed relevant for classification; using Grad-CAM, users can more easily understand why an image is incorrectly classified SelvarajuCDVPB17.
Subgroup Confusion Matrix. The bottom of the Subgroup Panel shows the confusion matrices of the selected underperforming subgroup and its similar well-performing subgroup to summarize the prediction results within those subgroups. It helps users more easily assess the types of classification errors and their distributions across the class labels.

3.3 Neuron Activation Panel
The Neuron Activation Panel (Figure 1B) helps users discover the cause of the underperformances, by revealing image concepts responsible for activating neurons that contribute to misclassifications of the selected underperforming subgroup.
Neuron Activations. The Neuron Activation Panel displays the highly activated neurons for the selected underperforming subgroup and its similar well-performing subgroup. To reveal how the two subgroups diverge in the classifier, we organize the neurons into 3 columns: Underperforming Subgroup, Both, and Well-performing Similar Subgroup. The neurons in the columns Underperforming Subgroup and Well-performing Similar Subgroup are activated only by the underperforming and well-performing similar subgroup, respectively, while the neurons in the column Both are activated by both of the subgroups. To help users more easily assess each layer’s contribution to the predictions, the neurons are organized vertically based on their layers in the classifier.
For each neuron, we evaluate neuron activation score, which is the baseline for differentiating highly activated neurons from others. The neuron activation score is evaluated based on the neuron importance measurement method in Summit HohmanPRC20. For each image, each neuron’s maximum activation across spatial locations is considered as the activation value of the neuron for the image. Then, for each layer, we extract the neurons with the highest activation values until the sum of the extracted neurons’ activation values exceeds 3% of the layer’s total activation value, and we consider the extracted neurons as the highly activated neurons for the image. We identify highly activated neurons for all the images in a subgroup, and for each of the neurons, we calculate the proportion of the images in the subgroup that have the neuron as their highly activated neuron. The proportion is used as the neuron’s activation score for the subgroup.
The header above the Neuron Activation Panel displays a slider to adjust the threshold for neuron activation score. When user increases the threshold, the neurons, whose activation scores for either the selected underperforming subgroup or its similar well-performing subgroup are lower than the threshold, are relocated or filtered out. The threshold ranges from 0.5 to 1.0; we set the lower bound to 0.5 to prevent numerous neurons from appearing and overwhelming users.
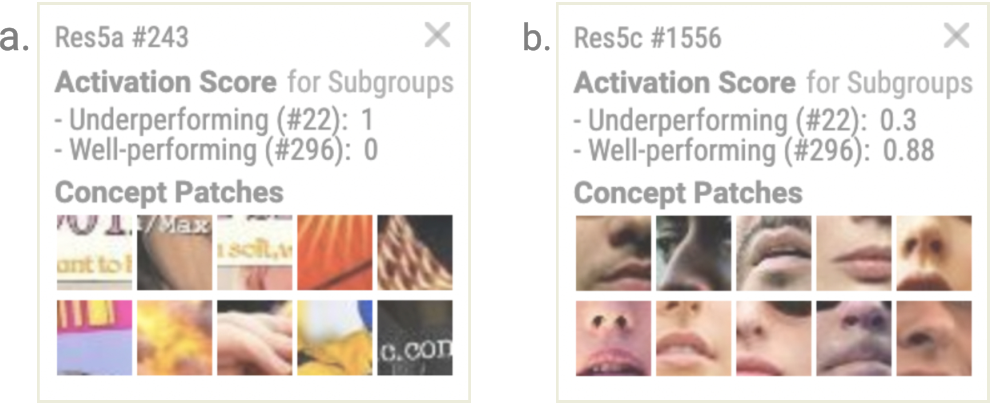
Neuron Concept Window. When a neuron is clicked, VisCUIT shows a Neuron Concept Window, which contains the neuron’s activation scores for the underperforming and well-performing subgroups and concept patches (Figure 3). This window helps users understand how much and why each of the neurons have been activated by each subgroup. We generate the concept patches based on the existing methods HohmanPRC20; ParkDDWSHC21; for each neuron, we get the 10 images that activate the neuron the most over the entire dataset. Then, for each of the images, we randomly generate 32 masks, each of which is for a square concept patch (30px by 30px). We separate the square areas of different masks to be at least 5px apart from each other to promote diversity among the concept patches.We then input all the concept patches to the classifier and observe how the neurons in the classifier are activated. For each neuron, 10 concept patches that activate the neuron the most are considered as the neuron’s concept patches.
Neuron Clustering. It is known that some neurons in CNN have redundancy and are activated by similar concepts JaderbergVZ14; wen2016learning; he2017channel; duggal2021cup. To help users identify such redundancy and focus on distinct concepts, when a neuron is hovered, we highlight the neurons that have similar sets of concept patches with the hovered neuron. Inspired by the neuron clustering method in ParkDDWSHC21, we identify the neuron clusters activated by the same concepts. We train an additional model, which is based on the ResNet50 architecture, that takes concept patches as inputs and outputs a vector for each concept patch to maximize the inner products between the vectors of the concept patches for the same neurons. We randomly sample 10,000 concept patch pairs, each of which consists of two patches from the same neurons, to generate training dataset; for negative sampling, we additionally sample 10,000 concept patch pairs, each of which is two patches from two different neurons. The objective function to be minimized is
| (1) |
where and are the normalized vectors of the concept patches from the same and different neurons, respectively. We initialize the model with the classifier that we are investigating and train for 10 epochs using the SGD optimizer with learning rate of 0.0001. After training the model, we iterate each of the highly activated neurons in the classifier to compute the inner products between the vectors for the neuron’s concept patches and the vectors for the concept patches sampled from each neuron cluster. Among the neuron clusters, a neuron is added to the cluster that yields the maximum inner product if the inner product value is greater than the preset threshold 0.9; otherwise, we generate a new cluster with the neuron as the only element. We set the threshold for adding a neuron to a cluster to 0.9 to minimize the error that any two neurons for different concepts are grouped to the same cluster.
4 Usage Scenario
4.1 Bias Characterization

VisCUIT helps users characterize the images where the classifier underperforms. For example, a hypothetical machine learning engineer Henry is using VisCUIT to investigate the ResNet50 classifier that predicts whether a person in an image is smiling. While scrolling down the list of underperforming subgroups, Henry is curious about subgroup #22 with an accuracy of 40% (Figure 4) since he finds it hard to define the common characteristics of the images in the subgroup. Henry decides to look into the subgroup #22, wishing to figure out what kinds of images consist of the subgroup #22 to clarify how the classifier is biased.
As Henry clicks the subgroup #22, VisCUIT displays the well-performing subgroup #296, which is similar to the subgroup #22 in terms of the feature vectors from the classifier, confusion matrices of the subgroups #22 and #296, and the neurons in the classifier activated by the two subgroups. Henry first clicks on the images in the subgroups #22 and #296 to examine the Grad-CAM Windows and compare the two subgroups (Figure 2). From the Grad-CAM Windows, Henry figures out that the classifier anomalously attends to the background areas, which look not pertinent to smiling at all, for the images in the underperforming subgroup #22. Also, from the confusion matrices, he learns that the classifier predicts all the images in the subgroup #22 as not smiling, even though more than half of them are actually smiling. Wondering why the background areas are attended by the classifier, he moves on to the Neuron Activation Panel to scrutinize the neuron activations.
Since there are many neurons in the Neuron Activation Panel, Henry increases the activation score threshold from 0.5 to 0.8 to reduce the number of neurons displayed and focus on few important neurons. To see how differently the two subgroups are processed in the classifier, Henry clicks on the neurons that are highly activated only by the underperforming subgroup #22 or only by the well-performing subgroup #296 to bring up the Neuron Concept Windows (Figure 3). The Neuron Concept Windows reveal that the underperforming subgroup #22 activates the neurons that capture the text and non-facial textures, while the well-performing subgroup #296 activates the neurons for mouths and noses. This finding motivates Henry to wonder whether there may be some text or non-facial textures in the background of the images in the subgroup #22 and decides to verify his conjecture by increasing the brightness of the images. Indeed, as he expects, the brightened images have text and colored stripe patterns in the background (Figure 4), associated with the lights, stands, and signs in the stadium. Based on these findings, Henry realizes that most of the images in the subgroup #22 are for athletes in stadium and concludes that the classifier often misclassifies smiling athletes in stadium as not smiling.
4.2 Model Performance Verification
A common need in developing CNN image classifiers is to verify that they work as expected on both intended predictions and known undesirable cases yeom2018privacy; li2019overfitting; farrand2020neither; zheng2020effects; KrishnakumarPSH21. VisCUIT provides an interactive means for users to perform such verification. For example, a hypothetical CNN researcher Jane has prepared a biased CelebA dataset, where she intentionally increases the co-occurrence of the attribute black hair and the label smiling. She expects that the model would potentially use image features related to black hair to predict smiling.
To verify her hypothesis, Jane launches VisCUIT. As illustrated in Figure 1, Jane figures out that several image subgroups with low accuracies are for the people with black hair at the first glance. To see whether the model indeed uses the attribute black hair for the predictions, she clicks on subgroup #14 with an accuracy of 36.4%, and VisCUIT displays subgroup #380 that is similar to #14 in terms of the last-layer features from the classifier but has a high accuracy of 86.1%.
In each of those subgroups, clicking on an image brings up a Grad-CAM Window. It reveals that the classifier attends to forehead, which is irrelevant to smiling, for the underperforming subgroup #14 (Figure 1-A1), while for the images in the well-performing subgroup #380, the classifier attends to mouth, which is closely related to smiling (Figure 1-A2). The confusion matrices quantitatively summarize such misclassification that many of the images of black-haired people are wrongly classified as smiling even though they are not (Figure 1-A3). Jane is now certain about her conjecture that the classifier often misclassifies not smiling black-haired people as smiling due to the inappropriate attention to forehead.
5 Conclusion
We present VisCUIT, a web-based interactive visualization tool that helps users understand how and why CNN image classifiers are biased. VisCUIT summarizes image subgroups with low accuracies so that users can easily identify on what kinds of images the classifier underperforms and select the subgroups to investigate more in depth. When users select an underperforming subgroup, the Subgroup Panel of VisCUIT displays a well-performing subgroup that is similar to the selected underperforming subgroup in terms of the feature vectors from the classifier and confusion matrices for the two subgroups. This can help users gain insights into the types of classification errors and the deviant features responsible for the biases. Users can bring up Grad-CAM Windows by clicking images to learn which parts of an image have been deemed relevant for the classification. Also, from Neuron Activation Panel, users can figure out the neurons and concepts responsible for misclassifications and understand why the classifier performs unexpectedly poorly, by clicking neurons and bringing up Neuron Concept Windows. VisCUIT can be easily accessed through modern web browsers and is open-sourced enabling easy extension of VisCUIT to various model architectures and datasets. We believe VisCUIT would enhance people’s understanding about CNN model biases and accelerate practical applications of CNN image classifiers.
References
- (1) Julius Adebayo. Fairml : Toolbox for diagnosing bias in predictive modeling. 2016.
- (2) Takuya Akiba, Shotaro Sano, Toshihiko Yanase, Takeru Ohta, and Masanori Koyama. Optuna: A next-generation hyperparameter optimization framework. In Proceedings of the 25rd ACM SIGKDD International Conference on Knowledge Discovery and Data Mining, 2019.
- (3) Vítor Albiero, Krishnapriya K. S, Kushal Vangara, Kai Zhang, Michael C. King, and Kevin W. Bowyer. Analysis of gender inequality in face recognition accuracy. In IEEE Winter Applications of Computer Vision Workshops, WACV Workshops 2020, Snowmass Village, CO, USA, March 1-5, 2020, pages 81–89. IEEE, 2020.
- (4) Julia Angwin, Jeff Larson, Surya Mattu, and Lauren Kirchner. Machine bias: There’s software used across the country to predict future criminals. and it’s biased against blacks., 2016.
- (5) Rachel K. E. Bellamy, Kuntal Dey, Michael Hind, Samuel C. Hoffman, Stephanie Houde, Kalapriya Kannan, Pranay Lohia, Jacquelyn Martino, Sameep Mehta, Aleksandra Mojsilovic, Seema Nagar, Karthikeyan Natesan Ramamurthy, John T. Richards, Diptikalyan Saha, Prasanna Sattigeri, Moninder Singh, Kush R. Varshney, and Yunfeng Zhang. AI fairness 360: An extensible toolkit for detecting and mitigating algorithmic bias. IBM J. Res. Dev., 63(4/5):4:1–4:15, 2019.
- (6) Michael Bostock, Vadim Ogievetsky, and Jeffrey Heer. D³ data-driven documents. IEEE Transactions on Visualization and Computer Graphics, 17(12):2301–2309, 2011.
- (7) Antoine Buetti-Dinh, Vanni Galli, Sören Bellenberg, Olga Ilie, Malte Herold, Stephan Christel, Mariia Boretska, Igor V. Pivkin, Paul Wilmes, Wolfgang Sand, Mario Vera, and Mark Dopson. Deep neural networks outperform human expert’s capacity in characterizing bioleaching bacterial biofilm composition. Biotechnology Reports, 22:e00321, 2019.
- (8) Joy Buolamwini and Timnit Gebru. Gender shades: Intersectional accuracy disparities in commercial gender classification. In Conference on Fairness, Accountability and Transparency, FAT 2018, 23-24 February 2018, New York, NY, USA, volume 81 of Proceedings of Machine Learning Research, pages 77–91. PMLR, 2018.
- (9) Ángel Alexander Cabrera, Will Epperson, Fred Hohman, Minsuk Kahng, Jamie Morgenstern, and Duen Horng Chau. FAIRVIS: visual analytics for discovering intersectional bias in machine learning. In 14th IEEE Conference on Visual Analytics Science and Technology, IEEE VAST 2019, Vancouver, BC, Canada, October 20-25, 2019, pages 46–56. IEEE, 2019.
- (10) Gabriel D Cantareira, Rodrigo F Mello, and Fernando V Paulovich. Explainable adversarial attacks in deep neural networks using activation profiles. arXiv preprint arXiv:2103.10229, 2021.
- (11) Jacqueline G. Cavazos, P. Jonathon Phillips, Carlos Domingo Castillo, and Alice J. O’Toole. Accuracy comparison across face recognition algorithms: Where are we on measuring race bias? IEEE Trans. Biom. Behav. Identity Sci., 3(1):101–111, 2021.
- (12) Nilaksh Das, Haekyu Park, Zijie J Wang, Fred Hohman, Robert Firstman, Emily Rogers, and Duen Horng Chau. Bluff: Interactively deciphering adversarial attacks on deep neural networks. 2020.
- (13) Ekberjan Derman. Dataset bias mitigation through analysis of CNN training scores. CoRR, abs/2106.14829, 2021.
- (14) Prithviraj Dhar, Joshua Gleason, Hossein Souri, Carlos D Castillo, and Rama Chellappa. Towards gender-neutral face descriptors for mitigating bias in face recognition. arXiv preprint arXiv:2006.07845, 2020.
- (15) Pawel Drozdowski, Christian Rathgeb, Antitza Dantcheva, Naser Damer, and Christoph Busch. Demographic bias in biometrics: A survey on an emerging challenge. IEEE Transactions on Technology and Society, 2020.
- (16) Rahul Duggal, Cao Xiao, Richard Vuduc, Duen Horng Chau, and Jimeng Sun. Cup: Cluster pruning for compressing deep neural networks. In 2021 IEEE International Conference on Big Data (Big Data), pages 5102–5106. IEEE, 2021.
- (17) Tom Farrand, Fatemehsadat Mireshghallah, Sahib Singh, and Andrew Trask. Neither private nor fair: Impact of data imbalance on utility and fairness in differential privacy. In Proceedings of the 2020 Workshop on Privacy-Preserving Machine Learning in Practice, pages 15–19, 2020.
- (18) Ruth Fong and Andrea Vedaldi. Net2vec: Quantifying and explaining how concepts are encoded by filters in deep neural networks. In Proceedings of the IEEE conference on computer vision and pattern recognition, pages 8730–8738, 2018.
- (19) Hironobu Fujiyoshi, Tsubasa Hirakawa, and Takayoshi Yamashita. Deep learning-based image recognition for autonomous driving. IATSS Research, 43(4):244–252, 2019.
- (20) Clare Garvie, Alvaro Bedoya, and Jonathan Frankle. The perceptual line-up: Unregulated police face recognition in america, 2016.
- (21) Sixue Gong, Xiaoming Liu, and Anil K. Jain. Mitigating face recognition bias via group adaptive classifier. In IEEE Conference on Computer Vision and Pattern Recognition, CVPR 2021, virtual, June 19-25, 2021, pages 3414–3424. Computer Vision Foundation / IEEE, 2021.
- (22) Kaiming He, Xiangyu Zhang, Shaoqing Ren, and Jian Sun. Deep residual learning for image recognition. In 2016 IEEE Conference on Computer Vision and Pattern Recognition, CVPR 2016, Las Vegas, NV, USA, June 27-30, 2016, pages 770–778. IEEE Computer Society, 2016.
- (23) Yihui He, Xiangyu Zhang, and Jian Sun. Channel pruning for accelerating very deep neural networks. In Proceedings of the IEEE international conference on computer vision, pages 1389–1397, 2017.
- (24) Fred Hohman, Haekyu Park, Caleb Robinson, and Duen Horng (Polo) Chau. Summit: Scaling deep learning interpretability by visualizing activation and attribution summarizations. IEEE Trans. Vis. Comput. Graph., 26(1):1096–1106, 2020.
- (25) Max Jaderberg, Andrea Vedaldi, and Andrew Zisserman. Speeding up convolutional neural networks with low rank expansions. In British Machine Vision Conference, BMVC 2014, Nottingham, UK, September 1-5, 2014. BMVA Press, 2014.
- (26) Haifeng Jin. Keras documentation: Visualize the hyperparameter tuning process, 2021.
- (27) Hyekang Joo, Calvin Bao, Ishan Sen, Furong Huang, and Leilani Battle. Guided hyperparameter tuning through visualization and inference. arXiv preprint arXiv:2105.11516, 2021.
- (28) Arvind Krishnakumar, Viraj Prabhu, Sruthi Sudhakar, and Judy Hoffman. Udis: Unsupervised discovery of bias in deep visual recognition models. In British Machine Vision Conference (BMVC), 2021.
- (29) K. S. Krishnapriya, Vítor Albiero, Kushal Vangara, Michael C. King, and Kevin W. Bowyer. Issues related to face recognition accuracy varying based on race and skin tone. IEEE Transactions on Technology and Society, 1(1):8–20, 2020.
- (30) Alex Krizhevsky, Ilya Sutskever, and Geoffrey E. Hinton. Imagenet classification with deep convolutional neural networks. In Advances in Neural Information Processing Systems 25: 26th Annual Conference on Neural Information Processing Systems 2012. Proceedings of a meeting held December 3-6, 2012, Lake Tahoe, Nevada, United States, pages 1106–1114, 2012.
- (31) Anja Lambrecht and Catherine Tucker. Algorithmic bias? an empirical study of apparent gender-based discrimination in the display of stem career ads. Management Science, 65(7):2966–2981, 2019.
- (32) Zeju Li, Konstantinos Kamnitsas, and Ben Glocker. Overfitting of neural nets under class imbalance: Analysis and improvements for segmentation. In International Conference on Medical Image Computing and Computer-Assisted Intervention, pages 402–410. Springer, 2019.
- (33) Ziwei Liu, Ping Luo, Xiaogang Wang, and Xiaoou Tang. Deep learning face attributes in the wild. In 2015 IEEE International Conference on Computer Vision, ICCV 2015, Santiago, Chile, December 7-13, 2015, pages 3730–3738. IEEE Computer Society, 2015.
- (34) Xingjun Ma, Yuhao Niu, Lin Gu, Yisen Wang, Yitian Zhao, James Bailey, and Feng Lu. Understanding adversarial attacks on deep learning based medical image analysis systems. Pattern Recognition, 110:107332, 2021.
- (35) Ninareh Mehrabi, Fred Morstatter, Nripsuta Saxena, Kristina Lerman, and Aram Galstyan. A survey on bias and fairness in machine learning. ACM Comput. Surv., 54(6):115:1–115:35, 2021.
- (36) Sakib Mostafa, Debajyoti Mondal, Michael Beck, Christopher Bidinosti, Christopher Henry, and Ian Stavness. Visualizing feature maps for model selection in convolutional neural networks. In Proceedings of the IEEE/CVF International Conference on Computer Vision, pages 1362–1371, 2021.
- (37) Osonde A. Osoba and William Welser. An intelligence in our image: The risks of bias and errors in artificial intelligence. RAND Corporation, Santa Monica, Calif., 2017.
- (38) Haekyu Park, Nilaksh Das, Rahul Duggal, Austin P. Wright, Omar Shaikh, Fred Hohman, and Duen Horng Chau. NeuroCartography: Scalable Automatic Visual Summarization of Concepts in Deep Neural Networks. 2021.
- (39) Divyarajsinh N. Parmar and Brijesh B. Mehta. Face recognition methods & applications. CoRR, abs/1403.0485, 2014.
- (40) Adam Paszke, Sam Gross, Francisco Massa, Adam Lerer, James Bradbury, Gregory Chanan, Trevor Killeen, Zeming Lin, Natalia Gimelshein, Luca Antiga, et al. Pytorch: An imperative style, high-performance deep learning library. Advances in neural information processing systems, 32, 2019.
- (41) Gowdham Prabhakar, Binsu Kailath, Sudha Natarajan, and Rajesh Kumar. Obstacle detection and classification using deep learning for tracking in high-speed autonomous driving. In 2017 IEEE Region 10 Symposium (TENSYMP), pages 1–6, 2017.
- (42) Pedro Saleiro, Benedict Kuester, Abby Stevens, Ari Anisfeld, Loren Hinkson, Jesse London, and Rayid Ghani. Aequitas: A bias and fairness audit toolkit. CoRR, abs/1811.05577, 2018.
- (43) Ramprasaath R. Selvaraju, Michael Cogswell, Abhishek Das, Ramakrishna Vedantam, Devi Parikh, and Dhruv Batra. Grad-cam: Visual explanations from deep networks via gradient-based localization. In IEEE International Conference on Computer Vision, ICCV 2017, Venice, Italy, October 22-29, 2017, pages 618–626. IEEE Computer Society, 2017.
- (44) Pratik Shah, Francis Kendall, Sean Khozin, Ryan Goosen, Jianying Hu, Jason Laramie, Michael Ringel, and Nicholas Schork. Artificial intelligence and machine learning in clinical development: a translational perspective. npj Digital Medicine, 2(69), 2019.
- (45) Neha Sharma, Vibhor Jain, and Anju Mishra. An analysis of convolutional neural networks for image classification. Procedia Computer Science, 132:377–384, 2018.
- (46) Karen Simonyan, Andrea Vedaldi, and Andrew Zisserman. Deep inside convolutional networks: Visualising image classification models and saliency maps. In 2nd International Conference on Learning Representations, ICLR Workshop Track Proceedings, 2014.
- (47) Krishna Kumar Singh, Dhruv Mahajan, Kristen Grauman, Yong Jae Lee, Matt Feiszli, and Deepti Ghadiyaram. Don’t judge an object by its context: Learning to overcome contextual bias. In 2020 IEEE/CVF Conference on Computer Vision and Pattern Recognition, CVPR 2020, Seattle, WA, USA, June 13-19, 2020, pages 11067–11075. Computer Vision Foundation / IEEE, 2020.
- (48) Farhana Sultana, Abu Sufian, and Paramartha Dutta. Advancements in image classification using convolutional neural network. CoRR, abs/1905.03288, 2019.
- (49) Christian Szegedy, Wei Liu, Yangqing Jia, Pierre Sermanet, Scott E. Reed, Dragomir Anguelov, Dumitru Erhan, Vincent Vanhoucke, and Andrew Rabinovich. Going deeper with convolutions. In IEEE Conference on Computer Vision and Pattern Recognition, CVPR 2015, Boston, MA, USA, June 7-12, 2015, pages 1–9. IEEE Computer Society, 2015.
- (50) Yaniv Taigman, Ming Yang, Marc’Aurelio Ranzato, and Lior Wolf. Deepface: Closing the gap to human-level performance in face verification. In 2014 IEEE Conference on Computer Vision and Pattern Recognition, CVPR 2014, Columbus, OH, USA, June 23-28, 2014, pages 1701–1708. IEEE Computer Society, 2014.
- (51) Eric J. Topol. High-performance medicine: the convergence of human and artificial intelligence. Nature Medicine, 25:44–56, 2019.
- (52) Mei Wang and Weihong Deng. Mitigating bias in face recognition using skewness-aware reinforcement learning. In 2020 IEEE/CVF Conference on Computer Vision and Pattern Recognition, CVPR 2020, Seattle, WA, USA, June 13-19, 2020, pages 9319–9328. Computer Vision Foundation / IEEE, 2020.
- (53) Mei Wang and Weihong Deng. Deep face recognition: A survey. Neurocomputing, 429:215–244, 2021.
- (54) Tianlu Wang, Jieyu Zhao, Mark Yatskar, Kai-Wei Chang, and Vicente Ordonez. Balanced datasets are not enough: Estimating and mitigating gender bias in deep image representations. In 2019 IEEE/CVF International Conference on Computer Vision, ICCV 2019, Seoul, Korea (South), October 27 - November 2, 2019, pages 5309–5318. IEEE, 2019.
- (55) Anne L. Washington. How to argue with an algorithm: Lessons from the compas propublica debate. The Colorado Technology Law Journal, 17, 2019.
- (56) Wei Wen, Chunpeng Wu, Yandan Wang, Yiran Chen, and Hai Li. Learning structured sparsity in deep neural networks. Advances in neural information processing systems, 29, 2016.
- (57) Samuel Yeom, Irene Giacomelli, Matt Fredrikson, and Somesh Jha. Privacy risk in machine learning: Analyzing the connection to overfitting. In 2018 IEEE 31st computer security foundations symposium (CSF), pages 268–282. IEEE, 2018.
- (58) Wanwan Zheng and Mingzhe Jin. The effects of class imbalance and training data size on classifier learning: an empirical study. SN Computer Science, 1(2):1–13, 2020.
- (59) Yazeed Zoabi, Shira Deri-Rozov, and Noam Shomron. Machine learning-based prediction of covid-19 diagnosis based on symptoms. npj Digital Medicine, 4(3), 2021.
- (60) James Zou and Londa Schiebinger. Design ai so that it’s fair. Nature, 559:324–326, 2018.
- (61) Katharina Anna Zweig, Georg Wenzelburger, and Tobias D. Krafft. On chances and risks of security related algorithmic decision making systems. European Journal for Security Research, 3:181–203, 2018.