PSDoodle: Fast App Screen Search via Partial Screen DoodleConference: IEEE/ACM 9th International Conference on Mobile Software Engineering and Systems; May 17–24, 2022; Pittsburgh, PA, USAIEEE/ACM 9th International Conference on Mobile Software Engineering and Systems (MOBILESoft ’22), May 17–24, 2022, Pittsburgh, PA, USADOI: 10.1145/3524613.3527816ISBN: 978-1-4503-9301-0/22/05CCS: Software and its engineering Software prototypingCCS: Software and its engineering Search-based software engineeringCCS: Human-centered computing Interaction techniques
Abstract.
Searching through existing repositories for a specific mobile app screen design is currently either slow or tedious. Such searches are either limited to basic keyword searches (Google Image Search) or require as input a complete query screen image (SWIRE). A promising alternative is interactive partial sketching, which is more structured than keyword search and faster than complete-screen queries. PSDoodle is the first system to allow interactive search of screens via interactive sketching. PSDoodle is built on top of a combination of the Rico repository of some 58k Android app screens, the Google QuickDraw dataset of icon-level doodles, and DoodleUINet, a curated corpus of some 10k app icon doodles collected from hundreds of individuals. In our evaluation with third-party software developers, PSDoodle provided similar top-10 screen retrieval accuracy as the state of the art from the SWIRE line of work, while cutting the average time required about in half.
Keywords:
Sketch-based image retrieval, SBIR, user interface design, sketching, GUI, design examples, deep learning1. Introduction
Searching through existing repositories for a specific mobile app screen design is currently either slow or tedious. Currently such searches are either limited to traditional keyword searches (e.g., via Google’s image search) or require as input a complete query screen image (i.e., via the SWIRE line of work (Huang et al. 2019; Sain et al. 2020)) and are therefore slow and do not support well an interactive or iterative search style.
Having an effective and efficient search engine for mobile app screens can benefit many key software engineering tasks, including requirements gathering, understanding current market trends, analyzing features, providing inspiration to developers, and as a benchmark for evaluation (Herring et al. 2009; Eckert and Stacey 2000). Given the wide-spread and increasing use of mobile apps in a “mobile first” world and the resources spent on developing them (Ines et al. 2017; Hellmann and Maurer 2011), such a screen search engine could have a large positive impact on many software developers and users. We are particularly focused on software developers with little to no UI/UX/design background. These users may only have a vague idea of the screen contents and are looking for inspiration from professional screen designs.
Several screen repositories exist, including websites such as Dribbble11 1 https://dribbble.com/, accessed January 2022. and Behance22 2 https://www.behance.net/, accessed January 2022.. Another repository is the Rico dataset curated from Android apps at runtime (Deka et al. 2017). Searching through this vast collection and finding desired example screens currently requires extensive effort via keyword-based search (e.g., for screen color, theme, date, and location) through several websites (Ritchie et al. 2011). Moreover, novice users often fail to formulate good keyword queries and therefore do not get the intended search results (Herring et al. 2009).
Several researchers have proposed using visual, e.g., image- or sketch-based search methods because they are easy to use and fast to adopt (Yeh et al. 2009). For software development sketches are a natural fit, as sketches are a common form of visual representation, especially during early software development phases such as UI prototyping (Landay and Myers 1995; Newman and Landay 1999; Wong 1992; Campos and Nunes 2007; Carter and Hundhausen 2010).
PSDoodle is the first approach that supports interactive and iterative sketch-based screen search. PSDoodle uses a digital drawing interface with support for touchscreen devices of different resolutions and provides ease of use for the mouse. Using a digital drawing interface enables live search and user interaction. PSDoodle also does not suffer from the processing delays of paper-based approaches with their offline processing steps.

Figure 1 gives an overview of a sample PSDoodle search, starting in row 1 with the user sketching a “hamburger”-style menu icon in the top left corner. Each of PSDoodle’s top-5 result screens contains a hamburger menu icon at about the sketched location. The second row shows the result of the user adding the doodle of a custom image below the hamburger icon, followed by two rows adding one more UI element doodle each.
PSDoodle employs deep learning to identify UI elements from drawing strokes. PSDoodle fetches real-world UI examples from the Rico (Deka et al. 2017) dataset based on UI element type, position, and element shape. It retrieves UI screens from the first UI element query element. PSDoodle updates the search result with the addition or removal of a UI element in the sketch.
At the same time PSDoodle provides search accuracy on par with state-of-the-art full-screen sketch approaches. We compared PSDoodle to state-of-the-art approaches by recruiting and observing 10 participants who used PSDoodle for the first time. We displayed a UI screenshot from Rico and instructed the participant to draw until the Rico screen appears in PSDoodle’s top search results. 88% of the time PSDoodle retrieved and displayed the Rico target screen in its top-10 search results. A user usually spent an average of 107 seconds and drew an average of 5.5 elements during the process. This compared favourably with the most closely related tool SWIRE (Huang et al. 2019), which took 246 seconds to complete a sketch and took an average of 21.1 icon elements in each query drawing. To summarize, this paper makes the following major contributions.
- •
PSDoodle is the first tool that provides an interactive iterative search-by-sketch screen search. It is freely available online at: http://pixeltoapp.com/PSDoodle/
- •
In our comparison with the state-of-the-art SWIRE line of work, PSDoodle achieved similar top-10 search accuracy while requiring less than 50% of the time.
- •
All of PSDoodle’s source code, processing scripts, training data, and experimental results are available under permissive open-source licenses (Mohian and Csallner 2022; Mohian and Csallner 2021).
2. Background
Due to their wide use, we focus on Android apps and their common UI elements. Rico contains 72k unique app screens, collected from 9.3k Android apps from 27 app categories of the Google Play store (Deka et al. 2017). Rico ran (via ERICA (Deka et al. 2016)) each of these Android apps on modified Android classes to efficiently capture both screenshots and each screen’s runtime UI view hierarchy. Rico thereby provides for each screenshot each UI element’s Android class name, textual properties, x/y coordinates, and visibility.
A common challenge is understanding apps’ custom UI elements (e.g., a clickable custom image used as an alternative implementation of a standard Android icon). To understand an UI element’s intent beyond its Android class name, Liu et al. clustered 73k Rico screen elements by image similarity, the similarity of an element’s surrounding text snippets, and similar code-based patterns (Liu et al. 2018). This yielded 25 UI component types (e.g.: checkbox, icon, image, text, text button), 197 text button concepts (e.g.: no, login, ok), and 135 icon classes (e.g.: add, menu, share, star), with which Liu et al. labeled all screen elements in Rico.
2.1. SWIRE: Offline Full-screen Search
Most closely related to our work is SWIRE (Huang et al. 2019). SWIRE collected 3.8k low-fidelity full-screen Rico screen sketches from 4 experienced UI designers given a pre-defined drawing convention. Specifically, SWIRE instructs users to sketch each image as a crossed-out square (square borders plus diagonals) or as a square filled with a mountain outline. SWIRE users also represent any text with (a part of) the same 3-word template (Lorem ipsum dolor) or by squiggly lines. SWIRE trained a deep neural network on 1.7k Rico sketch-screenshot pairs created by 3 designers, yielding a top-10 screen retrieval accuracy of 61% (i.e., in 61% of cases the screenshot corresponding to the fourth designer’s query sketch was one of SWIRE’s top-10 search result screenshots).
SWIRE reflects a traditional paper-based design style. Users sketch with pen on paper inside an Aruco marker frame (Garrido-Jurado et al. 2014) to streamline subsequent de-noising, camera angle correction, and projection correction. To change a sketch the user will likely have to start over. Even scanning or taking a snap once plus the subsequent processing steps requires significant time.
Recent SWIRE follow-up work reported a top-10 accuracy of 90.1% (Sain et al. 2020). While using different processing steps, at a high level it followed SWIRE’s paper-based design style and thus faces similar challenges for interactive search.
2.2. Google QuickDraw & DoodleUINet
Google’s Quick, Draw! (“QuickDraw”) offers some 50M doodles of 345 everyday categories, from “aircraft carrier” to “zigzag” (Ha and Eck 2017; Jongejan et al. 2016). QuickDraw doodles were sketched by anonymous website visitors, who were only given a one-word description of the thing to sketch. For each element category this yielded sketches performed in a wide variety of drawing styles. Given this diverse training set, QuickDraw achieved solid doodle recognition accuracy for a wide range of sketching styles (e.g., earlier work reported some 70% top-1 doodle recognition accuracy (Tensorflow 2020)). Internally QuickDraw represents each doodle as a stroke sequence. Each stroke is a drawing from a start-touch to an end-touch event (e.g., mouse button press and un-press), represented by a sequence of straight lines.

DoodleUINet offers some 11k crowdworker-created doodles of 16 common Android UI element categories (Mohian and Csallner 2021). Figure 2 visualizes DoodleUINet’s 16 UI element categories, spanning Android built-in element types (e.g., checkbox) and custom-designed images (e.g., avatar). DoodleUINet doodles are stored in QuickDraw’s format but do not overlap with QuickDraw’s doodle categories. In contrast to QuickDraw’s flexible doodle recognition, the current version of DoodleUINet focuses on a single drawing style per element category (“stylized”), which it achieved by briefly presenting crowdworkers a stylized target image of the element they should sketch. (For example, in DoodleUINet a UI element to reach “settings” currently always looks like a gear symbol.) Some 10k DoodleUINet sketches are labeled “correct” (or similar-looking to the target image according to manual review) and some 1k are labeled “incorrect”.
3. Overview and Design
Figure 3 gives an overview of PSDoodle’s architecture. PSDoodle offers a drawing interface (bottom left) and recognizes a stroke sequence as an UI element via a deep neural network trained on DoodleUINet and QuickDraw doodles. After recognizing a new UI element, PSDoodle looks up the top-N matching screens in its dictionary of Rico screen hierarchies via PSDoodle’s similarity metric based on UI element shape, position, and occurrence frequency.

3.1. Rico Screens & UI Element Labels
While the Rico paper mentions 72k screens, its dataset contains 66,261 screens. Given our UI element based search, PSDoodle cannot distinguish between screens with few UI elements (e.g., between two screens that only show a single large image). We thus exclude a Rico screen if the entire screen consists of a single text area (2,384 screens), a single image (561), single text plus single image (502), single webview (2,367), webview covering most of the screen area (1,433), or has no hierarchy information (888). (While a webview may contain an arbitrary webpage, Rico contains no information about this webpage.) This yields 58,126 Rico screens in PSDoodle.
| Container’s Android Class | Element’s Android Class | New Label |
|---|---|---|
| CheckedTextView, AppCompatCheckedTextView, AppCompatCheckBox, CheckableImageView, AnimationCheckBox, CheckableImageButton, CheckBox, ColorableCheckBoxPreference | AppCompatCheckBox, PreferenceCheckbox, CheckboxChoice, CheckboxTextView, CenteredCheckBox, StyledCheckBox, CheckButton, AppCompatCheckBox, CheckBox, CheckBoxMaterial | Checkbox |
| RangeSeekBar, SeekBar | RangeSeekBar, TwoThumbSeekBar, EqSeekBar, PriceRangeSeekBar, VideoSliceSeekBar, SliderButton | Slider |
| RatingBar | RatingWidget, RatingSliderView, RatingView, Rating | Star |
| SwitchCompat, Switch | SwitchCompat, CustomThemeSwitchButton, BetterSwitch, LabeledSwitch, CustomToggleSwitch, CheckSwitchButton, CustomSwitch, MySwitch, SwitchButton, Switch | Switch |
| n/a | CustomSearchView, SearchEditText, CustomSearchView, SearchBoxButton | Search |
For 3,317 Rico screens we noticed and fixed several inaccuracies in Liu et al.’s labeling of UI elements as “input” or “image”. Table 1 summarizes these fixes as 47 patterns. For example, we found that if Liu et al. labeled a UI element of Android class AppCompatCheckBox as an “input” then that UI element really looks like a “checkbox”.
3.2. Query Language: Stylized + Flexible Doodles
While our long-term goal is to support every user and their preferred query styles (i.e., via an arbitrary mix of individual sketching styles, keywords, and structured query languages), PSDoodle focuses on sketch-only screen search. Specifically, PSDoodle combines the stylized DoodleUINet sketch style with the flexible QuickDraw sketch style. QuickDraw has already validated that supporting both many categories and flexible drawing styles is possible using the QuickDraw representation and classification PSDoodle has adapted. So migrating PSDoodle to support more UI element categories and a flexible drawing style is mostly a matter of collecting more training samples (and retraining PSDoodle’s neural net).
A key challenge not addressed by QuickDraw is sketching deeply nested composite structures, which is common in app screens (e.g., a list of images plus text pairs in a container that is just one part of the screen). PSDoodle supports sketching such screens via its sequence-of-elements style. Specifically, the PSDoodle doodle classifier recognizes one UI element at a time. So once a user starts sketching a new doodle, PSDoodle treats each stroke as belonging to that UI element doodle, until the user indicates the UI element sketch is done. In that style it does not matter if the user first sketches a container or one of its (nested) UI elements, PSDoodle recognizes each separately and treats them as separate elements, allowing arbitrarily deeply nested container structures.

Figure 4 shows how PSDoodle presents its query language to its users (as a “cheatsheet”). At the individual UI element level, DoodleUINet (Mohian and Csallner 2021) is a good fit for Android screen search as (according to the number of element labels inferred by Liu et al. (Liu et al. 2018)) DoodleUINet covers several of the most popular UI elements in Rico. Specifically, 11/16 of the stylized DoodleUINet doodles look like the corresponding UI elements grouped and labeled by Liu et al. The other five either match SWIRE’s language (squiggly line) or appear to be reasonable representations of common app concepts (dropdown, left arrow, slider, and switch). In addition to DoodleUINet, we reviewed the QuickDraw categories, looking for doodles that could be used to cover additional UI elements. We thereby identified 7 QuickDraw classes (Figure 5 shows one sample each) that in our subjective judgement were a good match for UI sketching.

Besides the relatively close doodle-to-screen similarity of several classes (e.g., a sketched “menu” icon looks quite similar to an on-screen menu icon), PSDoodle follows SWIRE’s approach of using a few placeholder elements to represent text and arbitrary images. For text PSDoodle uses a squiggly line (as SWIRE) and for an arbitrary image we use QuickDraw’s “jailwindow”. Furthermore, PSDoodle uses QuickDraw’s cloud to represent a default (otherwise not directly-supported) icon and QuickDraw’s square as a container.
Taken together, PSDoodle thereby covers the most common UI elements in Rico (in order) as follows (bold is from DoodleUINet, italic from QuickDraw): Container, image, icon (a small interactive image), text, text button, web view, input, list item, switch (a toggle element), map view, slider, and checkbox. Rico further sub-categorized the most popular icon types (#3 in the above list) as back, followed by (in order) menu, cancel (close), search, plus (add), avatar (user head-shot type image), home, share, setting, star, edit, more, refresh, forward, and play. PSDoodle further supports camera, dropdown, envelope, and left arrow.
Some popular UI elements can be treated as compound elements that can be composed of other more basic ones. PSDoodle supports one such case, i.e., the Android text button as “text” inside a “square”. If a squiggle is inside a square and the square has no other nested UI elements then PSDoodle merges these two elements into a single (compound) element.
3.3. UI Element Doodle Recognition

Users draw on PSDoodle’s website via mouse or touch events. Users can undo or redo strokes and remove the last element doodle (Figure 6 top left). Each time the user adds a stroke to the current doodle, PSDoodle shows its current top-3 UI element predictions (top right). A user can pick any of these three (and tap “Icon done”) or continue editing the current UI element doodle.
Once the user taps “Icon done”, PSDoodle adds the sketched UI element to its search query, issues the query, and updates the display of its top-N Android search result screens.
To recognize a single UI element from strokes, we trained a deep neural network using QuickDraw’s network architecture (Tensorflow 2020), i.e., a 1-D convolutional neural network (CNN) layer (48 filters, kernel size 5) followed by a 1-D CNN layer (kernel size 5, 64 filters), a 1-D CNN layer (kernel size 3, 96 filters), 3 Bi-LSTM layers, and a fully-connected layer.
We used DoodleUINet (some 600 doodles labeled “correct” for each of the 16 classes) plus a random 600-doodle sample of each of our 7 QuickDraw classes.
We used transfer learning (Torrey and Shavlik 2009) to pre-train the CNN layers for 23 QuickDraw classes outside our 7 QuickDraw classes. We then split our 23 classes into training and test samples (80%/20%) and trained the network for 24,893 steps, which yielded an accuracy of 94.5% on the test data (which is similar to the 94.2% accuracy a recent study achieved with 7-class QuickDraw subset (Andersson et al. 2018)).
To map an input stroke to QuickDraw’s stroke-5 format (Ha and Eck 2017), PSDoodle normalizes input stroke int locations to floats. Specifically, in the stroke-5 format (Ha and Eck 2017) each user input stroke is a sequence of points where each point is a tuple ( y, p1, p2, p3). Here p1 to p3 are binary sketch states after the current vertex (touching the canvas, raised from the canvas, done). and are integer pixel distances we normalize to floats (maintaining, among others, the number of vertices between input and normalized image).
3.4. Searching Screens for UI Element Doodles
After the user adds (or removes) a UI element, PSDoodle displays Rico screens that are similar to the current (partial) user screen sketch. PSDoodle scores each of the 58k Rico screens based on how closely the screen matches the query doodles’ presence, position, and shape. A key challenge is that a sketch is an abstract representation that is geometrically relatively far apart from its real-world counterpart. A UI element doodle thus will likely not be in the exact scale and position as it should appear on a UI screen. A similarity metric based on exact matching is thus likely to fail in sketch-based screen search.

To address the issue, PSDoodle matches doodles (as recognized by the neural network after merging compound elements) with screen elements at different levels of screen resolution, starting at a fine-grained level but then backing up to more coarse-grained matches. Specifically, PSDoodle’s fine granularity scale-1 divides the canvas into 24 equal-sized rectangles (6 rows of 4 tiles each), scale-2 groups these into 6 rectangles (3 rows of 2 tiles), and finally scale-3 is a single rectangle. Figure 7 gives an overview of the different scale levels and how moving to a higher level widens the search area for a UI element match.
Besides PSDoodle’s 3-level matching of a UI element’s screen location, PSDoodle also matches the number of UI elements of a given class and takes into account how rare a UI element is within all screens. PSDoodle thus boosts the score of a rarer UI element as its presence may be more significant to the user. PSDoodle computes the inverse document frequency (IDF) of each UI element type in the 58k Rico screens (where a UI element type’s IDF is larger if it appears on fewer screens).
For fast screen retrieval, PSDoodle maintains a dictionary of Rico’s 58k (“original”) screens. This dictionary maps each of PSDoodle’s 24 UI element types to a list of screens, where each screen lists for each of its tiles the percentage of the tile’s area () being covered by how many () instances of that UI element type. Algorithm 1 summarizes PSDoodle’s screen similarity scoring as pseudo code. The algorithm iterates through the query sketch’s UI element doodles, one element class at a time (e.g., starting with all of the query sketch’s squiggly line doodles taken as a group). For each element doodle group, the algorithm looks up the Rico screens that contain at least one instance of the doodle group’s element type (Line 3). For each matching Rico screen, we then iterate over the screen’s scale-1 tiles that contain the given doodle type (Line 5) .
For each such original Rico screen tile that contains the doodled UI element type there are now three cases. First, if the original screen tile matches a tile of the doodle group then we have a scale-1 match and compute the percentage of that tile’s area () being covered by how many () doodles of that UI element type (Line 8). Then we compute the difference in the tile’s area coverage percentages between doodles and original screen elements (Line 9) and the difference in how many doodles vs how many original screen elements are in that tile (Line 10). We add the resulting tile score to its screen’s overall score (Line 11).
In the second case (Line 12), the screen tile containing a UI element of the doodle group’s class does not overlap with any tile of the doodle group. In this case PSDoodle backs up to its scale-2 search and checks if this screen tile overlaps with any direct neighbor tiles of the doodle group’s tiles. If this is the case the screen gets a smaller score boost. Finally, if there is neither a scale-1 nor a scale-2 match, then the screen’s score remains unchanged.
3.5. Hyperparameter Optimization
Algorithm 1 mentions five hyperparameters, three for the scale levels (, , ) plus for the weight difference and for the occurrence difference. To find optimal values for these hyper-parameters we collected 30 sketches from 5 computer science graduate students.
The collected sketches represent 30 different Rico screens that have at least two PSDoodle-supported icons. None of these screenshots or sketches were used for the tool evaluation. An exhaustive search with GridSearchCV of scikit-learn (Buitinck et al. 2013) to get a high score and top-rank for the target screen yielded the optimized values , , , , and .
A closer look at the hyper-parameters indicates that they give more weights to scale-1 matches compared to the other two scales. With 24 girds, a scale-1 match implies higher location similarity, which we intuitively expect to yield a higher screen score.
| Category | Strokes in 100% | 20% | 1st stroke to top-1 | W [%] | W* [%] | 1st stroke to top-3 | W [%] | W* [%] | ||||||||||||||||
| avg | m | l | h | SD | cnt | avg | m | l | h | SD | lst | all | lst | all | avg | m | l | h | SD | lst | all | lst | all | |
| Camera | 3.5 | 3 | 1 | 9 | 1.1 | 143 | 2.3 | 2 | 1 | 5 | 0.7 | 6 | 4 | 13 | 8 | 1.8 | 2 | 1 | 5 | 0.8 | 1 | 1 | 1 | 1 |
| Cloud | 1.4 | 1 | 1 | 24 | 1.4 | 154 | 1.1 | 1 | 1 | 3 | 0.4 | 12 | 10 | 4 | 3 | 1.1 | 1 | 1 | 3 | 0.4 | 3 | 2 | 1 | 1 |
| Envelope | 2.1 | 2 | 1 | 9 | 1.1 | 145 | 1.9 | 2 | 1 | 9 | 1.1 | 7 | 6 | 6 | 6 | 1.3 | 1 | 1 | 4 | 0.6 | 0 | 0 | 0 | 0 |
| House | 3.5 | 3 | 1 | 23 | 2.2 | 135 | 2.1 | 2 | 1 | 5 | 0.9 | 11 | 9 | 1 | 1 | 2.0 | 2 | 1 | 10 | 1.1 | 3 | 2 | 1 | 1 |
| Jail-win | 5.8 | 5 | 2 | 20 | 1.7 | 143 | 3.4 | 3 | 2 | 8 | 1.1 | 7 | 6 | 1 | 1 | 2.9 | 3 | 1 | 8 | 1.2 | 2 | 1 | 1 | 0 |
| Square | 1.3 | 1 | 1 | 4 | 0.7 | 147 | 1.1 | 1 | 1 | 3 | 0.3 | 2 | 2 | 2 | 1 | 1.1 | 1 | 1 | 3 | 0.3 | 1 | 1 | 1 | 1 |
| Star | 1.4 | 1 | 1 | 10 | 1.0 | 148 | 1.1 | 1 | 1 | 4 | 0.5 | 1 | 1 | 1 | 1 | 1.1 | 1 | 1 | 2 | 0.3 | 0 | 0 | 0 | 0 |
| Avatar | 3.8 | 4 | 1 | 8 | 0.8 | 136 | 2.9 | 3 | 1 | 7 | 0.9 | 9 | 8 | 2 | 2 | 2.3 | 2 | 1 | 6 | 0.7 | 1 | 1 | 0 | 0 |
| Back | 1.1 | 1 | 1 | 12 | 0.7 | 122 | 1.0 | 1 | 1 | 2 | 0.2 | 3 | 2 | 5 | 3 | 1.0 | 1 | 1 | 2 | 0.1 | 0 | 0 | 4 | 3 |
| Cancel | 3.1 | 3 | 2 | 12 | 0.5 | 127 | 2.6 | 3 | 1 | 5 | 0.6 | 25 | 21 | 3 | 2 | 2.2 | 2 | 1 | 4 | 0.6 | 2 | 1 | 1 | 1 |
| Checkbox | 2.8 | 2 | 1 | 51 | 2.6 | 134 | 2.3 | 2 | 1 | 10 | 1.4 | 13 | 13 | 4 | 1 | 1.7 | 1 | 1 | 7 | 1.1 | 3 | 2 | 1 | 1 |
| Drop-dwn | 4.5 | 3 | 2 | 43 | 3.3 | 133 | 2.8 | 2 | 2 | 6 | 1.0 | 3 | 2 | 5 | 3 | 1.9 | 2 | 1 | 5 | 0.7 | 2 | 2 | 2 | 2 |
| Forward | 1.1 | 1 | 1 | 17 | 0.8 | 122 | 1.0 | 1 | 1 | 1 | 0.0 | 0 | 0 | 2 | 2 | 1.0 | 1 | 1 | 1 | 0.0 | 0 | 0 | 1 | 0 |
| Left arrow | 2.2 | 2 | 1 | 10 | 0.8 | 123 | 2.0 | 2 | 1 | 4 | 0.5 | 13 | 12 | 3 | 2 | 1.9 | 2 | 1 | 4 | 0.6 | 5 | 5 | 1 | 1 |
| Menu | 3.2 | 3 | 2 | 16 | 1.1 | 126 | 2.0 | 2 | 1 | 3 | 0.4 | 0 | 0 | 3 | 2 | 1.8 | 2 | 1 | 3 | 0.4 | 0 | 0 | 0 | 0 |
| Play | 1.7 | 1 | 1 | 15 | 1.2 | 127 | 1.4 | 1 | 1 | 2 | 0.5 | 5 | 4 | 9 | 3 | 1.3 | 1 | 1 | 3 | 0.5 | 2 | 1 | 3 | 1 |
| Plus | 3.1 | 3 | 2 | 11 | 0.7 | 120 | 2.2 | 2 | 1 | 6 | 0.9 | 8 | 8 | 12 | 8 | 1.8 | 2 | 1 | 4 | 0.8 | 2 | 2 | 3 | 3 |
| Search | 2.3 | 2 | 1 | 13 | 1.0 | 122 | 2.0 | 2 | 1 | 3 | 0.3 | 2 | 2 | 9 | 7 | 1.9 | 2 | 1 | 3 | 0.4 | 1 | 1 | 3 | 2 |
| Setting | 5.6 | 2 | 1 | 61 | 7.1 | 111 | 3.1 | 2 | 1 | 34 | 4.0 | 11 | 7 | 5 | 5 | 2.5 | 2 | 1 | 24 | 2.4 | 1 | 0 | 1 | 1 |
| Share | 7.0 | 7 | 1 | 23 | 1.1 | 117 | 3.7 | 3 | 2 | 13 | 1.3 | 3 | 1 | 5 | 3 | 2.8 | 3 | 2 | 7 | 0.8 | 1 | 1 | 1 | 0 |
| Slider | 2.6 | 3 | 1 | 19 | 1.0 | 134 | 1.9 | 2 | 1 | 4 | 0.8 | 4 | 4 | 2 | 2 | 1.6 | 2 | 1 | 4 | 0.6 | 1 | 1 | 1 | 1 |
| Squiggle | 1.3 | 1 | 1 | 52 | 2.5 | 144 | 1.1 | 1 | 1 | 4 | 0.4 | 3 | 1 | 0 | 0 | 1.0 | 1 | 1 | 4 | 0.3 | 1 | 1 | 0 | 0 |
| Switch | 3.1 | 2 | 1 | 16 | 1.6 | 137 | 2.3 | 2 | 1 | 6 | 1.0 | 6 | 4 | 6 | 5 | 1.6 | 1 | 1 | 5 | 0.8 | 0 | 0 | 1 | 1 |
4. Evaluation
We evaluated PSDoodle’s recognition accuracy of partial UI element doodles, its top-10 retrieval accuracy of partial screen sketches, and its screen retrieval time using the following research questions.
- RQ1:
-
Can PSDoodle recognize partial UI element sketches?
- RQ2:
-
Can PSDoodle achieve similar top-10 accuracy as state-of-the-art screen search approaches?
- RQ3:
-
At a similar accuracy level, how many
UI elements did participants sketch in PSDoodle compared to state-of-the-art complete-screen sketch approaches?
- RQ4:
-
At a similar accuracy level, can PSDoodle retrieve screens faster than state-of-the-art approaches?
Following the most closely related work (Huang et al. 2019; Sain et al. 2020), we evaluated screen search performance by measuring top-k (screen) retrieval accuracy. We thus showed a participant a target screen to sketch and measured where in the result ranking the target screen appears. Top-k retrieval accuracy is the most common metric for sketch-based image retrieval tasks and correlates with user satisfaction (Huffman and Hochster 2007).
Specifically, we evaluated screen search (in RQ2, RQ3, and RQ4) with 30 “target” Rico screens, which we selected as follows. To ensure the target Rico screens contain at least some UI elements PSDoodle supports, we removed from Rico’s 58k screens those that contain less than two PSDoodle-supported UI elements, yielding 50,113 screens. From these 50k we randomly picked 30 screens, of which 26 were also in the SWIRE dataset.
We recruited 10 Computer Science students (all ages under 30). None of the participants had any formal UI/UX design training. All participants had heard about mobile app development principles before the study. For diversity, we recruited 5 participants (1 female, 4 male) without plus 5 (2 female, 3 male) with some prior mobile app development experience. Each student was compensated with USD 10 and used PSDoodle for the first time.
For the experiment, we used PSDoodle’s regular setup as a website hosted on an Amazon AWS EC2 general purpose instance (t2.large) with two virtual CPUs and 8 GB of RAM. Each participant interacted with PSDoodle over the internet from their personal machine (i.e., a laptop or desktop computer). Each participant first spent an average of 9 minutes on the PSDoodle’s interactive tutorial, which covers PSDoodle’s visual language, how and where to draw, how to access the cheat sheet (Figure 4), how to see the search results, and when to stop the search (http://pixeltoapp.com/toolIns/).
After the tutorial each user was instructed to sketch at least 3 screens. The PSDoodle website recorded their drawings, drawing time, and query results. Throughout the experiments, we observed participants’ performance via screen sharing but did not otherwise interact with them (e.g., to coach them on how to use PSDoodle). All records are available in the PSDoodle repository.
4.1. RQ1: Recognizing Partial Icon Doodles
Table 2 compares the number of per-doodle strokes in PSDoodle’s data sets with the number of strokes PSDoodle takes to correctly classify a doodle. For the latter Table 2 lists two criteria, ranking the correct class first (middle columns) and ranking the correct class in the top-3 (right columns). In the experiments participants often kept sketching until PSDoodle ranked the correct class top-1 but sometimes stopped sketching after selecting the correct class from the top-3 predictions the PSDoodle UI provides after each stroke.
For both criteria (top-1 and top-3), users can often transmit their intent to PSDoodle with fewer than a doodle’s full set of strokes. For example, while the average avatar doodle contains 3.8 strokes, PSDoodle ranks avatar top-1 on average after 2.9 strokes and top-3 after just 2.3 strokes. Several other classes have similarly large reductions in average stroke counts.
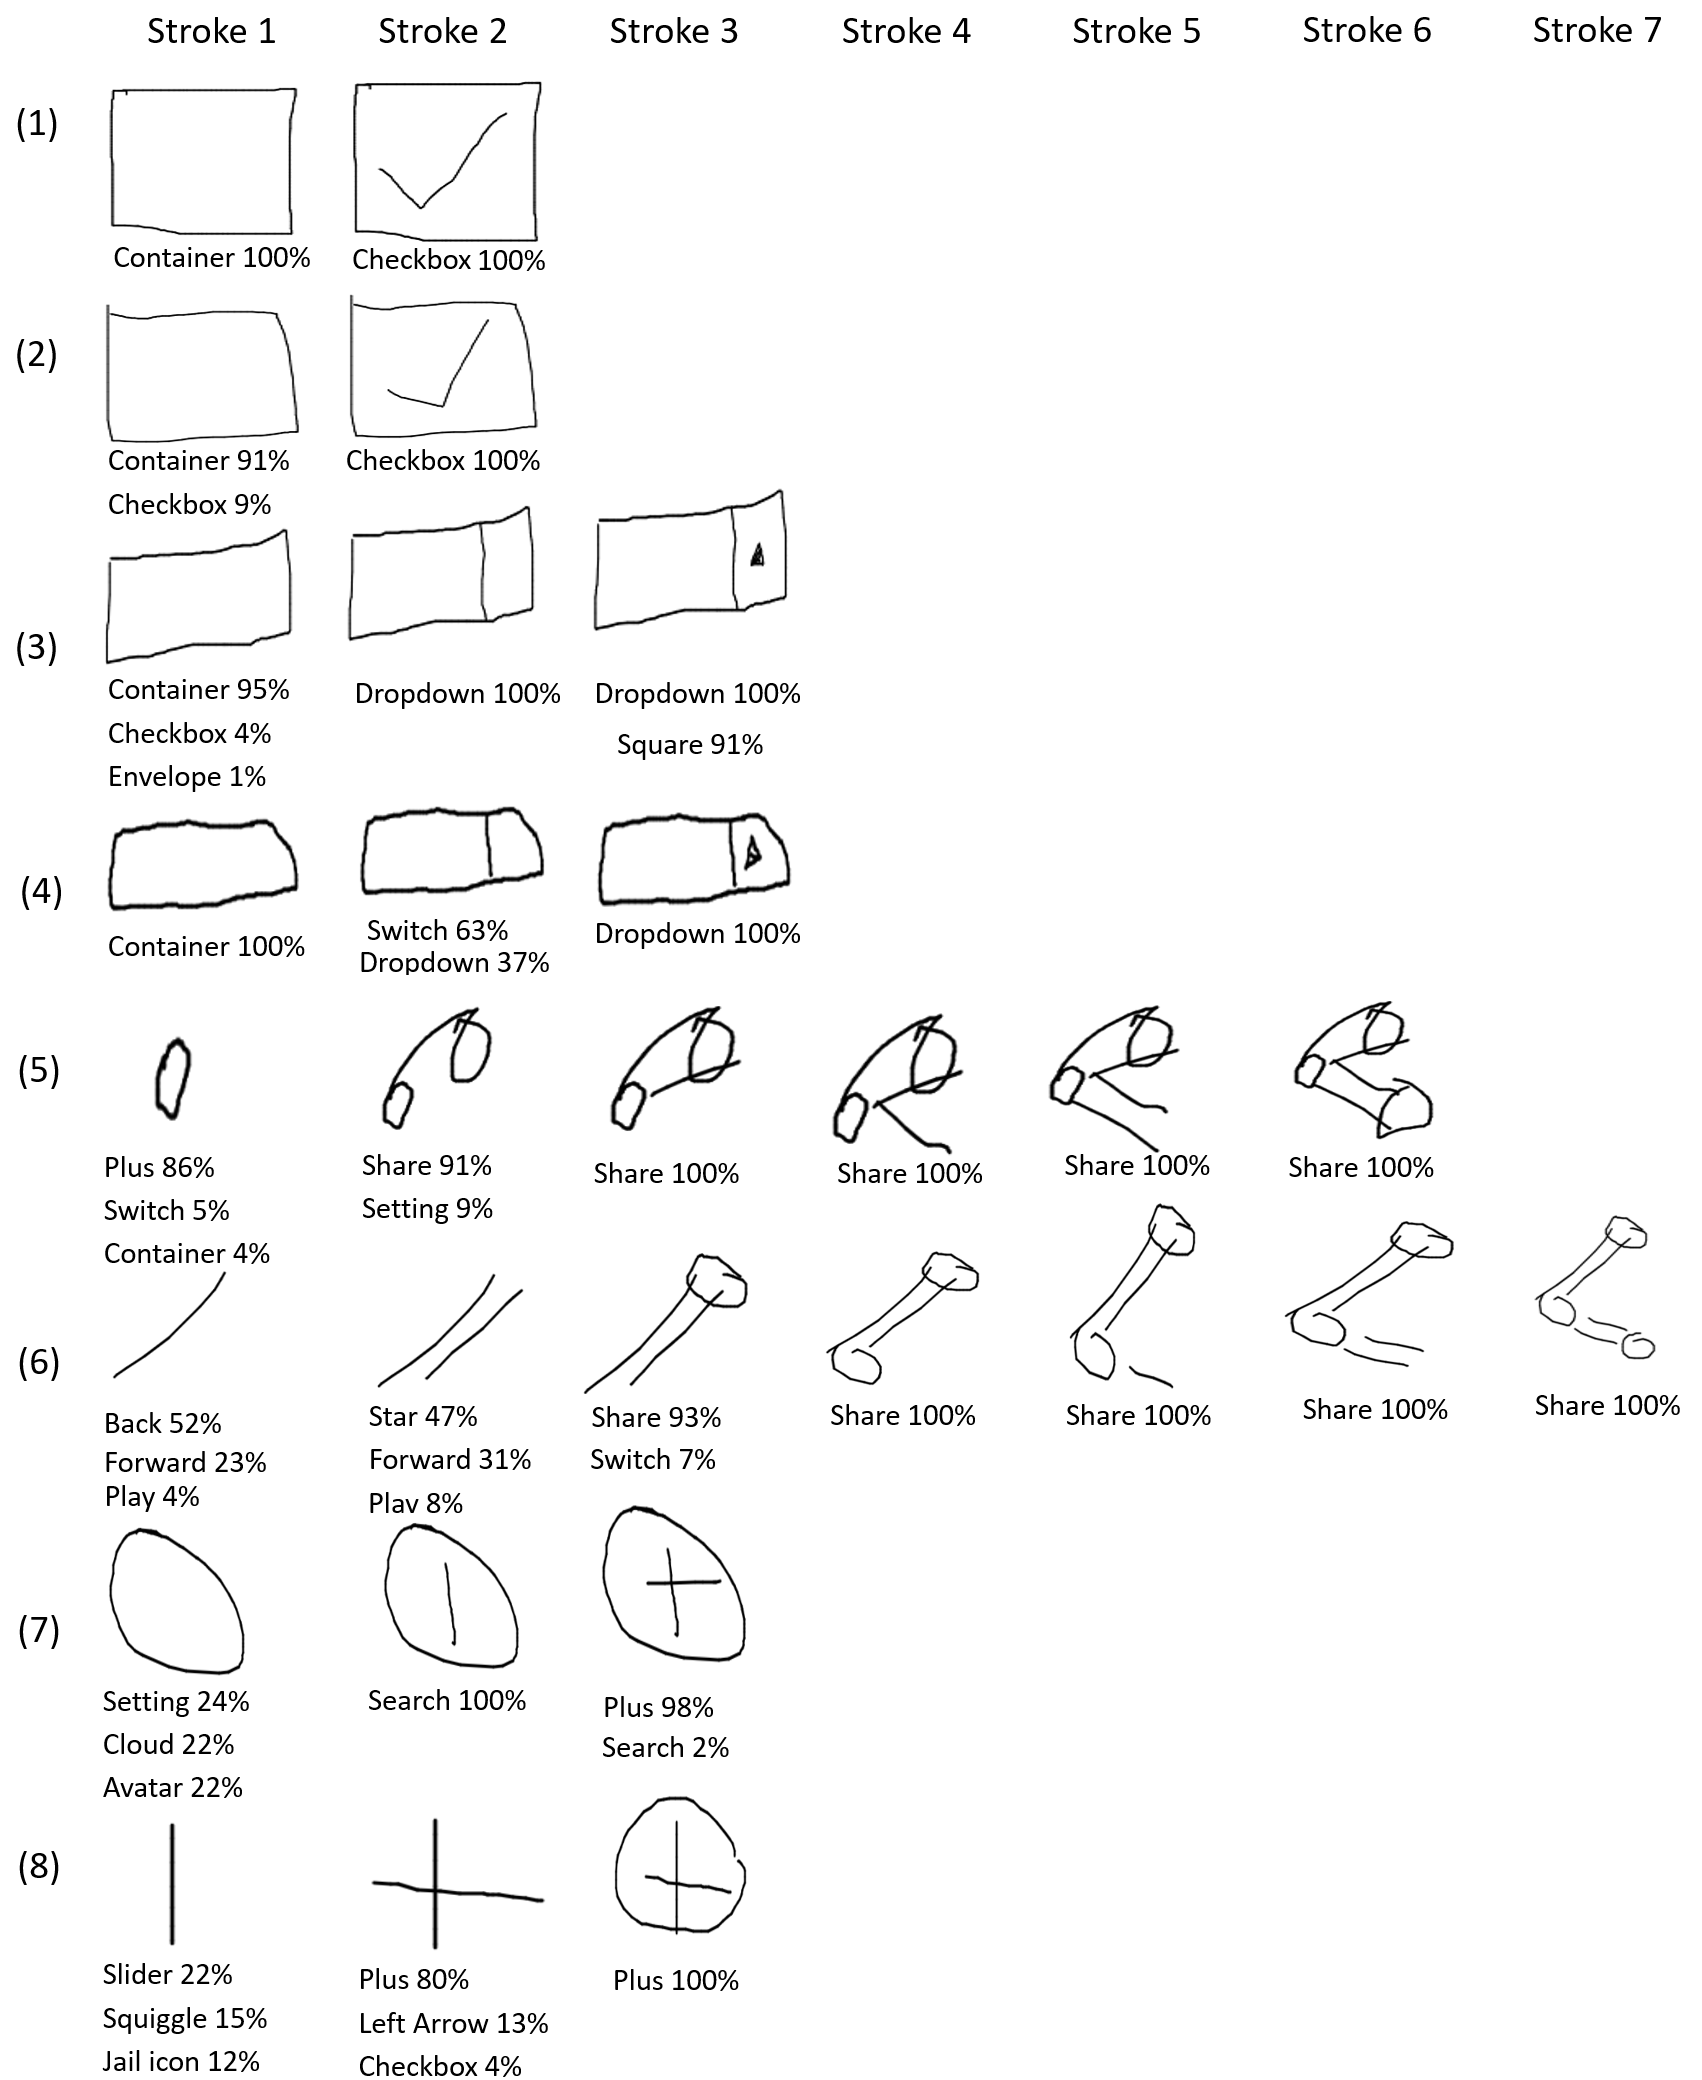
To visualize PSDoodle performance on concrete examples, Figure 8 displays PSDoodle’s current prediction after each stroke of 8 randomly sampled drawings from 4 categories. For example, in the fifth row PSDoodle ranks the doodle’s correct class top-1 after only two strokes of the doodle’s six total strokes. Such an early correct classification allows the user to quickly move on to the next doodle, thereby saving time and receiving query results faster.

We also inspected a random sample of 35 of the 192 test set sketches PSDoodle misclassified after the last stroke. Among these 35 samples we found four patterns, i.e., being an outlier due to using a large number of strokes (compared to the doodle class’s average) for 7/35 samples, using unusual strokes (such as a squiggle during drawing using more vertices compared to the class’s vertex average) or stroke sequence for 10/35 samples, deviation from the class’s common shape (14/35), and resembling another category (4/35). Figure 9 shows examples of these four categories.
4.2. RQ2: Top-10 Screen Search Accuracy
For this experiment participants were instructed to sketch with the goal of using PSDoodle to retrieve a given Rico “target” screen. We then measured how quickly this target Rico screen appeared in PSDoodle’s top-10 search results. We asked participants to use the tool at least 3 times, with 4 users attempting one additional sketch each, yielding 34 screen sketches of 30 Rico screens. For these 34 sketches, 30 times the target UI screen appears in the top-10 results, yielding a top-10 accuracy of 88.2%. (Since PSDoodle shows rows of result screens similar to Google’s image search, top-1 accuracy is less relevant.) PSDoodle’s top-10 accuracy is significantly higher than SWIRE’s and remains similar to a recent SWIRE follow-up work by Sain et. al (Sain et al. 2020), which reported 90.1% top-10 accuracy for SWIRE sketches.

We manually checked each case where PSDoodle failed to rank the target screen in the top-10. Figure 10 shows excerpts of two such screens. In both the Rico hierarchy does not contain the correct label of a user-drawn icon. Such cases could be reduced by further improving Rico’s UI element clustering and classification. Another case stems from human error (i.e., participant 9 in Table 3) because the user selected the wrong doodle category from PSDoodle’s top-3 prediction. Such human errors may become less common once users become more experienced with using PSDoodle.
4.3. RQ3: Search With Partial-screen Sketches
In addition to recognizing partial UI element sketches, PSDoodle also supports an iterative search style where a user refines the search results one UI element at a time. As the SWIRE-style approaches process complete-screen sketches, this research question quantifies the difference in UI elements a user has to draw to perform a successful screen search. Answering this question is made easier by the earlier experiment yielding a similar top-10 accuracy for PSDoodle and the most-accurate SWIRE-style approach.
In the 30 target Rico screens participants used, the average UI element count was 21.1 with a median of 19 (low 14, high 35, and standard deviation 5.4). SWIRE instructs users to sketch all screen elements, so a SWIRE sketch has a similar number of UI elements. In the participants’ 34 PSDoodle sketches of these 30 screens the average UI element count was significantly lower at 5.5 with a median of 5 (low 3, high 9, and standard deviation 1.8).
We also tested how the most-accurate SWIRE-style approach would perform on the partial screen sketches our participants produced with PSDoodle, by training their network to the reported 90.1% top-10 and 67% top-1 accuracy for SWIRE sketches (Sain et al. 2020). We thus converted our 34 participant sketches from QuickDraw’s sequence-of-stroke format to SWIRE-style black/white bitmaps (and included them in the PSDoodle repository). We removed the 8 participant sketches that used jail-window, as SWIRE uses a different placeholder for images. For all resulting 26 query sketches, the SWIRE follow-up failed to fetch the target screen in the top-10.
4.4. RQ4: Interactive and Fast Screen Retrieval
In our experiments we told participants to search via sketching for 3 minutes and stop sketching if the target screen appears in PSDoodle’s top-10 result. We recorded how long each search session took. SWIRE reports that the sketching alone of each SWIRE sketch of a Rico screen took an average of 246 seconds.
| P | Target 1 | Target 2 | Target 3 | Target 4 | ||||
|---|---|---|---|---|---|---|---|---|
| t | r | t | r | t | r | t | r | |
| 1 | 55 | 2 | 51 | 1 | 134 | 8 | - | - |
| 2 | 86 | 3 | 259 | 7 | 206 | 3 | - | - |
| 3 | 134 | 3 | 97 | 4 | 63 | 2 | - | - |
| 4 | 85 | 5 | 75 | 1 | 64 | 5 | - | - |
| 5 | 202 | 3 | 60 | 1 | 105 | 14491 | - | - |
| 6 | 127 | 2 | 119 | 1 | 109 | 9 | - | - |
| 7 | 44 | 2 | 98 | 1 | 38 | 10 | 39 | 1 |
| 8 | 168 | 10 | 248 | 1 | 103 | 1 | 73 | 5 |
| 9 | 158 | 31 | 46 | 61 | 97 | 31 | 40 | 3 |
| 10 | 30 | 8 | 138 | 1 | 147 | 1 | 158 | 6 |
Table 3 lists the total time of the search and sketch session for each of the experiment’s 34 sessions, together with the final rank of the target Rico screen in PSDoodle’s search results. Total sketch and search times per search session varied from 30 to 259 seconds. While achieving similar top-10 accuracy, most of these session times were significantly shorter than the 246 second average of SWIRE for sketching only. Most of PSDoodle’s session times were also significantly shorter than the 180 seconds target provided to participants.
PSDoodle is deployed in AWS and supports interactive search. In our experiments there was less than 2s delay between the user submitting a search query (e.g., by pressing “icon done”) to the update of the top-10 result screens on the user’s PSDoodle website. Besides communication to and from AWS, the main time components were sketch recognition (below 0.1s) as well as screen similarity calculation and screen ranking (below 1s).
4.5. High-level Feedback from Participants
Two of our 10 participants opted out of our post-evaluation survey, leaving us with 8 completed surveys. In one question we asked how participants prefer to sketch. Three preferred touch to sketch on a larger device such as an iPad, two preferred sketching on paper and taking a picture with their phone, two wanted to use a mouse to sketch on a non-touch device, one wanted to touch to sketch on a smaller device such as a smartphone, and none wanted to scan a paper-based sketch. Overall participants preferred device-based over paper-based sketching by 3:1.
In another question we asked participants to choose from three sketch-based search tool options. Two participants voted for an approach that shows its search result only after finishing a complete screen (containing all the UI elements that the screen should have in the app). The other six participants preferred a search tool that shows live search results (i.e., search results that update when adding or removing a UI element). None of the participants picked the third option, a tool that only shows its results after sketching a partial screen containing several icons.
4.6. Relaxing PSDoodle’s Query Language
In informal but more concrete feedback, participants explained how they sometimes struggled with the four PSDoodle’s icon classes whose shapes include outer boundaries such as avatar’s “outer ring”. These classes were avatar, cancel, checkbox, and plus.
While some participants preferred to sketch such icons without these outer boundaries, PSDoodle’s training data sets contained only few such samples.
To address this issue, after the experiments with participants we created additional samples from PSDoodle’s existing samples, by identifying and removing these outer boundaries. Table 2 lists the test doodles the version of PSDoodle used with participants classified wrongly (W) both after the last stroke and after each stroke. Retraining the doodle classifier after adding these samples yielded better recognition performance (W*). The new classifier performed worse on Camera and Search (and to a lesser degree on Back, Dropdown, Forward, Menu, Play, Plus, Share, and Switch).
Overall recognition accuracy improved from 94.5% to 94.9% (while keeping recognition speed the same), but is most notably 9% better for avatar (the class that study participants had the most trouble with). Among the 186 UI elements in the participants’ 34 final screen sketches, the retrained network detected 18 UI elements with fewer strokes (while requiring more strokes for 8 UI elements).
5. Related Work
In sketch-based image retrieval (SBIR), computer vision techniques try to find the similarity in the sketch-image pair based on their features when a user draws an unpolished representation of the image. Earlier studies extract hand-engineered features (edge-map, Histogram of Oriented Gradients, Histogram of edge local orientation) (Chalechale et al. 2004; Hu and Collomosse 2013) to find the similarity between the pair. Deep Leaning achieves state-of-the-art performance in several computer vision applications with Convolutional Neural Network (Krizhevsky et al. 2012; Simonyan and Zisserman 2015). The success also draws researchers to employ deep neural networks for SBIR (Song et al. 2017; Yelamarthi et al. 2018). Deep Neural Network(DNN) uses sketch-image pair for training two different networks(one for sketch and one for image). During the training phase, DNN encodes the image-sketch duo to low-dimensional feature vectors with a target to reduce the distance for similar pairs and maximize for non-similar pairs. For query, it encodes the sketch and then uses the nearest neighbor technique to query similar examples from the dataset.
Searching design from visual input (image, sketch) recently gaining attention due to the success of DNN and the creation of large-scale datasets. SWIRE (Huang et al. 2019) uses a deep neural network model to retrieve relevant UI examples from input sketches. VINS (Bunian et al. 2021) UI image (wireframe, high-fidelity) retrieves UI screenshots from high-fidelity wire-frame design.
In a follow-up to SWIRE, sketching begins with a coarse-level representation of a real-world object, followed by more fine details. Rather than considering a sketch as a flat structure, they use the hierarchical structure to pair it with a photo. Two nodes of the deep neural network are fused to form the next hierarchy level by interacting and matching features between image and sketch pair. They calculated bounding boxes of the individual connected components of the SWIRE drawings to identify interest regions. A cross-modal co-attention part of the network attends to matching interest regions in a sketch and image pair. By leveraging the hierarchical traits and mutual attention between the interest region, they achieved state-of-the-art performance in the SWIRE dataset.
Successful integration of sketch in the software development process requires a large-scale UI dataset and utilization of the dataset in the deep learning model. While some freehand drawings of user interface elements are available (Huang et al. 2019; Adefris 2020; Sermuga Pandian et al. 2021), these sketches are available as “static” pixel-based images of the final sketch.
SWIRE (Huang et al. 2019) collected 3,802 offline sketches of 2,201 screens from 23 app categories of the Google Play store. While the SWIRE dataset is very valuable, it “only” contains an offline snapshot of each final UI drawing. And drawings are not tagged with the UI element present in them. UISketch (Sermuga Pandian et al. 2021) introduced the first large-scale dataset of 17,979 hand-drawn sketches of 21 UI element categories collected from 967 participants. 69.38% of UISketch are digital sketches. The drawings are now publicly available in raw-pixel format with no stroke information.
6. Conclusions
Searching through existing repositories for a specific mobile app screen design is currently either slow or tedious. Such searches are either limited to basic keyword searches (Google Image Search) or require as input a complete query screen image (SWIRE). A promising alternative is interactive partial sketching, which is more structured than keyword search and faster than complete-screen queries. PSDoodle is the first system to allow interactive search of screens via interactive sketching. PSDoodle is built on top of a combination of the Rico repository of some 58k Android app screens, the Google QuickDraw dataset of icon-level doodles, and DoodleUINet, a curated corpus of some 10k app icon doodles collected from hundreds of individuals (mainly crowd-workers). In our evaluation with third-party software developers, PSDoodle provided similar accuracy as the state of the art from the SWIRE line of work, while cutting the average time required about in half. All of PSDoodle’s source code, processing scripts, training data, and experimental results are available under permissive open-source licenses.
Acknowledgements.
Christoph Csallner has a potential research conflict of interest due to a financial interest with Microsoft and The Trade Desk. A management plan has been created to preserve objectivity in research in accordance with UTA policy. This material is based upon work supported by the National Science Foundation (NSF) under Grant No. 1911017.References
- (1)
- Adefris (2020) Biniam Adefris. 2020. Sketch2Code. https://www.kaggle.com/biniamad/sketch2code
- Andersson et al. (2018) Melanie Andersson, Arvola Maja, and Sara Hedar. 2018. Sketch Classification with Neural Networks: A Comparative Study of CNN and RNN on the Quick, Draw! data set. Master’s thesis. Uppsala University.
- Buitinck et al. (2013) Lars Buitinck, Gilles Louppe, Mathieu Blondel, Fabian Pedregosa, Andreas Mueller, Olivier Grisel, Vlad Niculae, Peter Prettenhofer, Alexandre Gramfort, Jaques Grobler, Robert Layton, Jake VanderPlas, Arnaud Joly, Brian Holt, and Gaël Varoquaux. 2013. API design for machine learning software: experiences from the scikit-learn project. In ECML PKDD Workshop: Languages for Data Mining and Machine Learning. 108–122.
- Bunian et al. (2021) Sara Bunian, Kai Li, Chaima Jemmali, Casper Harteveld, Yun Fu, and Magy Seif Seif El-Nasr. 2021. VINS: Visual Search for Mobile User Interface Design. In Proceedings of the 2021 CHI Conference on Human Factors in Computing Systems. 1–14.
- Campos and Nunes (2007) Pedro Campos and Nuno Jardim Nunes. 2007. Practitioner tools and workstyles for user-interface design. IEEE software 24, 1 (Jan. 2007), 73–80.
- Carter and Hundhausen (2010) Adam S. Carter and Christopher D. Hundhausen. 2010. How is user interface prototyping really done in practice? A survey of user interface designers. In Proc. IEEE Symposium on Visual Languages and Human-Centric Computing (VL/HCC). IEEE, 207–211.
- Chalechale et al. (2004) Abdolah Chalechale, Golshah Naghdy, and Alfred Mertins. 2004. Sketch-based image matching using angular partitioning. IEEE Transactions on Systems, Man, and Cybernetics-part a: systems and humans 35, 1 (2004), 28–41.
- Deka et al. (2017) Biplab Deka, Zifeng Huang, Chad Franzen, Joshua Hibschman, Daniel Afergan, Yang Li, Jeffrey Nichols, and Ranjitha Kumar. 2017. Rico: A mobile app dataset for building data-driven design applications. In Proc. 30th Annual ACM Symposium on User Interface Software and Technology (UIST). ACM, 845–854.
- Deka et al. (2016) Biplab Deka, Zifeng Huang, and Ranjitha Kumar. 2016. ERICA: Interaction mining mobile apps. In Proc. 29th Annual Symposium on User Interface Software and Technology (UIST). ACM, 767–776.
- Eckert and Stacey (2000) Claudia Eckert and Martin Stacey. 2000. Sources of inspiration: a language of design. Design studies 21, 5 (2000), 523–538.
- Garrido-Jurado et al. (2014) Sergio Garrido-Jurado, Rafael Muñoz-Salinas, Francisco José Madrid-Cuevas, and Manuel Jesús Marín-Jiménez. 2014. Automatic generation and detection of highly reliable fiducial markers under occlusion. Pattern Recognition 47, 6 (2014), 2280–2292.
- Ha and Eck (2017) David Ha and Douglas Eck. 2017. A neural representation of sketch drawings. arXiv preprint arXiv:1704.03477.
- Hellmann and Maurer (2011) Theodore D Hellmann and Frank Maurer. 2011. Rule-based exploratory testing of graphical user interfaces. In 2011 Agile Conference. IEEE, 107–116.
- Herring et al. (2009) Scarlett R Herring, Chia-Chen Chang, Jesse Krantzler, and Brian P Bailey. 2009. Getting inspired! Understanding how and why examples are used in creative design practice. In Proceedings of the SIGCHI conference on human factors in computing systems. 87–96.
- Hu and Collomosse (2013) Rui Hu and John Collomosse. 2013. A performance evaluation of gradient field hog descriptor for sketch based image retrieval. Computer Vision and Image Understanding 117, 7 (2013), 790–806.
- Huang et al. (2019) Forrest Huang, John F. Canny, and Jeffrey Nichols. 2019. Swire: Sketch-based user interface retrieval. In Proceedings of the 2019 CHI Conference on Human Factors in Computing Systems. ACM.
- Huffman and Hochster (2007) Scott B Huffman and Michael Hochster. 2007. How well does result relevance predict session satisfaction?. In Proc. 30th Annual International ACM SIGIR Conference on Research and Development in Information Retrieval. ACM, 567–574.
- Ines et al. (2017) Gasmi Ines, Soui Makram, Chouchane Mabrouka, and Abed Mourad. 2017. Evaluation of mobile interfaces as an optimization problem. Procedia computer science 112 (2017), 235–248.
- Jongejan et al. (2016) Jonas Jongejan, Henry Rowley, Takashi Kawashima, Jongmin Kim, and Nick Fox-Gieg. 2016. Quick, Draw! https://quickdraw.withgoogle.com/ Accessed March 2022.
- Krizhevsky et al. (2012) Alex Krizhevsky, Ilya Sutskever, and Geoffrey E. Hinton. 2012. ImageNet classification with deep convolutional neural networks. In Proc. 26th Annual Conference on Neural Information Processing Systems (NIPS). NIPS, 1106–1114.
- Landay and Myers (1995) James A. Landay and Brad A. Myers. 1995. Interactive sketching for the early stages of user interface design. In Proc. ACM SIGCHI Conference on Human Factors in Computing Systems (CHI). ACM, 43–50.
- Liu et al. (2018) Thomas F Liu, Mark Craft, Jason Situ, Ersin Yumer, Radomir Mech, and Ranjitha Kumar. 2018. Learning design semantics for mobile apps. In Proc. 31st Annual ACM Symposium on User Interface Software and Technology (UIST). 569–579.
- Mohian and Csallner (2021) Soumik Mohian and Christoph Csallner. 2021. DoodleUINet: Repository for DoodleUINet Drawings Dataset and Scripts. https://doi.org/10.5281/zenodo.5144472
- Mohian and Csallner (2022) Soumik Mohian and Christoph Csallner. 2022. soumikmohianuta/PSDoodle: PSDoodle Repository for the Publication. https://doi.org/10.5281/zenodo.6339717
- Newman and Landay (1999) Mark W. Newman and James A. Landay. 1999. Sitemaps, storyboards, and specifications: A sketch of Web site design practice as manifested through artifacts. Technical Report UCB/CSD-99-1062. EECS Department, UC Berkeley.
- Ritchie et al. (2011) Daniel Ritchie, Ankita Arvind Kejriwal, and Scott R Klemmer. 2011. d. tour: Style-based exploration of design example galleries. In Proc. 24th annual ACM Symposium on User Interface Software and Technology (UIST). 165–174.
- Sain et al. (2020) Aneeshan Sain, Ayan Kumar Bhunia, Yongxin Yang, Tao Xiang, and Yi-Zhe Song. 2020. Cross-modal hierarchical modelling for fine-grained sketch based image retrieval. In Proc. 31st British Machine Vision Virtual Conference (BMVC).
- Sermuga Pandian et al. (2021) Vinoth Pandian Sermuga Pandian, Sarah Suleri, and Prof Dr Matthias Jarke. 2021. UISketch: A Large-Scale Dataset of UI Element Sketches. In Proceedings of the 2021 CHI Conference on Human Factors in Computing Systems. 1–14.
- Simonyan and Zisserman (2015) Karen Simonyan and Andrew Zisserman. 2015. Very Deep Convolutional Networks for Large-Scale Image Recognition. In arXiv:1409.1556.
- Song et al. (2017) Jifei Song, Qian Yu, Yi-Zhe Song, Tao Xiang, and Timothy M Hospedales. 2017. Deep spatial-semantic attention for fine-grained sketch-based image retrieval. In Proc. IEEE International Conference on Computer Vision. 5551–5560.
- Tensorflow (2020) Tensorflow. 2020. Recurrent Neural Networks for Drawing Classification. https://github.com/tensorflow/docs/blob/master/site/en/r1/tutorials/sequences/recurrent_quickdraw.md
- Torrey and Shavlik (2009) Lisa Torrey and Jude Shavlik. 2009. Transfer learning. In Handbook of Research on Machine Learning Applications and Trends: Algorithms, Methods, and Techniques. IGI Global, 242–264.
- Wong (1992) Yin Yin Wong. 1992. Rough and ready prototypes: Lessons from graphic design. In Proc. ACM SIGCHI Conference on Human Factors in Computing Systems (CHI), Posters and Short Talks. ACM, 83–84.
- Yeh et al. (2009) Tom Yeh, Tsung-Hsiang Chang, and Robert C Miller. 2009. Sikuli: using GUI screenshots for search and automation. In Proceedings of the 22nd annual ACM symposium on User interface software and technology. 183–192.
- Yelamarthi et al. (2018) Sasi Kiran Yelamarthi, Shiva Krishna Reddy, Ashish Mishra, and Anurag Mittal. 2018. A zero-shot framework for sketch based image retrieval. In Proceedings of the European Conference on Computer Vision (ECCV). 300–317.