Active Galactic Nuclei and their demography through cosmic time
Abstract
Active Galactic Nuclei (AGN) are highly energetic astrophysical sources powered by accretion onto supermassive black holes in galaxies, which present unique observational signatures covering the full electromagnetic spectrum (and more) over about twenty orders of magnitude in frequency. We first review the main AGN properties and diversities and show that they can be explained by a small number of parameters. We then discuss the so-called Unification Models for non-jetted AGN, according to which these sources are believed to have the same nuclear engine and circumnuclear matter, with the same geometry for the obscuring structure. This simplified scenario, however, cannot explain all the observed complexities, such as the presence of multiple absorbers on different physical scales, including recent X-ray observations of circumnuclear matter. Finally, we touch upon AGN evolution in the X-ray and -ray bands.
Keywords:
Active Galactic Nuclei - High energy astrophysics - Black holes - Gamma-rays - X-ray astronomy - X-ray surveys - Multi-messenger Astronomy1 Active Galactic Nuclei as multi-wavelength and multi-messenger emitters
The discovery of quasars (Schmidt 1963) revolutionized astronomy, opening up at the same time a whole new field, that of AGN (e.g. D’Onofrio et al. 2012; Kellermann 2015, for historical details). As implicit in their name, AGN outshine the nuclei of “normal” galaxies. Their emission is unrelated to the nuclear fusion powering stars and is now instead universally accepted to be connected to an actively accreting central supermassive () black hole (SMBH). This leads to a host of interesting properties, which include: (1) very high powers (up to a bolometric luminosity erg s-1), which make AGN the most powerful, non-explosive sources in the Universe, visible up to very high redshifts (Wang et al. 2021, currently :); (2) relatively small (milliparsec-size) emitting regions as inferred from their variability (Ulrich et al. 1997, e.g.), which imply very high energy densities; (3) very strong evolution of their luminosity functions (Merloni & Heinz 2013; Brandt & Alexander 2015, LFs; e.g.), which give the number of sources per luminosity bin and per unit volume (see Sect. 3); (4) detectable emission covering the whole electromagnetic spectrum (Padovani et al. 2017).
The last property means that AGN have been, and are being, discovered in all spectral bands, by employing a variety of methods and selection techniques. The crucial point is that different wavelengths provide different windows on AGN physics. Namely, as discussed extensively in Padovani et al. 2017, the infrared (IR) band is mostly sensitive to obscuring material and dust, the optical/ultraviolet (UV) band is related to emission from the accretion disk (the so-called “big blue bump”), while the X-ray band traces Comptonized emission from a hot corona. -ray and (high flux density) radio samples, instead, preferentially select AGN emitting strong non-thermal radiation coming from relativistic jets, i.e., streams of plasma with speeds approaching the speed of light, and associated lobes (see Fig. 1). As a result, the observed surface densities of AGN (i.e., the number of sources per square degree) also vary strongly across the electromagnetic spectrum due to a complicated mix of technological limitations, selection effects, and physical processes, as shown by Fig. 2.
The broad-band AGN spectrum shown in Fig. 1 shows that there are two regions which are dominated by the accretion power: the X-ray and optical-UV. It is not surprising therefore that, since the earliest studies on AGN, there has been particular attention to the luminosity ratio of these two bands (Tananbaum et al. 1979, e.g.) parameterized by the so-called optical to X-ray spectral index () defined as:
| (1) |
The study of the luminosity dependence of has been used to understand the relation between the disk emission and the coronal emission, respectively traced in the UV and X-ray bands. We refer the reader to Chap. 2 for a detailed discussion on the use of to trace UV and X-ray emission and to Chap. 4 for cosmological quantities.
1.1 The AGN “zoo”
The way AGN have been selected has led, almost unavoidably, to an explosion of AGN classes and sub-classes (see Tab. 1 of Padovani et al. 2017), which outsiders to the field, but sometimes insiders as well, find confusing, to say the least (ask physicists!). Luckily, reality is much simpler, with most, if not all, of these apparently different classes being due to changes in a small number of parameters, namely: orientation (of the obscuring material and of the jet) (Antonucci 1993; Urry & Padovani 1995; Netzer 2015, e.g.), radiative efficiency (see further on), related to the accretion rate and therefore the Eddington ratio (), (Heckman & Best 2014, e.g.), the presence (or absence) of strong relativistic jets (Padovani 2016; Padovani 2017; Radcliffe et al. 2021, e.g.), and possibly the host galaxy and the environment. is the ratio between the observed luminosity and the Eddington luminosity, erg s-1, where is one solar mass, which is the maximum isotropic luminosity a body can achieve when there is balance between radiation pressure (on the electrons) and gravitational force (on the protons).
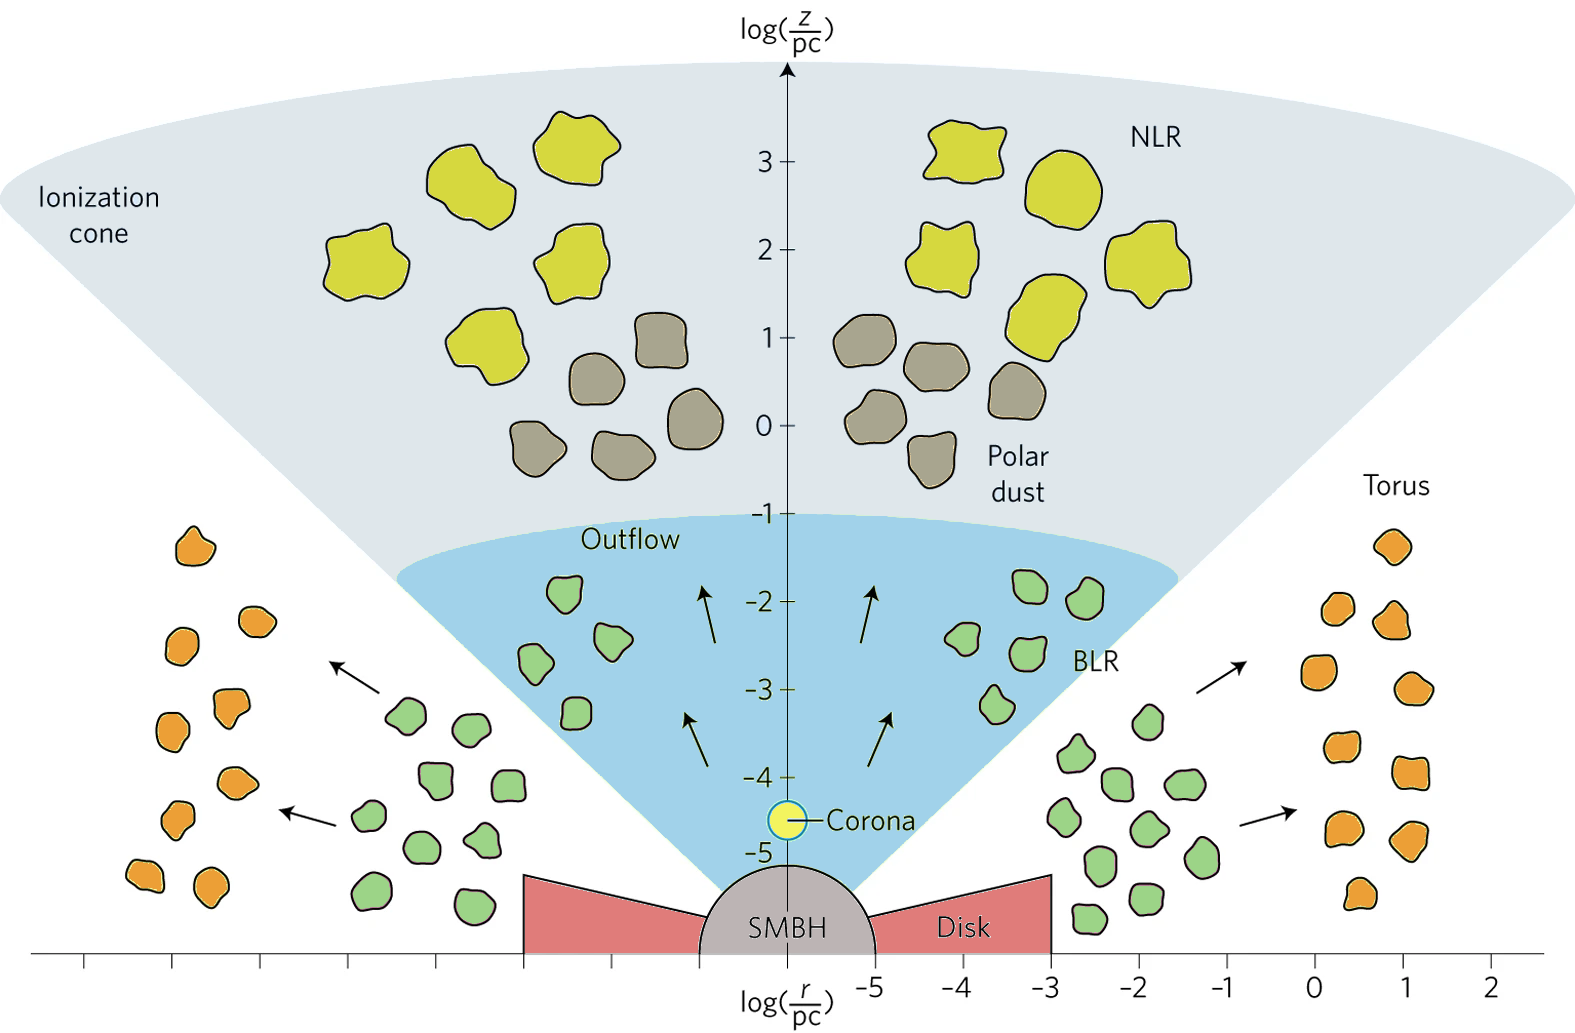
Fig. 3 provides a schematic view of the inner parts of a non-jetted AGN and highlights, from the centre to host-galaxy scales, the SMBH, the accretion disk and the corona, the broad line region (BLR), the torus, and the narrow line region (NLR). X-rays are produced via Comptonization of the accretion disk’s photons by a corona of hot electrons. The resulting power law spectrum interacts with the surrounding matter, being absorbed (for example by the torus) or ‘reprocessed’ (by the accretion disk itself, the torus, the NLR), giving rise to further spectral components, in particular a Compton reflection peaking at 20-30 keV, and fluorescent emission lines, the most prominent being the K line from neutral iron at 6.4 keV.
Turning to the various classes, radio quasars are radiatively efficient (see below), jetted AGN, seen face-on. The fact that they display strong and Doppler broadened lines in their spectra (with full-width half maximum [FWHM] km/s), in fact, implies that we are looking inside the torus, i.e. dust in a flattened configuration roughly perpendicular to the jet. Their edge-on versions are high-excitation (i.e. radiatively efficient) radio galaxies, most of which are of the Fanaroff-Riley (FR)11 1 Fanaroff & Riley 1974 divided radio galaxies into type I and II by using the ratio of the separation of the highest surface brightness regions on opposite sides of the central galaxy and the extent of the source measured from the lowest surface brightness contour, with FR Is and FR IIs having a ratio and , respectively. II type. In this case the central nucleus and surrounding material (including the broad line emitting clouds) are obscured by the dust and only narrow lines, emitted by more distant clouds, are visible in their optical spectra (Fig. 3). Seyfert 1s22 2 It is now generally agreed upon that the distinction at used in the past to separate quasars and Seyferts, or stellar and non-stellar (i.e., extended) sources, is not a physical one, and that Seyfert 1’s are lower luminosity versions of quasars. Still, the absolute magnitude cut might be useful to roughly separate AGN fainter and brighter than the brightest galaxies (Condon et al. 2013, e.g.,). and quasars are similarly efficient and oriented but are non-jetted AGN, whereby Seyfert 2’s and type 2 quasars are their edge-on relatives. Turning to radiatively inefficient AGN, BL Lacertae objects (BL Lacs) represent the jetted, face-on kind, while the edge-on version include low-excitation radio galaxies, most of which are FR Is. Finally, non-jetted, inefficient AGN are collectively lumped under the Low-ionization Nuclear Emission-line Region (LINER) class33 3 Note however that not all LINERs appear to be ionized by AGN: (Sarzi et al. 2010, e.g.).. Non-jetted AGN make up the majority () of all AGN.
Radiatively inefficient accretion is related to low (), and therefore typically also low luminosities, while radiatively efficient sources generally have (Heckman & Best 2014, e.g.). The difference in is generally associated with a switch between a standard accretion, i.e. radiatively efficient, geometrically thin (but optically thick) disk accretion flow and a radiatively inefficient, geometrically thick (but optically thin) disk accretion flow (e.g. Yuan & Narayan 2014; Padovani et al. 2017, and references therein; see also Sect. 2.1). We note that the SED shown in Fig. 1 is representative of radiatively efficient AGN. The SEDs of low-luminosity, radiatively inefficient AGN are somewhat different. Namely, when normalised at the same X-ray power, they show a somewhat higher radio power (by about one order of magnitude) and a much weaker big blue bump in the UV (Younes et al. 2012, e.g.).
Blazars are simply jetted AGN oriented at very small angles () with respect to the line of sight and include two main classes, of two opposite accretion types: BL Lacs (radiatively inefficient) and flat-spectrum radio quasars (FSRQs: radiatively efficient). As a result, the former have often totally featureless optical spectra, sometimes exhibiting weak absorption and emission lines, while the latter display broad, quasar-like strong emission lines (Urry & Padovani 1995; Padovani et al. 2017). The SED of blazars is characterised by a typical “double hump” shape (in space: see Fig. 1). The low-energy component, peaking between the IR and the X-ray band, is generally attributed to synchrotron radiation produced by relativistic electrons in a magnetic field. Objects where this component peaks at low energies ( Hz [ 0.41 eV]) are called LBLs/LSPs, while objects peaking at high energies ( Hz [ 4.1 eV] are named HBLs/HSPs (Padovani & Giommi 1995; Abdo et al. 2010). Intermediate sources are the IBLs/ISPs. The nature of the second component, that extends well into the -ray band, is still debated (Sect. 1.2).
Fig. 4 shows that a “minimalistic” approach to AGN classification using just the three parameters discussed above can explain the most important AGN classes.
1.2 AGN as high-energy and multi-messenger sources
The feature which is most relevant to this handbook is the fact that AGN are very powerful high-energy, i.e. keV, emitters. The X-ray and -ray bands, however, sample somewhat different AGN populations. X-ray emission appears to be a universal AGN feature, which implies that both jetted and non-jetted AGN are strong44 4 The oft-quoted value of erg s-1 is used to separate AGN from star-forming galaxies. However, as pointed out by Padovani 2016, plenty of AGN, especially, but not only, of the radiatively inefficient jetted type, have below this value. X-ray emitters. This, together with the sensitivity of X-ray observatories, explains why the observed AGN surface density is highest in the X-ray band (Fig. 2). However, only jetted AGN, almost all of the blazar type, manage to emit in the -ray ( MeV) regime, as non-jetted AGN are not detected by Fermi (Abdollahi et al. 2020)55 5 To be more precise, a handful of Seyferts, including NGC 1068 and NGC 4945, are listed in the Fermi-4FGL-DR3 catalogue (Fermi-LAT collaboration et al. 2022) but their -ray emission is thought to be related to starburst emission in their host galaxy and not to their SMBH (Ajello et al. 2020b)., the -ray space mission surveying the high-energy sky in the 50 MeV -- 1 TeV band66 6 https://fermi.gsfc.nasa.gov/. In fact, blazars make up of the Fermi sky and the vast majority of extragalactic -ray sources (Fermi-LAT collaboration et al. 2022), while 92% of extragalactic objects above 1 TeV77 7 http://tevcat.uchicago.edu are also blazars, studied mostly with Imaging Atmospheric Cherenkov Telescopes (IACTs) such as MAGIC88 8 https://magic.mpp.mpg.de/, H.E.S.S.99 9 https://www.mpi-hd.mpg.de/hfm/HESS/, and VERITAS1010 10 https://veritas.sao.arizona.edu/. IACTs, unlike Fermi, have a relatively small field of view and observe from the ground the particle showers produced by the impact of very high-energy ( 50 GeV – 10 TeV) -ray photons on the top layers of the atmosphere, either through the Cherenkov light they generate, or via the direct detection of the charged particles in the shower.
AGN outflows, i.e. large-scale winds of matter driven by the central SMBH, were also predicted to be (faint) -ray sources, as their semi-relativistic speeds (up to 50,000 km s-1) can drive a shock that accelerates and sweeps up matter (King & Pounds 2015, e.g.) (see also Sect. 2.1). The protons accelerated by these shocks can then generate low-level -ray emission via collisions with protons in the interstellar medium (Lamastra et al. 2017; Liu et al. 2018, e.g.). This has been detected very recently in AGN with ultra-fast outflows (UFOs) through a stacking analysis by Fermi Ajello et al. 2021.
Blazars have also recently entered the multi-messenger arena. A high-energy neutrino event ( TeV) observed by IceCube1111 11 http://icecube.wisc.edu: IceCube is the largest neutrino detector in the world and has been operating from the South Pole for about 10 years. It has detected hundreds of astrophysical neutrinos with energies in some cases extending beyond 1 PeV ( eV). on September 22, 2017, in fact, was found to be in spatial coincidence with the known BL Lac TXS 0506+056 at undergoing a period of enhanced -ray emission, first observed by the Fermi satellite and later by the MAGIC telescopes. The chance coincidence of the neutrino alert with the flaring -ray source is at the level of (IceCube Collaboration et al. 2018). Furthermore, an archival analysis revealed that during the September 2014 to March 2015 time period TXS 0506+056 showed a prolonged outburst when it emitted neutrinos. A chance correlation of this type of neutrino outburst can be excluded at a confidence level of (IceCube Collaboration 2018). This association adds to a growing body of evidence, which links at least some blazars to IceCube neutrinos (e.g. Giommi et al. 2020; Giommi & Padovani 2021, and references therein).
The importance of this multi-messenger connection can hardly be exaggerated, for various reasons. First, it has vital implications for the nature of -ray emission in blazars, which is still debated, as two alternative, or possibly complementary, interpretations have been considered (e.g. Cerruti 2020, and references therein). The first scenario, so-called leptonic, explains -ray emission as inverse Compton scattering between the electrons in the jet and their own synchrotron emission (synchrotron self-Compton) or an external photon field (external inverse Compton) (Maraschi et al. 1992). In the second scenario, the hadronic one, -rays are instead assumed to originate from high-energy protons either loosing energy through synchrotron emission (Aharonian 2000) or through the photo-meson process (Mannheim 1993). The latter is the production of pions (or pi mesons: ) through proton-photon interactions, which generate and . The neutral pion decades into two -ray photons, while the charged pions end up producing electron/positron pairs and (muon and electron) neutrinos (and anti-neutrinos). Photo-meson production has thus one fundamental property: neutrinos and -rays (of roughly similar energy and flux) are produced together. Neutrino detection from a blazar is therefore the smoking gun that relativistic protons, i.e. hadronic processes, are at work. Moreover, while -rays are absorbed by pair-production interactions with the extragalactic background light (EBL1212 12 The EBL is the sum of all the radiation produced by all galaxies in the Universe over its whole history.) at GeV (e.g. Biteau et al. 2020, and references therein), neutrinos can travel cosmological distances basically unaffected by matter and magnetic fields and are the only “messengers”, which can provide information on the very high-energy physical processes that generated them. Said differently, since the extragalactic photon sky is almost completely dark at the energies sampled by IceCube ( TeV), neutrinos are our only hope to probe these energies.
2 Circumnuclear matter on different physical scales
The basic ingredient of standard Unification Models is an axisymmetric absorber, which prevents the direct view of the nuclear engine in edge-on line of sights (see Fig. 3). The presence of this obscuring structure was inferred by the observation of broad emission lines and a big blue bump in the polarized light of Type 2 objects, thus unveiling their hidden Type 1 nucleus (Antonucci 1993, e.g.,). Being the polarization very high and perpendicular to the radio axis, this is clear evidence that photons from the nuclear regions can only escape along the axis, and then get scattered into the line of sight. The equatorial direction is therefore blocked by some kind of dusty ‘toroidal’ structure.
In this scenario, all AGN are believed to have intrinsically the same nuclear engine, which emits an optical featureless continuum and broad emission lines, and an optically opaque torus, co-aligned with the radio axis. This torus should be located on parsec scales, in order to obscure the inner, dustless and high-density ( cm-3) BLR, while leaving unaffected the outer, extended and low-density ( cm-3) NLR. In particular, the geometry of the torus, e.g. its opening angle, is postulated to be the same for all objects. However, it is now clear that this simplified scenario is not able to take into account all the complexities arisen in decades of multiwavelength observations. On the one hand, multiple absorbers, on different physical scales, must be now considered to picture a comprehensive view of obscuration in AGN. On the other hand, the X-ray perspective of circumnuclear matter in AGN has revolutionised our classic view of the standard ingredients of the Unification Models, i.e. the torus, the BLR and the NLR. In this respect, Compton-thick sources (absorbed by a column density [NH] of neutral gas larger than the inverse of the Thomson cross section, cm-2) play a prominent role, since they allow for a clean view of the circumnuclear matter in the X-rays, not being overwhelmed by the nuclear emission.
2.1 Within the sublimation radius
Dust sublimation is generally believed to set the outer boundary of the BLR (Laor & Draine 1993; Netzer & Laor 1993). It occurs at a temperature around K, depending on the grain composition and size, so that a correspondent sublimation radius can be defined, which scales with the luminosity of the central source as (Barvainis 1987, e.g.). Indeed, the size of the BLR is well known to scale with the square root of luminosity, with a tight relation which holds over several orders of magnitude (Bentz et al. 2013, e.g.). Most models picture the BLR as a disc wind, predicting its disappearance at very low luminosity or accretion rates (Nicastro 2002; Laor 2003). This was apparently confirmed by the existence of low accreting true type 2 AGN, where the lack of broad optical lines is not associated with obscuration along the line of sight (e.g. Bianchi et al. 2012, for a comprehensive picture). However, a very broad H line in the archetypal true type 2 NGC 3147 was revealed once a significant fraction of the host galaxy contamination was removed thanks to a small-aperture Hubble Space Telescope (HST1313 13 https://hubblesite.org/) aperture, extending the relation to very low accretion rates, and questioning the very existence of this class of objects (Bianchi et al. 2019b).
At odds with the standard Unification Model, X-ray absorption variability gives solid evidence in favour of the presence of a component of absorbing gas within the sublimation radius. In the last 20 years, it was shown that this is a common feature in AGN. First results were presented in Risaliti et al. 2002 with the analysis of a sample of nearby obscured AGN with multiple X-ray observations, showing almost ubiquitous NH variations in local Seyfert galaxies. This has a twofold physical implication: the X-ray absorber must be clumpy and located close enough to the central source to witness significant variability. It is interesting to stress that the presence of gas inside the dust sublimation radius necessarily produces a mismatch between the optical/near-IR reddening (extinction) and X-ray column density measured along the line of sight. Indeed, a decrease of the expected dust-to-gas ratio is a long-standing observational evidence in nearby Seyfert galaxies (Maccacaro et al. 1982; Maiolino et al. 2001, e.g.), and can be naturally explained by the effect of X-ray absorption by BLR clouds.
Constraints on the geometrical and physical properties of this gas were derived through several observational campaigns (Elvis et al. 2004; Risaliti et al. 2005; Bianchi et al. 2009, e.g.). In the archetypical case, NGC 1365, Compton-thin (N cm-2) to thick (N cm-2) state transitions were observed on time scales as short as 10 hours. Assuming that the absorbing gas is moving with Keplerian velocity, these rapid events imply the presence of clouds at rg1414 14 r is the gravitational radius of an object of mass , where is the Gravitational constant and the speed of light. from the BH, rotating at velocities larger than km s-1. Estimates for the size and density of the clouds can be also derived, being of the order of 1013 cm and 1010-1011 cm-3, respectively. The overall scenario is therefore in agreement with the identification of this component of the X-ray absorber with the BLR clouds responsible for broad emission lines in the optical/UV.
A careful analysis of X-ray “eclipses” occurring when an absorbing cloud passes along the line of sight provided further information on its geometrical and physical properties. Again for NGC 1365, Maiolino et al. 2010 studied the time evolution of its covering factor and its column density, unveiling a “cometary” shape for the obscuring cloud, i.e. a high density head, followed by an elongated, lower density tail. These “cometary” clouds may represent fascinating insights for open issues in modeling the BLR in AGN. For example, the mass loss through the cometary tail could result in the destruction of the cloud within a few months (Maiolino et al. 2010). Therefore, there must be a process which continuously replenishes the gas clouds, likely from the accretion disk itself. Such a process could indeed be key for the dynamical equilibrium invoked for the long-standing problem of the stability of BLR clouds (e.g. Osterbrock & Mathews 1986, for a classical review). Another implication of the cometary structure of the BLR would be on the overall broad emission line profile. In this case, each cloud would contribute to the observed profile with a small, but not null, width, reducing dramatically the total number of clouds needed to reproduce the observed smooth profiles. This would be a more consistent solution with respect to current estimates with ‘point-like’ BLR clouds, which require enormous cloud densities to achieve the high level of observed smoothness (see e.g. Arav et al. 1998, for NGC 4151), resulting in a nearly complete occupation of the available volume. Future, higher throughput X-ray observatories (e.g. Athena1515 15 https://www.the-athena-x-ray-observatory.eu/, eXTP1616 16 https://www.isdc.unige.ch/extp/) may fully disclosure the powerful potentiality of occultation events to measure the physical and geometrical properties of the BLR clouds.
More recent observations have shown that such occultations can also occur in otherwise persistently unobscured sources. In particular, long-term X-ray monitorings discovered sudden spectral hardening events (i.e. a decrease of the soft X-ray flux with respect to the hard X-rays) in Type 1 objects, lasting for days up to several years (Markowitz et al. 2014; Mehdipour et al. 2017, e.g.). As first proposed for NGC 5548 (Kaastra et al. 2014), these events are due to mildly ionized winds arising in the accretion disk, obscuring the nuclear source along the line of sight and possibly reaching beyond the BLR. This is depicted in Fig. 5, where the location of this obscurer is shown with respect to the other basic components of the central region of an AGN. Interestingly, these obscuration events are often associated with UV broad absorption-lines (Kriss et al. 2019). They may therefore represent the shielding from the nuclear radiation required by theoretical models of radiatively driven accretion-disk winds in Broad Absorption Line (BAL) QSOs (Proga & Kallman 2004, e.g.). These obscurers are also found to be sometimes associated with highly ionized outflows (Mehdipour et al. 2017), outflowing at velocities that can be even relativistic as in the case of UFOs Nardini et al. 2015.

2.2 The torus
The standard Unified Model (Antonucci 1993; Urry & Padovani 1995) postulated the presence of a circumnuclear dusty medium on parsec scales (see Fig. 3). This was soon confirmed by near-IR studies, with the evidence for very hot dust, close to the sublimation temperature, in the nuclei of Seyfert galaxies (Storchi-Bergmann et al. 1992; Alonso-Herrero et al. 2001). Subsequent extensive reverberation1717 17 Reverberation mapping is a technique to determine the time-lag (hence the distance) between the continuum variability and that of reprocessed components from circumnuclear matter, such as dust re-emission from the torus or line emission from photoionized gas like the BLR. observational campaigns (Suganuma et al. 2006) confirmed the expected dependence of the sublimation radius, which lies indeed at sub-parsec scales for local Seyfert galaxies, and on parsec scales for higher-luminosity quasars. The near-IR observations also estimated a high covering factor for the circumnuclear dusty medium (Maiolino et al. 2007; Treister et al. 2008, exceeding 0.8:), thus in overall agreement with the observed type 2/type 1 ratio (Maiolino & Rieke 1995).
The circumnuclear medium on parsec scales was effectively imaged by radio observations. Very Long Baseline Array (VLBA1818 18 https://science.nrao.edu/facilities/vlba) water maser1919 19 Water maser emission is due to a rotational transition in the H2O molecule at 22 GHz, and traces high density ( cm-3) and warm ( K) gas. images at sub-parsec resolution revealed a rotating warped disk in NGC 1068 (Greenhill et al. 1996). Similar structures were obtained for other AGN (Greenhill et al. 1997; Kondratko et al. 2008). VLBA images of the continuum radio emission of NGC 1068 further showed two symmetric radio free-free blobs at a radius of 0.3 pc with respect to the non-thermal nuclear emission, which was interpreted as the inner ionized edge of the obscuring torus (Gallimore et al. 1997). Further details were provided by ALMA2020 20 https://www.almaobservatory.org high-resolution submillimeter images, which revealed a compact, parsec-scale, gas component characterized by non-circular motions and enhanced turbulence (García-Burillo et al. 2016). Interestingly, the torus appears to have a physical and dynamical connection with the circumnuclear disk of the galaxy, a characteristic found in ALMA images of other AGN (Combes et al. 2019).
Dust can be also imaged via mid-IR interferometry. This was achieved for the first time in 2004 for NGC 1068 (Jaffe et al. 2004), and later refined by Raban et al. 2009. They found that the dusty torus in this source has two components: a compact (0.5 pc thick), elongated hot ( K) component, coincident with the nuclear water maser; and an extended (3-4 pc), but less elongated colder ( K) component. Similar results were found, with the same technique, for Circinus (Tristram et al. 2007) and for a type 1 object, NGC 4151 (Burtscher et al. 2009). Indeed, when larger samples are taken into account, no significant differences are found between type 1 and 2 sources, with the size of the dusty emitter scaling as the square root of the luminosity, as previously stated (Tristram & Schartmann 2011; Kishimoto et al. 2011). Combining radiative transfer modelling of the interferometric data with the study of the shape of the SED, there is now an emerging picture of a two-component structure: an equatorial thin disk and an extended feature along the polar direction probably originating from a dusty wind (Hönig & Kishimoto 2017, e.g.). In general, the IR observational properties of the dusty pc-scale torus are better explained by a clumpy structure (Nenkova et al. 2002; Elitzur & Shlosman 2006), since a compact uniform torus can hardly reproduce the broad IR SED, which requires dust at multiple temperature (Pier & Krolik 1992). A complex structure for the central hot and warm dust in the torus of NGC 1068 was confirmed by a recent mid-IR spectro-interferometric MATISSE observation at VLTI2121 21 https://www.eso.org/sci/facilities/paranal/telescopes/vlti.html, in an overall good agreement with the expectations from the original Unification Model (Gámez Rosas et al. 2022).
Strong clues in favour of the ubiquitous presence of Compton-thick neutral material come also from the X-ray spectra of local Seyfert galaxies, which invariably show an iron K line and a Compton reflection component (Perola et al. 2002; Bianchi et al. 2004; Bianchi et al. 2008b, e.g.). Its covering factor is far from being universal and varies significantly from source to source (Marchesi et al. 2019, e.g.), with a clear trend of being smaller at increasing luminosity (Bianchi et al. 2007b). These components prevalently arise at least on parsec scales, as the standard torus envisaged in the Unification Models, since they generally lack any variability. Indeed, Compton-thick sources have X-ray spectra which are completely dominated by these ‘reflection’ features, and they typically do not vary at all, even on long timescales. This is particularly evident in those ‘changing-look’ AGN which can be interpreted as sources whose central engine shuts off, leaving a constant reflection component (including the Fe K line) unaffected for years (Gilli et al. 2000; Matt et al. 2003).
However, it was recently found that the absorption in the archetypal Compton-thick source, NGC 1068, does vary, allowing the intrinsic emission of this buried AGN to pierce through, for the first time, during unveiling events Marinucci et al. 2016; Zaino et al. 2020. The measured timescales for such events are compatible with obscuration at the inner part of the torus, close to the sublimation radius, and further suggest a clumpy structure.
Indeed, X-ray variability studies hold the potential to infer the geometry and distance of the torus. However, accurate X-ray reverberation analysis of the iron line and the Compton reflection component, with respect to the intrinsic variability of the primary continuum, is hampered by the limitations of current X-ray missions. To date, the only successful experiment was performed on NGC 4151, allowing Zoghbi et al. 2019 to derive an origin for the ‘narrow’ core of the Fe K in the inner BLR (Fig. 6). Future high-throughput X-ray telescopes, assisted by large field-of-view monitoring, would represent a breakthrough in this respect (see e.g. this science case described in in ’t Zand et al. 2018, for eXTP).

Further clues come from the Fe K line profile. A narrow core of this line is ubiquitous, at least in local Seyfert galaxies (Bianchi et al. 2008b), and is typically unresolved (with upper limits of several thousands km/s for its FWHM), suggesting an origin at least in the BLR, or farther away. Although current X-ray satellites generally allows for separating the component originating in the accretion disk, being extremely broadened by strong gravity effects when present in the spectra (de la Calle Pérez et al. 2010; Nandra et al. 2007, see e.g.), the unresolved core generally leads to inconclusive estimates on its location (Nandra 2006; Shu et al. 2011, see e.g.). An exception is represented by the case of NGC 7213, which has been tested with simultaneous optical and X-ray observations. The iron line width in this source was resolved by the Chandra2222 22 https://chandra.harvard.edu/ High-Energy Transmission Grating, and found to be in perfect agreement with that measured for the broad H (Bianchi et al. 2008a). This suggests a common origin in the BLR, as further strengthened by the lack of a Compton-reflection component in this source, expected instead from a Compton-thick torus (Bianchi et al. 2003; Bianchi et al. 2004). Micro-calorimeters, as those onboard XRISM2323 23 https://heasarc.gsfc.nasa.gov/docs/xrism/ and Athena, will revolutionize this kind of analysis, allowing us for the first time to deconvolve the different components of the iron line. For example, it will be possible to separate the contributions from the torus, the NLR and the BLR, giving an unprecedented map of the circumnuclear gas in AGN (Cappi et al. 2013).
2.3 Beyond the torus up to the host galaxy
Soon after the advent of high-resolution X-ray imaging with Chandra, the soft X-ray emission of obscured Seyfert galaxy was found to be extended on at least hundreds of pc, with a remarkable morphological similarity with the optical NLR (Young et al. 2001; Bianchi et al. 2006; Levenson et al. 2006; Fabbiano et al. 2018, e.g.). At the same time, high resolution X-ray spectroscopy, thanks to the gratings onboard XMM-Newton2424 24 https://www.cosmos.esa.int/web/xmm-newton and Chandra, discovered that this emission is dominated by emission lines from a photoionized gas (Sako et al. 2000; Kinkhabwala et al. 2002; Guainazzi & Bianchi 2007, e.g.) (see left panel of Fig. 7). Optical and X-ray emission lines trace quite different ionization states of the gas, so their spatial overlap requires low and high-density components to co-exist in the NLR. This may be produced by classic thermal instabilities, whereas the same thermal pressure allows the high-density low-temperature gas to be confined by low-density high-temperature gas (Krolik et al. 1981). However, it was shown that this is instead an unavoidable consequence of the effect of radiation pressure, which compresses the gas in the illuminated cloud (a mechanism known as Radiation Pressure Compression (RPC): Stern et al. 2014, and references therein). This scenario predicts a well-defined and universal density and ionization distribution for the NLR, which was nicely confirmed by the observed Differential Emission Measure (DEM) distribution (i.e. the contributions of each ionization zone to the total line flux) for the soft X-ray emission of a sample of obscured AGN (Bianchi et al. 2019a) (see right panel of Fig. 7).


Interestingly, an RPC wind well reproduces also the ionization distribution observed in the so-called “warm absorbers” (Stern et al. 2014; Goosmann et al. 2016). More than half of nearby Seyfert 1 galaxies show absorption from a photoionized gas, with a large range in ionization state, column density and outflow velocity (Blustin et al. 2005, e.g.). When a distance can be estimated for their location (i.e. via variability studies), typical warm absorbers are consistent with an origin in the NLR or the outer torus (Kaastra et al. 2012, e.g.). Indeed, a possible origin for this wind is via thermal evaporation of the torus (Krolik & Kriss 2001), although many other alternatives have been proposed (Contopoulos & Lovelace 1994; Proga et al. 2000, e.g.).
High-resolution HST images directly showed that dust lanes at distances of hundred of parsecs are commonly found in Seyfert galaxies (Malkan et al. 1998), partially obscuring the NLR itself. In some cases, the dust-lanes coincide with X-ray obscuration of the soft X-ray emission from the NLR (Bianchi et al. 2007a, e.g.). Large distributions of gas at pc from the AGN are also imaged in interferometric maps of the molecular gas, certainly contributing to the obscuration of the active nucleus (Schinnerer et al. 2000; Krips et al. 2011, e.g.). It was soon realized that optically selected AGN samples generally avoid edge-on systems, a clear sign that the host galaxy itself provides obscuration on 100 pc scales (Maiolino & Rieke 1995; Lagos et al. 2011). Indeed, low column densities are often in agreement with the optical reddening associated with the host galaxy, and this must be taken into account in a more generalized Unification Model (Maiolino & Rieke 1995; Matt 2000; Bianchi et al. 2009, see e.g.). However, in general, the presence of these structures may not be physically responsible for the obscuration of the nucleus, but it appears to be correlated with Compton-thin X-ray obscuration (Guainazzi et al. 2005). Recent IR/optical dust maps confirm that dust lanes and filaments, similar to what is seen in the Milky Way, are present in both Type 1 and Type 2 objects, but only in the latter objects they cross the nucleus with enough optical depth to fully obscure it (Prieto et al. 2021).
In any case, a word of caution is needed for the amount of obscuring gas on large scales. Indeed, it was shown that the high covering factor needed to explain the observed Compton-thick sources significantly limits the presence of Compton-thick gas at distances of 100 pc, in order not to exceed the dynamical mass in that region (Risaliti et al. 1999). An obvious consequence of this requirement is that most of the ubiquitous narrow neutral iron K line and X-ray Compton reflection component should originate from a compact region. However, these components are seen extending up to kpc in NGC 1068 (Young et al. 2001), and this seems to be common whenever high-quality Chandra data are available (Marinucci et al. 2013; Marinucci et al. 2017; Fabbiano et al. 2017; Jones et al. 2021, e.g.). Indeed, these extended components appear to be consistent with an origin in a Compton-thin gas, possibly X-ray dissociated dense molecular clouds of the host galaxy (e.g. Ma et al. 2020, and references therein).
3 AGN demography and evolution in the X-ray and -ray bands
The study of the evolution of the number density and luminosity of the AGN population has been a topic of interest since the 1960’s. Providing a complete census of AGN over cosmic time is a critical tool to understand how accretion onto SMBHs evolves and also the role these may have in the evolution of their own host galaxies. However, in order to achieve a complete AGN census it is crucial to be able to observe also obscured AGN, which may be efficiently done in the X-ray and -ray bands, as described in the following.
3.1 X-ray band
X-ray observations are one of the most reliable and complete methods for selecting AGN. They are reliable because the X-ray emission from other astrophysical processes is usually weak in comparison. They are complete due to the ability of X-ray photons, especially above a few keV, to penetrate through absorbing material. In fact, the deepest X-ray surveys performed with the Chandra and XMM-Newton satellites reached the highest sky density of detected AGN: 23,900 deg-2 (e.g. Luo et al. 2017, see also Fig. 2).
The study of the X-ray Luminosity Function (XLF) has been a primary tool since the discovery of AGN to trace how the density of such objects changes as a function of luminosity and redshift. Combining large area shallow X-ray surveys (e.g. ROSAT2525 25 https://www.mpe.mpg.de/ROSAT and ASCA 2626 26 https://www.isas.jaxa.jp/en/missions/spacecraft/past/asca.html) with deep pencil beam ones (e.g. Chandra and XMM-Newton) several authors have studied how the shape and normalization of the XLF changes with luminosity and redshift. Many studies found that the overall XLF at z is well described by a so-called luminosity dependent density evolution (LDDE) model (Miyaji et al. 2000; Ueda et al. 2003; Hasinger et al. 2005; Silverman et al. 2008; Ebrero et al. 2009; Ueda et al. 2014, e.g.). In this model the shape of the XLF changes with redshift, with the faint-end slope flattening as redshift increases. This is a combination of the “classic” pure luminosity and pure density evolution models, in which only the luminosity and the number density of sources changes with redshift, respectively. On the other hand, Aird et al. 2015 modelled separately the XLF for unobscured and obscured AGN in the same redshifts range and found that a so-called flexible double power-law (FDPL) model is able to reproduce the evolution of the shape of the XLF. This schema models the XLF as a double power-law but allows for arbitrary evolution in the overall luminosity, density or shape of the function. A common feature of all these studies is the clear presence of a strong luminosity evolution: higher luminosity AGN peak, in terms of their space density, at higher redshifts than lower luminosity objects (Fig. 8 left panel). The underlying driver of such evolution could be a change in the mass distributions of accreting SMBHs: at earlier cosmic times SMBHs with higher masses are accreting, while the accretion moves to lower mass SMBHs going to lower redshifts. Another important finding is that the normalization of the XLF changes significantly with redshift: it increases between z and z and decreases afterwards. The rise of the number density of accreating SMBHs could be a consequence of the increase in molecular gas content in galaxies at earlier cosmic epochs (e.g. Tacconi et al. 2020, for a recent review) which could also be the main driver of the peak in star-formation density at z (Madau & Dickinson 2014, e.g.). A particularly interesting, but challenging, task is to quantify the evolution of the accreting SMBH populations at high redshift. Using the deepest available Chandra surveys, Vito et al. 2018 confirmed the overall decline of the AGN population beyond redshifts z and, interestingly, seem to find a steeper decline for the low-luminosity population compared to the decline in galaxies density. Still, the overall density of low-luminosity AGN, especially at z, is very poorly constrained. Future X-ray missions like Athena and Lynx2727 27 https://www.lynxobservatory.com/, thanks to their larger collecting area, will be able to detect statistically significant samples of low-luminosity AGN at these high redshifts. Complementing these future X-ray surveys with spectroscopic follow-up campaigns with Extremely Large Telescopes (ELT2828 28 https://elt.eso.org, TMT2929 29 https://www.tmt.org, GMT3030 30 https://www.gmto.org) or dedicated wide field spectroscopic facilities from the ground will provide redshifts, black hole masses and host galaxy properties, and finally allow us to place stronger constraints on the accretion history of SMBH at these early epochs.
As also discussed in the previous sections, obscuration both on nuclear and galactic scales can affect a significant fraction of the accretion history on SMBHs. Between the variety of methods used to identify obscured AGNs (e.g. Hickox & Alexander 2018, for a recent review) X-ray surveys are one of the most complete. Since the impact of obscuration is a function of energy, with low-energy X-ray photons being more affected than high-energy ones, X-ray satellites sensitive to energies above keV (e.g. Integral3131 31 https://sci.esa.int/web/integral/, Swift-BAT3232 32 https://swift.gsfc.nasa.gov, NuSTAR3333 33 https://www.nustar.caltech.edu) are more effective in detecting heavily obscured AGN than satellites mostly sensitive to softer energy bands (e.g. Chandra, XMM-Newton). This is attenuated moving to higher redshifts since also in the observed keV band we would be sampling harder rest-frame X-ray photons. Several X-ray (but also at other wavelengths) studies have found a significant dependence of the obscured AGN fraction with luminosity (Hasinger 2008; Ueda et al. 2014; Merloni et al. 2014; Aird et al. 2015; Mateos et al. 2017, e.g.). For example, Merloni et al. 2014 reported that the fraction of X-ray obscured (N cm-2) AGN goes from at L erg s-1 down to at L erg s-1. A possible interpretation of this trend could be connected with the ability of the most powerful AGN to release an increasing radiation and momentum in the surrounding medium and effectively decrease the obscuration of the central source. A redshift dependence of the obscured fraction of AGN was originally more controversial, but it is now generally confirmed (La Franca et al. 2005; Hasinger 2008; Aird et al. 2015; Ananna et al. 2019, e.g.). The fraction of obscured objects increases going to earlier epochs, which is consistent, and plausibly correlated, with the increase of the gas fraction in galaxies (e.g. Tacconi et al. 2020, for a recent review). Finally, particularly challenging is the ability to quantify the fraction of Compton-thick AGN. The most stringent constraints, especially at low redshift, have been obtained with hard X-ray telescopes (e.g. Swift/BAT, NuSTAR) which returned a Compton-thick fraction around (Burlon et al. 2011; Ricci et al. 2015; Lansbury et al. 2017, Fig. 8 right panel). This fraction should be still considered a lower limit on the intrinsic population of Compton-thick. Further improvement will be provided from additional NuSTAR observations, as well as a future more sensitive hard X-ray mission (e.g. the High-Energy X-ray Probe study).


3.2 -ray band
AGN evolution in the -rays is driven by blazars, which totally dominate the -ray sky (Sect. 1.2). Blazar evolution has been studied in the Fermi band (50 MeV – 1 TeV) but not at higher energies. This is due to the fact that TeV-selected flux-limited samples are not available because of the lack of sensitive blind surveys due to the narrow field of views and limited sensitivities of IACTs (Sect. 1.2). Moreover, observations of TeV blazars are often triggered by flaring states and therefore the measured TeV fluxes do not represent the typical condition of the sources. Therefore, our knowledge of blazar very high energy -ray emission is very biased and patchy. The Cherenkov Telescope Array3434 34 https://www.cta-observatory.org/ will adopt a systematic approach and will detect approximately 10 times more sources reaching also higher energies.
The samples put together using Fermi Large Area Telescope (LAT) catalogues have been used to determine the population properties of blazars, i.e., their -ray number counts, luminosity function, and cosmological evolution. The main results of this work are the following: 1. the evolution of -ray selected blazars is very strong and has been modelled as primarily luminosity evolution (PLE), primarily density evolution (PDE), and LDDE Ajello et al. 2015. As the names suggest, although in all models the sources experience both luminosity and (number) density evolution, the former and the latter are the dominant one in PLE and PDE, respectively; 2. the latest Fermi-LAT number count distribution of extragalactic sources (at ) show that PDE is the model that best describes the evolutionary properties of the blazar population and that blazars account for of the total extragalactic -ray background (EGB). This includes -ray emission from resolved and unresolved extragalactic sources, such as blazars, star-forming galaxies and radio galaxies, as well as radiation from truly diffuse processes, above 100 MeV Marcotulli et al. 2020. Hard -ray spectrum sources, i.e., HBLs, are actually responsible for most of the EGB emission above 100 GeV Ajello et al. 2015; 3. when considering only BL Lacs, however, a somewhat complex picture emerges, with luminous ( erg s-1) objects evolving as strongly as FSRQs while less luminous BL Lacs evolve less until they evolve negatively, i.e. their luminosity and/or density decreases with redshift, for erg s-1. Once the sample is subdivided into HBLs, IBLs, and LBLs, it turns out that the negative evolution is confined to HBLs, whose number density increases for Ajello et al. 2012; Ajello et al. 2014. This confirms previous results derived in other bands on the puzzling negative evolution of HBLs (e.g., Giommi et al. 1999). Given the much larger Fermi-LAT samples available now Ajello et al. 2020a; Fermi-LAT collaboration et al. 2022, it would be useful to re-do these studies with a much larger statistics.
References
- Abdo et al. (2010) Abdo A. A., et al., 2010, Astrophys J , 716, 30
- Abdollahi et al. (2020) Abdollahi S., et al., 2020, Astrophys J Suppl , 247, 33
- Aharonian (2000) Aharonian F. A., 2000, New Astr , 5, 377
- Aird et al. (2015) Aird J., Coil A. L., Georgakakis A., Nandra K., Barro G., Pérez-González P. G., 2015, MNRAS , 451, 1892
- Ajello et al. (2012) Ajello M., et al., 2012, Astrophys J , 751, 108
- Ajello et al. (2014) Ajello M., et al., 2014, Astrophys J , 780, 73
- Ajello et al. (2015) Ajello M., et al., 2015, Astrophys J Lett , 800, L27
- Ajello et al. (2020a) Ajello M., et al., 2020a, Astrophys J , 892, 105
- Ajello et al. (2020b) Ajello M., Di Mauro M., Paliya V. S., Garrappa S., 2020b, Astrophys J , 894, 88
- Ajello et al. (2021) Ajello M., et al., 2021, Astrophys J , 921, 144
- Alonso-Herrero et al. (2001) Alonso-Herrero A., Quillen A. C., Simpson C., Efstathiou A., Ward M. J., 2001, Astronom J , 121, 1369
- Ananna et al. (2019) Ananna T. T., et al., 2019, Astrophys J , 871, 240
- Antonucci (1993) Antonucci R., 1993, Annu Rev Astron Astr , 31, 473
- Arav et al. (1998) Arav N., Barlow T. A., Laor A., Sargent W. L., Blandford R. D., 1998, MNRAS , 297, 990
- Barvainis (1987) Barvainis R., 1987, Astrophys J , 320, 537
- Bentz et al. (2013) Bentz M. C., et al., 2013, Astrophys J , 767, 149
- Bianchi et al. (2003) Bianchi S., Matt G., Balestra I., Perola G. C., 2003, Astron Astrophys , 407, L21
- Bianchi et al. (2004) Bianchi S., Matt G., Balestra I., Guainazzi M., Perola G. C., 2004, Astron Astrophys , 422, 65
- Bianchi et al. (2006) Bianchi S., Guainazzi M., Chiaberge M., 2006, Astron Astrophys , 448, 499
- Bianchi et al. (2007a) Bianchi S., Chiaberge M., Piconcelli E., Guainazzi M., 2007a, MNRAS , 374, 697
- Bianchi et al. (2007b) Bianchi S., Guainazzi M., Matt G., Fonseca Bonilla N., 2007b, Astron Astrophys , 467, L19
- Bianchi et al. (2008a) Bianchi S., La Franca F., Matt G., Guainazzi M., Jimenez Bailón E., Longinotti A. L., Nicastro F., Pentericci L., 2008a, MNRAS , 389, L52
- Bianchi et al. (2008b) Bianchi S., Guainazzi M., Matt G., Bonilla N. F., Ponti G., 2008b, Astron Astrophys , 495, 421
- Bianchi et al. (2009) Bianchi S., Piconcelli E., Chiaberge M., Jimenez Bailón E., Matt G., Fiore F., 2009, Astrophys J , 695, 781
- Bianchi et al. (2010) Bianchi S., Chiaberge M., Evans D. A., Guainazzi M., Baldi R. D., Matt G., Piconcelli E., 2010, MNRAS , 405, 553
- Bianchi et al. (2012) Bianchi S., et al., 2012, MNRAS , 426, 3225
- Bianchi et al. (2019a) Bianchi S., Guainazzi M., Laor A., Stern J., Behar E., 2019a, MNRAS , 485, 416
- Bianchi et al. (2019b) Bianchi S., et al., 2019b, MNRAS , 488, L1
- Biteau et al. (2020) Biteau J., et al., 2020, Nature Astronomy, 4, 124
- Blustin et al. (2005) Blustin A. J., Page M. J., Fuerst S. V., Branduardi-Raymont G., Ashton C. E., 2005, Astron Astrophys , 431, 111
- Brandt & Alexander (2015) Brandt W. N., Alexander D. M., 2015, Astron Astrophys Rev , 23, 1
- Burlon et al. (2011) Burlon D., Ajello M., Greiner J., Comastri A., Merloni A., Gehrels N., 2011, Astrophys J , 728, 58
- Burtscher et al. (2009) Burtscher L., Jaffe W., Raban D., Meisenheimer K., Tristram K. R., Röttgering H., 2009, Astrophys J , 705, 53
- Cappi et al. (2013) Cappi M., et al., 2013
- Cerruti (2020) Cerruti M., 2020, Galaxies, 8, 72
- Combes et al. (2019) Combes F., et al., 2019, Astron Astrophys , 623, A79
- Condon et al. (2013) Condon J. J., Kellermann K. I., Kimball A. E., Ivezić Ž., Perley R. A., 2013, Astrophys J , 768, 37
- Contopoulos & Lovelace (1994) Contopoulos J., Lovelace R. V. E., 1994, Astrophys J , 429, 139
- D’Onofrio et al. (2012) D’Onofrio M., Marziani P., Sulentic J. W., 2012, Fifty Years of Quasars. Vol. 386, doi:10.1007/978-3-642-27564-7,
- Delvecchio et al. (2017) Delvecchio I., et al., 2017, Astron Astrophys , 602, A3
- Ebrero et al. (2009) Ebrero J., et al., 2009, Astron Astrophys , 493, 55
- Elitzur & Shlosman (2006) Elitzur M., Shlosman I., 2006, Astrophys J , 648, L101
- Elvis et al. (1994) Elvis M., et al., 1994, Astrophys J Suppl , 95, 1
- Elvis et al. (2004) Elvis M., Risaliti G., Nicastro F., Miller J. M., Fiore F., Puccetti S., 2004, Astrophys J , 615, L25
- Fabbiano et al. (2017) Fabbiano G., Elvis M., Paggi A., Karovska M., Maksym W. P., Raymond J., Risaliti G., Wang J., 2017, Astrophys J , 842, L4
- Fabbiano et al. (2018) Fabbiano G., Paggi A., Karovska M., Elvis M., Maksym W. P., Wang J., 2018, eprint arXiv:1808.06985
- Fanaroff & Riley (1974) Fanaroff B. L., Riley J. M., 1974, MNRAS , 167, 31P
- Fermi-LAT collaboration et al. (2022) Fermi-LAT collaboration et al., 2022, arXiv e-prints, p. arXiv:2201.11184
- Gallimore et al. (1997) Gallimore J. F., Baum S. A., O’Dea C. P., 1997, Nature, 388, 852
- Gámez Rosas et al. (2022) Gámez Rosas V., et al., 2022, Nature , 602, 403
- García-Burillo et al. (2016) García-Burillo S., et al., 2016, Astrophys J , 823, L12
- Gilli et al. (2000) Gilli R., Maiolino R., Marconi A., Risaliti G., Dadina M., Weaver K. A., Colbert E. J. M., 2000, Astron Astrophys , 355, 485
- Giommi & Padovani (2021) Giommi P., Padovani P., 2021, Universe, 7, 492
- Giommi et al. (1999) Giommi P., Menna M. T., Padovani P., 1999, MNRAS , 310, 465
- Giommi et al. (2020) Giommi P., Glauch T., Padovani P., Resconi E., Turcati A., Chang Y. L., 2020, MNRAS , 497, 865
- Goosmann et al. (2016) Goosmann R. W., Holczer T., Mouchet M., Dumont A. M., Behar E., Godet O., Goncalves A. C., Kaspi S., 2016, Astron Astrophys , 589, 1
- Greenhill et al. (1996) Greenhill L. J., Gwinn C. R., Antonucci R., Barvainis R., 1996, Astrophys J , 472, L21
- Greenhill et al. (1997) Greenhill L. J., Moran J. M., Herrnstein J. R., 1997, Astrophys J , 481, L23
- Guainazzi & Bianchi (2007) Guainazzi M., Bianchi S., 2007, MNRAS , 374, 1290
- Guainazzi et al. (2005) Guainazzi M., Matt G., Perola G. C., 2005, Astron. Astrophys. Vol. 444, Issue 1, December II 2005, pp.119-132, 444, 119
- Hasinger (2008) Hasinger G., 2008, Astron Astrophys , 490, 905
- Hasinger et al. (2005) Hasinger G., Miyaji T., Schmidt M., 2005, Astron Astrophys , 441, 417
- Heckman & Best (2014) Heckman T. M., Best P. N., 2014, Annu Rev Astron Astr , 52, 589
- Hickox & Alexander (2018) Hickox R. C., Alexander D. M., 2018, Annu Rev Astron Astr , 56, 625
- Hönig & Kishimoto (2017) Hönig S. F., Kishimoto M., 2017, Astrophys J , 838, L20
- IceCube Collaboration (2018) IceCube Collaboration 2018, Science, 361, 147
- IceCube Collaboration et al. (2018) IceCube Collaboration et al. 2018, Science, 361, eaat1378
- Jaffe et al. (2004) Jaffe W., et al., 2004, Nature, 429, 47
- Jones et al. (2021) Jones M. L., et al., 2021, Astrophys J , 910, 19
- Kaastra et al. (2012) Kaastra J. S., et al., 2012, Astron Astrophys , 539, 17
- Kaastra et al. (2014) Kaastra J. S., et al., 2014, Science (80-. )., pp science.1253787–
- Kellermann (2015) Kellermann K. I., 2015, in Massaro F., Cheung C. C., Lopez E., Siemiginowska A., eds, Vol. 313, Extragalactic Jets from Every Angle. pp 190–195 (arXiv:1412.7867), doi:10.1017/S1743921315002185
- King & Pounds (2015) King A., Pounds K., 2015, Annu Rev Astron Astr , 53, 115
- Kinkhabwala et al. (2002) Kinkhabwala A., et al., 2002, Astrophys J , 575, 732
- Kishimoto et al. (2011) Kishimoto M., Hönig S. F., Antonucci R., Barvainis R., Kotani T., Tristram K. R., Weigelt G., Levin K., 2011, Astron Astrophys , 527, 121
- Kondratko et al. (2008) Kondratko P. T., Greenhill L. J., Moran J. M., 2008, Astrophys J , 678, 87
- Krips et al. (2011) Krips M., et al., 2011, Astrophys J , 736, 37
- Kriss et al. (2019) Kriss G. A., et al., 2019, Astron Astrophys , 621, A12
- Krolik & Kriss (2001) Krolik J. H., Kriss G. A., 2001, Astrophys J , 561, 684
- Krolik et al. (1981) Krolik J. H., McKee C. F., Tarter C. B., 1981, Astrophys J , 249, 422
- La Franca et al. (2005) La Franca F., et al., 2005, Astrophys J , 635, 864
- Lagos et al. (2011) Lagos C. d. P., Padilla N. D., Strauss M. A., Cora S. A., Hao L., 2011, MNRAS , 414, 2148
- Lamastra et al. (2017) Lamastra A., Menci N., Fiore F., Antonelli L. A., Colafrancesco S., Guetta D., Stamerra A., 2017, Astron. Astrophys., 607, A18
- Lansbury et al. (2017) Lansbury G. B., et al., 2017, Astrophys J , 846, 20
- Laor (2003) Laor A., 2003, Astrophys J , 590, 86
- Laor & Draine (1993) Laor A., Draine B. T., 1993, Astrophys J , 402, 441
- Levenson et al. (2006) Levenson N. A., Heckman T. M., Krolik J. H., Weaver K. A., ycki P. T., 2006, Astrophys J , 648, 111
- Liu et al. (2018) Liu R.-Y., Murase K., Inoue S., Ge C., Wang X.-Y., 2018, Astrophys J , 858, 9
- Luo et al. (2017) Luo B., et al., 2017, Astrophys J Suppl , 228, 2
- Ma et al. (2020) Ma J., Elvis M., Fabbiano G., Baloković M., Maksym W. P., Jones M. L., Risaliti G., 2020, Astrophys J , 900, 164
- Maccacaro et al. (1982) Maccacaro T., Perola G. C., Elvis M., 1982, Astrophys J , 257, 47
- Madau & Dickinson (2014) Madau P., Dickinson M., 2014, Annu Rev Astron Astr , 52, 415
- Maiolino & Rieke (1995) Maiolino R., Rieke G. H., 1995, Astrophys J , 454, 95
- Maiolino et al. (2001) Maiolino R., Marconi A., Salvati M., Risaliti G., Severgnini P., Oliva E., La Franca F., Vanzi L., 2001, Astron Astrophys , 365, 28
- Maiolino et al. (2007) Maiolino R., Shemmer O., Imanishi M., Netzer H., Oliva E., Lutz D., Sturm E., 2007, Astron Astrophys , 468, 979
- Maiolino et al. (2010) Maiolino R., et al., 2010, Astron Astrophys , 517, 47
- Malkan et al. (1998) Malkan M. A., Gorjian V., Tam R., 1998, Astrophys J Suppl , 117, 25
- Mannheim (1993) Mannheim K., 1993, Astron Astrophys , 269, 67
- Maraschi et al. (1992) Maraschi L., Ghisellini G., Celotti A., 1992, Astrophys J Lett , 397, L5
- Marchesi et al. (2019) Marchesi S., et al., 2019, Astrophys J , 872, 8
- Marcotulli et al. (2020) Marcotulli L., Di Mauro M., Ajello M., 2020, Astrophys J , 896, 6
- Marinucci et al. (2013) Marinucci A., Miniutti G., Bianchi S., Matt G., Risaliti G., 2013, MNRAS , 436, 2500
- Marinucci et al. (2016) Marinucci A., et al., 2016, MNRAS , 456, L94
- Marinucci et al. (2017) Marinucci A., Bianchi S., Fabbiano G., Matt G., Risaliti G., Nardini E., Wang J., 2017, MNRAS , 470, 4039
- Markowitz et al. (2014) Markowitz A. G., Krumpe M., Nikutta R., 2014, MNRAS , 439, 1403
- Mateos et al. (2017) Mateos S., et al., 2017, Astrophys J Lett , 841, L18
- Matt (2000) Matt G., 2000, Astron Astrophys , 355
- Matt et al. (2003) Matt G., Bianchi S., Guainazzi M., Brandt W. N., Fabian A. C., Iwasawa K., Perola G. C., 2003, Astron Astrophys , 399, 519
- Mehdipour et al. (2017) Mehdipour M., et al., 2017, Astron Astrophys , 607, A28
- Merloni & Heinz (2013) Merloni A., Heinz S., 2013, Evolution of Active Galactic Nuclei. p. 503, doi:10.1007/978-94-007-5609-0_11
- Merloni et al. (2014) Merloni A., et al., 2014, MNRAS , 437, 3550
- Miyaji et al. (2000) Miyaji T., Hasinger G., Schmidt M., 2000, Astron Astrophys , 353, 25
- Nandra (2006) Nandra K., 2006, On the origin of the iron K line cores in active galactic nuclei, doi:10.1111/j.1745-3933.2006.00158.x
- Nandra et al. (2007) Nandra K., O’Neill P. M., George I. M., Reeves J. N., 2007, An XMM-Newton survey of broad iron lines in Seyfert galaxies, doi:10.1111/j.1365-2966.2007.12331.x
- Nardini et al. (2015) Nardini E., et al., 2015, Science (80-. )., 347, 860
- Nenkova et al. (2002) Nenkova M., Ivezić Ž., Elitzur M., 2002, Astrophys J , 570, L9
- Netzer (2015) Netzer H., 2015, Annu Rev Astron Astr , 53, 365
- Netzer & Laor (1993) Netzer H., Laor A., 1993, Astrophys J , 404, L51
- Nicastro (2002) Nicastro F., 2002, Astrophys J , 530, L65
- Osterbrock & Mathews (1986) Osterbrock D. E., Mathews W. G., 1986, Annu Rev Astron Astr , 24, 171
- Padovani (2016) Padovani P., 2016, Astron Astrophys Rev , 24, 13
- Padovani (2017) Padovani P., 2017, Nature Astronomy, 1, 0194
- Padovani & Giommi (1995) Padovani P., Giommi P., 1995, Astrophys J , 444, 567
- Padovani et al. (2017) Padovani P., et al., 2017, The Astronomy and Astrophysics Review, 25, 2
- Perola et al. (2002) Perola G. C., Matt G., Cappi M., Fiore F., Guainazzi M., Maraschi L., Petrucci P. O., Piro L., 2002, Astron Astrophys , 389, 802
- Pier & Krolik (1992) Pier E. A., Krolik J. H., 1992, Astrophys J , 399, L23
- Prieto et al. (2021) Prieto A., Nadolny J., Fernández-Ontiveros J. A., Mezcua M., 2021, MNRAS, 000, 1
- Proga & Kallman (2004) Proga D., Kallman T. R., 2004, Astrophys J , 616, 688
- Proga et al. (2000) Proga D., Stone J. M., Kallman T. R., 2000, Astrophys J , 543, 686
- Raban et al. (2009) Raban D., Jaffe W., Röttgering H., Meisenheimer K., Tristram K. R., 2009, MNRAS , 394, 1325
- Radcliffe et al. (2021) Radcliffe J. F., Barthel P. D., Garrett M. A., Beswick R. J., Thomson A. P., Muxlow T. W. B., 2021, Astron Astrophys , 649, L9
- Ramos Almeida & Ricci (2017) Ramos Almeida C., Ricci C., 2017, Nature Astronomy, 1, 679
- Ricci et al. (2015) Ricci C., Ueda Y., Koss M. J., Trakhtenbrot B., Bauer F. E., Gandhi P., 2015, Astrophys J Lett , 815, L13
- Richards et al. (2006) Richards G. T., et al., 2006, Astrophys J Suppl , 166, 470
- Risaliti et al. (1999) Risaliti G., Maiolino R., Salvati M., 1999, Astrophys J , 522, 157
- Risaliti et al. (2002) Risaliti G., Elvis M., Nicastro F., 2002, Astrophys J , 571, 234
- Risaliti et al. (2005) Risaliti G., Elvis M., Fabbiano G., Baldi A., Zezas A., 2005, Astrophys J , 623, L93
- Sako et al. (2000) Sako M., Kahn S. M., Paerels F., Liedahl D. A., 2000, Astrophys J , 542, 684
- Sarzi et al. (2010) Sarzi M., et al., 2010, MNRAS , 402, 2187
- Schinnerer et al. (2000) Schinnerer E., Eckart A., Tacconi L. J., Genzel R., Downes D., 2000, Astrophys J , 533, 850
- Schmidt (1963) Schmidt M., 1963, Nature , 197, 1040
- Shu et al. (2011) Shu X. W., Yaqoob T., Wang J. X., 2011, Astrophys J , 738, 147
- Silverman et al. (2008) Silverman J. D., et al., 2008, Astrophys J , 679, 118
- Stern et al. (2014) Stern J., Behar E., Laor A., Baskin A., Holczer T., 2014, MNRAS , 445, 3011
- Storchi-Bergmann et al. (1992) Storchi-Bergmann T., Mulchaey J. S., Wilson A. S., 1992, Astrophys J , 395, L73
- Suganuma et al. (2006) Suganuma M., et al., 2006, Astrophys J , 639, 46
- Tacconi et al. (2020) Tacconi L. J., Genzel R., Sternberg A., 2020, Annu Rev Astron Astr , 58, 157
- Tananbaum et al. (1979) Tananbaum H., et al., 1979, Astrophys J Lett , 234, L9
- Treister et al. (2008) Treister E., Krolik J. H., Dullemond C., 2008, Astrophys J , 679, 140
- Tristram & Schartmann (2011) Tristram K. R., Schartmann M., 2011, Astron Astrophys , 531, 99
- Tristram et al. (2007) Tristram K. R., et al., 2007, Astron Astrophys , 474, 837
- Ueda et al. (2003) Ueda Y., Akiyama M., Ohta K., Miyaji T., 2003, Astrophys J , 598, 886
- Ueda et al. (2014) Ueda Y., Akiyama M., Hasinger G., Miyaji T., Watson M. G., 2014, Astrophys J , 786, 104
- Ulrich et al. (1997) Ulrich M.-H., Maraschi L., Urry C. M., 1997, Annu Rev Astron Astr , 35, 445
- Urry & Padovani (1995) Urry C. M., Padovani P., 1995, Publications Astron Soc Pacific , 107, 803
- Vito et al. (2018) Vito F., et al., 2018, MNRAS , 473, 2378
- Wang et al. (2021) Wang F., et al., 2021, Astrophys J Lett , 907, L1
- Younes et al. (2012) Younes G., Porquet D., Sabra B., Reeves J. N., Grosso N., 2012, Astron Astrophys , 539, A104
- Young et al. (2001) Young A. J., Wilson A. S., Shopbell P. L., 2001, Astrophys J , 556, 6
- Yuan & Narayan (2014) Yuan F., Narayan R., 2014, Annu Rev Astron Astr , 52, 529
- Zaino et al. (2020) Zaino A., et al., 2020, MNRAS , 492, 3872
- Zoghbi et al. (2019) Zoghbi A., Miller J. M., Cackett E., 2019, Astrophys J , 884, 26
- de la Calle Pérez et al. (2010) de la Calle Pérez I., et al., 2010, Astron Astrophys , 524, A50
- in ’t Zand et al. (2018) in ’t Zand J. J. M., et al., 2018, Sci. China Physics, Mech. Astron. 2018 622, 62, 1