Forecasting from LiDAR via Future Object Detection
Abstract
Object detection and forecasting are fundamental components of embodied perception. These two problems, however, are largely studied in isolation by the community. In this paper, we propose an end-to-end approach for detection and motion forecasting based on raw sensor measurement as opposed to ground truth tracks. Instead of predicting the current frame locations and forecasting forward in time, we directly predict future object locations and backcast to determine where each trajectory began. Our approach not only improves overall accuracy compared to other modular or end-to-end baselines, it also prompts us to rethink the role of explicit tracking for embodied perception. Additionally, by linking future and current locations in a many-to-one manner, our approach is able to reason about multiple futures, a capability that was previously considered difficult for end-to-end approaches. We conduct extensive experiments on the popular nuScenes dataset and demonstrate the empirical effectiveness of our approach. In addition, we investigate the appropriateness of reusing standard forecasting metrics for an end-to-end setup, and find a number of limitations which allow us to build simple baselines to game these metrics. We address this issue with a novel set of joint forecasting and detection metrics that extend the commonly used AP metrics from the detection community to measuring forecasting accuracy. Our code is available on GitHub.
1 Introduction

Object detection and forecasting are fundamental components of embodied perception that are often studied independently. In this paper we rethink the methods and metrics for trajectory forecasting from LiDAR sensor data. Trajectory forecasting is a critical perception task for autonomous robot navigation, thus building meaningful evaluation metrics and robust methods is of utmost importance.
Traditional trajectory forecasting methods Caesar20CVPR; sun20CVPR; chang2019argoverse detect Shi19CVPR; shi20cvpr; shi20pami and track Weng20iros; weng20CVPR; kim21icra objects in 3D LiDAR scans to obtain past trajectories (Fig. 1a). These can be used in conjunction with auto-regressive forecasting methods salzmann2020eccv; ivanovic2018trajectron; Gupta18CVPR; Alahi16CVPR to estimate the future actions of surrounding agents. Recent efforts Luo18CVPR; liang2020pnpnet; Weng2021PTP streamline such multi-stage perception stacks and train multi-task neural networks to jointly detect, track and forecast object positions directly from raw sensor data (Fig. 1b). However, such end-to-end approaches tend to predict only a single future trajectory for each object, not accounting for future uncertainty. This is not surprising as estimating multiple futures is a significant challenge in forecasting, requiring machinery such as multiple-choice-loss bhattacharyya18cvpr or generative models Lee17CVPR; ivanovic2018trajectron; sadeghian2018sophie; kosaraju2019socialbigat; amirian2019social; Gupta18CVPR; dendorfer2021iccv; Dendorfer2020ACCV.
We rethink the forecasting task and propose FutureDet, an approach that reframes forecasting as the task of future object detection (Fig. 1c). Importantly, existing detectors yin2021center; Lang19CVPR; zhou2018voxelnet already learn to predict heatmaps that capture distributions over possible object locations. We re-purpose this machinery to represent possible future object states. To this end, we encode an accumulated sequence of past raw LiDAR scans using standard backbones for 3D LiDAR-based object detection and train our network to (i) detect objects multiple timesteps into the future and (ii) estimate trajectories for these future detections back in time (i.e., back-cast) to the current frame. By matching back-casted future detections to current detections in a many-to-one manner, our approach can represent a distribution over multiple plausible future states. Our extensive evaluation on the large-scale nuScenes Caesar20CVPR dataset for trajectory forecasting reveals that our proposed FutureDet outperforms state-of-the-art methods, without requiring object tracks or HD-maps as inputs to the model. We posit that tracking may emerge from our network (since tracking objects from accumulated past LiDAR scans may make them easier to forecast), similar to the emergence of tracking and forecasting in streaming perception streaming_li20eccv.
Furthermore, we investigate the utility of current metrics liang2020pnpnet; Weng2020SPF2 for evaluating forecasting directly from raw LiDAR data. We find that existing metrics are not well suited for the task of joint detection and forecasting, allowing them to be gamed by trivial forecasters. Current metrics for end-to-end LiDAR forecasting adapt trajectory-based forecasting metrics, such as average/final displacement error (ADE/FDE). These metrics were designed for evaluating forecasting in a setting where perfect tracks are given as input, and objects don’t have to be detected. However, these metrics don’t adapt well to the end-to-end setting. We demonstrate that such metrics can be gamed by baselines that simply rank all stationary objects (which are trivially easy to forecast) with high confidence, dramatically outperforming all prior art. Moreover, these evaluation metrics detach two inherently inter-connected tasks of detection and forecasting. Consequentially, they do not penalize false forecasts, i.e., forecasts that do not actually belong to any objects. In this sense, the end-to-end setup and evaluation is more realistic.
To address these short-comings, we rethink the evaluation procedure for joint object detection and forecasting directly from sensor data. Our key insight is that the versatile average precision (AP) metric, a gold standard for assessing object detection performance, can be generalized to the task of joint detection and forecasting. The key feature of our novel forecasting mAP is that a forecast is correct only if the object is both correctly detected and forecasted. Our forecasting mAP is then calculated by simply using the machinery of AP, but using this joint detection and forecasting definition of a true positive. Furthermore, our forecasting mAP can be extended to evaluating multiple-future forecasts for each object by simply evaluating w.r.t. the top- most confident forecasts per-detection. Our metric appropriately adapts forecasting metrics for end-to-end evaluation: forecasting mAP jointly assesses forecasting and detection, penalizing both missed forecasts as well as false forecasts. It assesses forecasting performance on the full set of object detections and embraces the inherent multi-future nature of forecasting.
Contributions: We (i) repurpose object detectors for the task of end-to-end trajectory forecasting and propose a model that can predict multiple forecasts for each current detection, (ii) rethink trajectory forecasting evaluation and show that detection and forecasting can be jointly evaluated using a generalization of well-accepted object detection metrics, and (iii) thoroughly analyze the performance of our model on the challenging nuScenes dataset caesar2020nuscenes, showing that it outperforms both previous end-to-end trainable methods and more traditional multi-stage approaches.
2 Related Work
Object Detection and Tracking. Due to recent advances in supervised deep learning Krizhevsky12NIPS and community efforts in dataset collection and benchmarking Geiger12CVPR; dendorfer20ijcv; sun20CVPR; Caesar20CVPR; behley2021ijrr, the research community has witnessed rapid improvement in LiDAR-based 3D object detection Lang19CVPR; Shi19CVPR; shi20cvpr; Qi17CVPR_frustum, tracking Weng20iros; yin2021center, and segmentation behley2021ijrr; aygun21cvpr; zhang20CVPR. Several methods Shi19CVPR; shi20cvpr follow a well-established two-stage object detection pipeline using point-cloud encoder backbones and a 3D variant of a region proposal network Ren15NIPS, or detect objects as points, followed by classification and bounding box regression yin2021center. Due to the sparsity of LiDAR point clouds, recent methods accumulate multiple scans over time to improve object detection Lang19CVPR; yin2021center and LiDAR panoptic segmentation performance aygun21cvpr. To understand how trajectories of detected objects evolve over time, multi-object tracking methods associate detections using Kalman filters Weng20iros, learned object descriptors weng20CVPR; Frossard18ICRA or regress frame-to-frame offsets zhou20ECCV; yin2021center, typically followed by greedy or combinatorial optimization to resolve ambiguous data association. The latter approach can be interpreted as a single frame forecast for track association. However, autonomous vehicles must account for likely future positions of surrounding agents at longer temporal horizons to safely navigate and avoid collisions in dynamic environments.
Trajectory Forecasting. Vision-based trajectory forecasting has been posed as the task of predicting future trajectories of agents, given perfect past trajectories and a top-down image (recorded e.g. using drones) as input pellegrini10eccv; lerner07cgf; Robicquet16eccv. Early physics-based models social_force explicitly model agent-agent and agent-environment interactions and have been successfully used to enhance object trackers yamaguchicvpr2011; Leal11ICCVW. Recent methods use auto-regressive data-driven models that leverage recurrent neural networks (RNNs) and encoder-decoder-based architectures to encode the past trajectory and estimate its evolution in future frames Alahi16CVPR. To deal with the inherent multi-modal nature of the problem, several methods leverage generative models goodfellow_gan; kingma14iclr to learn a distribution over future trajectories Lee17CVPR; ivanovic2018trajectron; sadeghian2018sophie; kosaraju2019socialbigat; amirian2019social; Gupta18CVPR; dendorfer2021iccv; Dendorfer2020ACCV. However, these methods and benchmarks tackle forecasting in idealized scenarios, in which the entire visual scene is directly observed, and perfect input trajectories are provided. Both are unrealistic assumptions in automotive and robotics applications. Due to the importance of forecasting for automotive path planning, recent large-scale automotive benchmarks sun20CVPR; Caesar20CVPR; chang2019argoverse explicitly focus on the trajectory forecasting task. Similar to vision-based methods, these benchmarks pose the forecasting problem as trajectory estimation given past trajectories and a high-definition map of the environment. These benchmarks have facillitated a wide suite of HD-map-based forecasting methods, which either represent the HD-map as rasterized images chai2019multipath; gilles2021home, graphs or vectors gao2020vectornet; liang2020learning; gu2021densetnt. However, both algorithms and the evaluation protocol make the unrealistic assumption that detection and tracking outputs are perfect.
Forecasting from Sensor Data. Prior methods Luo18CVPR; liang2020pnpnet; Weng2021PTP tackle object detection, tracking, and forecasting jointly by training a single convolutional neural network in a multi-task fashion from accumulated stacks of LiDAR sweeps. Alternatively, Weng2020SPF2 directly forecasts future LiDAR scans and leverages off-the-shelf LiDAR object detectors to detect objects in these forecasted scans. We believe that this approach of end-to-end joint detection and forecasting is a step in the right direction. However, none of the aforementioned end-to-end methods are able to reason about multiple future trajectories. To embrace the inherently uncertain future, we present an end-to-end forecasting model (Sec. 4) that simultaneously detects objects in the current and future timesteps given a history of LiDAR scans, anchoring multiple possible future detections to current scan detections. This approach not only outperforms the aforementioned methods w.r.t. forecasting accuracy but also allows for multiple future interpretations. Finally, we observe that ad-hoc adaptations of forecasting metrics Luo18CVPR; liang2020pnpnet; Weng2021PTP do not appropriately characterize certain types of forecasting errors. As a remedy, we propose a generalization of the average precision (AP) Everingham10IJCV metric for joint detection and forecasting in Sec. 3. Note that our adoption of AP is also inspired by the work of streaming perception streaming_li20eccv, where AP is used to measure the joint performance of 2D object detection, tracking, and short-term forecasting without considering multiple futures.
3 Rethinking Forecasting Evaluation
Since we are tackling the task of forecasting future positions of cars directly from LiDAR scans, we assume an observed sequence of past LiDAR sensor data, up to the most recent observation at time , as input. We pose joint object detection and forecasting as the task of estimating a set of object locations (parametrized as 3D cuboids) in the current scan as well as their future trajectory continuations in the future, unobserved scans i.e., .
3.1 Preliminaries
Prior work pellegrini10eccv; lerner07cgf; Robicquet16eccv; salzmann2020eccv; ivanovic2018trajectron; Gupta18CVPR; Alahi16CVPR presents forecasting as the task of estimating the “correct” continuation of a given ground-truth track. In particular, given past trajectory observations , the task is to estimate future positions for all agents present in the scene. This formalization is also adopted by recent automotive forecasting benchmarks Caesar20CVPR; sun20CVPR; chang2019argoverse. However, as the ego-vehicle is moving, methods are given high-definition (HD) maps of the surrounding environment and ego-vehicle positions to account for the geometry of the surroundings. First, we discuss existing metrics for forecasting evaluation.
ADE and FDE. Average displacement error (ADE) and final displacement error (FDE) are commonly used evaluation metrics for assessing trajectory prediction. Both are measured as the L2 distance between model predictions and ground truth trajectories . To account for the inherent uncertainty in trajectory continuation, methods are evaluated over the set of top-K model predictions (w.r.t. the confidence score of each predicted forecast). These metrics assume that the set of true positives are the same for all methods. This assumption does not hold when comparing end-to-end methods, which can produce different sets of true positives, making comparison unreliable.
Miss Rate. If the final displacement error between a ground-truth trajectory and a prediction is above a center distance threshold, we count the forecast as a miss (similarly evaluated w.r.t. the set of top-K predictions). This metric evaluates the proportion of misses over all forecasts in a scene.
ADE/FDE w.r.t. Recall.
The standard forecasting setup allows us to build models in isolation from other factors and has sparked rapid progress in this field of research salzmann2020eccv; ivanovic2018trajectron; Gupta18CVPR; Alahi16CVPR; Dendorfer2020ACCV; dendorfer2021iccv. However, the standard assumption of having perfect input trajectories is not feasible in practice as it critically depends on perfect object tracks as inputs, which are nearly impossible to obtain in practice. To this end, Luo18CVPR; liang2020pnpnet; Weng2021PTP study end-to-end trajectory forecasting directly from raw sensor data, and propose an evaluation setup for end-to-end forecasting models using the aforementioned ADE and FDE at fixed recall thresholds, i.e., ADE/FDE at 60% or 90%.
This evaluation setting has two major short-comings:
Evaluated only on a subset of matched detections. A large number of agents are not moving and prediction of their future positions is trivial. Models that rank stationary objects higher than moving objects can obtain higher forecasting performance by specializing on trivial predictions. We provide empirical evidence for this in Sec. 5.1 and show that such recall-based metrics can be “gamed” using a simple constant position prediction model.
No penalty for false positives. The current evaluation protocol detaches the inter-linked tasks of detection and forecasting. As a consequence, models can predict an arbitrary number of forecasts that are not anchored to any detections. In other words, this approach does not penalize false forecasts, i.e., forecasts not anchored to any detection, and missed forecasts as commonly characterized by the miss rate.
3.2 Average Precision is All You Need
Average Precision (). is defined as the area under the precision-recall curve Everingham10IJCV, commonly averaged over multiple spatial overlap thresholds Lin14ECCV. To compute we first determine the set of true positives (TP) and false positives (FP) to evaluate precision and recall. In standard object detection, TPs are considered to be successful matches between model predictions and ground-truth, typically determined based on 2D/3D intersection-over-union (IoU) Everingham10IJCV or distance from the object center Caesar20CVPR in the reference image or LiDAR point cloud, respectively. We can extend AP for joint detection and forecasting by (a) evaluating detection accuracy on the current frame or (b) evaluating detection accuracy seconds into the future. However, (a) completely ignores forecasts and (b) doesn’t ensure that future trajectories are correctly associated to the right current detection.
Forecasting Average Precision (). For the task of joint detection and forecasting, all future forecasts need to be anchored to objects, present (and detected) in . A robust metric must correctly penalize trajectories with correct first frame detections and incorrect forecasts (false forecasts), and trajectories with incorrect first frame detections (missed forecasts).
To characterize both types of errors, we define a true positive with reference to the current frame if there is a positive match in both the current timestamp () and the future (final) timestep . Otherwise, a forecast is considered to be a false positive. A successful match in the current frame is determined based on the distance from the center, averaged over distance thresholds of m caesar2020nuscenes. Similarly, a successful match in the final timestep is determined based on the distance from object center, averaged over distance thresholds of m respectively. In contrast to ADE @ Recall % and FDE @ Recall %, this evaluation setting (i) takes all detections (not just true positives) into account, and (ii) penalizes missed forecasts (typically characterized by the miss-rate).
Forecasting Mean Average Precision (). Forecasting AP is evaluated on the full set of detections and cannot be “gamed” by a simple constant position model. However, we note that the data itself is imbalanced: over 60% of cars in the nuScenes dataset are parked, and are therefore stationary. To this end, we define three sub-classes: static car, linearly moving car and non-linearly moving car. Computing sub-class can be difficult; we do not require forecasts to output sub-class labels, but assume all ground-truth objects have sub-class labels. We follow the protocol for large-vs-small object subclass evaluation from COCO lin2014microsoft, described further in the appendix. We then evaluate as to ensure our metric cannot be “gamed” by trivial forecasters, as well as discuss fine-grained analysis on the three cases separately. Similarly, is evaluated as the average over the three sub-classes.
Metrics: Embracing Multiple Futures. As described, would be suitable for evaluating forecasting for scenes with multiple future ground truth trajectories. However, this is not feasible in the practice when forecasting directly from historical sensor data. To this end, we adopt a top-K based forecasting evaluation pellegrini10eccv; lerner07cgf; Robicquet16eccv, that does not penalize models for hypothesizing possible future trajectories anchored from a single detection. In particular, we first match predictions to ground-truth detections in and take the top-K highest ranked forecasts for each detection. Based on this set, we determine the best-matching forecast in terms of FDE and evaluate as explained above.
4 Forecasting as Future Object Detection

FutureDet addresses the forecasting problem by predicting the future locations of objects observed at . We can repurpose existing LiDAR detectors to predict object locations for future (unobserved) LiDAR scans, for which ground truth supervision is given. We first describe our method and discuss our implementation based on the recently proposed CenterPoint LiDAR detector. yin2021center.
Future object detection and forecasting are related tasks. Forecasting requires predicting consistent trajectories in every frame between the current frame and future frames. To estimate forecasts from future detections we train our network to additionally estimate velocity offset vectors for every future detection. We do so for all frames between the current timestep and the final future timestep where the future detection occurs.
Backcasting vs. Forecasting. Fast and Furious Luo18CVPR proposes a similar architecture that forecasts position offsets into the future directly from current-frame detections. Our method considers the inverse setup where we detect in both the current and future frames and predict offsets back in time. We posit that future object detection requires the network to learn forecasted feature representations luc2018predicting, directly optimizing for future object positions. Our experimental evaluation and visual inspection confirm this intuition (Sec. 3).
Method: Embracing Multiple Futures. The task of forecasting is inherently ambiguous: while there are many plausible outcomes given an input trajectory, only one future is realized for training supervision and evaluation. Traditional forecasting methods and benchmarks facilitate multiple future predictions via top-K based evaluation, leveraging multiple-choice-loss bhattacharyya18cvpr and generative models Lee17CVPR; ivanovic2018trajectron; sadeghian2018sophie; kosaraju2019socialbigat; amirian2019social; Gupta18CVPR; dendorfer2021iccv; Dendorfer2020ACCV to learn a (possibly multi-modal dendorfer2021iccv; Dendorfer2020ACCV) distribution over future trajectories. FutureDet allows for natural multi-future forecasting to emerge. We first point out that detection networks can be easily repurposed for future detection by giving target bounding boxes seconds into the future. Since future objects are detected independently from current-frame detections, we posit that the network will produce multiple future detections for every object in the scene, effectively placing “multiple bets” where the objects may end up in the future. As all future detections are modeled by Gaussian heat maps, we implicitly obtain a multi-modal distribution over possible future locations (see Fig. 2).
Matching Multiple Forecasts. The task of forecasting requires all trajectories to be anchored to the set of object detections in the current (observed) LiDAR scan. For every future detection , we backcast and compute the distance to each detection from the previous timestep. For each , we pick the best (allowing for many-to-one matching). This framework naturally allows potentially multiple future forecasts to belong to each current timestep detection.
Ranking Multiple Forecasts. For all forecasts anchored at a single detection, we rank trajectories according to their forecasting score, derived using the detection confidence score of the last detection in a predicted trajectory. As shown in Table 2, we find there is a slight increase in performance between and , indicating that better ranking strategies can further improve FutureDet.
Implementation. We train CenterPoint to detect objects in future scans. The underlying detection network simply thinks it’s finding times as many object classes (e.g., cars and future-cars) with additional regression offsets (analogous to existing velocity regressors). In addition, we repurpose the ground truth sampling (a.k.a. copy-paste) augmentation zhu2019class to increase the diversity of training trajectories. This provides considerable improvement in linear and non-linear forecasting performance. We use the PyTorch toolbox to train all models for 20 epochs with the Adam optimizer and a one-cycle learning rate scheduler.
CenterPoint is already a one-frame forecaster. It detects objects and predicts one-frame future velocity vectors that are used as cues for tracking. It does this by accumulating previous LiDAR scans and encodes the accumulated point cloud sequences using a VoxelNet zhou2018voxelnet backbone. Such a tracker could be used as input to auto-regressive forecasting methods, e.g., salzmann2020eccv, however, we argue that we can use such a spatiotemporal representation to directly forecast.
CenterPoint models object locations as Gaussians. It does so by producing a 2D bird’s-eye-view (BEV) heatmap, which models the continuous likelihood of detections at each point in the BEV space. Detections are obtained by finding local maxima in these heatmaps via non-maximum suppression (NMS). By reusing this representation for future detection, our detection heatmaps are effectively a forecast of a continuous likelihood field for the locations of objects. This continuous field naturally encodes the uncertainty of future detections, accounts for multi-modality, and provides a continuous representation for forecasting.
5 Experimental Evaluation
We conduct our experimental analysis on the nuScenes Caesar20CVPR dataset. As we are tackling end-to-end forecasting from sensor data, we do not follow the established evaluation protocol that provides ground-truth trajectories and HD maps as input (as explained in Sec. 3.1). First, we perform breakdown analysis of evaluation metrics proposed in liang2020pnpnet and our forecasting mAP by analyzing the performance of a simple constant position model (Sec. 5.1). After verifying that our proposed evaluation setting is not easily “gamable”, as discussed in Sec. 3.1, we thoroughly ablate our model and compare its performance to other state-of-the-art methods (Sec. 5.2).
Repurposing NuScenes Tracking Dataset. nuScenes Caesar20CVPR recently introduced a large-scale multi-modal dataset recorded in Boston and Singapore. It provides 1000 twenty-second logs that are fully annotated with 3D bounding boxes. This work explicitly focuses on forecasting based on LiDAR data, obtained with a 32 beam LiDAR sensor recorded at 20 Hz, covering 360-degree view. We follow the official protocol and evaluate forecasting on the car class up to 3 seconds in the future. We evaluate forecasting performance on the pedestrian class in the appendix. As the test set is hidden, we follow liang2020pnpnet and conduct our analysis on the official validation split.
5.1 Metric Breakdown Analysis
| Constant Position (CP) | 0.38 | 0.63 | 0.48 | 0.76 | 0.37 | 0.64 | 66.3 | 0 | 0 | 22.1 |
|---|---|---|---|---|---|---|---|---|---|---|
| PnPNet liang2020pnpnet | 0.58 | 0.93 | 0.68 | 1.04 | - | - | - | - | - | - |
| PnPNet w/o Tracker liang2020pnpnet | 0.69 | 1.09 | 0.75 | 1.14 | - | - | - | - | - | - |
| Trajectron++ salzmann2020eccv | 1.13 | 2.54 | 1.25 | 2.71 | 1.08 | 2.42 | 59.2 | 8.1 | 2.8 | 23.4 |
| SPF2 Weng2020SPF2 | - | - | - | - | 1.04 | 1.04 | - | - | - | - |
| Fast and Furious∗ (FaF) Luo18CVPR | 0.74 | 1.59 | 0.83 | 1.69 | 0.73 | 1.56 | 64.8 | 22.2 | 7.5 | 31.5 |
In this section, we analyze different evaluation metrics by comparing a trivial constant position model to several state-of-the-art forecasting methods liang2020pnpnet; Luo18CVPR; salzmann2020eccv. For the task of end-to-end forecasting from raw data, methods report both detection and forecasting confidence scores. For the simple constant position model, we threshold trajectories such that we only report those where the final position overlaps with the initial position (i.e the object is stationary) with high confidence. A good forecasting evaluation metric should indicate that the trivial constant position baseline is not a good predictor, as it only correctly predicts future locations of stationary objects and explicitly assumes a stationary world. Do existing metrics reveal this?
To answer this question, we report the results of our analysis in Table 1. We analyze the results using average and final displacement (ADE and FDE) errors at recall liang2020pnpnet, and a variant that averages results over all recall thresholds Weng2020SPF2 (see Sec. 3.1 for a discussion of these metrics). Our trivial constant position baseline yields state-of-the-art results under the aforementioned evaluation settings. Current metrics are “gameable” by this trivial forecaster.
What about our forecasting mAP (Sec. 3.2)? We analyze these methods both through the lens of each motion class (, and ), and as an aggregate. First, we observe that the constant position model evaluated over static cars performs better than FaF*, a state-of-the-art end-to-end forecaster. However, when we evaluate on the subset of cars that are in motion, and confirms that our metric behaves as expected: we obtain with the constant position model, indicating that it fails to predict the motion of moving cars. On the other hand, FaF∗ obtains 7.5 , indicating that motion forecasting from the raw sensory data is a very challenging problem. We observe that Trajectron++ outperforms the constant position model for moving objects (8.1 ), but does not reach the performance of the constant position model or FaF∗ on stationary objects.
A good metric should summarize the performance on the full set of cars, i.e., in addition to predicting the motion of moving cars, a good model should correctly predict that parked cars are unlikely to move in the near future. This is achieved by our forecasting mAP that averages , and . Our ranks state-of-the-art FaF∗ (31.5 ) favourably over the constant position baseline (22.1 ), as expected. Based on this analysis, we are confident we have the right tools to analyze FutureDet thoroughly!
5.2 Ablation and Comparison to State-of-the-Art
| K=1 | K=5 | ||||||||||||||||||||||
|---|---|---|---|---|---|---|---|---|---|---|---|---|---|---|---|---|---|---|---|---|---|---|---|
| Detection + Constant Velocity | 70.3 | 66.0 | 65.8 | 21.2 | 90.0 | 6.5 | 75.4 | 31.2 | 70.3 | 66.0 | 65.8 | 21.2 | 90.0 | 6.5 | 75.4 | 31.2 | |||||||
| Detection + Forecast (cf. Luo18CVPR) | 69.1 | 64.7 | 66.1 | 22.2 | 86.3 | 7.5 | 73.8 | 31.5 | 69.1 | 64.7 | 66.1 | 22.2 | 86.3 | 7.5 | 73.8 | 31.5 | |||||||
| Trajectron++ salzmann2020eccv | 70.3 | 59.2 | 65.8 | 8.1 | 90.0 | 2.8 | 75.4 | 23.4 | 70.3 | 61.7 | 65.8 | 9.8 | 90.0 | 4.3 | 75.4 | 25.3 | |||||||
| FutureDet | 70.1 | 65.5 | 62.9 | 24.9 | 91.8 | 10.1 | 74.9 | 33.5 | 70.1 | 67.3 | 62.9 | 27.7 | 91.7 | 11.7 | 74.9 | 35.6 | |||||||
| FutureDet-PointPillars | 70.1 | 64.1 | 63.4 | 24.8 | 92.4 | 9.6 | 75.4 | 32.8 | 70.7 | 67.5 | 63.4 | 28.8 | 92.0 | 11.9 | 75.4 | 36.1 | |||||||
| FutureDet + Map | 70.2 | 65.5 | 62.7 | 24.3 | 91.7 | 9.4 | 74.9 | 33.1 | 70.2 | 67.5 | 62.7 | 27.1 | 91.7 | 11.0 | 74.9 | 35.2 | |||||||
After confirming that our proposed forecasting mAP is a suitable metric for joint object detection and forecasting, we compare FutureDet to a number of baselines and two state-of-the-art methods.
Detection + Constant Velocity. We begin with an surprisingly simple, yet strong baseline which is often overlooked in forecasting literature. This baseline takes the detections, as well as the estimated velocity from our CenterPoint detector yin2021center, and simply extrapolated forecasts as if objects are moving with constant velocity. Since CenterPoint is such a strong detector, this baseline produces strong results. Most of the ground-truth objects are approximately moving with a constant velocity, either moving directly forward or are stationary. We expect this model to under-perform on non-linear trajectories.
Detection + Forecast (FaF∗, cf. Luo18CVPR). This variant predicts a different velocity offset at every time step into the future for each detection, and derives trajectories by integrating velocities in the forward direction. This is precisely what Fast and Furious (FaF) does Luo18CVPR. For an apples-to-apples comparison, we re-implement FaF using a CenterPoint-backbone and denote this model as FaF∗. This method predicts a single trajectory per detection.
Trajectron++. We compare all of the aforementioned variants and ablations of our method to the state-of-the-art auto-regressive trajectory prediction model, Trajectron++ salzmann2020eccv. This model is indicative of current state-of-the-art approaches for the traditional forecasting task where ground truth tracks are given. With this comparison, we wish to outline how the standard three-stage detection-tracking-forecasting approach compares with our end-to-end forecasting method. To construct this baseline, we begin with off-the-shelf detection and tracking results from CenterPoint yin2021center. CenterPoint performs tracking using the velocity offset estimates to match detections in each frame using a greedy matching between the current frame detections and previous frame detections. Trajectron++ then takes these predicted trajectories as input for forecasting.
FutureDet. . We detect objects directly in future frames and backcast these future detections to the reference frame. Intuitively, the advantage of this variant over simple forecasting (FaF) is in that it encourages the network to learn a better feature representation for forecasting by placing ”multiple bets” on the future position of objects in the current frame. As shown in Figure 2, this method naturally allows for a multiple-future interpretation of the observed sensory data (as discussed in Sec. 4). In Figure 3, we show qualitatively that our method can represent multiple futures. We note that the highest confidence future trajectories looks like constant velocity predictions as the training data is biased towards static and linearly moving objects. FutureDet is able to learn road geometries without map information, as indicated by the curved trajectories.
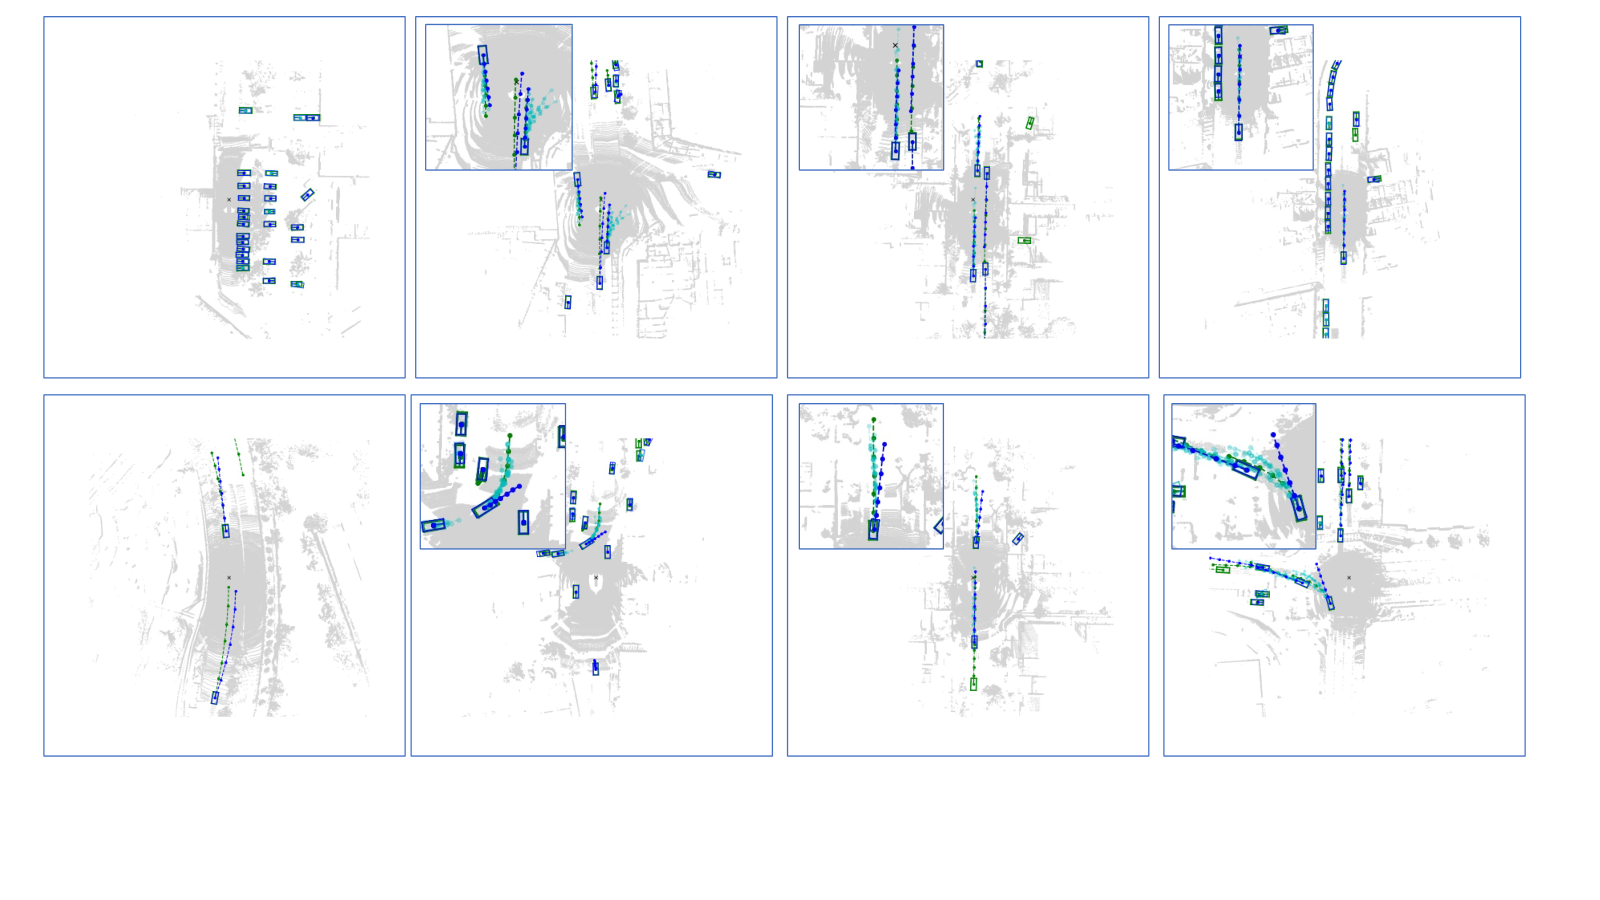
Discussion. We compare the results of the aforementioned variants to FutureDet as well as Trajectron++ salzmann2020eccv in Table 2. First, we notice that moving object forecasting under our end-to-end setting is a challenging problem — none of the methods we study have high , suggesting the need for the community to focus on this problem. Second, despite the constant velocity model being conceptually simple, it performs on par with our FaF re-implementation and improves on Trajectron++ by +7.8 . Unfortunately, this constant velocity baseline is usually under-emphasized in the literature. We argue here that it still serves as an important baseline. The poor performance of Trajectron++ might also hint that performing direct end-to-end forecasting is advantageous over a three-stage approach of detection-tracking-forecasting, where errors can easily compound. FutureDet takes a different approach compared to existing methods. Our method improves upon all other baselines in terms non-linear object and the motion category-averaged (our primary metric). In addition, this multi-future interpretation also allows the performance to be improved in the evaluation, where the forecast with minimum FDE from the top 5 ranked forecasts for each detection is evaluated. Note that for FutureDet , results slightly decrease because bundling multiple trajectory estimates into one multi-future prediction for a single object reduces recall. However this is more than made up for in the increase in performance for detection and forecasting moving objects at . We train a version of our model with road masks as an additional input channel into the BEV feature representation (after the sparse-voxel backbone). This brings very little change to the results. We hypothesize that adding the map information does not provide additional information as it can be easily be learnt from the raw LiDAR input. However, further exploration is required to evaluate how to best fuse map information.
6 Conclusion
This paper presents a new end-to-end method for trajectory forecasting directly from LiDAR sensor data. Our proposed FutureDet is a natural forecasting-by-detection framework that allows for a multi-future interpretation of the observed evidence and establishes a new state-of-the-art. We provide thorough analysis of existing evaluation metrics for end-to-end forecasting and reveal that they can be gamed by a simple constant position model. To this end, we propose a new set of evaluation metrics based on the average precision metric that comprehensively evaluates joint detection and forecasting performance. This allows us to conduct a thorough analysis that reveals that a constant velocity model is a surprisingly strong baseline that should be considered in future forecasting work.
Limitations. As we do not explicitly enforce diverse trajectory generation, many of our multiple-futures are closely clustered. While FutureDet presents the first method for end-to-end forecasting from raw sensory data, capable of multi-future predictions, generation of diverse, multi-modal predictions remains an open challenge.
Acknowledgments. This work was supported by the CMU Argo AI Center for Autonomous Vehicle Research.
References
- (1) Alexandre Alahi, Kratarth Goel, Vignesh Ramanathan, Alexandre Robicquet, Li Fei-Fei, and Silvio Savarese. Social lstm: Human trajectory prediction in crowded spaces. In IEEE Conf. Comput. Vis. Pattern Recog., June 2016.
- (2) Javad Amirian, Jean-Bernard Hayet, and Julien Pettré. Social ways: Learning multi-modal distributions of pedestrian trajectories with gans. In Conference on Computer Vision and Pattern Recognition Workshop, 2019.
- (3) Mehmet Aygün, Aljoša Ošep, Mark Weber, Maxim Maximov, Cyrill Stachniss, Jens Behley, and Laura Leal-Taixé. 4d panoptic lidar segmentation. In IEEE Conf. Comput. Vis. Pattern Recog., 2021.
- (4) J. Behley, M. Garbade, A. Milioto, J. Quenzel, S. Behnke, J. Gall, and C. Stachniss. Towards 3D LiDAR-based semantic scene understanding of 3D point cloud sequences: The SemanticKITTI Dataset. Int. J. Robot. Res., 40(8-9):959–967, 2021.
- (5) Apratim Bhattacharyya, Bernt Schiele, and Mario Fritz. Accurate and diverse sampling of sequences based on a “best of many” sample objective. In IEEE Conf. Comput. Vis. Pattern Recog., 2018.
- (6) Holger Caesar, Varun Bankiti, Alex H. Lang, Sourabh Vora, Venice Erin Liong, Qiang Xu, Anush Krishnan, Yu Pan, Giancarlo Baldan, and Oscar Beijbom. nuScenes: A multimodal dataset for autonomous driving. In IEEE Conf. Comput. Vis. Pattern Recog., 2020.
- (7) Holger Caesar, Varun Bankiti, Alex H Lang, Sourabh Vora, Venice Erin Liong, Qiang Xu, Anush Krishnan, Yu Pan, Giancarlo Baldan, and Oscar Beijbom. nuscenes: A multimodal dataset for autonomous driving. In IEEE Conf. Comput. Vis. Pattern Recog., 2020.
- (8) Yuning Chai, Benjamin Sapp, Mayank Bansal, and Dragomir Anguelov. Multipath: Multiple probabilistic anchor trajectory hypotheses for behavior prediction. arXiv preprint arXiv:1910.05449, 2019.
- (9) Ming-Fang Chang, John Lambert, Patsorn Sangkloy, Jagjeet Singh, Slawomir Bak, Andrew Hartnett, De Wang, Peter Carr, Simon Lucey, Deva Ramanan, et al. Argoverse: 3d tracking and forecasting with rich maps. In IEEE Conf. Comput. Vis. Pattern Recog., 2019.
- (10) Patrick Dendorfer, Sven Elflein, and Laura Leal-Taixé. Mg-gan: A multi-generator model preventing out-of-distribution samples in pedestrian trajectory prediction. In Int. Conf. Comput. Vis., 2021.
- (11) Patrick Dendorfer, Aljosa Osep, and Laura Leal-Taixe. Goal-gan: Multimodal trajectory prediction based on goal position estimation. In Asian Conf. Comput. Vis., 2020.
- (12) Patrick Dendorfer, Aljoša Ošep, Anton Milan, Konrad Schindler, Daniel Cremers, Ian Reid, and Stefan Roth Laura Leal-Taixé. Motchallenge: A benchmark for single-camera multiple target tracking. Int. J. Comput. Vis., 2020.
- (13) M. Everingham, L. Van Gool, C.K.I. Williams, J. Winn, and A. Zisserman. The pascal visual object classes (VOC) challenge. Int. J. Comput. Vis., 88(2):303–338, 2010.
- (14) Davi Frossard and Raquel Urtasun. End-to-end learning of multi-sensor 3d tracking by detection. In IEEE Int. Conf. Robotics and Autom., 2018.
- (15) Jiyang Gao, Chen Sun, Hang Zhao, Yi Shen, Dragomir Anguelov, Congcong Li, and Cordelia Schmid. Vectornet: Encoding hd maps and agent dynamics from vectorized representation. In Proceedings of the IEEE/CVF Conference on Computer Vision and Pattern Recognition, pages 11525–11533, 2020.
- (16) Andreas Geiger, Philip Lenz, and Raquel Urtasun. Are we ready for autonomous driving? the KITTI vision benchmark suite. In IEEE Conf. Comput. Vis. Pattern Recog., 2012.
- (17) Thomas Gilles, Stefano Sabatini, Dzmitry Tsishkou, Bogdan Stanciulescu, and Fabien Moutarde. Home: Heatmap output for future motion estimation. In 2021 IEEE International Intelligent Transportation Systems Conference (ITSC), pages 500–507. IEEE, 2021.
- (18) Ian Goodfellow, Jean Pouget-Abadie, Mehdi Mirza, Bing Xu, David Warde-Farley, Sherjil Ozair, Aaron Courville, and Yoshua Bengio. Generative adversarial nets. In Neural Information Processing Systems, 2014.
- (19) Junru Gu, Chen Sun, and Hang Zhao. DenseTNT: End-to-end trajectory prediction from dense goal sets. In Proceedings of the IEEE/CVF International Conference on Computer Vision, pages 15303–15312, 2021.
- (20) Agrim Gupta, Justin Johnson, Li Fei-Fei, Silvio Savarese, and Alexandre Alahi. Social gan: Socially acceptable trajectories with generative adversarial networks. In IEEE Conf. Comput. Vis. Pattern Recog., 2018.
- (21) Dirk Helbing and Péter Molnár. Social force model for pedestrian dynamics. Physical Review E, 1995.
- (22) Boris Ivanovic and Marco Pavone. The trajectron: Probabilistic multi-agent trajectory modeling with dynamic spatiotemporal graphs. In Int. Conf. Comput. Vis., 2019.
- (23) Aleksandr Kim, Aljoša Ošep, and Laura Leal-Taix’e. Eagermot: 3d multi-object tracking via sensor fusion. In IEEE International Conference on Robotics and Automation (ICRA), 2021.
- (24) Diederik P Kingma and Max Welling. Auto-encoding variational bayes. In International Conference on Learning Representations, 2014.
- (25) Vineet Kosaraju, Amir Sadeghian, Roberto Martín-Martín, Ian Reid, Hamid Rezatofighi, and Silvio Savarese. Social-BiGAT: Multimodal trajectory forecasting using bicycle-gan and graph attention networks. In Neural Information Processing Systems, 2019.
- (26) Alex Krizhevsky, Ilya Sutskever, and Geoffrey Hinton. Imagenet classification with deep convolutional neural networks. In Adv. Neural Inform. Process. Syst., 2012.
- (27) Alex H Lang, Sourabh Vora, Holger Caesar, Lubing Zhou, Jiong Yang, and Oscar Beijbom. Pointpillars: Fast encoders for object detection from point clouds. In IEEE Conf. Comput. Vis. Pattern Recog., 2019.
- (28) Laura Leal-Taixé, Gerard Pons-Moll, and Bodo Rosenhahn. Everybody needs somebody: Modeling social and grouping behavior on a linear programming multiple people tracker. In ICCV Workshops, 2011.
- (29) Namhoon Lee, Wongun Choi, Paul Vernaza, Christopher Bongsoo Choy, Philip H. S. Torr, and Manmohan Krishna Chandraker. Desire: Distant future prediction in dynamic scenes with interacting agents. IEEE Conf. Comput. Vis. Pattern Recog., 2017.
- (30) Alon Lerner, Yiorgos Chrysanthou, and Dani Lischinski. Crowds by Example. Comput. Graph. Forum, 2007.
- (31) Mengtian Li, Yu-Xiong Wang, and Deva Ramanan. Towards streaming perception. In Andrea Vedaldi, Horst Bischof, Thomas Brox, and Jan-Michael Frahm, editors, Computer Vision - ECCV 2020 - 16th European Conference, Glasgow, UK, August 23-28, 2020, Proceedings, Part II, volume 12347 of Lecture Notes in Computer Science, pages 473–488. Springer, 2020.
- (32) Ming Liang, Bin Yang, Rui Hu, Yun Chen, Renjie Liao, Song Feng, and Raquel Urtasun. Learning lane graph representations for motion forecasting. In European Conference on Computer Vision, pages 541–556. Springer, 2020.
- (33) Ming Liang, Bin Yang, Wenyuan Zeng, Yun Chen, Rui Hu, Sergio Casas, and Raquel Urtasun. Pnpnet: End-to-end perception and prediction with tracking in the loop. In IEEE Conf. Comput. Vis. Pattern Recog., 2020.
- (34) Tsung-Yi Lin, Michael Maire, Serge Belongie, James Hays, Pietro Perona, Deva Ramanan, Piotr Dollár, and C. Lawrence Zitnick. Microsoft COCO: Common objects in context. In Eur. Conf. Comput. Vis., 2014.
- (35) Tsung-Yi Lin, Michael Maire, Serge Belongie, James Hays, Pietro Perona, Deva Ramanan, Piotr Dollár, and C Lawrence Zitnick. Microsoft coco: Common objects in context. In Eur. Conf. Comput. Vis., 2014.
- (36) Pauline Luc, Camille Couprie, Yann Lecun, and Jakob Verbeek. Predicting future instance segmentation by forecasting convolutional features. In Eur. Conf. Comput. Vis., 2018.
- (37) Wenjie Luo, Bin Yang, and Raquel Urtasun. Fast and furious: Real time end-to-end 3d detection, tracking and motion forecasting with a single convolutional net. In IEEE Conf. Comput. Vis. Pattern Recog., 2018.
- (38) S. Pellegrini, Andreas Ess, and L. Gool. Improving data association by joint modeling of pedestrian trajectories and groupings. In Eur. Conf. Comput. Vis., 2010.
- (39) Charles R Qi, Wei Liu, Chenxia Wu, Hao Su, and Leonidas J Guibas. Frustum pointnets for 3d object detection from rgb-d data. In IEEE Conf. Comput. Vis. Pattern Recog., 2017.
- (40) Shaoqing Ren, Kaiming He, Ross Girshick, and Jian Sun. Faster R-CNN: Towards real-time object detection with region proposal networks. In Adv. Neural Inform. Process. Syst., 2015.
- (41) Alexandre Robicquet, Amir Sadeghian, Alexandre Alahi, and Silvio Savarese. Learning social etiquette: Human trajectory understanding in crowded scenes. In Eur. Conf. Comput. Vis., 2016.
- (42) Amir Sadeghian, Vineet Kosaraju, Ali Sadeghian, Noriaki Hirose, Hamid Rezatofighi, and Silvio Savarese. Sophie: An attentive GAN for predicting paths compliant to social and physical constraints. In Conference on Computer Vision and Pattern Recognition, 2019.
- (43) Tim Salzmann, Boris Ivanovic, Punarjay Chakravarty, and Marco Pavone. Trajectron++: Dynamically-feasible trajectory forecasting with heterogeneous data. In Eur. Conf. Comput. Vis., 2020.
- (44) Shaoshuai Shi, Chaoxu Guo, Li Jiang, Zhe Wang, Jianping Shi, Xiaogang Wang, and Hongsheng Li. Pv-rcnn: Point-voxel feature set abstraction for 3d object detection. In IEEE Conf. Comput. Vis. Pattern Recog., 2020.
- (45) Shaoshuai Shi, Xiaogang Wang, and Hongsheng Li. PointRCNN: 3D Object Proposal Generation and Detection From Point Cloud. In IEEE Conf. Comput. Vis. Pattern Recog., 2019.
- (46) Shaoshuai Shi, Zhe Wang, Jianping Shi, Xiaogang Wang, and Hongsheng Li. From Points to Parts: 3D Object Detection from Point Cloud with Part-aware and Part-aggregation Network. IEEE Trans. Pattern Anal. Mach. Intell., 2020.
- (47) Pei Sun, Henrik Kretzschmar, Xerxes Dotiwalla, Aurelien Chouard, Vijaysai Patnaik, Paul Tsui, James Guo, Yin Zhou, Yuning Chai, Benjamin Caine, et al. Scalability in perception for autonomous driving: Waymo open dataset. In IEEE Conf. Comput. Vis. Pattern Recog., 2020.
- (48) Xinshuo Weng, Jianren Wang, David Held, and Kris Kitani. 3D Multi-Object Tracking: A Baseline and New Evaluation Metrics. In IEEE Int. Conf. Intell. Robot Sys., 2020.
- (49) Xinshuo Weng, Jianren Wang, Sergey Levine, Kris Kitani, and Nick Rhinehart. Inverting the pose forecasting pipeline with SPF2: Sequential pointcloud forecasting for sequential pose forecasting. In Conf. on Robot Learn., 2020.
- (50) Xinshuo Weng, Yongxin Wang, Yunze Man, and Kris Kitani. Gnn3dmot: Graph neural network for 3d multi-object tracking with multi-feature learning. In IEEE Conf. Comput. Vis. Pattern Recog., 2020.
- (51) Xinshuo Weng, Ye Yuan, and Kris Kitani. PTP: Parallelized tracking and prediction with graph neural networks and diversity sampling. Robotics and Automation Letters, 2021.
- (52) K. Yamaguchi, A.C. Berg, L.E Ortiz, and T.L. Berg. Who are you with and where are you going? In IEEE Conf. Comput. Vis. Pattern Recog., 2011.
- (53) Tianwei Yin, Xingyi Zhou, and Philipp Krahenbuhl. Center-based 3d object detection and tracking. In IEEE Conf. Comput. Vis. Pattern Recog., 2021.
- (54) Yang Zhang, Zixiang Zhou, Philip David, Xiangyu Yue, Zerong Xi, Boqing Gong, and Hassan Foroosh. Polarnet: An improved grid representation for online lidar point clouds semantic segmentation. In IEEE Conf. Comput. Vis. Pattern Recog., 2020.
- (55) Xingyi Zhou, Vladlen Koltun, and Philipp Krähenbühl. Tracking objects as points. In Eur. Conf. Comput. Vis., 2020.
- (56) Yin Zhou and Oncel Tuzel. Voxelnet: End-to-end learning for point cloud based 3d object detection. In Proceedings of the IEEE conference on computer vision and pattern recognition, pages 4490–4499, 2018.
- (57) Benjin Zhu, Zhengkai Jiang, Xiangxin Zhou, Zeming Li, and Gang Yu. Class-balanced grouping and sampling for point cloud 3d object detection. arXiv preprint arXiv:1908.09492, 2019.
Appendix A Examining FutureDet’s Predictions

One of the challenges of forecasting from raw sensor data is appropriately handling false positive detections and forecasts. The standard forecasting setup allows us to build models in isolation from other factors. However, the standard assumption of having perfect input trajectories is not feasible in practice as it critically depends on perfect object tracks (and by extension perfect detections) as inputs, which are nearly impossible to obtain in practice. As seen in Figure 4, the raw output of FutureDet makes it challenging to use in practice. Intuitively, training a model to make “multiple bets” about the position of objects may induce more false positives. Further post-processing is required to leverage the output of our end-to-end model in further downstream tasks.
Appendix B Evaluating Pedestrian Forecasting
In this section, we evaluate pedestrian forecasting on the nuScenes dataset. Forecasting pedestrian movement can be considerably more challenging than car forecasting because pedestrians are more dynamic. Given our 3 second forecasting horizon, pedestrians typically do not move very far from their initial position. As a result, we define tighter match thresholds for pedestrian forecasting. A successful match in the current frame is determined based on the distance from the center, averaged over distance thresholds of . A successful match in the final timestep is determined based on the distance from center, averaged over distance thresholds of respectively. We highlight the results of pedestrian forecasting in Table 3.
We see that FutureDet performs the best overall, with 26.9 . Looking to Figure 5, it is clear that pedestrian detections are tightly clustered together, making back-casting less effective overall. We also find that many of the predicted multiple-futures are very similar to one another, indicating that the model is not able to model dynamic pedestrian futures. However, FutureDet still consistently improves over FaF* by 1% on metrics.
We train a version of our model with road masks as an additional input channel into the BEV feature representation (after the sparse-voxel backbone). This brings very little change to the results. We hypothesize that adding the map information does not provide additional information. However, further exploration is required to evaluate how to best fuse LiDAR and map information.
| K=1 | K=5 | ||||||||||||||||||||||
|---|---|---|---|---|---|---|---|---|---|---|---|---|---|---|---|---|---|---|---|---|---|---|---|
| Detection + Constant Velocity | 55.1 | 33.3 | 73.5 | 27.8 | 96.9 | 12.4 | 75.2 | 24.5 | 55.1 | 33.3 | 73.5 | 27.8 | 96.9 | 12.4 | 75.2 | 24.5 | |||||||
| Detection + Forecast (cf. Luo18CVPR) | 53.7 | 35.0 | 73.9 | 30.8 | 97.2 | 13.3 | 74.9 | 26.4 | 53.7 | 35.0 | 73.9 | 30.8 | 97.2 | 13.3 | 74.9 | 26.4 | |||||||
| Trajectron++ salzmann2020eccv | 55.1 | 16.4 | 73.5 | 7.8 | 96.9 | 5.2 | 75.2 | 9.8 | 55.1 | 18.1 | 73.5 | 9.0 | 96.9 | 6.9 | 75.2 | 11.3 | |||||||
| FutureDet | 53.1 | 33.3 | 72.4 | 32.6 | 95.3 | 14.7 | 73.6 | 26.9 | 53.1 | 35.1 | 72.4 | 34.0 | 95.2 | 15.0 | 73.6 | 28.0 | |||||||
| FutureDet-PointPillars | 41.0 | 20.7 | 69.1 | 29.8 | 93.3 | 13.3 | 67.8 | 21.3 | 41.0 | 22.9 | 69.2 | 31.0 | 93.1 | 13.5 | 67.7 | 22.5 | |||||||
| FutureDet + Map | 52.4 | 33.0 | 71.8 | 32.0 | 95.3 | 14.4 | 73.2 | 26.5 | 52.4 | 34.8 | 71.8 | 33.4 | 95.2 | 14.8 | 73.2 | 27.7 | |||||||

Appendix C FutureDet Architecture
In this section, we further describe the implementation details of FutureDet. Specifically, we focus on the detector head architecture, and the sampling strategy used to improve nonlinear trajectory forecasting.
Recurrent Features. We re-purpose CenterPoint for our implementation of FutureDet. However, CenterPoint is designed to detect objects in the current frame. It uses a shared feature representation for all classes. Although this effectively captures object spatial location, it does not allow for a robust representation of forecasted features. Specifically, since FutureDet detects cars and future-cars, we expect that the features required to detect these temporally offset classes should be different. To this end, we allow the model to learn a shallow network that transforms current features into future features as shown in Figure 6.
Trajectory Sampler. The distribution of static, linear, and non-linear trajectories in the nuScenes dataset is unbalanced. Since most cars are parked, we find that 60% of the trajectories are static. In order to address this data imbalance, we leverage copy-paste augmentation proposed by zhu2019class to oversample linear and nonlinear trajectories during training. Importantly, we ensure that our copy-paste augmentation samples at the trajectory level, instead of at the class level, allowing consistent augmented trajectories across all detection heads (i.e. classes).

Appendix D Computing Motion Subclass AP
Computing subclass average precision is straightforward in principle if both predictions and ground-truth have subclass labels; one can simply treat the sub-class as a class and apply standard precision-recall metrics. In our case, predictions do not come with a subclass label. Instead, we match predictions to ground-truth at a class-level, and assign the ground-truth sub-class to the true positive matched predictions. However, this will not produce any sub-class labels for false positive predictions (that are unmatched). Instead, the metric evaluation code derives sub-class labels for false positive predictions, by applying the same logic used to derive sub-class labels for the ground-truth. We follow this procedure as it is also used to produce small-vs-large sub-class precision-recall metrics for standard detection toolkits lin2014microsoft. Finally, although we use the language of sub-classes, our formalism can apply to any attributes associated with a detection.
We derive the subclass label as a function of the (ground truth or predicted) trajectory. For each trajectory, we first compute the IoU between bounding boxes at the first and last timestep. If the IoU is greater than 0, this trajectory is considered to be static. Next, using the velocity of the first timestep bounding box, we apply a constant velocity forecast to the initial position to compute a target box. If the IoU between the last timestep box and target box is greater than 0, this trajectory is considered to be linear. All trajectories that are not classified as static or linear as considered to be non-linear trajectories.
Appendix E Broader Impact
Autonomous agents will play an important role in the automation of tasks that can be considered unsafe (e.g., due to a high number of traffic accidents). Forecasting is at the heart of autonomous vehicle navigation: safe navigation necessitates motion prediction of surrounding agents to ensure driving safety. By leveraging LiDAR sensory data to accomplish this task, we can better understand world geometry and dynamics. Moreover, establishing the proper metrics, particularly considering the performance of moving and static car trajectories, is essential for building safe embodied robotics systems.