The Appearance of Vortices in Protoplanetary Disks in Near-Infrared Scattered Light
Abstract
Azimuthally asymmetric structures have been discovered in millimeter continuum emission from many protoplanetary disks. One hypothesis is that they are vortices produced by the Rossby wave instability, for example at edges of planet-opened gaps or deadzones. Confirming the vortex nature of these structures will have profound implications to planet formation. One way to test the hypothesis is to compare the observed morphology of vortex candidates in near-infrared scattered light with theoretical expectations. To this end, we synthesize the appearance of vortices in -band polarized light by combining hydrodynamic and radiative transfer simulations of the Rossby wave instability at a deadzone edge. In a disk at 140 pc, at the peak in its evolution a vortex at 65 au may appear as a radially narrow arc brighter compared with an axisymmetric disk model. The contrast depends on the inclination of the disk and the position angle of the vortex only weakly. Such contrast levels are well detectable in imaging observations of bright disks using instruments such as VLT/SPHERE, Subaru/SCExAO, and Gemini/GPI. A vortex also casts a shadow in the outer disk, which may aid its identification. Finally, at modest to high inclinations (e.g., ) a vortex may mimic a one-armed spiral. In the HD 34282 disk, such a one-armed spiral with a shadowed region on the outside has been found in scattered light. This feature roughly coincides with an azimuthal asymmetry in mm continuum emission, signifying the presence of a vortex.
I Introduction
Imaging observations with sufficiently high angular resolution and sensitivity have revealed structures in a number of protoplanetary disks. Such observations are typically carried out in two spectral windows. At near infrared (NIR) wavelengths, observations probe starlight being scattered by small dust grains at the disk surface, typically -sized or smaller. At (sub-)millimeter (mm) wavelengths, radio interferometers such as the Atacama Large millimeter Array (ALMA) image line and continuum emissions from gas and dust, with the latter being typically sub-mm in size. Millimeter continuum observations have revealed structures in many disks (Andrews 2020). Some of these disks have also been imaged in NIR scattered light to enable multi-wavelength studies of the same structures, yielding insights into their origins (Dong et al. 2017, e.g.,).
Many disks show concentric rings in mm continuum emission (Andrews et al. 2018; Long et al. 2018; van der Marel et al. 2019; Francis & van der Marel 2020, e.g.,). In some of them, the rings host large scale azimuthal asymmetries (Isella et al. 2013; Pérez et al. 2014; van der Marel et al. 2013; Casassus et al. 2013, e.g.,) at stellocentric distances of 10 to 100 au (van der Marel et al. 2021). One possible explanation for these asymmetries is that they are dust traps produced by vortices triggered by the Rossby wave instability (Li et al. 2000; Li et al. 2001, RWI;). The RWI may be excited at steep density transitions, such as the edge of planet-opened gaps (Hammer et al. 2017; Hammer et al. 2019; Hallam & Paardekooper 2020), or at the edge of viscosity transitions (Regály et al. 2012; Flock et al. 2015, e.g., deadzone edges,). Once formed, a vortex may trap dust of certain sizes inside (Birnstiel et al. 2013). Multi-fluid simulations with both gas and dust have shown that vortices may appear as emission clumps at mm wavelengths similar to the observed azimuthal asymmetries (Zhu & Stone 2014; Baruteau et al. 2019). However, definitive evidence is currently lacking. Other mechanisms have been proposed to explain azimuthal symmetries as well. For example, they may be horseshoes at the edges of eccentric cavities harboring massive companions (Ragusa et al. 2017; Calcino et al. 2019, e.g.,).
The origin of observed asymmetries is a key to the study of planet formation. If they are indeed dust trapping vortices, the enrichment of dust in them may facilitate planetesimals formation via, e.g., the streaming instability (Youdin & Johansen 2007; Bai & Stone 2010; Li et al. 2019, e.g.,). In addition, if they are produced at the edges of planet-opened gaps, they may be the signposts of planets.
How do we test the hypothesis that observed asymmetries are vortices? One avenue may be to search for the anticyclonic gas motions inside these structures using gas observations (Huang et al. 2018; Robert et al. 2020). This technique is in principle straightforward; however, the required high spatial resolution and sensitivity are challenging, and the applications to real systems are inconclusive (Boehler et al. 2021, e.g.,). Vortices may also have distinct spectral indices at mm wavelengths due to differential trapping of dust of different sizes (Birnstiel et al. 2013). However, new explorations in dust scattering at mm wavelengths necessitate the need to revisit the models (Liu 2019; Zhu et al. 2019).
Another way to test the vortex hypothesis is to compare the morphology of a vortex candidate at multiple wavelengths with the theoretically expected appearance of a vortex at the corresponding wavelengths — a true vortex should look like a vortex at any wavelengths. To do so, we need to understand how vortices appear in various observations. While the morphology of dust clumps produced by vortices at mm wavelengths has been well studied (Zhu & Stone 2014; Baruteau & Zhu 2016, e.g.,), the morphology of vortices in NIR scattered light lacks a thorough understanding.
II Simulations
We use FARGO3D (Benítez-Llambay & Masset 2016) hydrodynamic simulations to model a locally isothermal and non-self-gravitating protoplanetary disk subject to the RWI and vortex formation at a deadzone edge. We follow Huang et al. 2019 in setting up the simulations. We then feed the resulting disk structures into HOCHUNK3D (Whitney et al. 2013) radiative transfer simulations to visualize the disk in NIR polarized scattered light. We follow Dong et al. 2015 in joining hydro and radiative transfer simulations.
II.1 Hydrodynamic Simulations
Our grid is two dimensional (2D) with size (2048, 3072) in the radial and azimuthal directions, respectively, and with uniform spacing in both directions. We use a full disk with ranging from to and ranging from to , where is the code length unit. We use symmetric radial boundary conditions. The disk scale height as a function of is given by:
| (1) |
The initial gas surface density profile is given by:
| (2) |
where is a constant to be normalized by the total disk mass. The viscosity is characterized by the Shakura & Sunyaev 1973 parameter. A deadzone model is implemented by varying with as:
| (3) |
where the viscosity inside the deadzone , the viscosity outside the deadzone , and the transition occurs at .
Following Huang et al. 2019, we experiment with different radial widths of the viscosity transition region to search for vortices with the largest surface density contrasts at the peak. Such vortices are expected to be the most prominent and the easiest to detect in NIR scattered light. In total three models are tested:
- •
Model Scale Height (SH), in which is the local disk scale height.
- •
Model Half-Scale Height (H-SH), in which .
- •
Model Quarter-Scale Height (Q-SH), in which .
The hydrodynamic simulations are run for 3000 orbits at .
II.2 Radiative Transfer Simulations
We puff up 2D surface density maps of the disk from hydro models in the vertical direction to restore its 3D geometry and to simulate NIR scattered light observations. This is done using a Gaussian vertical density profile, i.e., assuming the disk is vertically isothermal:
| (4) |
where is the vertical height from the midplane and is the density at normalized by .
Our assumption that the vertical density distribution is the same inside and outside a vortex is justified. Both analytical and numerical studies have shown that the RWI and the resulting vortex formation process are 2D in nature (Meheut et al. 2010; Meheut et al. 2012; Lin 2012a; Richard et al. 2013; Lin 2014). In our locally isothermal non-self-gravitating disks, the differences in the gas surface density and vorticity in vortices between 2D and 3D simulations are negligible (Zhu et al. 2014). In addition, inside a vortex, vertical gas motions and density stratification (i.e., deviations from Eqn. 4) are almost absent (Lin 2012a, Lin & Pierens 2018). Vortices may develop internal structures in non-isothermal disks or when disk self-gravity becomes important (Meheut et al. 2012; Lin 2012b; Lin & Pierens 2018).
The 3D disk has 1126, 384, 122 cells in spherical coordinates (, , ) ( is the polar angle). In the polar direction the grid extends to from the disk midplane, or 8 scale heights at the vortex location. We bin every 2 radial cells and 8 azimuthal cells in hydro models to one cell in radiative transfer calculations. Convergence tests have shown that the resulting spatial resolution is sufficient to resolve the vortices in all dimensions. We set au, which places the vortex at 65 au, and normalize the initial disk mass to 0.03 solar masses within 225 au. In HOCHUNK3D we pad an axisymmetric inner disk between the dust sublimation radius and the hydro inner boundary () with 100 radial cells by extrapolating the azimuthally averaged hydro disk at its inner edge inward assuming the same radial surface density profile as in Eqn. 2.
Our hydro simulations are gas only, while scattered light is determined by the distribution of small dust typically sub- in sizes. Such dust usually has Stokes numbers much smaller than unity, and is expected to be well-coupled with the gas. We thus assume a constant dust-to-gas mass ratio, 1:100, throughout the disk. We note that if grain growth and evolution occur inside vortices, dust size distributions may be modified (Li et al. 2020). We assume interstellar medium dust (Kim et al. 1994) with a power-law size () distribution between . The optical properties of the dust can be found in Fig. 2 in Dong et al. 2012.
We assume a star with a radius of 2.4 and a temperature of 4400 K in radiative transfer simulations. We produce -band (m) polarized intensity (PI) images at inclinations of 0∘, 30∘, and 60∘, with the vortex placed on the major axis (position angle PAvortex = ), minor axis (PAvortex = , far side; and , near side), and in between positions (PAvortex = and ). Note that since we are viewing a non-axisymmetric structure at a cone-shaped surface (because the disk is optically thick at NIR wavelengths), the structure appears differently at these position angles when (Dong et al. 2016).
Synthetic images from radiative transfer simulations are at “full resolution”. To mimic real observing conditions, we convolve images by a Gaussian point-spread function (PSF) to achieve an angular resolution of 0.04″ (the diffraction limited angular resolution of 8-meter telescopes) assuming the disk is at 140 pc. Images are produced using 4 billion photon packets, and will be shown in linear stretch. Tests show that the noises introduced by this finite number of photon packets is at the percent level in convolved images.
III Results
Fig. 1 shows the surface density maps of the models at 500, 1000, and 2000 orbits. In all cases, the RWI is excited around the viscosity transition region. Initially a number of small vortices form, which quickly merge to form a single big vortex, before it is gradually elongated in the azimuthal direction. As we are interested in finding the most prominent vortex, we show the temporal evolution of the maximum surface density in the merged vortex relative to the azimuthally averaged background at the bottom. The vortices in Models SH and H-SH reach roughly the same peak amplitudes, 2.3 the azimuthally averaged surface density at their radii. The vortex in Q-SH is significantly weaker. Between SH and H-SH, we choose H-SH for further investigation in scattered light because when the primary vortex in Model SH peaks at orbits, a second generation vortex has emerged (visible in the 2000 orbits panel in Fig. 1), which complicates the characterization of the primary vortex.


The vortex in Model H-SH peaks at 860 orbits (Fig. 1). Its surface density map at that epoch and the corresponding synthetic scattered light images at face-on are shown in Fig. 2. The azimuthal profiles at the vortex radius, 67 au in surface density and 62 au in scattered light, are shown in Fig. 3. Overall, the vortex appears as a radially narrow arc. The radial full width half maximum of the vortex relative to the background is 11 au, or 3 local disk scale heights. This is about half the PSF size (0.04″, or 5.6 au at 140 pc). Therefore, the vortex in the convolved image is marginally resolved, and the peak contrasts in the full resolution and convolved images are nearly the same. The vortex peak in the convolved image is 70% brighter than the azimuthally averaged background, and 140% brighter than the region on the opposite side at the same radius. NIR polarized light imaging observations today using instruments such as VLT/SPHERE, Subaru/SCExAO, and Gemini/GPI can reach a precision level of 10% in local surface brightness registration for bright disks (Pinilla et al. 2018, Fig. 4; Muro-Arena et al. 2020, Fig. 2; and reach percent level precision in azimuthally averaged surface brightness, Ren et al. 2021). The vortex in our model is expected to be easily detectable.
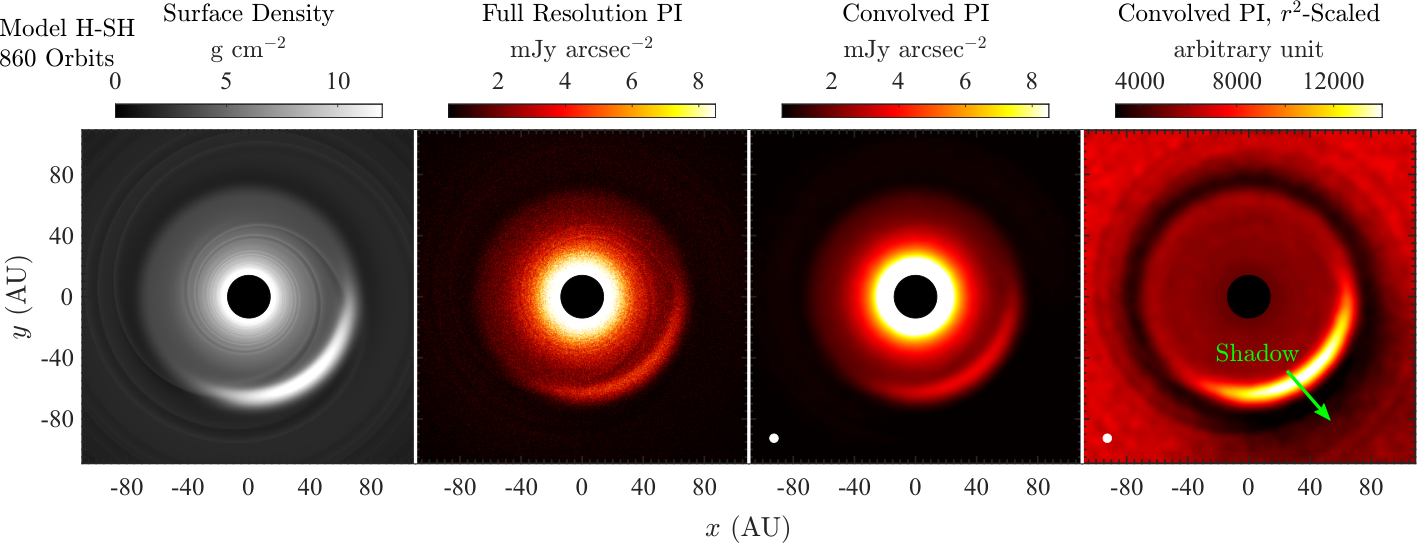
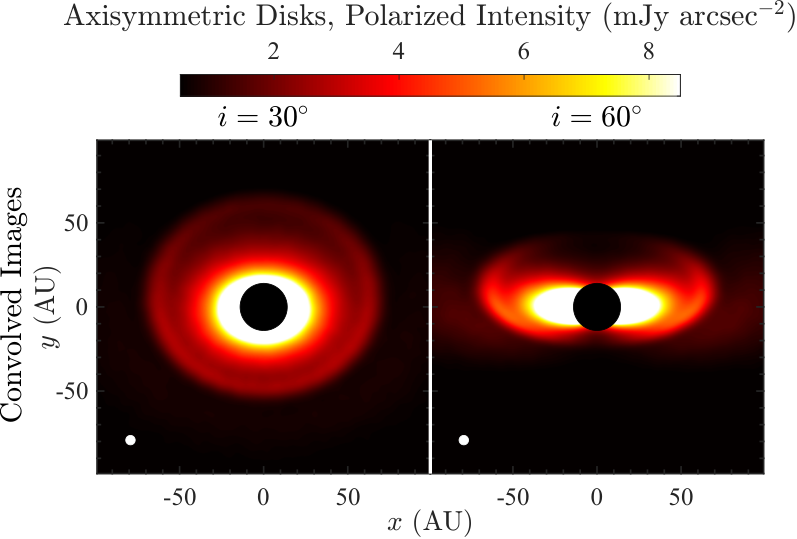
Fig. 4 shows the convolved -band images of Model H-SH at 860 orbits (the “red-hot” panels), as well as the convolved images normalized by axisymmetric model images (the gray panels). In total we show 10 viewing geometries: two inclinations ( and ), and 5 position angles for the vortex (PA, , , , ). In scattered light, even an axisymmetric structure in density distribution (e.g., a ring) displays azimuthal variations at , mainly caused by the angular dependence of scattering (Dong & Fung 2017, e.g., Fig. 1 in). We do not want such inclination-based intensity variations to be confused with intensity variations caused by a vortex. To define the contrast of the vortex at , we normalize the convolved images by that of a disk with an axisymmetric surface density distribution at the same inclination. The latter disk has the same radial surface density profile as in the vortex disk model; in other words it is the azimuthally averaged version of the model. The synthetic images of these axisymmetric disk models are shown in Fig. 5. The peak of the vortex in those “normalized” images, which we defined as “contrast”, is labeled on the panels.

Due to the confusion with inclination-based azimuthal variations, it can be difficult to recognize the vortex in the convolved images when it is on the disk minor axis (PA or 180∘) and at higher inclinations. When the vortex is away from the disk minor axis, the asymmetry with respect to the minor axis facilitates its identification. The absolute surface brightness of the vortex depends on its position angle; for example, it is brighter when it is on the near side (PA) due to the forward scattering of dust. In addition, it is easier to separate the vortex from the bright inner disk when the vortex is on the major axis due to projection effects. Meanwhile, the contrast of the vortex does not sensitively depend on its position angle. At the vortex is always 60%% brighter than the same region in the axisymmetric model; at the vortex is slightly less prominent, being 50%% brighter at all PAvortex except at (near side), where it is only 30% brighter. Such contrasts are well detectable in scattered light imaging observations of bright disks.
There are two features in our synthetic images that are worth highlighting. First, the vortex casts a shadow in the outer disk. The vortex is brighter than the surrounding because it has a higher surface (defining as the optical depth surface from the star at the observing wavelength), thus better illuminated (Takami et al. 2014). While the outer disk beyond the radius of the vortex is faint overall as the region is shadowed by the ring of material at the deadzone transition region (Ueda et al. 2019), the vortex produces an enhanced shadow in the outer disk at its position angle. This is best seen at face-on, when the outer disk is free from inclination-induced azimuthal variations (right panel, Fig. 2). Meanwhile it is also visible in inclined disks (see the normalized convolved images in Fig. 4). The presence of this shadow may provide additional evidence for the vortex. Similar shadow features in the outer disk caused by locally elevated disk surface have been seen in the case of circumplanetary disks (Weber et al. 2021).
Secondly, at the appearance of the vortex may be confused with a one-armed spiral when it is not on the minor axis. In principle, the vortex arc is part of a circle with zero pitch angle (the angle between the elongation of the arc and the azimuth). In inclined disks, however, axisymmetric density features may not center on the star in scattered light (Ginski et al. 2016). Thus it is difficult to tell whether the pitch angle of an arc-like feature is zero or not. In general the “true” face-on view of a disk in scattered light cannot be restored from an actual observation by performing a simple deprojection (Fig. 6; also see Dong et al. 2016), unless the shape of the disk surface in scattered light is well known (Stolker et al. 2016a). A circular arc may thus be confused from a “one-armed spiral”, particularly at high inclinations.

The two features can both be seen in the HD 34282 disk. In Fig. 7 we compare the SPHERE NIR scattered light image of the disk with our model image at the same viewing angle. A one-armed spiral (feature B1 in de Boer et al. 2021; Quiroz et al. 2021) has been identified in the HD 34282 disk. The feature appears similar to the vortex in our model. In addition, the East side of the HD 34282 disk outside the one-arm spiral is fainter than the West side at the same radii. This feature matches well with the shadow cast by the vortex in the model. Excitingly, the HD 34282 disk is a ring disk in mm continuum emission, and the ring harbors an azimuthally asymmetric structure (van der Plas et al. 2017), roughly coinciding with the one-armed spiral in scattered light (see the ALMA contours). Because mm continuum emission is expected to originate from a thin layer of dust at the disk midplane, the small difference between the two structures in location (visible in the left panel in Fig. 7) may be caused by the the difference between a surface feature (the NIR one-armed spiral) and a midplane feature (the mm azimuthal asymmetry) in a projected view (Dong et al. 2018, Fig. 4 in). These observations suggest that the feature may be a vortex.

IV Summary and Discussions
In this work we carry out 2D hydrodynamic simulations of protoplanetary disks, in which the Rossby wave instability is excited at a deadzone edge to form vortices (Fig. 1). We post-process the model with the strongest vortex in radiative transfer simulations to produce synthetic -band polarized scattered light images. Our results show that imaging observations today using instruments such as VLT/SPHERE, Subaru/SCExAO, and Gemini/GPI are capable of detecting vortices in near-infrared scattered light.
At face-on, at its peak the vortex in the model H-SH appears as a radially narrow circular arc with its peak surface brightness higher than the azimuthally averaged background at the same radius (Figs. 2 and 3). In inclined disks (Fig. 4), we define the contrast of the vortex by normalizing the images of vortex disk models with images of disks that are axisymmetric in density distribution (Fig. 5), as even the latter have azimuthal variations caused by a finite inclination. We find at most viewing angles the vortex peak is brighter than the same region in the axisymmetric disk model ( and columns in Fig. 4). The vortex is the weakest when it is on the near side and in a highly inclined disk. We note that the vortex in our model is at its peak, and its contrast is expected to be weaker at other times.
We identify two interesting features. First, a vortex casts a shadow in the outer disk (rightmost panel in Fig. 2). Secondly, a vortex in an inclined disk may mimic a one-armed spiral (Fig. 4). Both features have been seen in scattered light observations of the HD 34282 disk (Fig. 7), which has a one-armed spiral with a shadowed region on the outside (de Boer et al. 2021; Quiroz et al. 2021). The HD 34282 disk also harbors a mm continuum emission clump at roughly the same location as the one-armed spiral (van der Plas et al. 2017, left panel in Fig. 7;). All evidence support that the feature may be a vortex. Vortex-like features in scattered light observations have been identified in other disks as well. For example, the feature at and position angle in HD 143006 disk (Benisty et al. 2018) appears similar to our vortex at a low inclination.
We implement a few simplifications that can be improved in future works to make models more realistic. In addition to deadzone edges, vortices may also form at the edges of planet-opened gaps (Hammer et al. 2021). While the basic physics in the excitation of the RWI is similar in both cases (Ono et al. 2016), planets may deplete the inner disk, resulting in better illumination of the gap edge and the vortex by the star (Dong et al. 2015). We expect the azimuthal profiles and contrasts of the vortex in our models to remain robust, while the exact visibility of vortices in the case of planet-opened gaps needs to be further quantified. Also, while the vortex structure is similar in 2D and in 3D, in the latter case vortices may be subject to and destroyed by the elliptical instability (Lesur & Papaloizou 2009, the instability growth rate tends to be low for elongated vortices as in our models). Finally, our models have low masses, and disk self-gravity is ignored. For massive disks, self-gravity may modify the structure of vortices (Lin & Papaloizou 2011, e.g.,).
As we argue in §I, a promising way to test whether azimuthal asymmetries observed in disks in mm continuum emission are vortices is to compare the observed morphology of putative vortices in NIR scattered light to simulations. While we defer modeling individual objects to a future work, we sketch a possible path forward. For a specific system, the structure of the gas vortex candidate may be constrained by analysing gas observations (Muto et al. 2015, e.g.,), or by comparing models and observations in mm continuum emission (Lyra & Lin 2013; Zhu & Stone 2014, e.g.,). Next, simulations can be carried out to produce the corresponding vortex morphology in scattered light. For relatively face-on disks with azimuthal asymmetries such as SAO 206462 (Pinilla et al. 2015; van der Marel et al. 2016, e.g.,) and MWC 758 (Isella et al. 2010; Marino et al. 2015; Boehler et al. 2018; Casassus et al. 2019, e.g.,), comparing models to observations is straightforward in principle. However, observations often reveal additional features, such as spirals and shadows (Muto et al. 2012; Grady et al. 2013; Garufi et al. 2013; Benisty et al. 2015; Stolker et al. 2016b, e.g.,), which need to be “subtracted” to facilitate the characterization of the vortex. In disks at higher inclinations, azimuthally averaged gas profiles may be obtained from gas observations to enable the production of axisymmetric disk models equivalent to Fig. 5. By comparing such models with observations, normalized scattered light maps similar to the ones in the and columns in Fig. 4 can be produced to examine the contrast of the features at the locations of the vortex candidates.
Acknowledgments
We thank Xue-Ning Bai, Logan Francis, Pinghui Huang, Min-kai Lin, Brodie Norfolk, Bin Ren, Jessica Speedie, and Gerrit van der Plas for useful discussions and help. Computations were performed on the supercomputers provided by ComputeCanada. R.D. is supported by the Natural Sciences and Engineering Research Council of Canada and the Alfred P. Sloan Foundation. This paper makes use of data from ALMA programme 2013.1.00658.S. ALMA is a partnership of ESO (representing its member states), NSF (USA) and NINS (Japan), together with NRC (Canada) and NSC and ASIAA (Taiwan), in cooperation with the Republic of Chile. The Joint ALMA Observatory is operated by ESO, AUI/NRAO and NAOJ. The National Radio Astronomy Observatory is a facility of the National Science Foundation operated under cooperative agreement by Associated Universities, Inc.
References
- Andrews (2020) Andrews, S. M. 2020, ARA&A, 58, 483
- Andrews et al. (2018) Andrews, S. M., Huang, J., Pérez, L. M., et al. 2018, ApJ, 869, L41
- Bai & Stone (2010) Bai, X.-N., & Stone, J. M. 2010, ApJ, 722, 1437
- Baruteau & Zhu (2016) Baruteau, C., & Zhu, Z. 2016, MNRAS, 458, 3927
- Baruteau et al. (2019) Baruteau, C., Barraza, M., Pérez, S., et al. 2019, MNRAS, 486, 304
- Benisty et al. (2015) Benisty, M., Juhasz, A., Boccaletti, A., et al. 2015, A&A, 578, L6
- Benisty et al. (2018) Benisty, M., Juhász, A., Facchini, S., et al. 2018, A&A, 619, A171
- Benítez-Llambay & Masset (2016) Benítez-Llambay, P., & Masset, F. S. 2016, ApJS, 223, 11
- Birnstiel et al. (2013) Birnstiel, T., Dullemond, C. P., & Pinilla, P. 2013, A&A, 550, L8
- Boehler et al. (2018) Boehler, Y., Ricci, L., Weaver, E., et al. 2018, ApJ, 853, 162
- Boehler et al. (2021) Boehler, Y., Ménard, F., Robert, C. M. T., et al. 2021, A&A, 650, A59
- Calcino et al. (2019) Calcino, J., Price, D. J., Pinte, C., et al. 2019, MNRAS, 490, 2579
- Casassus et al. (2013) Casassus, S., van der Plas, G., Perez, S., et al. 2013, Nature, 493, 191
- Casassus et al. (2019) Casassus, S., Marino, S., Lyra, W., et al. 2019, MNRAS, 483, 3278
- de Boer et al. (2021) de Boer, J., Ginski, C., Chauvin, G., et al. 2021, A&A, 649, A25
- Dong & Fung (2017) Dong, R., & Fung, J. 2017, ApJ, 835, 146
- Dong et al. (2016) Dong, R., Fung, J., & Chiang, E. 2016, ApJ, 826, 75
- Dong et al. (2015) Dong, R., Zhu, Z., & Whitney, B. 2015, ApJ, 809, 93
- Dong et al. (2012) Dong, R., Rafikov, R., Zhu, Z., et al. 2012, ApJ, 750, 161
- Dong et al. (2017) Dong, R., van der Marel, N., Hashimoto, J., et al. 2017, ApJ, 836, 201
- Dong et al. (2018) Dong, R., Liu, S.-y., Eisner, J., et al. 2018, ApJ, 860, 124
- Flock et al. (2015) Flock, M., Ruge, J. P., Dzyurkevich, N., et al. 2015, A&A, 574, A68
- Francis & van der Marel (2020) Francis, L., & van der Marel, N. 2020, ApJ, 892, 111
- Garufi et al. (2013) Garufi, A., Quanz, S. P., Avenhaus, H., et al. 2013, A&A, 560, A105
- Ginski et al. (2016) Ginski, C., Stolker, T., Pinilla, P., et al. 2016, A&A, 595, A112
- Grady et al. (2013) Grady, C. A., Muto, T., Hashimoto, J., et al. 2013, ApJ, 762, 48
- Hallam & Paardekooper (2020) Hallam, P. D., & Paardekooper, S. J. 2020, MNRAS, 491, 5759
- Hammer et al. (2017) Hammer, M., Kratter, K. M., & Lin, M.-K. 2017, MNRAS, 466, 3533
- Hammer et al. (2021) Hammer, M., Lin, M.-K., Kratter, K. M., & Pinilla, P. 2021, MNRAS, 504, 3963
- Hammer et al. (2019) Hammer, M., Pinilla, P., Kratter, K. M., & Lin, M.-K. 2019, MNRAS, 482, 3609
- Huang et al. (2019) Huang, P., Dong, R., Li, H., Li, S., & Ji, J. 2019, ApJ, 883, L39
- Huang et al. (2018) Huang, P., Isella, A., Li, H., Li, S., & Ji, J. 2018, ApJ, 867, 3
- Isella et al. (2010) Isella, A., Natta, A., Wilner, D., Carpenter, J. M., & Testi, L. 2010, ApJ, 725, 1735
- Isella et al. (2013) Isella, A., Pérez, L. M., Carpenter, J. M., et al. 2013, ApJ, 775, 30
- Kim et al. (1994) Kim, S.-H., Martin, P. G., & Hendry, P. D. 1994, ApJ, 422, 164
- Lesur & Papaloizou (2009) Lesur, G., & Papaloizou, J. C. B. 2009, A&A, 498, 1
- Li et al. (2001) Li, H., Colgate, S. A., Wendroff, B., & Liska, R. 2001, ApJ, 551, 874
- Li et al. (2000) Li, H., Finn, J. M., Lovelace, R. V. E., & Colgate, S. A. 2000, ApJ, 533, 1023
- Li et al. (2019) Li, R., Youdin, A. N., & Simon, J. B. 2019, ApJ, 885, 69
- Li et al. (2020) Li, Y.-P., Li, H., Li, S., et al. 2020, ApJ, 892, L19
- Lin (2012a) Lin, M.-K. 2012a, ApJ, 754, 21
- Lin (2012b) —. 2012b, MNRAS, 426, 3211
- Lin (2014) —. 2014, MNRAS, 437, 575
- Lin & Papaloizou (2011) Lin, M.-K., & Papaloizou, J. C. B. 2011, MNRAS, 415, 1426
- Lin & Pierens (2018) Lin, M.-K., & Pierens, A. 2018, MNRAS, 478, 575
- Liu (2019) Liu, H. B. 2019, ApJ, 877, L22
- Long et al. (2018) Long, F., Pinilla, P., Herczeg, G. J., et al. 2018, ApJ, 869, 17
- Lyra & Lin (2013) Lyra, W., & Lin, M.-K. 2013, ApJ, 775, 17
- Marino et al. (2015) Marino, S., Casassus, S., Perez, S., et al. 2015, ApJ, 813, 76
- Meheut et al. (2010) Meheut, H., Casse, F., Varniere, P., & Tagger, M. 2010, A&A, 516, A31
- Meheut et al. (2012) Meheut, H., Meliani, Z., Varniere, P., & Benz, W. 2012, A&A, 545, A134
- Muro-Arena et al. (2020) Muro-Arena, G. A., Benisty, M., Ginski, C., et al. 2020, A&A, 635, A121
- Muto et al. (2012) Muto, T., Grady, C. A., Hashimoto, J., et al. 2012, ApJ, 748, L22
- Muto et al. (2015) Muto, T., Tsukagoshi, T., Momose, M., et al. 2015, PASJ, 67, 122
- Ono et al. (2016) Ono, T., Muto, T., Takeuchi, T., & Nomura, H. 2016, ApJ, 823, 84
- Pérez et al. (2014) Pérez, L. M., Isella, A., Carpenter, J. M., & Chandler, C. J. 2014, ApJ, 783, L13
- Pinilla et al. (2015) Pinilla, P., van der Marel, N., Pérez, L. M., et al. 2015, A&A, 584, A16
- Pinilla et al. (2018) Pinilla, P., Benisty, M., de Boer, J., et al. 2018, ApJ, 868, 85
- Quiroz et al. (2021) Quiroz, J., Wallack, N. L., Ren, B., et al. 2021, arXiv e-prints, arXiv:2111.12708
- Ragusa et al. (2017) Ragusa, E., Dipierro, G., Lodato, G., Laibe, G., & Price, D. J. 2017, MNRAS, 464, 1449
- Regály et al. (2012) Regály, Z., Juhász, A., Sándor, Z., & Dullemond, C. P. 2012, MNRAS, 419, 1701
- Ren et al. (2021) Ren, B., Choquet, É., Perrin, M. D., et al. 2021, ApJ, 914, 95
- Richard et al. (2013) Richard, S., Barge, P., & Le Dizès, S. 2013, A&A, 559, A30
- Robert et al. (2020) Robert, C. M. T., Méheut, H., & Ménard, F. 2020, A&A, 641, A128
- Shakura & Sunyaev (1973) Shakura, N. I., & Sunyaev, R. A. 1973, A&A, 24, 337
- Stolker et al. (2016a) Stolker, T., Dominik, C., Min, M., et al. 2016a, A&A, 596, A70
- Stolker et al. (2016b) Stolker, T., Dominik, C., Avenhaus, H., et al. 2016b, A&A, 595, A113
- Takami et al. (2014) Takami, M., Hasegawa, Y., Muto, T., et al. 2014, ApJ, 795, 71
- Ueda et al. (2019) Ueda, T., Flock, M., & Okuzumi, S. 2019, ApJ, 871, 10
- van der Marel et al. (2016) van der Marel, N., Cazzoletti, P., Pinilla, P., & Garufi, A. 2016, ArXiv e-prints, arXiv:1607.05775
- van der Marel et al. (2019) van der Marel, N., Dong, R., di Francesco, J., Williams, J. P., & Tobin, J. 2019, ApJ, 872, 112
- van der Marel et al. (2013) van der Marel, N., van Dishoeck, E. F., Bruderer, S., et al. 2013, Science, 340, 1199
- van der Marel et al. (2021) van der Marel, N., Birnstiel, T., Garufi, A., et al. 2021, AJ, 161, 33
- van der Plas et al. (2017) van der Plas, G., Ménard, F., Canovas, H., et al. 2017, A&A, 607, A55
- Weber et al. (2021) Weber, P., Casassus, S., & Pérez, S. 2021, MNRAS, arXiv:2111.12127
- Whitney et al. (2013) Whitney, B. A., Robitaille, T. P., Bjorkman, J. E., et al. 2013, ApJS, 207, 30
- Youdin & Johansen (2007) Youdin, A., & Johansen, A. 2007, ApJ, 662, 613
- Zhu & Stone (2014) Zhu, Z., & Stone, J. M. 2014, ApJ, 795, 53
- Zhu et al. (2014) Zhu, Z., Stone, J. M., Rafikov, R. R., & Bai, X.-n. 2014, ApJ, 785, 122
- Zhu et al. (2019) Zhu, Z., Zhang, S., Jiang, Y.-F., et al. 2019, ApJ, 877, L18