Thermal Comptonization in a changing corona in the changing-look active galaxy NGC 1566Facilities: XMM-Newton, NuSTAR, SwiftHEAsoft (Nasa High Energy Astrophysics Science Archive Research Center (2014) Heasarc) XSPEC (Arnaud 1996), SAOImageDS9 (Joye & Mandel 2003), SAS (v18.0.0; Gabriel et al. 2004)
Abstract
We present broadband UV/X-ray spectral variability of the changing-look active galactic nucleus NGC 1566 based on simultaneous near-ultraviolet (NUV) and X-ray observations performed by XMM-Newton, Swift, and NuSTAR satellites at five different epochs during the declining phase of the 2018 outburst. We found that the accretion disk, soft X-ray excess, and the X-ray power-law components were extremely variable. Additionally, the X-ray power-law flux was correlated with both the soft excess plus disk, and the pure disk fluxes. Our finding shows that at high flux levels the soft X-ray excess and the disk emission both provided the seed photons for thermal Comptonization in the hot corona, whereas at low flux levels where the soft excess was absent, the pure disk emission alone provided the seed photons. The X-ray power-law photon-index was only weakly variable () and it was not well correlated with the X-ray flux over the declining timescale. On the other hand, we found that the electron temperature of the corona increased from to with decreasing number of seed photons from June 2018 to August 2019. At the same time, the optical depth of the corona decreased from to , and the scattering fraction increased from to . These changes suggest structural changes in the hot corona such that it grew in size and became hotter with decreasing accretion rate during the declining phase. The AGN is most likely evolving with decreasing accretion rate towards a state similar to the low/hard state of black hole X-ray binaries.
Keywords:
Galaxy: center–X-rays: galaxies–galaxies: active–galaxies: Seyfert–galaxies: individual: NGC 1566I Introduction
The primary emission from type 1 active galactic nuclei (AGNs) comprises a big-blue-bump in the optical/ultraviolet (UV) band, soft X-ray excess below , and power-law X-ray continuum with a high energy cut-off in the range of (Fabian et al. 2015; Tortosa et al. 2018, see). These components are thought to arise from the central engine of AGNs that consists of an accretion disk surrounding the supermassive black-hole (SMBH), and a hot corona. It is believed that the UV photons produced at the innermost regions of the disk via the accretion of matter interact with the hot corona, and are repeatedly up-scattered by the coronal energetic electrons to the X-rays (Sunyaev & Titarchuk 1980; Haardt & Maraschi 1991; Haardt & Maraschi 1993). The spectral shape of the Comptonized X-ray emission is well approximated as a power-law with a high energy cut-off. The photon-index of the power-law component is determined by the physical properties such as optical depth and temperature of the corona, whereas the high energy cut-off is generally 2–3 times of the electron temperature (Petrucci et al. 2000; Petrucci et al. 2001, see). The high energy cut-offs observed in a number of AGNs support the Comptonization scenario in the hot corona (Fabian et al. 2015; Lubiński et al. 2016; Ricci et al. 2017; Tortosa et al. 2018, see). Also, a correlation between the photon-index and the X-ray power-law flux found in several Seyfert type AGNs is interpreted in terms of thermal Comptonization, in which increased seed photons from the disk cool the hot corona (Zdziarski et al. 2003; Sobolewska & Papadakis 2009, see).
The primary X-ray power-law component then illuminates the disk, interacts with the disk matter, thus gives rise to the iron K features in the 6–7 keV band, Compton reflection hump above 10 keV (Fabian et al. 2000), and perhaps some fraction of the soft X-ray excess below 2 keV (Crummy et al. 2006; Nardini et al. 2011; Nardini et al. 2012; Walton et al. 2013). Alternatively, the soft X-ray excess may also arise due to thermal Comptonization of the disk photons in a warm and optically thick corona (Dewangan et al. 2007; Done et al. 2012; Mehdipour et al. 2015; Petrucci et al. 2018; Petrucci et al. 2020, see).
There are only a few direct observational evidences for thermal Comptonization of the disk seed photons in the hot corona. For example, using one month long IUE and RXTE data on NGC 7469, Nandra et al. 2000 found a correlation between the X-ray power-law photon-index and the UV flux, and interpreted in terms of cooling of the corona with the increasing UV flux (Petrucci et al. 2004, also see). Gliozzi et al. 2013 found that the photon-index of the X-ray power-law component increases with the flux in an X-ray bright radio-loud narrow-line Seyfert 1 (NLS1) galaxy PKS 0558-504, and suggested that the soft X-ray excess is the source of seed photons for the thermal Comptonization. Recently, using simultaneous near-ultraviolet (NUV) and X-ray data of a bright Seyfert 1.2 AGN IC 4329A acquired by AstroSat, Tripathi et al. 2021 found the steepening of the X-ray power-law ( to ) with increasing NUV flux and interpreted this as the cooling of the corona from to (at an optical depth ). Here, we investigate thermal Comptonization in a changing-look AGN (CL-AGN) NGC 1566 using multiple sets of broadband UV/X-ray observations. There is no evidence for variable obscuration in NGC 1566, and its changing-look behavior has been attributed to intrinsic variability (Parker et al. 2019; Oknyansky et al. 2019; Tripathi & Dewangan 2022, see)
NGC 1566 is the nearest (z = 0.00502) CL-AGN that exhibited an outburst during 2017–2018 with the outburst peak during June–July 2018 (see, Parker et al. 2019; Oknyansky et al. 2019 and references therein). During the outburst, the accretion disk, the soft X-ray excess, and the X-ray power-law fluxes increased by factors of , , and , respectively, and the accretion disk and the soft excess fluxes have been found to be correlated with the X-ray power-law flux (Tripathi & Dewangan 2022, see). Using the multi-epoch X-ray (0.5–70 keV) data of NGC 1566, Jana et al. 2021 found that the temperature of the hot corona to increase from to during the declining phase of the outburst from June 2018 to August 2019. Here, we study broadband UV–X-ray spectral variability with improved thermal Comptonisation model and accounting for both blurred and distant reflection emission, and then investigate the effect of drastically varying accretion disk and soft X-ray excess emission on the coronal properties during the declining phase of the 2018 outburst. The joint UV/X-ray spectral analyses will reveal not only the nature of the seed photons and their connection to the hot corona, but also the intrinsic variability of the hot corona during the outburst. In particular, the extreme X-ray variability of NGC 1566 will allow us to decouple the optical depth and temperature of the hot corona using the broadband data, and investigate their variations possibly caused by the changes in the corona.
II Observation and data reduction
We analyze the simultaneous NUV/X-ray data on NGC 1566 acquired by XMM-Newton (Jansen et al. 2001), NuSTAR (Harrison et al. 2013), and the Neil Gehrels Swift Observatory (Gehrels et al. 2004). Jana et al. 2021 have analyzed these X-ray data but they did not use the simultaneous NUV data. Parker et al. 2019 and Tripathi & Dewangan 2022 have analyzed the XMM-Newton data acquired on 26 June 2018 (outburst peak). Here, we use five broadband ( Å to ) data sets acquired with simultaneous observations at the NUV, soft and hard X-ray bands. We list the five sets of simultaneous UV/X-ray observations in Table 1.
| Observation | Date | XMM-Newton/EPIC-pn | NuSTAR/FPMA (B) | Swift/XRT | ||||||
|---|---|---|---|---|---|---|---|---|---|---|
| yyyy/mm/dd | ObsID | T | Rateb | ObsID | T | Ratec | ObsID | T | Rated | |
| Obs1 | 2018/06/26 | 0800840201 | 65 | 80301601002 | 57 | 1.59 (1.54) | ||||
| Obs2 | 2018/10/04 | 0820530401 | 74 | 80401601002 | 75 | 0.45 (0.42) | ||||
| Obs3 | 2019/06/05 | 0840800401 | 64 | 4.41 | 80502606002 | 57 | 0.29 (0.28) | |||
| Obs4 | 2019/08/18 | 60501031004 | 77 | 0.27 (0.26) | 00088910002 | 1.6 | ||||
| Obs5 | 2019/08/21 | 60501031006 | 86 | 0.29 (0.28) | 00088910003 | 1.9 | ||||
a The net exposure time in ks
b The net source count rate in the unit of count s-1 in the 0.5–10 keV band
c The net source count rate in the unit of count s-1 in the 3–78 keV band
d The net source count rate in the unit of count s-1 in the 0.5–7 keV band
II.1 XMM-Newton data
We reduced the XMM-Newton data using the Science Analysis System (SAS v18.0.0) software and the latest calibration files. The pn European Photon Imaging Camera (EPIC-pn; Strüder et al. 2001) was operated in the small window mode with thick filter during the June and October 2018 observations, and in the small window mode with medium filter during the June 2019 observation. We reprocessed the EPIC-pn data with epproc task. We did not notice strong flaring particle background in any of the EPIC-pn observations, therefore we did not filter the data for particle background. Further, we checked for the pile-up using epatplot task, and noticed pile-up in the June 2018 data only. Following Jana et al. 2021, we corrected for the pile-up by excluding events in an inner circular region of radius from the clean event lists. We extracted source spectrum from a circular region of radius centred at the source position and background spectrum from a circular region of radius from a source-free region for each observation. We generated the redistribution matrix (RMF) and ancillary response files (ARF) using rmfgen and arfgen tasks, respectively. We grouped the spectra to a minimum of 25 counts/bin and oversample = 5 using specgroup task. We list the net source count rate and the exposure time in Table 1 for each observation.
We also processed the Optical Monitor (OM; Mason et al. 2001) data from the three observations using the omichain task. We performed aperture photometry on the clean UVW2 (, ) and UVM2 (, ) images of the source, and derived the net source count rate using the omsource task. We then corrected the observed net source count rate for the Galactic extinction and the BLR/NLR contributions, and derived the intrinsic count rates of the source following the same procedure as mentioned in Tripathi & Dewangan 2022. We wrote these intrinsic count rates in the OGIP compliant spectral files derived using om2pha task.
II.2 NuSTAR data
We processed the NuSTAR data with nustardas version 2.1.1 and the latest calibration database (CALDB, version 20210728). We generated the clean event files for each observation using nupipeline task. We extracted the source spectrum from a circular region of radius centered at the source position and background spectrum from a source free circular region of radius using nuproduct task. We grouped each spectrum to have at least 25 counts per spectral bin. The net source count rate and the exposure time are listed in Table 1 for each observation.
II.3 Swift data
We processed the X-Ray Telescope (XRT; Burrows et al. 2005) data using the standard online tool (user_objects11 1 https://www.swift.ac.uk/user_objects/) developed by the Swiftt Science Data Centre, UK (Evans et al. 2009), and obtained the spectral data in the Photon-Counting (PC) mode. We grouped each spectral data set to have at least 20 counts per bin using grppha task. The net source count rate and the exposure time are listed in Table 1.
Further, we also used the clean NUV (below 3000Å) images of the source observed by the Ultra-Violet Optical Telescope (UVOT; Roming et al. 2005). We used the uvotsource task and performed the aperture photometry on the clean, processed images of the source in the UVW2 (, ) and UVM2 (, ) bands. We extracted source counts from a circular region of radius centered at the source position, and background counts from a similar size of nearby annular region. We corrected the UVOT count rates for the Galactic extinction. We estimated the fractional BLR/NLR contribution for the UVW2 and UVM2 filters to be using the effective areas of these filters (see Tripathi & Dewangan 2022). We subtracted these contributions from the Galactic extinction corrected count rates, and derived the intrinsic source count rates. We wrote these intrinsic count rates in the OGIP compliant spectral files generated by the uvot2pha task.
III Spectral analyses
We performed spectral analyses using xspec (v12.12.0) (Arnaud 1996). We used the -minimization technique and quoted errors on the best-fit spectral parameters. For the Galactic absorption, we used the tbabs model in xspec with a fixed equivalent hydrogen column density of (Kalberla et al. 2005). We used the abundance and absorption cross-sections from Asplund et al. 2009 and Verner et al. 1996, respectively.
| Model | Parameter | Obs1 | Obs2 | Obs3 | Obs4 | Obs5 |
| const | 1 (f) | 1 (f) | 1(f) | – | – | |
| (f) | ||||||
| – | – | – | 1 (f) | |||
| zxipcf | – | – | – | – | ||
| – | – | – | – | |||
| – | – | – | – | |||
| optxagnf | ||||||
| (keV) | – | – | ||||
| – | – | |||||
| 1 (f) | 1 (f) | |||||
| relxill | – | – | – | – | ||
| – | – | – | – | |||
| xillver | 4.6 (f) | 4.6 (f) | 4.6 (f) | 4.6 (f) | ||
| (keV) | 300 (f) | 300 (f) | 300 (f) | 300 (f) | 300 (f) | |
| 1676/1547 | 1258/1189 | 981/931 | 700/763 | 790/813 |
We began our spectral analyses by fitting the OM, EPIC-pn (0.5–10 keV), and the NuSTAR/FPMA & FPMB (3–70 keV) spectral data from the 26 June 2018 epoch (Obs1). We did not use the NuSTAR data above 70 keV due to the poor signal-to-noise ratio. We used a broadband continuum model optxagnf (Done et al. 2012) to fit the disk, soft X-ray excess, and the X-ray power-law components of the broadband UV/X-ray spectra. The main parameters of this model are mass of the SMBH ( in the unit of the solar mass ), comoving distance of the source ( in Mpc), Eddington ratio (), dimensionless spin parameter of the SMBH (), radius of the warm corona () in units of gravitational radius , outer disk radius ( in ), temperature ( in keV) and optical depth () of the warm corona, photon-index of the X-ray power-law component (), and the fraction of the power below emitted as the hard Comptonization component (). The optxagnf model utilizes the nthcomp (Zdziarski et al. 1996) model to fit the X-ray power-law component assuming the electron temperature of the hot corona fixed at (Done et al. 2012, see). We fixed the black-hole mass (Woo & Urry 2002), the comoving distance (Elagali et al. 2019), and outer disk radius . We also fixed the black-hole spin at the reported value of by Parker et al. 2019 and Jana et al. 2021.
Next, we used the relxill (García et al. 2014) and the xillver (García et al. 2013) model to fit the blurred and distant reflection features, respectively, as reported by Parker et al. 2019, Jana et al. 2021, and Tripathi & Dewangan 2022. The main parameters of the relxill model are emissivity index ( assuming a single emissivity profile , where is the radial distance), the black-hole spin (), inclination angle of the accretion disk (), inner and outer disk radii ( and in ), photon-index () of the incident X-ray power-law component, ionization parameter (), iron abundance ( in the solar unit), high energy cut-off ( in keV), reflection fraction (), and normalization (). The blurred reflection component (relxill) is weak in this source (see Parker et al. 2019 and Tripathi & Dewangan 2022), we therefore fixed the emissivity index at , the black-hole spin at , inclination angle at , and the inner disk radius at as reported by Parker et al. 2019. We also fixed the outer disk radius at , ionization parameter of the xillver model at , reflection fraction of the relxill and xillver models at and to fit the reflection spectrum only, and the iron abundance of both the reflection models at the best-fit value derived from the 04 October 2018 epoch (, see below and Table 2). We tied the photon index of the reflection models with that of the optxagnf model, and fixed the cut-off energy at assuming where is fixed at for the optxagnf model (Done et al. 2012). We allowed the and the normalizations of the reflection models , and to vary freely. We also fitted the weak warm absorption features present in this epoch (Parker et al. 2019, see) using a zxipcf model. We used a constant model for the cross-normalization between the EPIC-pn and the NuSTAR data. We fixed this parameter at for the EPIC-pn and the OM data, and allowed it to vary for the NuSTAR (FPMA & FPMB) data. Thus, our model is constanttbabszxipcf(optxagnf+ relxill+xillver) in xspec terminology. The fit with this model resulted in an statistically acceptable fit with for 1547 degrees of freedom ().
We also fitted the OM, EPIC-pn (0.5–10 keV), and NuSTAR/FPMA & FPMB (3–70 keV) data from the 04 October 2018 epoch (Obs2). We used the model constanttbabs(optxagnf+xillver). These data did not require the blurred reflection and the warm absorption components. We allowed to vary the parameters of the optxagnf model as before, and the iron abundance () and normalization () of the xillver model. The fit resulted in .
Similarly, we fitted the OM, UVOT, EPIC-pn (0.5–10 keV), and NuSTAR (3–50 keV) data from the 05 June 2019 epoch (Obs3). The source was at a low flux state in 2019 epochs, and the SNR of the NuSTAR data above 50 keV was poor. We therefore used the NuSTAR data below 50 keV for all the 2019 epochs. We used the model constanttbabs(optxagnf+xillver) to fit the broadband NUV/X-ray data. As before, we allowed to vary the parameters of the optxagnf model, and the normalization of the xillver component. The fit resulted in .
Further, we fitted the UVOT, XRT (0.5–7 keV), and NuSTAR (3–50 keV) data from the 18 August 2019 epoch (Obs4) using the constanttbabs(optxagnf+xillver) model. We did not notice the soft X-ray excess component in this epoch, and therefore fixed the parameter of optxagnf model at 1. We allowed other parameters to vary freely, as before. Here, we fixed the cross-normalization parameter at for the XRT and UVOT data, and allowed it to vary for the NuSTAR data. The fit resulted in .
Finally, we fitted the UVOT, XRT (0.5–6 keV), and NuSTAR (3–50 keV) data of the 21 August 2019 epoch (Obs5) with constanttbabs(optxagnf+xillver) model. Here also, we fixed the at 1 as the soft X-ray excess was absent. While fitting, we found that the cross-normalization parameter (constant) for the NuSTAR data to be relative to the XRT data. This is because the Swift observations were performed at the beginning of the NuSTAR observations when the source flux was times lower than the maximum value (see the XRT and NuSTAR/FPMA lightcurves in Figure A.1). Therefore, to calculate the best-fit parameters based on the long exposure NuSTAR data of the 21 August 2019 epoch, we fixed the constant at 1 for the NuSTAR/FPMA data, and allowed it to vary for the NuSTAR/FPMB and XRT data. The fit resulted in . The best-fit parameters for the five-epochs are listed in Table 2. As it can be seen that the normalization of the xillver model is not constant across the five epochs, especially for the first epoch this parameter is times larger than those of the 2019 epochs. Also, the photon-index of the X-ray power-law is low () for the first epoch. One reason could be the fixed electron temperature of the hot corona in the optxagnf model. We therefore further analysed the spectral data using more physically motivated models.
Here, our main motivation is to investigate variations in the hot corona i.e., variations in the coronal temperature and optical depth and any connection with the accretion rate and seed photon flux during the declining phase of the 2018 outburst when all emission components varied strongly (Tripathi & Dewangan 2022). We therefore used the thermal Comptonization model thcomp (Zdziarski et al. 2020) to describe the broadband X-ray power-law continuum. As before, we first fitted the 26 June 2018 data. We assumed that both the thermal emission from the accretion disk and the soft X-ray excess components to provide the seed photons for thermal Comptonization in the hot corona. We therefore used the optxagnf (Done et al. 2012) model to fit the accretion disk and the soft X-ray excess components only by fixing the . We allowed the Eddington ratio, temperature and optical depth of the warm corona, and the warm corona radius () to vary freely. We then Comptonized the disk and the soft excess emission by convolving with the thermal Comptonization model thcomp (Zdziarski et al. 2020), thus allowing us to describe the X-ray power-law component and determine the coronal properties. To use the thcomp convolution model, we extended the energy grid from to with the xspec command energies. We allowed to vary the thcomp parameters (photon index of the Comptonized X-ray power-law), (electron temperature of the hot corona), and (the scattering fraction where describing the fraction of the seed photons that are up-scattered). We chose instead of the optical depth of the corona to vary. We also used the relxill and the xillver models to fit the blurred and the distant reflection features, and the zxipcf model to fit the warm absorption. Thus, our model is constanttbabszxipcf(thcompoptxagnf+ relxill+xillver). The fit with this model resulted in . This fit is slightly better than the previous one when the cut-off energy was not a free parameter.
| Model | Parameter | Obs1 | Obs2 | Obs3 | Obs4 | Obs5 |
|---|---|---|---|---|---|---|
| const | 1 (f) | 1 (f) | 1(f) | – | – | |
| (f) | ||||||
| – | – | – | 1 (f) | |||
| zxipcf | – | – | – | – | ||
| – | – | – | – | |||
| – | – | – | – | |||
| thcomp | ||||||
| (keV) | ||||||
| optxagnf | ||||||
| (keV) | – | – | ||||
| – | – | |||||
| (%) | ||||||
| relxill | – | – | – | – | ||
| – | – | – | – | |||
| xillver | 5.1 (f) | 5.1 (f) | 5.1 (f) | 5.1 (f) | ||
| (f) | ||||||
| 1644/1546 | 1256/1188 | 982/930 | 700/761 | 795/812 |
= the optxagnf model flux (disk + soft excess) in the band in the unit of ergs cm-2 s-1
= the thcompoptxagnf model flux in the band in the unit of ergs cm-2 s-1
= the pure disk flux in the band in the unit of ergs cm-2 s-1 derived using the optxagnf parameters
= the Eddington ratio derived from the bolometric luminosity in the band.
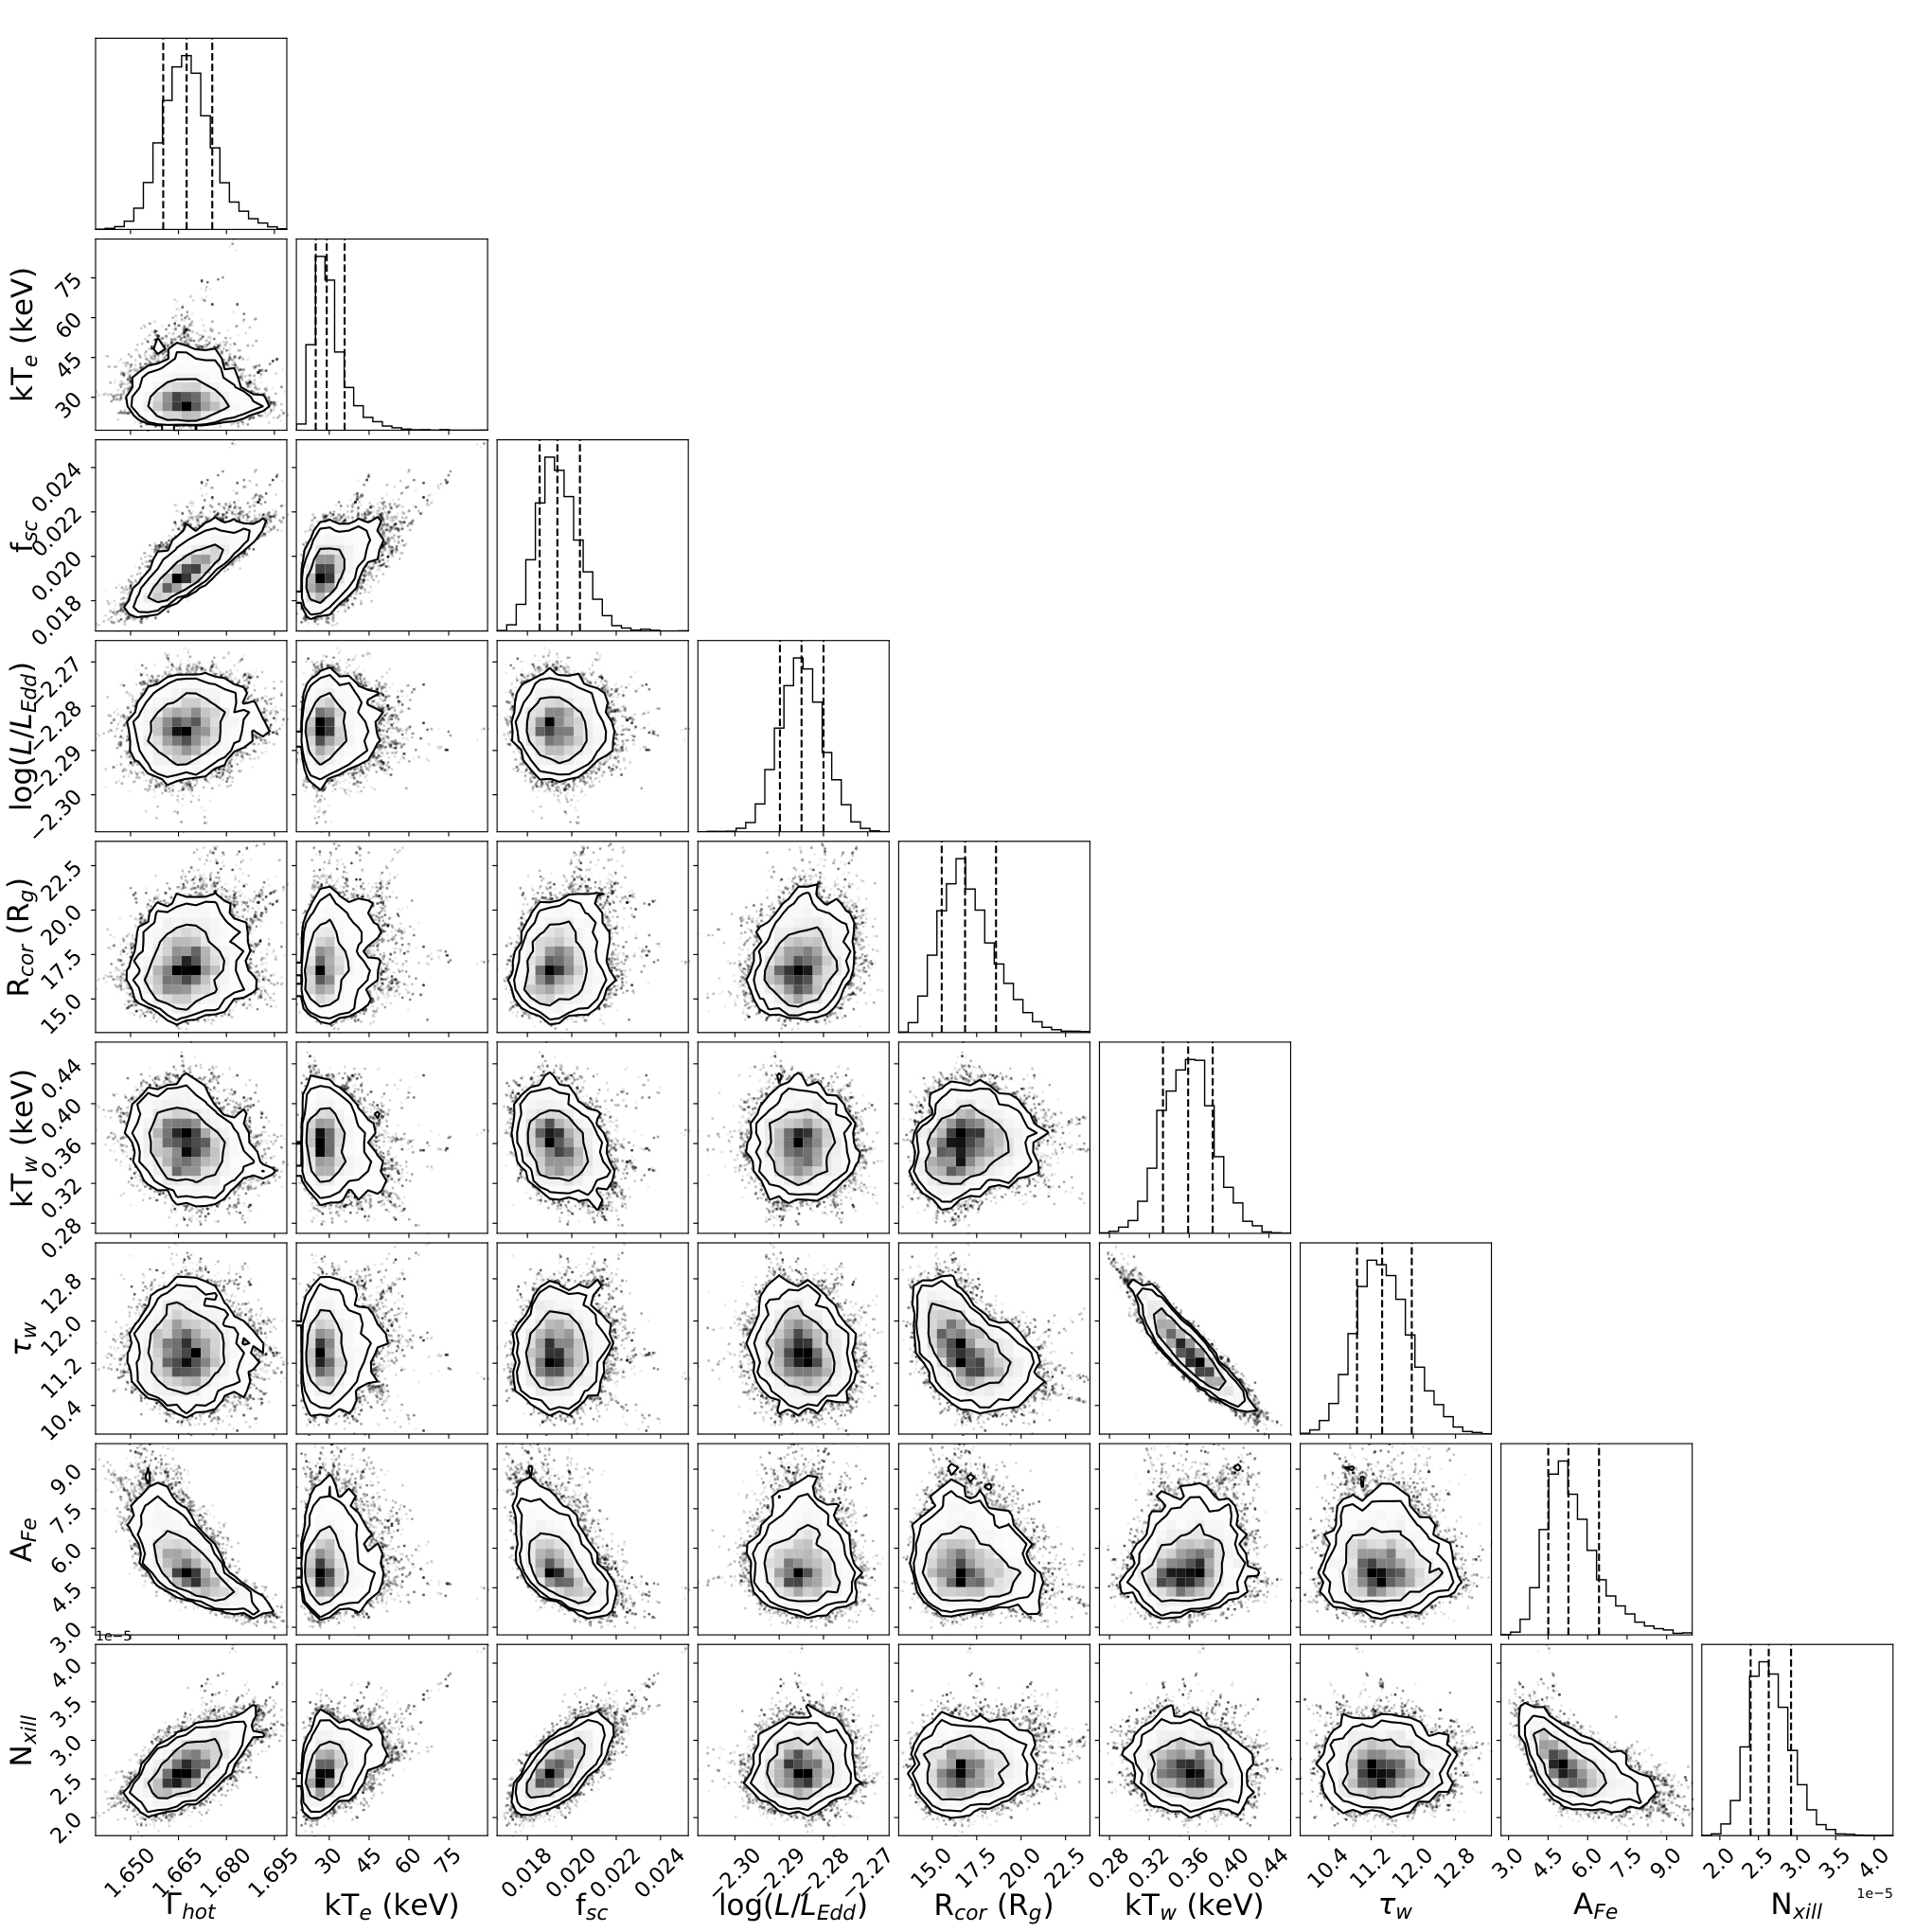
Similarly, we fitted the UV/X-ray spectral data from other four epochs following the same procedure mentioned above. Each time, we convolved the thcomp model with the optxagnf model to fit the X-ray power-law component. We have shown the best-fit models, spectral data, and the data to model ratios in Fig. 1 for all five epoch. We used the Morkov Chain Monte Carlo in xspec to calculate the errors on the best-fit parameters. We used the Goodman-Weare algorithm with 200 walkers and a total length of . We discarded first few thousands steps () of the chain to acquire steady state. We calculated errors using the chain. The best-fit parameters with the errors are listed in Table 3. The normalization of the xillver model is not variable across the five epochs, and the value of the X-ray power-law photon-index for the first epoch seems more reasonable (see Table 3). We have shown the contour plots for one epoch (04 October 2018) in Fig. A.2.
Further, we calculated the disk plus soft X-ray excess (seed) flux () from the best-fit optxagnf model in the band (where is the low energy end of the BBB component), and the X-ray power-law flux () from the thcompoptxagnf model in the band. Using the best-fit parameters ( and ) of the optxagnf model, we also calculated the pure disk flux () for June 2018, October 2018, and June 2019 epochs where the soft X-ray excess was also present. We also derived the intrinsic bolometric luminosity () of the source using the best-fit model (after removing the Galactic and the internal absorption components) in the band, and converted this into the Eddington ratio as for each epoch. We list these fluxes and Eddington ratios in Table 3.
We derived the optical depth of the corona using the best-fit electron temperature () and the X-ray power-law photon-index () (with their errors) using the following equation (Zdziarski et al. 1996; Życki et al. 1999)
| (1) |
where, is the mass of electron and is the speed of light. We have listed the optical depth of the corona in Table 3 which decreases from to during the declining phase of the outburst. Independently, we also calculated the optical depth of the hot corona by fitting the broadband spectral data of five epochs using the thcomp model. In the negative parameters space ( for values less than 0), the parameter of the thcomp model turns into the optical depth. We found the optical depth values derived from the two different methods to be consistent.
IV Results and Discussion
We analyzed the simultaneous NUV/X-ray data on NGC 1566 acquired by XMM-Newton, Swift, and NuSTAR from June 2018 to August 2019 at five different epochs. We found that the NUV/X-ray spectra of the source consist of a variable X-ray power-law with photon-index , soft X-ray excess emission below 2 keV, broad/narrow iron lines in the 6–7 keV band, a weak Compton reflection hump above 10 keV, warm absorbing component, and the accretion disk emission (BBB), thus confirming previous results (Parker et al. 2019; Oknyansky et al. 2019; Jana et al. 2021; Tripathi & Dewangan 2022, see). The photon indices of the X-ray power-law component derived in our analysis for the five epochs are consistent with those derived in Jana et al. 2021 by fitting the soft X-ray excess and the X-ray power-law components simultaneously using the optxagnf model. As we discuss below, our results on the broadband UV/X-ray spectral variability derived using the improved Comptonization model and accounting for both blurred and distant reflection have allowed us to probe the connection between the accretion disk and changes in the coronal properties.
In Fig. 2, we show the best-fitting spectral models (after removing the absorption components) derived from the five NUV/X-ray spectral data sets and extrapolated to bands. Clearly, the accretion disk, the soft X-ray excess, and the X-ray power-law components rapidly decreased during the declining phase of the outburst (see Fig. 2). In particular, the soft X-ray excess is more variable than the disk and the X-ray power-law components, which is consistent with our previous result (Tripathi & Dewangan 2022, see). The soft X-ray excess was maximum in 26 June 2018, which decreased in 04 October 2018, and became negligible in 2019 epochs. The decreasing soft X-ray excess with the decreasing accretion rate has been observed in other Seyferts (Boissay et al. 2016, see). The temperature of the warm corona responsible for the soft excess decreased from to , and the optical depth increased from to . Also, the radius of the warm corona decreased during the declining phase of the outburst. These results suggest that at least part of the warm corona converted to the standard disk in the inner regions. We have discussed the origin of the soft excess in terms of formation of the warm corona during the outburst in our previous work (Tripathi & Dewangan 2022, see). The extreme multi-wavelength variability of NGC 1566 has been interpreted with the radiation pressure instability in the inner disk (Parker et al. 2019; Sniegowska et al. 2020; Tripathi & Dewangan 2022, see).
In Fig. 3, we show variations in the best-fitting spectral parameters with time relative to the first observation, 26 June 2018. Fig. 3(a) shows the variations in the Eddington ratio that decreased from (at the outburst peak) to in days in the declining phase. The variable Eddington ratio during the outburst has been discussed in the context of the radiation pressure instability in the disk (Parker et al. 2019; Sniegowska et al. 2020; Tripathi & Dewangan 2022, see). In the (b) and (c) panels of Fig. 3, we have shown the seed (disk plus soft excess) flux () and the standard disk flux (), respectively. The and decreased by factors of and . This implies that the variability in the was mostly dominated by the soft X-ray excess component. This is much clear in Fig. 3(d) where we have shown the ratio of the disk flux to the total seed flux (). This ratio increased with time, and saturated at (shown as the black horizontal dashed line) during the August 2019 observations. This indicates that during the high flux states, the soft excess and the disk emission both provided the seed photon for thermal Comptonization in the hot corona, but a larger contribution came from the soft excess than the pure disk emission which made the corona to be sufficiently cooler at the outburst-peak (). The strong soft excess may be responsible for the low temperature of the hot corona in some narrow-line Seyfert 1 galaxies e.g., in Akn 564 (Kara et al. 2017; Barua et al. 2020), in IRAS 04416+1215 (Tortosa et al. 2022), in Mrk 110 (Porquet et al. 2021), in ESO 362-G18 (Xu et al. 2021). The broadband X-ray power-law flux in the 2–500 keV band () decreased by a factor of from June 2018 to August 2019 (Fig. 3(e). The variability of is well correlated with the variability of and (see the panels (b), (c) and (e) of Fig. 3). Fig. 4) shows relationship between different parameters. The showed exactly the same trends with and . The decreasing X-ray power-law flux with the seed flux can be interpreted as due to thermal Comptonization of the seed photons in the hot corona where the decreasing number of seed photons is not able to cool the corona effectively that also results in decreasing number of Comptonized X-ray photons (Nandra et al. 2000; Tripathi et al. 2021, see). The cooling or heating of the corona can also affects the shape of the Comptonized X-ray photons according to Equation 1. In case of NGC 1566, we found that the X-ray power-law photon-index was only weakly variable by (see Fig. 3(f)), and it was not noticeably correlated with the (see the middle panel in Fig. 4). On the other hand, the optical depth of the corona decreased from to (see Fig. 3(g)), the covering fraction () increased from to (see Fig. 3(h)), and the electron temperature () of the corona increased from to (see Fig. 3(i)) during the declining phase of the outburst. Thus, the increasing electron temperature and decreasing optical depth of the hot corona resulted in only weakly varable the photon-index according to Eqn. 1. Further, the bottom panels in Fig. 4 show that the electron temperature of the corona was anti-correlated with the and the indicating that the corona became hotter with the decreasing seed photons. This is a clear evidence for thermal Comptonization in the hot corona.
The observed variations in the scattering fraction and the optical depth suggest changes in the the geometry of the hot corona during the declining phase of NGC 1566. The scattering fraction depends on the electron density and the size of the hot corona. A bigger corona will intercept a larger fraction of the seed photons resulting in a larger scattering fraction . Similarly a larger electron density will provide a larger number of targets for the inverse Compton scattering of seed photons which will result in larger . Since the decreasing resulted in the declining soft excess emission, presumably due to the shrinking warm corona, it is likely that the size of the hot corona increased at the expense of shrinking soft excess emitting region during the declining phase, hence resulting in increasing . However, with the increasing size, the optical depth of the hot corona will also increase unless the electron density decreases. Most likely the decreasing accretion rate also resulted in decreasing fraction of accretion power fed to the corona, which was sufficient to maintain the electron density with increasing corona size. This ultimately may have caused in a faster decrease in the electron density than the increase in the corona size both due to decreasing accretion power and increasing size of the corona, and thus resulting in decreasing optical depth as observed. In Fig. 5, we show a schematic picture of possible evolution of the warm (light blue bar) and hot (central spherical region)) corona. The electrons randomly distributed in the hot corona are shown as dark blue dots that decrease from June 2018 to 21 August 2019. With decreasing accretion rate, the disk flux, the soft excess flux and the seed photons all decreased during the declining phase of NGC 1566. The decreasing number of seed photons then was not able to cool the hot corona, and most likely was responsible for the increasing temperature of the hot corona as observed (see Fig. 5 and the bottom panels of Fig. 4). The combination of a decreasing optical depth and increasing temperature of the corona then resulted in only minor change in the photon index of the X-ray power law (see Fig. 3 [f] and equation 1). In the high flux states of NGC 1566, the presence of soft X-ray excess suggests that the innermost regions of the disk is filled by the optically thick material in the form of a warm corona. The optically thick warm corona can be considered as the inner part of the accretion disk. In that case, in the high flux state, the accretion disk seems to extend down to the innermost regions. This state is similar to the high/soft state of black hole X-ray binaries (BHBs) in which thermal emission from the disk is dominated (Belloni & Motta 2016, see). Whereas, in the lowest flux states of NGC 1566 in August 2019, the standard disk without the soft excess emitting region appears to be truncated at , and the corona is most likely filling the innermost regions below the truncation radius, and the source may be evolving with decreasing accretion rate towards a state similar to the low/hard state of BHBs. The emission from the low/hard state of BHBs is dominated by X-ray power law components with reduced or negligible thermal emission from the accretion disk. It is believed that the accretion disks in these objects is most likely truncated at large radii (McClintock et al. 2001; Esin et al. 2001; Belloni & Motta 2016, see).
Another possibility to explain the increasing and decreasing is to decrease the size of the hot corona and increase the electron density faster than the decrease in the size of the hot corona which may require increase in accretion power fed to the corona. This is unlikely as the accretion power is observed to be decreasing during the declining phase.
V conclusion
The main results of our broadband UV to X-ray spectral variability study of NGC 1566 are as follows.
- •
The accretion disk, soft X-ray excess, and the X-ray power-law components were extremely variable during the declining period of the outburst. The soft excess was maximum in June 2018, which reduced in October 2018, and became negligible in 2019 epochs.
- •
The broadband power-law flux was correlated with the soft excess plus disk flux suggesting thermal Comptonization of both the soft excess and the disk photons in the hot corona.
- •
At the high flux levels when the soft excess was present, both the soft excess and the disk components provided the seed photons for thermal Comptonization in the hot corona, whereas at the low flux levels when the soft excess was absent, the pure disk emission alone provided the seed photons.
- •
We found that the photon-index of the X-ray power-law was only weakly variable (), and it was not well correlated with the X-ray power-law flux.
- •
The electron temperature of the corona increased from to with decreasing seed flux from June 2018 to August 2019. The low temperature of the corona at the outburst peak is most likely due to the cooling effect of the strong soft excess, and the disappearance of the soft excess and the decreasing disk flux most likely could not cool the corona effectively.
- •
The scattering fraction increased from to during the declining phase of the outburst. We suggest that increasing size of the corona is mainly responsible for it.
- •
The optical depth of the hot corona decreased from to . Most likely the decreasing number of electrons in the corona due to the decreasing accretion power is responsible for the observed variation in the optical depth.
References
- Arnaud (1996) Arnaud, K. A. 1996, in Astronomical Society of the Pacific Conference Series, Vol. 101, Astronomical Data Analysis Software and Systems V, ed. G. H. Jacoby & J. Barnes, 17
- Asplund et al. (2009) Asplund, M., Grevesse, N., Sauval, A. J., & Scott, P. 2009, ARA&A, 47, 481, doi: 10.1146/annurev.astro.46.060407.145222
- Barua et al. (2020) Barua, S., Jithesh, V., Misra, R., et al. 2020, MNRAS, 492, 3041, doi: 10.1093/mnras/staa067
- Belloni & Motta (2016) Belloni, T. M., & Motta, S. E. 2016, in Astrophysics and Space Science Library, Vol. 440, Astrophysics of Black Holes: From Fundamental Aspects to Latest Developments, ed. C. Bambi, 61
- Boissay et al. (2016) Boissay, R., Ricci, C., & Paltani, S. 2016, A&A, 588, A70, doi: 10.1051/0004-6361/201526982
- Burrows et al. (2005) Burrows, D. N., Hill, J. E., Nousek, J. A., et al. 2005, Space Sci. Rev., 120, 165, doi: 10.1007/s11214-005-5097-2
- Crummy et al. (2006) Crummy, J., Fabian, A. C., Gallo, L., & Ross, R. R. 2006, MNRAS, 365, 1067, doi: 10.1111/j.1365-2966.2005.09844.x
- Dewangan et al. (2007) Dewangan, G. C., Griffiths, R. E., Dasgupta, S., & Rao, A. R. 2007, ApJ, 671, 1284, doi: 10.1086/523683
- Done et al. (2012) Done, C., Davis, S. W., Jin, C., Blaes, O., & Ward, M. 2012, MNRAS, 420, 1848, doi: 10.1111/j.1365-2966.2011.19779.x
- Elagali et al. (2019) Elagali, A., Staveley-Smith, L., Rhee, J., et al. 2019, MNRAS, 487, 2797, doi: 10.1093/mnras/stz1448
- Esin et al. (2001) Esin, A. A., McClintock, J. E., Drake, J. J., et al. 2001, ApJ, 555, 483, doi: 10.1086/321450
- Evans et al. (2009) Evans, P. A., Beardmore, A. P., Page, K. L., et al. 2009, MNRAS, 397, 1177, doi: 10.1111/j.1365-2966.2009.14913.x
- Fabian et al. (2000) Fabian, A. C., Iwasawa, K., Reynolds, C. S., & Young, A. J. 2000, PASP, 112, 1145, doi: 10.1086/316610
- Fabian et al. (2015) Fabian, A. C., Lohfink, A., Kara, E., et al. 2015, MNRAS, 451, 4375, doi: 10.1093/mnras/stv1218
- Gabriel et al. (2004) Gabriel, C., Denby, M., Fyfe, D. J., et al. 2004, in Astronomical Society of the Pacific Conference Series, Vol. 314, Astronomical Data Analysis Software and Systems (ADASS) XIII, ed. F. Ochsenbein, M. G. Allen, & D. Egret, 759
- García et al. (2013) García, J., Dauser, T., Reynolds, C. S., et al. 2013, ApJ, 768, 146, doi: 10.1088/0004-637X/768/2/146
- García et al. (2014) García, J., Dauser, T., Lohfink, A., et al. 2014, ApJ, 782, 76, doi: 10.1088/0004-637X/782/2/76
- Gehrels et al. (2004) Gehrels, N., Chincarini, G., Giommi, P., et al. 2004, ApJ, 611, 1005, doi: 10.1086/422091
- Gliozzi et al. (2013) Gliozzi, M., Papadakis, I. E., Grupe, D., Brinkmann, W. P., & Räth, C. 2013, MNRAS, 433, 1709, doi: 10.1093/mnras/stt848
- Haardt & Maraschi (1991) Haardt, F., & Maraschi, L. 1991, ApJ, 380, L51, doi: 10.1086/186171
- Haardt & Maraschi (1993) —. 1993, ApJ, 413, 507, doi: 10.1086/173020
- Harrison et al. (2013) Harrison, F. A., Craig, W. W., Christensen, F. E., et al. 2013, ApJ, 770, 103, doi: 10.1088/0004-637X/770/2/103
- Jana et al. (2021) Jana, A., Kumari, N., Nandi, P., et al. 2021, MNRAS, 507, 687, doi: 10.1093/mnras/stab2155
- Jansen et al. (2001) Jansen, F., Lumb, D., Altieri, B., et al. 2001, A&A, 365, L1, doi: 10.1051/0004-6361:20000036
- Joye & Mandel (2003) Joye, W. A., & Mandel, E. 2003, in Astronomical Society of the Pacific Conference Series, Vol. 295, Astronomical Data Analysis Software and Systems XII, ed. H. E. Payne, R. I. Jedrzejewski, & R. N. Hook, 489
- Kalberla et al. (2005) Kalberla, P. M. W., Burton, W. B., Hartmann, D., et al. 2005, A&A, 440, 775, doi: 10.1051/0004-6361:20041864
- Kara et al. (2017) Kara, E., García, J. A., Lohfink, A., et al. 2017, MNRAS, 468, 3489, doi: 10.1093/mnras/stx792
- Lubiński et al. (2016) Lubiński, P., Beckmann, V., Gibaud, L., et al. 2016, MNRAS, 458, 2454, doi: 10.1093/mnras/stw454
- Mason et al. (2001) Mason, K. O., Breeveld, A., Much, R., et al. 2001, A&A, 365, L36, doi: 10.1051/0004-6361:20000044
- McClintock et al. (2001) McClintock, J. E., Haswell, C. A., Garcia, M. R., et al. 2001, ApJ, 555, 477, doi: 10.1086/321449
- Mehdipour et al. (2015) Mehdipour, M., Kaastra, J. S., Kriss, G. A., et al. 2015, A&A, 575, A22, doi: 10.1051/0004-6361/201425373
- Nandra et al. (2000) Nandra, K., Le, T., George, I. M., et al. 2000, ApJ, 544, 734, doi: 10.1086/317237
- Nardini et al. (2011) Nardini, E., Fabian, A. C., Reis, R. C., & Walton, D. J. 2011, MNRAS, 410, 1251, doi: 10.1111/j.1365-2966.2010.17518.x
- Nardini et al. (2012) Nardini, E., Fabian, A. C., & Walton, D. J. 2012, MNRAS, 423, 3299, doi: 10.1111/j.1365-2966.2012.21123.x
- Nasa High Energy Astrophysics Science Archive Research Center (2014) (Heasarc) Nasa High Energy Astrophysics Science Archive Research Center (Heasarc). 2014, HEAsoft: Unified Release of FTOOLS and XANADU. http://ascl.net/1408.004
- Oknyansky et al. (2019) Oknyansky, V. L., Winkler, H., Tsygankov, S. S., et al. 2019, MNRAS, 483, 558, doi: 10.1093/mnras/sty3133
- Parker et al. (2019) Parker, M. L., Schartel, N., Grupe, D., et al. 2019, MNRAS, 483, L88, doi: 10.1093/mnrasl/sly224
- Petrucci et al. (2004) Petrucci, P. O., Maraschi, L., Haardt, F., & Nandra, K. 2004, A&A, 413, 477, doi: 10.1051/0004-6361:20031499
- Petrucci et al. (2018) Petrucci, P. O., Ursini, F., De Rosa, A., et al. 2018, A&A, 611, A59, doi: 10.1051/0004-6361/201731580
- Petrucci et al. (2000) Petrucci, P. O., Haardt, F., Maraschi, L., et al. 2000, ApJ, 540, 131, doi: 10.1086/309319
- Petrucci et al. (2001) —. 2001, ApJ, 556, 716, doi: 10.1086/321629
- Petrucci et al. (2020) Petrucci, P. O., Gronkiewicz, D., Rozanska, A., et al. 2020, A&A, 634, A85, doi: 10.1051/0004-6361/201937011
- Porquet et al. (2021) Porquet, D., Reeves, J. N., Grosso, N., Braito, V., & Lobban, A. 2021, A&A, 654, A89, doi: 10.1051/0004-6361/202141577
- Ricci et al. (2017) Ricci, C., Trakhtenbrot, B., Koss, M. J., et al. 2017, ApJS, 233, 17, doi: 10.3847/1538-4365/aa96ad
- Roming et al. (2005) Roming, P. W. A., Kennedy, T. E., Mason, K. O., et al. 2005, Space Sci. Rev., 120, 95, doi: 10.1007/s11214-005-5095-4
- Sniegowska et al. (2020) Sniegowska, M., Czerny, B., Bon, E., & Bon, N. 2020, A&A, 641, A167, doi: 10.1051/0004-6361/202038575
- Sobolewska & Papadakis (2009) Sobolewska, M. A., & Papadakis, I. E. 2009, MNRAS, 399, 1597, doi: 10.1111/j.1365-2966.2009.15382.x
- Strüder et al. (2001) Strüder, L., Briel, U., Dennerl, K., et al. 2001, A&A, 365, L18, doi: 10.1051/0004-6361:20000066
- Sunyaev & Titarchuk (1980) Sunyaev, R. A., & Titarchuk, L. G. 1980, A&A, 500, 167
- Tortosa et al. (2018) Tortosa, A., Bianchi, S., Marinucci, A., Matt, G., & Petrucci, P. O. 2018, A&A, 614, A37, doi: 10.1051/0004-6361/201732382
- Tortosa et al. (2022) Tortosa, A., Ricci, C., Tombesi, F., et al. 2022, MNRAS, 509, 3599, doi: 10.1093/mnras/stab3152
- Tripathi & Dewangan (2022) Tripathi, P., & Dewangan, G. C. 2022, ApJ, 925, 101, doi: 10.3847/1538-4357/ac3a6e
- Tripathi et al. (2021) Tripathi, P., Dewangan, G. C., Papadakis, I. E., & Singh, K. P. 2021, The Astrophysical Journal, 915, 25, doi: 10.3847/1538-4357/abfe70
- Verner et al. (1996) Verner, D. A., Ferland, G. J., Korista, K. T., & Yakovlev, D. G. 1996, ApJ, 465, 487, doi: 10.1086/177435
- Walton et al. (2013) Walton, D. J., Nardini, E., Fabian, A. C., Gallo, L. C., & Reis, R. C. 2013, MNRAS, 428, 2901, doi: 10.1093/mnras/sts227
- Woo & Urry (2002) Woo, J.-H., & Urry, C. M. 2002, ApJ, 579, 530, doi: 10.1086/342878
- Xu et al. (2021) Xu, Y., García, J. A., Walton, D. J., et al. 2021, ApJ, 913, 13, doi: 10.3847/1538-4357/abf430
- Zdziarski et al. (1996) Zdziarski, A. A., Johnson, W. N., & Magdziarz, P. 1996, MNRAS, 283, 193, doi: 10.1093/mnras/283.1.193
- Zdziarski et al. (2003) Zdziarski, A. A., Lubiński, P., Gilfanov, M., & Revnivtsev, M. 2003, MNRAS, 342, 355, doi: 10.1046/j.1365-8711.2003.06556.x
- Zdziarski et al. (2020) Zdziarski, A. A., Szanecki, M., Poutanen, J., Gierliński, M., & Biernacki, P. 2020, MNRAS, 492, 5234, doi: 10.1093/mnras/staa159
- Życki et al. (1999) Życki, P. T., Done, C., & Smith, D. A. 1999, MNRAS, 309, 561, doi: 10.1046/j.1365-8711.1999.02885.x
Appendix A Additional figures