Spin-Electric Coupling in Lead Halide Perovskites
Abstract
Lead-halide perovskites enjoy a number of remarkable optoelectronic properties. To explain their origin, it is necessary to study how electromagnetic fields interact with these systems. We address this problem here by studying two classical quantities: Faraday rotation and the complex refractive index in a paradigmatic perovskite CH3NH3PbBr3 in a broad wavelength range. We find that the minimal coupling of electromagnetic fields to the kp Hamiltonian is insufficient to describe the observed data even on the qualitative level. To amend this, we demonstrate that there exists a relevant atomic-level coupling between electromagnetic fields and the spin degree of freedom. This spin-electric coupling allows for quantitative description of a number of previous as well as present experimental data. In particular, we use it here to show that the Faraday effect in lead-halide perovskites is dominated by the Zeeman splitting of the energy levels, and has a substantial beyond-Becquerel contribution. Finally, we present general symmetry-based phenomenological arguments that in the low-energy limit our effective model includes all basis coupling terms to the electromagnetic field in the linear order.
Originally, lead-halide perovskites (LHP) attracted attention as promising candidates for photovoltaic applications Grätzel 2014; Saliba et al. 2016; Shi et al. 2015. However, it was soon realized that LHP also feature a host of other exceptional but seemingly unrelated optical properties such as efficient THz generation, high harmonic generation and even high-temperature Dicke superluminescence to name a few (see e.g. Ferrando et al. 2018; Zhou et al. 2020; Findik et al. 2021 and references therein). This richness of physics arguably makes lead-halide perovskites unique and calls for a better understanding of what makes them so special at the microscopic level. In particular, in view of the growing consensus on the importance of Rashba-type physics in the context of these materials Zheng et al. 2015; Mosconi et al. 2017; Becker et al. 2018; Lafalce et al. 2022; Niesner et al. 2016, there is an urge to have a unified framework for describing the interaction between electromagnetic fields and electronic degrees of freedom in lead halide perovskites.
The band structure of conduction- and valence-band electrons near the chemical potential in LHP is well understood by now. Their quantitative description can be achieved within the approach based on spin-orbit-split Pb-based s- and p-orbitals hybridized with neighbouring halide s- and p-orbitals Becker et al. 2018. To include the electromagnetic field in this description, one would naively perform the standard substitution (). However, as we show below, this leads to a qualitative disagreement with experimental measurements of some classic quantities such as the linear refractive index and Faraday rotation. In this Letter, we show that, in order to achieve a quantitative agreement with experiment, it is necessary to introduce additional coupling terms into the effective model of LHP. Physically these terms are related to the atomic polarization of Pb atoms, and to the details of the electronic structure of LHP, which leads to a very specific Zeeman-type interaction. By using very general arguments, we construct a phenomenological Hamiltonian that includes both electric and magnetic fields, and fix the magnitude of each term by comparing the predictions of the theory with our measurements.
We focus on basic optical properties such as frequency-dependent absorption and the dielectric constant , which can provide important insight into the microscopic structure of a material Green et al. 2015; Leguy et al. 2016. We also measure the Faraday effect – a rotation of polarization of light that propagates inside a sample in the presence of a magnetic field Sommerfeld 1954. One important aspect of this classic phenomenon is that in order to account for it, one needs to consider the effect of both electric and magnetic fields on the material. This makes it particularly useful for understanding details of the electronic coupling to electromagnetic fields.
Faraday rotation.— The observable that quantifies strength of the Faraday effect in a given medium is the so-called Verdet constant, , which is defined via , where is the angle between the initial and final polarizations; is the strength of the magnetic field; is the thickness of the sample. In general, is a function of frequency of the probing light. As is well known Sommerfeld 1954, tends to diverge near absorption regions. In many cases this behaviour can be captured by the classical Becquerel formula: , with being the (phase) refractive index and is a numeric fitting parameter.
Large Verdet constants have recently been demonstrated in the vicinity of the band gap transition in methylammonium lead bromide perovskites CH3NH3PbBr3 Sabatini et al. 2020, suggesting industrial applications of LHP as Faraday rotators. However, the behavior of near the energy gap (arguably) cannot provide any deep understanding of microscopic physics. One reason is the extreme sensitivity of to the value of the gap energy , as the Becquerel formula suggests; another reason is the presence of a strong exciton near the absorption edge (see Fig. 3B) which dominates in this frequency range, obscuring the details of the underlying basic single-particle physics.
In this Letter, we study the Faraday effect in a bulk single-crystal CH3NH3PbBr3 sample in a broad infrared range nm. The tunable-wavelength probe beam is generated by an optical parametric amplifier. Throughout the experiment the sample is kept in vacuum at K nominal temperature (cubic phase) in an optical magnet cryostat; the field is varied between T; the polarization rotation is detected with a pair of balanced pyroelectric IR detectors (see Fig. 1A). High quality bulk single crystal samples of CH3NH3PbBr3 were grown by inverse temperature crystallization method as described elsewhere Saidaminov et al. 2015a; Saidaminov et al. 2015b. More experimental details can be found in Supplementary Material SM.

The measured Faraday rotations as a function of is presented in Fig. 1A. The slope of each line is proportional to the Verdet coefficient at this wavelength. It is known from general considerations that must be an even function of frequency Bennett and Stern 1965, therefore suggesting the following functional form to analyze the data at low frequencies:
| (1) |
where and are fitting parameters, and is the band gap. The form of the denominator is motivated by the Becquerel formula Sabatini et al. 2020. In order to focus on the non-trivial numerator of Eq. (1), we plot in Fig. 1B the “normalized” Verdet constant . As can be seen in Fig. 1B the simple curve is indeed providing a reasonable fit for photon energies less than 1eV 11 1 As will be shown below, the fact that the value of is finite indicates the importance of electron hopping at low frequencies. At high frequencies, our data as well as the data of Ref. Sabatini et al. 2020 suggest that higher-order terms should be added to Eq. (1).
Theoretical considerations.— Our starting point for describing the observed frequency dependence of is the effective low-energy Hamiltonian introduced phenomenologically in Jin et al. 2012 and in Becker et al. 2018 via the kp method Kane 1966. This approach is based upon the fact that the low-energy optoelectronic properties of APbX3 (A=Cs, CH3NH3; X=Cl, Br, I) can be qualitatively understood from transitions between four basis states originating from p- and s-like states mostly associated with Pb and X atoms Umebayashi et al. 2003. We introduce the following notation to refer to these states:
| (2) |
Here, on the left-hand side, the thick and thin arrows correspond to the orbital (valence/conduction) and projection of the total angular momentum (quasi-spin) states, respectively. In the vicinity of the high-symmetry -point (for convenience, ), the effective Hamiltonian can be written as ():
| (3) |
where and are the intra- and inter-orbital hopping integrals respectively (Fig. 2 middle); is the lattice constant; and are the Pauli matrices acting on the orbital and quasi-spin respectively (compare with Jin et al. 2012). In order to account for the Faraday effect, one needs to couple-in electromagnetic field into this Hamiltonian. The most obvious way to do so is to employ minimal coupling and add a Zeeman term to Eq. (3). However, as it turns out, in this case the normalized Verdet constant is (almost) independent of the frequency contrary to our experiment data (see below).
In view of this qualitative disagreement, it is necessary to look more carefully at the interaction of electrons with electromagnetic fields. One factor naturally missing in minimal coupling to the kp Hamiltonian is on-site “atomic” polarization due to the applied electric field. Direct calculation of the matrix elements of over the basis Eq. (2) produces an extra term in the Hamiltonian (see Fig. 2):
| (4) |
here is the charge of electron; is the (effective) atomic dipole moment; ( being the radius of Pb atom). The significance of the term , which we dub “spin-electric”, is that it describes the local atomic coupling of the highly polarizable Pb2+ ions Schwerdtfeger and Nagle 2019 to the external electric field .
Next, we consider magnetic coupling. Note that quasi-spin is not identical to the actual spin, and the Zeeman term projected on the basis in Eq. (2) will be:
| (5) |
where is a parameter that determines the strength of the magnetic coupling. As this form suggests, only the valence band experiences Zeeman splitting (see Fig. 2). With these considerations, our effective Hamiltonian reads as
| (6) |
where and are the extensions of the corresponding functions in Eq. (3) across the Brillouin zone. These functions reflect the band structure; apart from general symmetry properties (see the discussion below) their exact form is not known. It can be used as a fitting factor in the present low-energy effective theory. For the functions and used in Eq. (3), Eq. (6) is rotationally symmetric, and therefore transforms according to representation of Dresselhaus et al. 2008. A convenient form used in Ref. Volosniev et al. 2022, which also leads to the highest symmetry (), is 22 2 In this case and terms transform according to the and irreducible representations of the group , correspondingly. This means that transforms according to the representation..
The Hamiltonian in Eq. (6) allows us to calculate the low-frequency Verdet coefficient. Assuming that , we derive an expression that agrees with Eq. (1):
| (7) |
where is the refractive index, is a constant that depends on and the specific form of (see also the companion paper Volosniev et al. 2022). First of all, we note that in the limit (pure minimal coupling to Eq. (3)) , which qualitatively disagrees with our experimental data presented in Fig. 1B. In the opposite limit (), , and hence . Therefore, the observed functional form of can be explained only if both and are finite. It is also noteworthy that around , the Becquerel curve computed for the data in Fig. 3B and chosen to match the high frequency data (Sabatini et al. 2020), differs from the fit according to Eq. (1) by only a constant offset, see Fig. 1B.

Determination of and .— The spin-electric term is essential for the observed frequency dependence of the normalized Verdet constant . However, the Faraday effect alone does not allow us to estimate the value of , since enters the corresponding part of Eq. (7) as a product with the unknown magnetic moment . Therefore, we measure the complex refractive index. This quantity has been previously measured on micro-scale crystals CH3NH3PbBr3 Brittman and Garnett 2016. In order to avoid possible effects due to the differences in sample geometries, we perform a complementary analysis of the refractive index in a bulk single crystal CH3NH3PbBr3 by measuring the reflection of the beam as a function of the angle of incidence near the Brewster minimum. By fitting the angle dependence using the Fresnel expressions Sommerfeld 1954, one can extract . This is similar to the previous experiment He et al. 2019, however we also go into shorter wavelengths (). In this regime the refractive index becomes complex, . The imaginary part manifests itself as a finite minimal reflectivity (see Fig. 3, and the Supplementary Material SM).
Complex-valued can be connected to the polarizability via the Lorentz-Lorenz relation (see, e.g., Boyd 2008; Feynman et al.). For the purpose of determining the low-energy parameters, we are most interested in the imaginary part of since, unlike the real part, it is “local” in frequency and does not receive contributions from the high-energy degrees of freedom. This quantity can be readily calculated based on Eq. (6) (see the companion paper Volosniev et al. 2022). To extract the value of by fitting the experimental data in Fig. 3, we first need to estimate the other parameters that enter Eq. (6): eV is known from optical measurements (see, e.g., Refs. Pazhuk et al. 1981; Saidaminov et al. 2015a; Jesper Jacobsson et al. 2016; Ng et al. 2018, also see Fig. 3); eV and the bandwidth eV of can be estimated by comparing the low-energy electron dispersion (see Eq. (10)) to the first-principles numerical calculations of Ref. Becker et al. 2018 where nm 33 3 The parameters in this work were calculated for CsPbBr3 which has a very similar lattice to that of CH3NH3PbBr3; was determined from the Kane energy, : , where is the free-space electron mass. The parameter was determined by the parameters : .. With these values, fitting of the polarizability gives (Fig. 3) in line with the natural estimate above; then (Bohr magnetons). Importantly, the particular form of and does not affect the value of noticeably (see the companion paper Volosniev et al. 2022); the value of is however sensitive to the band structure, and we can only estimate it.
Discussion.— Now that we have established that the spin-electric coupling is essential to describe response of the material to electromagnetic fields, we relate the Hamiltonian in Eq (6) to basic symmetries of the system. For the considered CH3NH3PbBr3, these are the cubic point group 44 4 Note that here we are using the Schönflies notation; in the Hermann–Mauguin notation the point group would be . which includes inversion , and time-reversal symmetry :
| (8) |
where is the complex conjugation operator. This set of symmetries is quite restrictive and it turns out that Eq. (6), with and being even and odd functions of respectively, contains all basis coupling terms for the states of Eq. (2) up to linear order in and 55 5 Note that any product of the terms in Eq. (6), e.g., , obey the required symmetries. Therefore, these terms could, in principle, be also added to the effective Hamiltonian. Being the products of the basis coupling terms, they do not lead to any new dependence of observables on the parameters of the system and are not important for our discussion. We leave their investigation to future studies, see also the companion paper Volosniev et al. 2022..
Identification of the explicit form of is the central theoretical result of this Letter. Below, we shall briefly discuss its physical implications. In the most simple situation with no external fields the electron dispersion near can be found by simply taking square of from Eq. (3)
| (9) |
The energy levels are doubly degenerate, and can be parametrized by the spin degree of freedom – the direction of (quasi-)spin is determined by the direction of the momentum . The degeneracy is broken when external electric field is applied. This can be seen by squaring the Hamiltonian with :
| (10) |
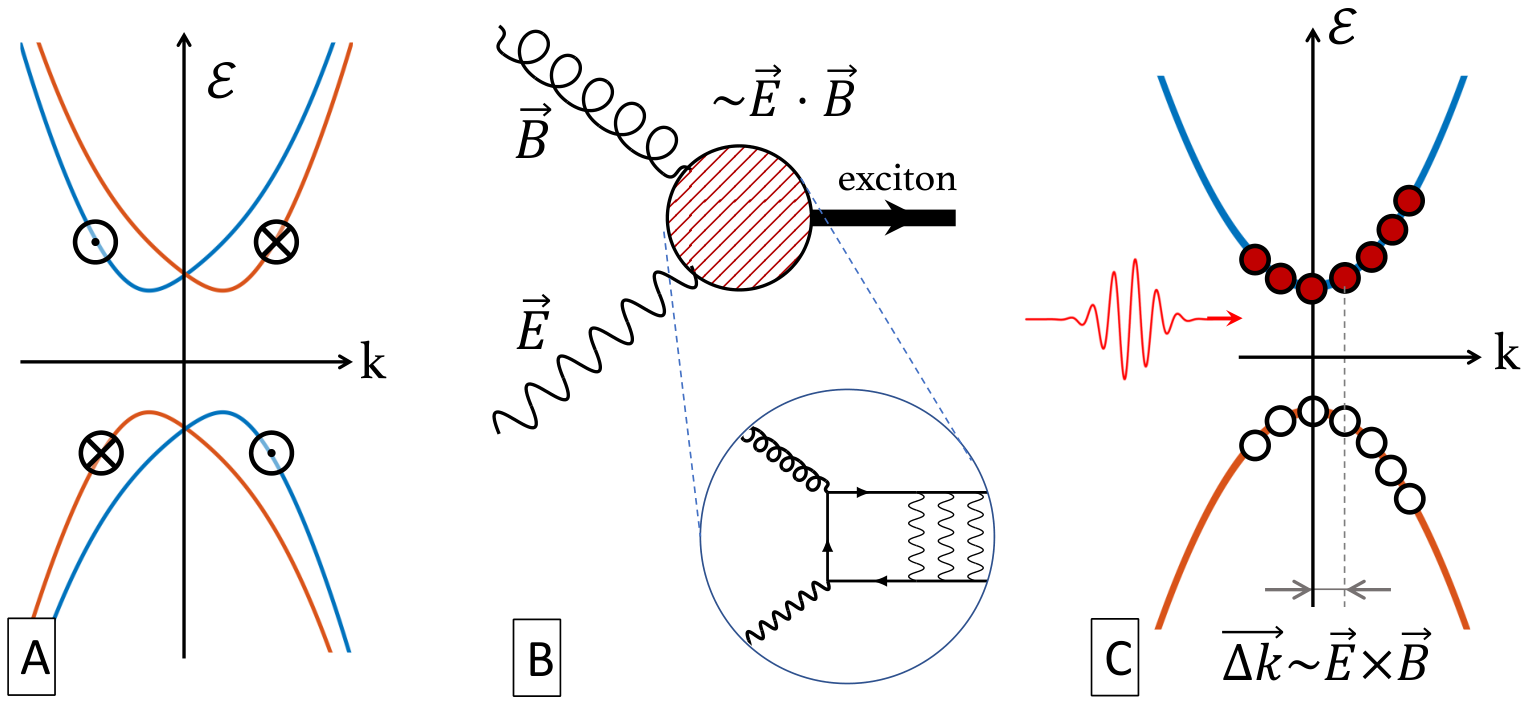
The degeneracy is indeed lifted and the splitting has a clear Rashba-type form (see Fig. 4A). Notice that both the conduction and valence bands are split, in line with both experiment Niesner et al. 2016 and ab initio theory Kim et al. 2014. This equation also indicates that the gap in the spectrum is modified in the presence of electric fields: , which is consistent with the observed shift of the absorption edge in perovskite samples pumped by THz pulses Kim et al. 2017.
In the more complex case of finite and , mixing between and can give rise to magneto-electric phenomena taking the following forms:
| (11) |
Both terms are of the order of for . As the structure suggests, describes what is known in high-energy physics as axion electrodynamics Sekine and Nomura 2021. In the case of perovskites the role of the axionic field is played by a certain exciton (Fig. 4B) 66 6 , where () is a fermionic creation (annihilation) operator.. corresponds to photon drag. Indeed, comparing it with one can see that it gives rise to a shift in -space in the direction of the Poynting vector of the incident beam. This should manifest itself as a photo-current in a photoexcited perovskite sample (Fig. 4C). Unlike the usual photon drag mechanism that diverges at Wegener 2005, should resonantly diverge at . Finally, changes sign under inversion and time-reversal and can be interpreted as a toroidal moment Dubovik and Tugushev 1990. Therefore, LHP in perpendicular magnetic and electric fields can be used to study ferrotoroidicity and related effects Spaldin et al. 200877 7 Note that analysis of corresponding experimental data will benefit from the recent theoretical studies of the magnetoelectric effect, see, e.g., Refs. Spaldin et al. 2013; Gao et al. 2018; Thöle et al. 2020.
In conclusion, we have analyzed the Faraday effect in CH3NH3PbBr3 in a broad wavelength range. We find that to describe the observed frequency dependence of the Verdet constant one needs to consider the local atomic response to applied electric fields. We also find that the coupling has a specific “spin-electric” form. This allows us to quantitatively describe our measurements. The existence of multiple channels for electromagnetic coupling, combined with exceptional polarizability of Pb2+ ions is shown to give rise to a rich variety of novel physics in LHP including anomalous photon drag and axion electrodynamics.
Our theoretical model is constructed for valence and conduction bands made of s-type and p-type doublets in centrosymmetric cubic materials with strong spin-orbit coupling. This suggests further materials where the “spin-electric” coupling can be observed, such as cubic tin-based halide perovskites (e.g., CsSnBr3)Borriello et al. 2008; Huang and Lambrecht 2013 with tin in a highly polarizable Sn2+ state Schwerdtfeger and Nagle 2019.
Acknowledgements.
We thank Maksym Serbyn, Areg Ghazaryan and Nuh Gedik for useful discussions; M.L. acknowledges support by the European Research Council (ERC) Starting Grant No. 801770 (ANGULON).I Sample Preparation
Chemicals.—CH3NH3Br (99.99%) was purchased from GreatCell Solar Ltd. (formerly Dyesol) and used as received. PbBr2 (98%), CsBr (99.9% trace metals basis), DMF (anhydrous, 99.8%), and DMSO (anhydrous, 99.9%) were purchased from Sigma Aldrich and used as received.
Synthesis of CH3NH3PbBr3 perovskite single crystals.—A 1.5 M solution of CH3NH3Br/PbBr2 in DMF was prepared, filtered through a 0.45-m-pore-size PTFE filter; and the vial containing ml of the solution was placed on a hot plate at C. Then the solution was gradually heated to C and kept at this temperature until the formation of CH3NH3PbBr3 crystals. The crystals can be grown into larger sizes by elevating the temperature further. Finally, the crystals were collected and cleaned using a Kimwipe paper.
II Faraday rotation measurement
We are measuring the Faraday rotation away from the band edge, therefore the net value of the polarization rotation is not very large. For that reason, we are not measuring the Faraday angle directly with a polariser as in Sabatini et al. 2020. Instead, we infer it from a balanced detection scheme as shown in Fig. 5. Here, the beam is first passing through a pair of polarizers whose purpose is two-fold. On the one hand, it cleans the polarization. On the other hand, it allows for an intensity control of the probing beam. Next, the beam is focused with an f=200mm lens onto the perovskite sample which is kept in vacuum inside an optical magnetic cryostat (Oxford Instruments SpectromagPT). The beam is then recollimated on the other side of the cryostat. The outer windows of the cryostat are made of ZnSe while the inner ones are CVD-grown diamond, both are transparent in the relevant IR range.
The outgoing collimated beam passes through a Wollaston prism whose two outputs are send to two pyroelectric IR detectors (Gentech THZ5I-BL-BNC). To compensate for the inevitable difference in sensitivities of the detectors, we introduce a pellicle beam splitter after the Wollaston prism, which can be rotated to achieve different transmissivities for the two cross-polarized Wollaston prism outputs.
CH3NH3PbBr3 is considered to be nominally optically isotropic in the high-temperature (K) cubic phase. Nevertheless, the single-crystal samples are in general birefringent even above , presumably due to built-in stress. For this reason, for a generic incoming linear polarization the outgoing polarization will be elliptical, complicating the interpretation of the data. To avoid this, we adjust the polarization of the probe light to be along the optical axis of the sample. These happen to be parallel to the edges of CH3NH3PbBr3 crystals. For precise alignment we minimize the ellipticity of the outgoing beam as a function of incoming polarization orientation. Next, in order to use the balanced detection scheme for measuring the changes in polarization, the Wollaston prism has to be oriented at 45∘ relative to the unperturbed polarization direction. Typically this is achieved by placing a waveplate in front of the Wollaston prism. However, in our case this is not practical as we need to vary the wavelength is a broad range. Therefore we actually rotate the Wollaston prism by from the position where the cross-polarized output is minimal.
To balance the detector sensitivities, we place an additional infrared polarizer in front of the Wollaston prism to clean the polarization (wire grid on ZnSe. The advantage of this option over, e.g., Glan-Taylor prism, is that the former is less sensitive to the incoming direction and does not change the outgoing beam path). This polarizer is set to be parallel to the nominal polarization of the beam outgoing from the sample and hence 45∘ relative to the Wollaston prism. This way we know that both output beams from the Wollaston have the same intensity and any difference in the readings of the detectors comes from their different sensitivities which can be compensated for by rotating the pellicle beam splitter.
Once the detectors are balanced, their outputs and are sent to the differential inputs of a lock-in (SRS SR830) synchronized with an optical shopper modulating the input intensity. A simple Jones analysis shows that the Faraday rotation angle can be found as
| (12) |
As we know the thickness of the sample (mm), the Verdet constant can be now deduced from the slope of , see Fig. 6.

Light source and intensity dependence.—The variable wavelength (1100nm-2700nm) probe beam is generated by an Optical Parametric Amplifier (Light Conversion OrpheusHP), pumped by a amplified pulsed laser (Light Conversion Pharos; nm, 290fs pulse duration, 6W@3kHz repetition rate). The typical power of the probe beam at the entrance window of the cryostat was a few mW. In order to avoid possible non-linear effects, for each wavelength we have measured the Faraday rotation at different power values and extrapolated the observed numbers to the zero intensity, as plotted in Fig. 7. As can be seen the value of the Verdet constant is almost independent of the power of the incident beam, with an exception of shorter wavelengths m. We believe this is due to enhanced nonlinearity near the two-photon absorption threshold Sheik-Bahae et al. 1990. The error bars in Fig.1B of the main text are the 95% confidence range of the interpolated Verdet values.


III Refractive index measurement
Refractive index was measured on single crystal CH3NH3PbBr3 samples by measuring the reflectivity of a p-polarized beam off the sample surface. Prior to the measurement the sample surface was polished using a 1m-grit Al2O3 sandpaper. The sample was then placed on a rotation stage. For each wavelength value the zero-position was found by finding the backward-reflection configuration. The reflection coefficient was then measured as a function of the angle of incidence . The resulting curves were fit by the Fresnel formula
| (13) |
Here, and are the phase refractive indices of air and CH3NH3PbBr3 respectively. In order to achieve good fitting in the whole wavelength range, including (the position of the energy gap is marked by the (black) vertical line in Fig. 8), one needs to assume that the refractive index is a complex number, i.e., . The resulting measured complex refractive index is shown in Fig. 8. As can be seen, the value of Im for wavelength values longer than absorption edge is seemingly finite. This reflects the fact that there is a non-zero minimal reflectivity. This can either point towards an actual parasitic absorption inside CH3NH3PbBr3 due to impurities, but given that the samples (mm thick) actually look transparent in the visible range (nm) we attribute this residual Im to the occasional surface imperfections that scatter incoming light. Therefore, we take this level as an offset due extrinsic effects (the (black) horizontal line in Fig. 8). We subtract it from the data for all further usage. The fit to the data is presented in the main matter as well as in Fig. 9.

References
- Grätzel (2014) M. Grätzel, The light and shade of perovskite solar cells, Nature Mater 13, 838 (2014).
- Saliba et al. (2016) M. Saliba, T. Matsui, J.-Y. Seo, K. Domanski, J.-P. Correa-Baena, M. K. Nazeeruddin, S. M. Zakeeruddin, W. Tress, A. Abate, A. Hagfeldt, and M. Gratzel, Cesium-containing triple cation perovskite solar cells: improved stability, reproducibility and high efficiency, Energy Environ. Sci. 9, 1989 (2016).
- Shi et al. (2015) D. Shi, V. Adinolfi, R. Comin, M. Yuan, E. Alarousu, A. Buin, Y. Chen, S. Hoogland, A. Rothenberger, K. Katsiev, Y. Losovyj, X. Zhang, P. A. Dowben, O. F. Mohammed, E. H. Sargent, and O. M. Bakr, Low trap-state density and long carrier diffusion in organolead trihalide perovskite single crystals, Science 347, 519 (2015).
- Ferrando et al. (2018) A. Ferrando, J. P. M. Pastor, and I. Suárez, Toward metal halide perovskite nonlinear photonics, The Journal of Physical Chemistry Letters 9, 5612 (2018).
- Zhou et al. (2020) Y. Zhou, Y. Huang, X. Xu, Z. Fan, J. B. Khurgin, and Q. Xiong, Nonlinear optical properties of halide perovskites and their applications, Applied Physics Reviews 7, 041313 (2020).
- Findik et al. (2021) G. Findik, M. Biliroglu, D. Seyitliyev, J. Mendes, A. Barrette, H. Ardekani, L. Lei, Q. Dong, F. So, and K. Gundogdu, High-temperature superfluorescence in methyl ammonium lead iodide, Nature Photonics 15, 676 (2021).
- Zheng et al. (2015) F. Zheng, L. Z. Tan, S. Liu, and A. M. Rappe, Rashba spin–orbit coupling enhanced carrier lifetime in CH3NH3PbI3, Nano Letters 15, 7794 (2015).
- Mosconi et al. (2017) E. Mosconi, T. Etienne, and F. D. Angelis, Rashba band splitting in organohalide lead perovskites: Bulk and surface effects, The Journal of Physical Chemistry Letters 8, 2247 (2017).
- Becker et al. (2018) M. A. Becker, R. Vaxenburg, G. Nedelcu, P. C. Sercel, A. Shabaev, M. J. Mehl, J. G. Michopoulos, S. G. Lambrakos, N. Bernstein, J. L. Lyons, and et al., Bright triplet excitons in caesium lead halide perovskites, Nature 553, 189–193 (2018).
- Lafalce et al. (2022) E. Lafalce, E. Amerling, Z.-G. Yu, P. C. Sercel, L. Whittaker-Brooks, and Z. V. Vardeny, Rashba splitting in organic–inorganic lead–halide perovskites revealed through two-photon absorption spectroscopy, Nature Communications 13, 483 (2022).
- Niesner et al. (2016) D. Niesner, M. Wilhelm, I. Levchuk, A. Osvet, S. Shrestha, M. Batentschuk, C. Brabec, and T. Fauster, Giant rashba splitting in CH3NH3PbBr3 organic-inorganic perovskite, Physical Review Letters 117, 126401 (2016).
- Green et al. (2015) M. A. Green, Y. Jiang, A. M. Soufiani, and A. Ho-Baillie, Optical properties of photovoltaic organic–inorganic lead halide perovskites, The Journal of Physical Chemistry Letters 6, 4774 (2015).
- Leguy et al. (2016) A. M. A. Leguy, P. Azarhoosh, M. I. Alonso, M. Campoy-Quiles, O. J. Weber, J. Yao, D. Bryant, M. T. Weller, J. Nelson, A. Walsh, M. van Schilfgaarde, and P. R. F. Barnes, Experimental and theoretical optical properties of methylammonium lead halide perovskites, Nanoscale 8, 6317 (2016).
- Sommerfeld (1954) A. Sommerfeld, Optics (Lectures on Theoretical Physics, Vol. IV) (Academic Press Inc. (New York), 1954).
- Sabatini et al. (2020) R. P. Sabatini, C. Liao, S. Bernardi, W. Mao, M. S. Rahme, A. Widmer-Cooper, U. Bach, S. Huang, A. W. Y. Ho-Baillie, and G. Lakhwani, Solution-processed Faraday rotators using single crystal lead halide perovskites, Advanced Science 7, 1902950 (2020).
- Saidaminov et al. (2015a) M. I. Saidaminov, A. L. Abdelhady, B. Murali, E. Alarousu, V. M. Burlakov, W. Peng, I. Dursun, L. Wang, Y. He, G. Maculan, A. Goriely, T. Wu, O. F. Mohammed, and O. M. Bakr, High-quality bulk hybrid perovskite single crystals within minutes by inverse temperature crystallization, Nature Communications 6, 8586 (2015a).
- Saidaminov et al. (2015b) M. I. Saidaminov, A. L. Abdelhady, G. Maculan, and O. M. Bakr, Retrograde solubility of formamidinium and methylammonium lead halide perovskites enabling rapid single crystal growth, Chemical Communications 51, 17658 (2015b).
- (18) The Supplemental Material [url] provides additional details on sample preparation, and on our measurements of the Faraday rotation and refractive index. In addition to the literature cited in the Letter, it uses Ref. Sheik-Bahae et al. 1990.
- Bennett and Stern (1965) H. S. Bennett and E. A. Stern, Faraday effect in solids, Phys. Rev. 137, A448 (1965).
- (20) As will be shown below, the fact that the value of is finite indicates the importance of electron hopping at low frequencies.
- Jin et al. (2012) H. Jin, J. Im, and A. J. Freeman, Topological insulator phase in halide perovskite structures, Physical Review B 86, 121102 (2012).
- Kane (1966) E. Kane, Chapter 3 (the k p method), in Semiconductors and Semimetals, Vol. 1, edited by R. Willardson and A. C. Beer (Elsevier, 1966) pp. 75–100.
- Umebayashi et al. (2003) T. Umebayashi, K. Asai, T. Kondo, and A. Nakao, Electronic structures of lead iodide based low-dimensional crystals, Physical Review B 67, 155405 (2003).
- Schwerdtfeger and Nagle (2019) P. Schwerdtfeger and J. K. Nagle, 2018 table of static dipole polarizabilities of the neutral elements in the periodic table, Molecular Physics 117, 1200 (2019).
- Dresselhaus et al. (2008) M. S. S. Dresselhaus, G. Dresselhaus, and A. Jorio, Group Theory: Application to the Physics of Condensed Matter (Springer, 2008).
- Volosniev et al. (2022) A. G. Volosniev, A. Shiva Kumar, D. Lorenc, Y. Ashourishokri, A. A. Zhumekenov, O. M. Bakr, M. Lemeshko, and Z. Alpichshev, Effective model for studying optical properties of lead-halide perovskites, arXiv e-prints (2022), arXiv:2204.04022 [cond-mat.mes-hall] .
- (27) In this case and terms transform according to the and irreducible representations of the group , correspondingly. This means that transforms according to the representation.
- Brittman and Garnett (2016) S. Brittman and E. C. Garnett, Measuring n and k at the microscale in single crystals of CH3NH3PbBr3 perovskite, The Journal of Physical Chemistry C 120, 616 (2016).
- He et al. (2019) C. He, G. Zha, C. Deng, Y. An, R. Mao, Y. Liu, Y. Lu, and Z. Chen, Refractive index dispersion of organic–inorganic hybrid halide perovskite single crystals, Crystal Research and Technology 54, 1900011 (2019).
- Boyd (2008) R. W. Boyd, Nonlinear Optics, 3rd ed. (Academic Press, Burlington, 2008).
- (31) R. Feynman, R. Leighton, and M. Sands, The Feynman Lectures on Physics (Vol 2, Ch. 32). The New Millennium Edition.
- Pazhuk et al. (1981) I. P. Pazhuk, N. S. Pydzirailo, and M. G. Matsko, Exciton absorption, luminescence and resonant raman scattering of light in perovskite CsPbCl3 and CsPbBr3 crystals at low temperature, Sov. Phys. Sol. State 23, 1263 (1981).
- Jesper Jacobsson et al. (2016) T. Jesper Jacobsson, J.-P. Correa-Baena, M. Pazoki, M. Saliba, K. Schenk, M. Gratzel, and A. Hagfeldt, Exploration of the compositional space for mixed lead halogen perovskites for high efficiency solar cells, Energy Environ. Sci. 9, 1706 (2016).
- Ng et al. (2018) C. Ng, T. Ripolles, and K. e. a. Hamada, Tunable open circuit voltage by engineering inorganic cesium lead bromide/iodide perovskite solar cells, Sci Rep 8, 2482 (2018).
- (35) The parameters in this work were calculated for CsPbBr3 which has a very similar lattice to that of CH3NH3PbBr3; was determined from the Kane energy, : , where is the free-space electron mass. The parameter was determined by the parameters : .
- (36) Note that here we are using the Schönflies notation; in the Hermann–Mauguin notation the point group would be .
- (37) Note that any product of the terms in Eq. (6), e.g., , obey the required symmetries. Therefore, these terms could, in principle, be also added to the effective Hamiltonian. Being the products of the basis coupling terms, they do not lead to any new dependence of observables on the parameters of the system and are not important for our discussion. We leave their investigation to future studies, see also the companion paper Volosniev et al. 2022.
- Kim et al. (2014) M. Kim, J. Im, A. J. Freeman, J. Ihm, and H. Jin, Switchable s = 1/2 and j = 1/2 rashba bands in ferroelectric halide perovskites, Proceedings of the National Academy of Sciences 111, 6900 (2014).
- Kim et al. (2017) H. Kim, J. Hunger, E. Cánovas, M. Karakus, Z. Mics, M. Grechko, D. Turchinovich, S. H. Parekh, and M. Bonn, Direct observation of mode-specific phonon-band gap coupling in methylammonium lead halide perovskites, Nature Communications 8, 687 (2017).
- Sekine and Nomura (2021) A. Sekine and K. Nomura, Axion electrodynamics in topological materials, Journal of Applied Physics 129, 141101 (2021).
- (41) , where () is a fermionic creation (annihilation) operator.
- Wegener (2005) M. Wegener, Extreme Nonlinear Optics (Springer Berlin, Heidelberg, 2005).
- Dubovik and Tugushev (1990) V. Dubovik and V. Tugushev, Toroid moments in electrodynamics and solid-state physics, Physics Reports 187, 145 (1990).
- Spaldin et al. (2008) N. A. Spaldin, M. Fiebig, and M. Mostovoy, The toroidal moment in condensed-matter physics and its relation to the magnetoelectric effect, Journal of Physics: Condensed Matter 20, 434203 (2008).
- (45) Note that analysis of corresponding experimental data will benefit from the recent theoretical studies of the magnetoelectric effect, see, e.g., Refs. Spaldin et al. 2013; Gao et al. 2018; Thöle et al. 2020.
- Borriello et al. (2008) I. Borriello, G. Cantele, and D. Ninno, Ab initio investigation of hybrid organic-inorganic perovskites based on tin halides, Phys. Rev. B 77, 235214 (2008).
- Huang and Lambrecht (2013) L.-y. Huang and W. R. L. Lambrecht, Electronic band structure, phonons, and exciton binding energies of halide perovskites cssncl3, cssnbr3, and cssni3, Phys. Rev. B 88, 165203 (2013).
- Sheik-Bahae et al. (1990) M. Sheik-Bahae, D. J. Hagan, and E. W. Van Stryland, Dispersion and band-gap scaling of the electronic kerr effect in solids associated with two-photon absorption, Phys. Rev. Lett. 65, 96 (1990).
- Spaldin et al. (2013) N. A. Spaldin, M. Fechner, E. Bousquet, A. Balatsky, and L. Nordström, Monopole-based formalism for the diagonal magnetoelectric response, Phys. Rev. B 88, 094429 (2013).
- Gao et al. (2018) Y. Gao, D. Vanderbilt, and D. Xiao, Microscopic theory of spin toroidization in periodic crystals, Phys. Rev. B 97, 134423 (2018).
- Thöle et al. (2020) F. Thöle, A. Keliri, and N. A. Spaldin, Concepts from the linear magnetoelectric effect that might be useful for antiferromagnetic spintronics, Journal of Applied Physics 127, 213905 (2020).