ORDSIM: Ordinal Regression for E-Commerce Query Similarity PredictionDOI: XXXXXXX.XXXXXXXConference: International Workshop on Interactive and Scalable Information Retrieval methods for eCommerce (ISIR-eCom) 2022 @ WSDM-2022, https://isir-ecom.github.io/; Feb 25, 2022; Phoenix, AZ
Abstract.
Query similarity prediction task is generally solved by regression based models with square loss. Such a model is agnostic of absolute similarity values and it penalizes the regression error at all ranges of similarity values at the same scale. However, to boost e-commerce platform’s monetization, it is important to predict high-level similarity more accurately than low-level similarity, as highly similar queries retrieves items according to user-intents, whereas moderately similar item retrieves related items, which may not lead to a purchase. Regression models fail to customize its loss function to concentrate around the high-similarity band, resulting poor performance in query similarity prediction task. We address the above challenge by considering the query prediction as an ordinal regression problem, and thereby propose a model, ORDSIM (ORDinal Regression for SIMilarity Prediction). ORDSIM exploits variable-width buckets to model ordinal loss, which penalizes errors in high-level similarity harshly, and thus enable the regression model to obtain better prediction results for high similarity values. We evaluate ORDSIM on a dataset of over 10 millions e-commerce queries from eBay platform and show that ORDSIM achieves substantially smaller prediction error compared to the competing regression methods on this dataset.
1. Introduction
For e-commerce platforms, like eBay, Amazon, Alibaba, etc. finding queries, which are similar to a user query is a fundamental task. Solving this task benefits various platform features, such as “related searches”, “query expansion”, “recovery from zero recall”, “auto complete”, and “improve spelling”. These features enable extending the scope of search, thus improving the probability of retrieving all relevant items for a given query. Expanding the scope of a search is particularly important for queries, for which the user query alone does not reflect buyers’ intent effectively—also needed for queries for which the word tokens in the query have poor match with the word tokens of the most relevant items. Traditional information retrieval based document similarity prediction methods generally preform poorly for the case of e-commerce queries because of the facts that queries are often shorter, strongly sensitive to the context, and lack syntactic structure.
An e-commerce platform can use different cues for computing similarities between two queries. The obvious cue is word token based similarity, i.e., two similar queries would share substantial fractions of the word tokens. For example, the following four queries: “Dell xps Laptop", “Dell xps 15", “Dell 15 laptop", “Dell 15 inch laptop", all have high word level similarity and all of these queries are from a buyer, whose intention is to buy a “Dell laptop". Token level similarity is easy to compute as the queries generally differ only in stemming, word order, addition/omission of words, etc. Also in terms of query similarity, token based similarity yields high precision results. Finally, token based similarity is simple to understand, and easy to explain. However there are some downside of token level similarity. Often, there are false positives; for instance, “kiss” is not “kisses”, “dress shirt” is not the same as “shirt dress”. So, the similarity model requires to have guardrails to avoid embarrassing mistakes. Another downside is that token level similarity have limited coverage, and extending it significantly increases the risk of generating false positive results.
Besides token level similarity, there are other indirect measures which can establish the fact that two queries are similar. The mostly used e-commerce platforms work with session-based similarity. Generally, if a committed buyer uses two queries in the same search session, then with high likelihood these two queries are similar. Also, queries that are semantically related are similar. For example, one query can be a generalization or specialization of another query; both the queries can be for items which are replaceable (different brand, size); they can be for fitting, matching, complementary, accessory, or bundle items. Two queries can also be similar if they belongs to the same node in the item taxonomy tree. Note that, the different similarity cues may be indicator of different levels of similarity. Token-based similarity, aspect-based generalization, or specialization generally indicate high degree of similarity, as such, the query pair would be intended for identical or replaceable item. On the other hand, similarity derived from other cues, such as, session-based similarity or taxonomy-node similarity may not be for identical item. For instance, “samsung 85 inch tv” and “wall mount for tv” are two queries which are similar as both belongs to electronics category, but such similarity is relatively small as the queries are not for identical or replaceable items.
In e-commerce domain, queries follow a power-law distribution in terms of their frequencies over the site. Based on this, queries can be classified into head, torso, and tail queries. Due to the long-tail distribution, a significant number of queries belong to tail queries. Unlike head and torso queries, query similarity models perform much poorly for tail queries for many reasons: first, tail queries do not have significance presence in search session; second, not many product titles are associated with these queries; and most importantly, the user engagement data such as, click, view, and purchase rate for these queries are sparse and unreliable. So, it is better to learn query similarity for these queries by using a supervised learning setup. In such a setup, we train a model which takes representation of a pair of queries and their similarity values as input such that once the model is trained, it can be used to predict similarity between a pair of tail queries for which direct computation of query similarity is not accurate. We call this task query similarity prediction, which is the focus of this paper.
Given that query similarity is a continuous value, supervised prediction of this value seems to be a straightforward regression task. However, for better interpretation, the similarity value should be a closed range, such as, between 0 and 1. This makes it a regression task with additional constraint that the target value should be between 0 and 1. Another important requirement is that we want to predict high-level similarity (say similarity above 0.90) more accurately than low-level similarity (say between 0.5-0.9). This is due to the fact that correct usages of highly similar query helps buyers to retrieve her desired item and significantly boost platform’s monetization. This is similar to the fact that in information retrieval accurate ranking of search results at the head is much more important than the same at the torso or tail. Unfortunately, a regression task with square loss is agnostic of absolute similarity values and such a loss penalizes the error at all ranges of similarity values at the same scale. So, alternate models are needed which can prioritize the accurate similarity prediction of high similarity values than low similarity values.
For supervised prediction of query similarity, the way the queries are represented is an important consideration. While existing works uses off-the-shelf text embedding methods (Mikolov et al. 2013a; Logeswaran and Lee 2018; Pennington et al. 2014; Cer et al. 2018; Akbik et al. 2019; Bojanowski et al. 2016; Devlin et al. 2018), we explore different text embedding options to identify better query representation vectors for the task of query similarity prediction for e-commerce data.
In this work, we solve supervised query similarity prediction task by designing an ordinal regression model using neural networks. Our solution puts strong emphasis on the high similarity value ranges than low similarity value ranges, which serves a critical need in the production environment. Note that, although introducing more similarity buckets can make the query similarity prediction task a ranking problem, we do not intend to solve a ranking problem since within a similarity bucket the ranking among queries based on similarity scores is more often noise. We also develop innovative query representation vectors using spherical text embedding (Meng et al. 2019), which shows improved performance over well-known BERT (Devlin et al. 2018) -based text embedding. Using , an eBay dataset with around 10 million queries, ORDSIM shows substantial improvement over the existing state-of-the-art.
2. Related Works
Document similarity prediction is a well studied task in the information retrieval domain (Sun et al. 2021; Devlin et al. 2019; Thyagarajan 2015; Wang et al. 2017; Peng et al. 2020). However, most of the works in this domain predict similarity for web documents or traditional textual literature. These works are poor fit for e-commerce queries as e-commerce queries are short, and lacks syntactic structure. Among the existing works, Fuchs et al. (Fuchs et al. 2020) focuses on similarity on e-commerce product listings. They use pairs of listing titles and their matching search queries, and leverage a contextualized character language model, L2Q works as a bidirectional recurrent neural network to produce token importance weights. They demonstrate that plugging these weights into relatively straightforward listing similarity methods significantly improve the similarity results. A plenty of researches are performed for query suggestion which are generic and more applicable for search engine queries (Qi et al. 2016; Parikh et al. 2013). There exists an unsupervised approach for query suggestion in e-commerce domain where the query similarity scores are calculated based on popularity and purchase-efficiency of queries (Hasan et al. 2011). Other works focus on query re-writing among which Shing et al. provide an unsupervised approach (Singh et al. 2012), and Hirsch et al. (Hirsch et al. 2020) focus on whether a user will reformulate a query, Aritra et al. (Mandal et al. 2019) generate synonyms for query rewriting, and Xiao et al. (Xiao et al. 2019) focuses on dataset generation to reduce the gap between user query and product listings.
We adopted spherical text embedding based query representation in this work. In earlier works, representation learning in e-commerce domain is performed using feature engineering (Baeza-Yates et al. 2007; Sondhi et al. 2018). Traditional embedding approaches (Fuchs et al. 2020) or joint embedding of queries and items into a common vector space (Ahmadvand et al. 2021) are also considered. For text representation, a plenty of research have been performed which include Word2Vec (Mikolov et al. 2013c), GloVe (Pennington et al. 2014), FastText (Bojanowski et al. 2016), ELMo (Peters et al. 2018), Flair (Akbik et al. 2019), TSDAE (Wang et al. 2021), InferSent (Conneau et al. 2017), QuickThought vectors (Logeswaran and Lee 2018), Universal Sentence Encoder (Cer et al. 2018) and perhaps most notably BERT (Devlin et al. 2018). Recently, spherical text embedding (Meng et al. 2019) has been considered for text embedding, in which a text snippet is embedded on the surface of a d-dimensional unit sphere. In this work, we show that for short text, like e-commerce queries, spherical embedding performs better that BERT-based embedding.
A plenty of research works are performed in ordinal regression (Chu and Keerthi 2007; Zhu et al. 2021; Berg et al. 2021; Hiba and Keller 2021; Kleindessner et al. 2021; Gu et al. 2020; Liu et al. 2021). Among these, Wenzhi et al. (Mikolov et al. 2013b) uses a neural network architecture with a non-traditional loss function which is particularly suited for the ordinal regression task. CORAL model can perform ordinal regression directly(Mikolov et al. 2013b) and works with the last layer of a neural network like ORDSIM. Instead of one softmax unit at the output layer, sigmoid classifiers are designed for ordinal regression where is the total number of ordinal labels. Additionally, Jason et al. (Rennie and Srebro 2005) compiled a list of loss functions for ordinal regression and discussed their relative strength and weakness.
3. Problem Formulation
Let be a training dataset comprised of data instances where ’th training sample contains two e-commerce queries , and , i.e. . Since most e-commerce platforms have tool-set for automatically allocate the query to one or multiple taxonomy nodes, we assume that , and are associated taxonomy nodes of query , and , respectively. Furthermore, is the similarity value of the two queries in , where . Supervised query similarity learning task is to train a model so that the model is able to predict the similarity value between two queries for which the similarity value is unknown.
For training we use , a subset of which contains 6 million query-pairs and their similarity values as obtained from Cosine similarity of the embedding vectors of two queries in a pair. Distribution of similarity values in is shown in Figure 2. Left side of Figure 2 shows the distribution of the similarity values, and the right side of the figure shows the cumulative distribution of the same data. As we can see from these charts, the distribution of similarity values are skewed towards higher similarity values. In fact, most similarity values are higher than 0.5. About 36% of similarity values in the dataset falls between [0.95, 1]. This above behavior is expected because and are not uniformly chosen random query pair, rather they are related queries through product listing, user session, taxonomy node mapping, etc. The justification of using related query-pairs for is as follows: If two queries are not related, predicting their similarity is not important because they are usually not even candidates for query reformulation or query expansion/modification. On the other hand if multiple queries are highly similar to a given query, most of them are candidates for query reformulation or query expansion/modification and a correct ordering among the candidates is critical. Hence, the dataset only contains query-pairs that are known to be similar with a high similarity value and our task is to correctly rank the similar queries of a given query by predicting the correct similarity values using a supervised model.
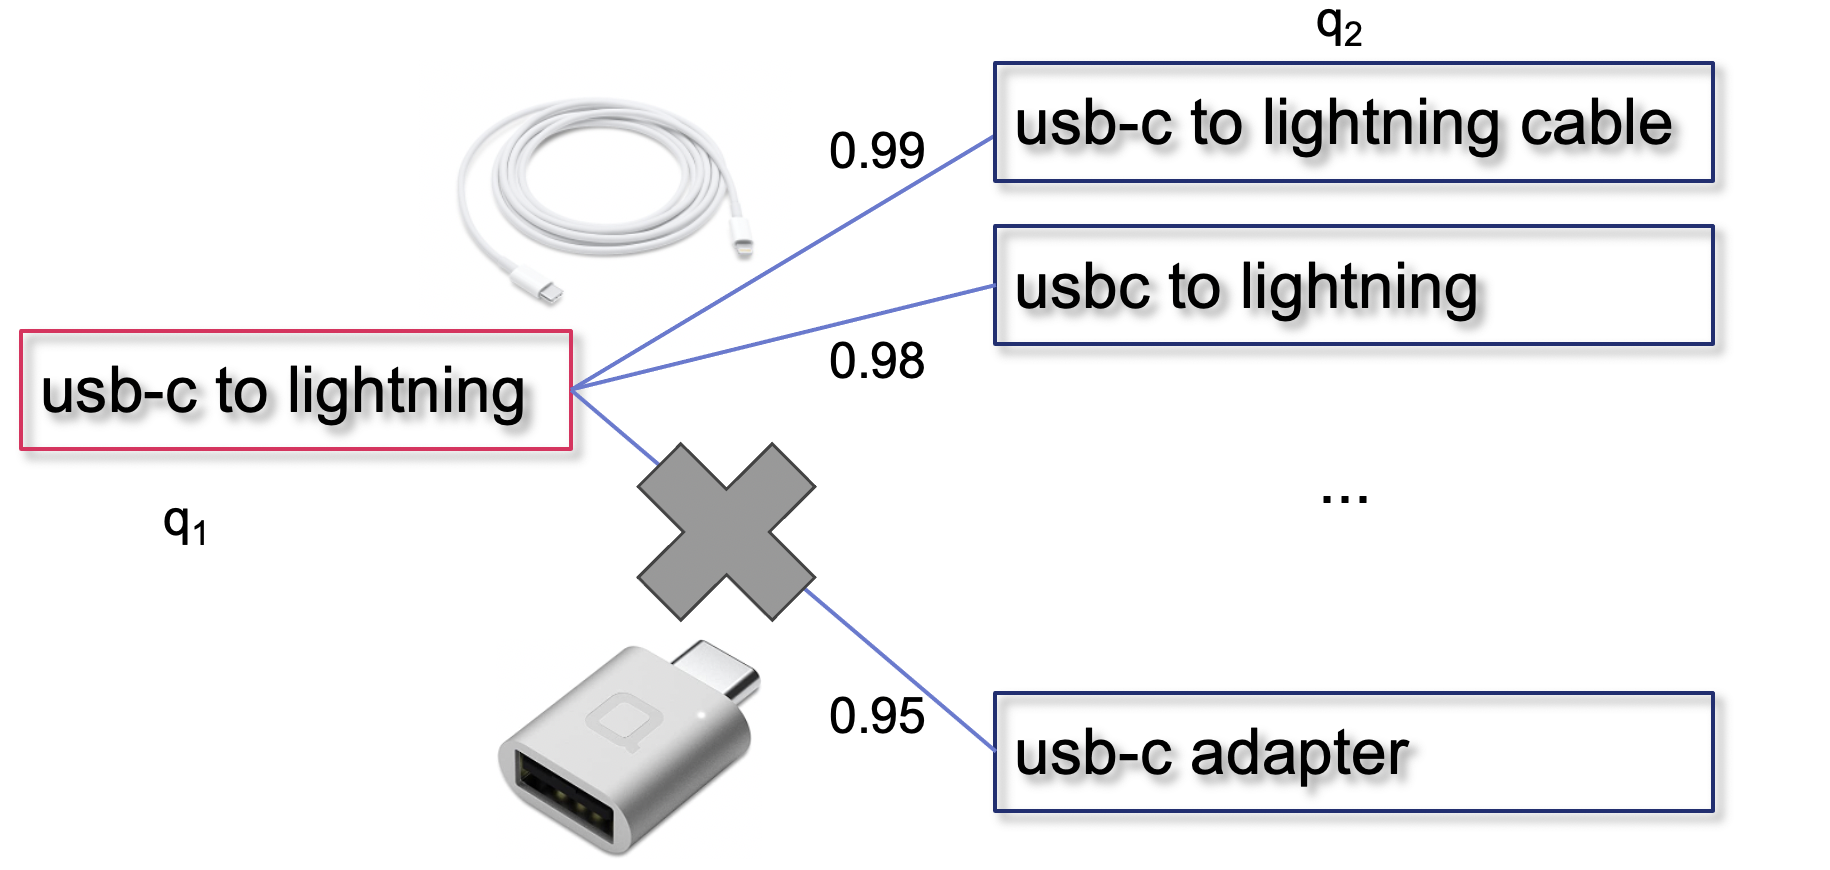


In Figure 1, we provide a real-life example from query set. Say, a query is “usb-c to lightning"; from our query embedding vectors, three most similar queries to this query are: “usb-c to lightning cable", “usbc to lightning", and “usb-c adapter" with similarity values 0.99, 0.98, and 0.95. Among these three queries, “usb-c adapter" is actually a different object even though the similarity value is a whopping 0.95! A correct ordering of the similar queries can help filter out false-positive similar queries with high similarity values. This example demonstrates that correct similarity prediction at a high similarity value is much more important than the same at a moderate or a low similarity value. One can also formulate this problem as a ranking problem, where the similarity rank orders at the head of the list is much more important than the similarity rank order at the torso or tail. Nevertheless, we do not want to solve this problem as a full ranking problem as the ranking model has higher complexity due to larger number of rank order constraints; specifically, for a given query if we consider similar candidate queries, we have binary rank order constraints.
A key challenge for solving this problem using regression is that it penalizes the prediction error at all ranges of similarity values at the same scale. However, for our dataset, very high similarity value represents identical query, moderate similarity value represents replaceable, alternate, or generalization/specialization of a query, and small similarity value represents query for other related items. Among these correctly predicting the similarity between highly similar queries is much more important than correctly predicting the similarity between moderate or small similarity queries. For instance, predicting the similarity value of 0.97 as 0.93 is much worse than predicting 0.70 as 0.74, although both have a deviation of 0.04.
To prioritize correct prediction of highly similar queries, we model the supervised query similarity prediction task as ordinal regression with ordinal value from non-uniform bucket size. At the high similarity value range, the bucket width is small, so a small deviation would cause an ordinal value error. On the other hand the bucket width is large at small similarity value. For instance, for the similarity data shown in the graph in Figure 2 (left),
For example, we can bucket the queries into five classes with the following similarity range (bucket) to ordinal label mapping: , and . Obviously higher ordinal label denotes higher level of similarity. Using the above bucketing, for our query similarity dataset, each bucket contains approximately 1.2-1.6 million queries but due to right skewed distribution, ordinal label representing high similarity value has a very small similarity value range, on the other hand ordinal value with small similarity value has a very large range. For instance, If there are two similarity values, say 0.4, and 0.65, both similarity are considered to be the same by ordinal label. On the other hand, similarity value above 0.97 is considered higher similarity than the similarity value of 0.95, as the former has an ordinal label of 4 and the latter has an ordinal label of 3. This non-uniform similarity width bucketing forces the model to correctly distinguish query similarity between Label 3 and Label 4; although both represent very high similarity (above 0.95), Label 4 may represents two queries which retrieves identical objects, on the other hand, Label 3 may not do so. We use to denote the similarity value to ordinal label function.
3.1. Mapping Similarity Value to Ordinal Label
Finding correct Ordinal buckets for similarity values in e-commerce queries requires experts’ observations and expertise. Additionally, the method of similarity calculation and distribution of the similarity values are also important. In this work the similarity values are Cosine similarities between the vector representations of corresponding query pairs.
A carefully designed map function transforms where is the ordinal label of , and such that . The goal is to represent in such a way that an Ordinal classification task captures the best ranking function
which minimizes a loss function, .

3.2. Could we perform multi-class classification?
If we consider the ordinal label as one class in a set of classes, then this task can also be solved as multi-class classification. However, for multi-class classification on such data, the categorical cross-entropy loss for wrong prediction of a single instance is constant and is oblivious of the magnitude of ordinal loss. So, on such data, multi-class classification is a poor fit.
Say, be a loss matrix of shape where is the loss for predicting the label as . Note that for both classification and ordinal regression, the loss and when . For classification, misclassification loss, is fixed , where . But for ordinal regression, the loss varies based on the magnitude of ordinal gap between the actual label and the predicted label; for instance, one can define the ordinal loss as both and are numeric values. Hence, ordinal regression is a preferred task over the multi-class classification, as the former reflects the extent of loss more accurately.
3.3. Methodology
ORDSIM uses a neural network based model for performing ordinal regression for query similarity prediction. Specifically to build ORDSIM, we design the output layer of a neural network so that it can adopt an ordinal loss function. In this way, ORDSIM is architecture independent and any neural network model can be made an ordinal regression model only by applying ORDSIM’s output layer. Below, we discuss ORDSIM’s loss function which the model optimizes.
3.3.1. Loss Function
We design a loss function for ORDSIM, which we refer as “All Threshold Mean Squared Error Loss function”, in short, ATMSEL. For a multi-layer perceptron, for an instance , say is the mapped ordinal label, after using mapping function on . ATMSEL penalizes a predicted instance based on how far the predicted score is from the mid-range of bucket. If is the mid-range of ordinal bucket , the ATMSEL loss function can be represented by the following equation:
| (1) |
During training, the loss function ATMSEL is applied at the output layer of the perceptron over a mini-batch and the model is trained by using backpropagation. In Figure 3, towards the right side, we show the mid-range of all ordinal buckets ( ordinal bucket are shown in the figure). Note that, both and are similarity value between 0 and 1. Their ordinal representation is only utilized in the loss function in Equation 1. Also note that in our current work, we fixed the left and right interval of similarity values for an ordinal label by observing the distribution of similarity values, but one can also adopt a more sophisticated methods for obtaining the similarity interval for each ordinal label.
To train the model let be the i’th training sample of . The representation vector of is the input of a neural network which is connected to two dense layers. Say, for the data instance , , , … , are the output values of the penultimate layer of the network. If, the weights associated with these values are , , … , respectively. the predicted similarity value, , is calculated by the following equation.
| (2) |
For instance, say an actual similarity value of two queries in the train dataset is 0.95 which resides between (0.9-0.95] bucket, and , and the corresponding predicted similarity value is 0.901. As ATMSEL penalizes based on deviation from , the error for this instance is . Furthermore, while ATMSEL is minimized, the predicted values tend to get centralized to the median of the corresponding buckets. That is why ATMSEL can capture the query similarity buckets better than other methods.
3.3.2. Model Architecture
We illustrate the architecture of the deep learning model in Figure 3. The main model is kept same for both CORAL and ORDSIM. To describe the model, recall where . Both and contain query text and category path text information which are shown by two circles and two squares respectively as described in the left side of Figure 3. and are then passed for representation learning. The embedding of and are the inputs of the main model. Followed by the embedding layer, two hidden layers are added with and neurons with dropout probabilities of and respectively. For both hidden layers we use activation function. The last layer differ between CORAL and ORDSIM. While we have already demonstrated ATMSEL loss function for ORDSIM, the CORAL model introduces sigmoid classifiers to perform the ordinal regression task.
3.4. Evaluation Metric
The evaluation metric for ordinal regression should measure the extent by which the predicted ordinal labels deviate from the actual ordinal labels. However, neither the actual similarities (s), nor the predicted similarities (s) are ordinal. So, we first map both and to ordinal values using the map function . Say, the corresponding ordinal label of both and are and , respectively. Then the evaluation metric Mean Average Label Error (MALE), is defined by the following equation:
| (3) |
MALE denotes the extent by which a predicted ordinal label deviates from its actual ordinal label.
3.5. Representation Learning
For applying the neural network model for the query similarity prediction task, the queries need to be represented as vectors in real space such that similar queries are embedded in close proximity which enables high query-query similarity prediction. We perform this through representation learning. Given the dataset , = () consists of a pair of e-commerce queries. For both the datasets and we also have a product taxonomy node (aka category node) associated with each query, so we leverage the category information to learn better representation of the queries. One can simply ignore the category as part of query representation if such information is not available. Both queries, and categories are text data, but the categories are also organized in a tree structure which we refer as category tree. For a query, along with the query text, the path-label of the nodes along the path from the root to the associated category node in the category tree is used for query representation.
To illustrate let a query be “t shirts for men pack"; for , the category for this query is Shirt. In the category tree the path to the Shirt node has the following labels: Clothing->Men’s Clothing->Shirt. The text tokens in this path-label, along with the text token from the queries are embedded in a vector space to obtain for embedding of the query. Many text embedding methods, such as, BERT (Devlin et al. 2018), Word2Vec (Mikolov et al. 2013a), FastText (Bojanowski et al. 2016) are popular in the information retrieval domain, but they are more suited for traditional text documents. E-commerce queries are different from traditional text documents as the former lacks proper syntactic structure. Additionally, most of the embedding methods like BERT (Devlin et al. 2018), Word2Vec (Mikolov et al. 2013a), FastText (Bojanowski et al. 2016) depend on training a large corpus such as Wikipedia, Google and the sentences in these datasets are different than e-commerce queries as most of the sentences in the datasets are complete and natural. This motivates us to build an alternative approach for query embedding, after modifying eBERT using spherical query embedding. Below we provide more details about these tools.
3.5.1. BERT and eBERT
Bidirectional Encoder Representations from Transformers (BERT) is proposed by researchers from Google (Devlin et al. 2018) which is not trained on any specific downstream task but instead on a more generic task called Masked Language Modeling. The idea is to leverage huge amounts of unlabeled data to pre-train a model on language modeling. Predicting the next word(s) given a context already requires understanding language to some extent. Next, this pre-trained model can be fine-tuned to solve different kinds of NLP tasks by adding a task specific layer which maps the contextualized token embeddings into the desired output function.
eBERT11 1 https://www.enterpriseai.news/2021/09/15/heres-how-ebay-is-using-optimization-techniques-to-scale-ai-for-its-recommendation-systems/ is an e-commerce specific version of the BERT model. Along with the Wikipedia corpus, 1 billion latest unique item titles are collected to train the model. The eBERT model can represent the e-commerce terms better than just using only Wikipedia corpus. In this work, to train the models, we use eBERT to embed both query and category text. We keep the embedding dimension of eBERT similar to BERT which is 768.
3.5.2. Spherical Text Embedding
Directional similarity is often more effective in tasks, such as, word similarity and document clustering. When textual units are embedded in the Euclidean space, two textual units may have zero directional distance, yet they are far from each other by Euclidean distance. This is not desirable when we are trying to predict the query similarity values, which are between 0 and 1, and was computed by directional similarity (Cosine) of two vectors. To overcome this, spherical text embedding (Meng et al. 2019) has been proposed, which embed the textual units on the surface of a unit d-sphere (d is the dimension). To learn embedding on unit d-sphere, an efficient optimization algorithm is proposed with convergence guarantee based on Riemannian optimization. Spherical text embedding shown to be highly effective on various text embedding tasks, including word similarity and document clustering. For embedding e-commerce query text, we also choose spherical text embedding as a candidate. To build the corpus of spherical text embedding, besides Wikipedia sentences, we introduce all of the 10 million e-commerce queries in the dataset, . We choose the dimensionality of the sphere as 100 as recommended by the original authors. We use each word as a textual unit for embedding task and then apply mean pooling over the words of a query to obtain query embedding vectors.
3.5.3. Poincaré Embedding
While BERT, eBERT, and spherical text embedding embed the category names as text data, the hierarchy information of the category nodes remains untapped by the embedding methods. Since the categories form a tree, and Euclidean space is not a good fit for representing a tree structure, in recent works many embedding methods are proposed which embed a tree-like data in hyperbolic space; for instance, Nickel et al.(Nickel and Kiela 2017) propose to embed a tree in a n-dimensional Poincaré ball. The neighboring vertices in the tree are expected to get closer in the hyperbolic space in terms of Poincaré distance. The loss function is optimized by Riemannian optimization.
In this work we embed the category tree described in section 3.5 with Poincaré embedding, and embedding of the category is used to perform different experiments. Note that, we do not have query embedding with Poincaré Embedding as the queries do not form any tree-like structure. To embed the category tree with Poincaré model we tune the embedding dimensions in range [5,120] with an interval of 5. Furthermore, the epochs are tuned in range [50,1000] with an interval of 50. The best embedding is picked in terms of best Mean Average Precision (MAP) which we get for dimension = 10, and epoch = 500.
3.6. Embedding of Query Pairs for Similarity Prediction
Recall where = (). Both and contain query text, but category information may or may not be added with and . If category information is excluded, we simply embed query text using mean pooling of word token representations. For the other two way of representations, category information is added. To embed query text we use both eBERT and spherical text embedding. While for category embedding along with eBERT and spherical text embedding, we use Poincaré model as well. To embed category path with eBERT and spherical text embedding mean pooling of the whole category path word tokens representations is used. In contrast, only the last category in the category path, which is the actual category is embedded with Poincaré model to represent category embedding.
4. Experiments and Results
We perform comprehensive experiment to show the effectiveness of ORDSIM for query similarity prediction. Besides, we also perform experiments to show how different embedding choices affect the performance of query similarity prediction task. Below we first discuss the dataset, and competing methods, followed by experimental results of the experiments.

4.1. Dataset
Our dataset, contains two eCommerce queries, their category nodes in terms of a prototypical e-commerce taxonomy, and the ground truth similarity values between a pair of queries. We build the ground truth similarity value between two queries by building association between two queries through the product titles aka listings against those queries. For a given query, we first rank the listings based on hit rate and purchase rate. Once there is a ranking of listings with respect to a given query, the corresponding query is embedded by mean pooling of the top product titles’ representations where the product titles are embedded using fasttext embedding method(Bojanowski et al. 2016). Then the similarity values between two queries are simply Cosine similarities of the corresponding query pairs’ representation vectors. Note that for , titles are missing but similarity values are provided. The goal of ORDSIM is to represent the queries without using product titles such that the similarity between queries can be captured. Note that it is not expected that every e-commerce query will have associated meaningful and adequate product titles. That’s why the query similarity prediction task aims to capture the most similar queries irrespective of having adequate associated titles.
| Baseline Methods | Query Embedding | Category Embedding | MALE |
|---|---|---|---|
| None | 0.981 | ||
| eBERT | Poincaré | 0.977 | |
| Linear Regression | eBERT | 0.954 | |
| None | 0.968 | ||
| Spherical | Poincaré | 0.953 | |
| Spherical | 0.923 | ||
| None | 0.895 | ||
| eBERT | Poincaré | 0.885 | |
| CORAL-Ordinal | eBERT | 0.816 | |
| None | 0.851 | ||
| Spherical | Poincaré | 0.843 | |
| Spherical | 0.781 | ||
| None | 0.791 | ||
| eBERT | Poincaré | 0.798 | |
| ORDSIM | eBERT | 0.567 | |
| None | 0.613 | ||
| Spherical | Poincaré | 0.559 | |
| Spherical | 0.459 |
The parent query similarity prediction dataset, contains 10 million entries, from which train, test and validation datasets are sampled randomly maintaining 6:2:2 ratio. All the train, test, and validation datasets are disjoint. The frequency distribution of the similarity values of the parent dataset, is shown in left side of Figure 2, whereas the cumulative distribution is shown on the right side. The distribution of similarity values is not uniform in the 0-1 range, rather it is right-skewed (similarity values are between 0.6 to 10); this is due to the fact that query-pairs in the datasets are not randomly chosen, rather they are chosen based on other similarity ques (such as category match, word token match, etc.). This is done intentionally because for query similarity prediction, we want the model to be able to predict similarity and correctly rank among the top candidates, not among arbitrary chosen queries. This also requires similarity prediction at the very high similarity value to be very accurate, even if it comes at the expense of poor prediction performance at lower similarity value.
Since we use want the similarity prediction at the high similarity value to be very accurate, we choose similarity interval of the ordinal labels judiciously. By carefully observing the similarity value distribution we have chosen 5 ordinal intervals between 0 and 4. The similarity value interval of these ordinals labels are as below: 0: (0.00 - 0.82], 1: (0.82, 0.90], 2: (0.90, 0.95], 3: (0.95, 0.97], and 4: (0.97, 1.0]. The frequency distribution over different ordinal labels are shown in Figure 4. As can be seen, the frequency of the ordinal labels are roughly uniform.
4.2. Competing Methods
There is hardly any research which performs ordinal regression in e-commerce queries. For baselines, we choose linear regression, and CORAL(Mikolov et al. 2013b) which can work on any corpus. Each of the baselines is trained with different representations of queries and categories. Note that, eBERT and spherical embedding for text can embed both queries and categories but Poincaré Embedding is performed only for categories.
4.2.1. Linear Regression
Linear regression (LR) although is not a good fit with ordinal regression, we consider LR as one of the baselines. The main reason for that is the query similarity values are well fitted with linear regression. Moreover, looking into the mean squared error (MSE) values, representation learning of the queries and categories can be validated easily. Finally, both the predicted and actual similarity values can be mapped to ordinal labels using the same map function . Once the ordinal labels are calculated, MALE can be calculated easily to evaluate the performance of LR.
4.2.2. CORAL-Ordinal
We use CORAL-Ordinal as one of the baselines which we have already described in section 2. Both ORDSIM, and CORAL introduce distinguished loss functions for ordinal regression. For a fair comparison, we keep the main model fixed for both of the methods. Only the output layer is changed between these two.
4.3. Training and Hyper-Parameters
For all the experiments, we have the previously described train, test, and validation splits. For each of the competing methods, the train split is used to train the model, the hyper-parameters of the best model are picked on the basis of the performance in the validation split, and each method is judged by the performance in the test split.
For both CORAL and ORDSIM we tune , for values {32, 64, 128, 256, 512}; and and are tuned for probability values [0.1-0.9] with an interval of 0.1. For both CORAL and ORDSIM, we get best performance for , , and . Number of epochs is 1000 for both methods. Both of them use early stopping with patience 30, and adam optimizer to converge. Lastly, the LR model is trained with the identical representation set up of for to minimize mean squared error loss. After getting the predicted similarity scores is applied to both predicted and actual similarities for evaluation purpose.
4.4. Results
In this subsection, we want to provide an extensive evaluation of all the learned query representations along with the baseline methods in terms of MALE. We want to show the best query representation, and overall best score by a method. Table 1 shows the performance of all the methods, and the winning representations and method(s) are marked with bold letters.
It is evident from the result that concatenating the embedding of the categories in the representation vector reduces MALE which proves the necessity of the category information in a query similarity task. Moreover, adding Poincaré embedding slightly reduces error than excluding the category information from the representation vector totally. Note that the learned vector in Poincaré space is different than Euclidean and Spherical embedding. Alongside the embedding space mismatch issue, for all the methods neural networks are trained in the Euclidean space. For linear regression, queries and categories represented by spherical text embedding achieves the best MALE (0.923), which is 3% better than Poincaré embedding. For all the methods, spherical text embedding for both query and category embedding provides the best representation of a term pair. For CORAL, MALE for the best representation is 0.781 which is 4% better than eBERT(0.816). CORAL performs better than linear regression for every representation. However, in terms of MALE, ORDSIM achieves the best score (0.459) which is approximately 42% better than the best of CORAL. Moreover, in terms of every representation ORDSIM performs better than any of the baselines including CORAL. This is because the CORAL method does not use one hot encoding of the labels. If one of the classifiers fails, count of consecutive ones from the left reduces which increases the MALE. Additionally, the performance in the most similar queries is affected. But for the e-commerce queries, identifying the most similar queries are very important which advocates the necessity of the proposed ORDSIM method.
To illustrate with an example, let the original ordinal label, for is 3. The CORAL represents as [1,1,1,0] as = 5. If the second classifier of CORAL fails, the predicted output is [1,0,1,0]. Note that the output will be interpreted as 1, as the number of consecutive ones from the left to right is 1. Hence, the predicted label is two distance away from the actual label. But = 3 represents the second most similar query bucket. Thus, the impact of the performance of CORAL in this particular case is severe. On the other hand, the median value for = 3 bucket is 0.96. So if the predicted similarity score is far away from this value, it will be penalised by ATMSEL. So ORDSIM can clearly handle these cases better than CORAL.
5. Conclusion and Future Work
In this paper, we develop a rank consistent method, ORDSIM for predicting query similarity. ORDSIM is architecture agnostic and can readily be implemented to extend multilayer perceptron. We experiment with an e-commerce dataset of 10 million queries and ORDSIM performs 42% better than the best competing method. Currently, for representation learning of the e-commerce queries, we use BERT and spherical text embedding. Representing queries with spherical text embedding can capture the query similarity better than other embedding methods. Moreover, the hierarchical information of the categories for representing queries did not add necessary information so far. One reason can be – categories are embedded in Poincaré space while queries are embedded in Euclidean space. In future, we want to use a kernel which transforms both the representations in a different space, and a carefully designed neural network can capture query similarity in that space.
References
- (1)
- Ahmadvand et al. (2021) Ali Ahmadvand, Surya Kallumadi, F. Javed, and Eugene Agichtein. 2021. DeepCAT: Deep Category Representation for Query Understanding in E-commerce Search. ArXiv abs/2104.11760.
- Akbik et al. (2019) Alan Akbik, Tanja Bergmann, Duncan Blythe, Kashif Rasul, Stefan Schweter, and Roland Vollgraf. 2019. FLAIR: An Easy-to-Use Framework for State-of-the-Art NLP. In Proceedings of the 2019 Conference of the North American Chapter of the Association for Computational Linguistics (Demonstrations). Association for Computational Linguistics, Minneapolis, Minnesota, 54–59. https://doi.org/10.18653/v1/N19-4010
- Baeza-Yates et al. (2007) Ricardo Baeza-Yates, Carlos Hurtado, and Marcelo Mendoza. 2007. Improving search engines by query clustering. Journal of the American Society for Information Science and Technology 58, 1793–1804. https://doi.org/10.1002/asi.20627
- Berg et al. (2021) Axel Berg, Magnus Oskarsson, and Mark O’Connor. 2021. Deep Ordinal Regression with Label Diversity. In 2020 25th International Conference on Pattern Recognition (ICPR). 2740–2747. https://doi.org/10.1109/ICPR48806.2021.9412608
- Bojanowski et al. (2016) Piotr Bojanowski, Edouard Grave, Armand Joulin, and Tomas Mikolov. 2016. Enriching Word Vectors with Subword Information. Transactions of the Association for Computational Linguistics 5.
- Cer et al. (2018) Daniel Cer, Yinfei Yang, Sheng-yi Kong, Nan Hua, Nicole Limtiaco, Rhomni John, Noah Constant, Mario Guajardo-Cespedes, Steve Yuan, Chris Tar, Yun-Hsuan Sung, Brian Strope, and Ray Kurzweil. 2018. Universal Sentence Encoder.
- Chu and Keerthi (2007) Wei Chu and S Keerthi. 2007. Support Vector Ordinal Regression. Neural computation 19, 792–815. https://doi.org/10.1162/neco.2007.19.3.792
- Conneau et al. (2017) Alexis Conneau, Douwe Kiela, Holger Schwenk, Loïc Barrault, and Antoine Bordes. 2017. Supervised Learning of Universal Sentence Representations from Natural Language Inference Data. 670–680. https://doi.org/10.18653/v1/D17-1070
- Devlin et al. (2018) Jacob Devlin, Ming-Wei Chang, Kenton Lee, and Kristina Toutanova. 2018. BERT: Pre-training of Deep Bidirectional Transformers for Language Understanding.
- Devlin et al. (2019) J. Devlin, Ming-Wei Chang, Kenton Lee, and Kristina Toutanova. 2019. BERT: Pre-training of Deep Bidirectional Transformers for Language Understanding. In NAACL.
- Fuchs et al. (2020) Gilad Fuchs, Yoni Acriche, Idan Hasson, and P. Petrov. 2020. Intent-Driven Similarity in E-Commerce Listings. Proceedings of the 29th ACM International Conference on Information & Knowledge Management.
- Gu et al. (2020) Bin Gu, Xiang Geng, Wanli Shi, Yingying Shan, Yufang Huang, Zhijie Wang, and Guansheng Zheng. 2020. Solving Large-Scale Support Vector Ordinal Regression with Asynchronous Parallel Coordinate Descent Algorithms. Pattern Recognition 109, 107592. https://doi.org/10.1016/j.patcog.2020.107592
- Hasan et al. (2011) Mohammad Hasan, Nish Parikh, Gyanit Singh, and Neel Sundaresan. 2011. Query suggestion for ECommerce sites. Proceedings of the 4th ACM International Conference on Web Search and Data Mining, WSDM 2011, 765–774. https://doi.org/10.1145/1935826.1935927
- Hiba and Keller (2021) Shakediel Hiba and Yosi Keller. 2021. Hierarchical Attention-based Age Estimation and Bias Estimation.
- Hirsch et al. (2020) Sharon Hirsch, Ido Guy, Alexander Nus, Arnon Dagan, and Oren Kurland. 2020. Query Reformulation in E-Commerce Search. 1319–1328. https://doi.org/10.1145/3397271.3401065
- Kleindessner et al. (2021) Matthäus Kleindessner, Samira Samadi, Muhammad Zafar, Krishnaram Kenthapadi, and Chris Russell. 2021. Pairwise Fairness for Ordinal Regression.
- Liu et al. (2021) Huan Liu, Jiankai Tu, and Chunguang Li. 2021. Distributed Ordinal Regression Over Networks. IEEE Access 9, 62493–62504. https://doi.org/10.1109/ACCESS.2021.3074629
- Logeswaran and Lee (2018) Lajanugen Logeswaran and Honglak Lee. 2018. An efficient framework for learning sentence representations.
- Mandal et al. (2019) Aritra Mandal, Ishita K. Khan, and Prathyusha Senthil Kumar. 2019. Query Rewriting using Automatic Synonym Extraction for E-commerce Search. In eCOM@SIGIR.
- Meng et al. (2019) Yu Meng, Jiaxin Huang, Guangyuan Wang, Chao Zhang, Honglei Zhuang, Lance Kaplan, and Jiawei Han. 2019. Spherical Text Embedding.
- Mikolov et al. (2013a) Tomas Mikolov, Kai Chen, G.s Corrado, and Jeffrey Dean. 2013a. Efficient Estimation of Word Representations in Vector Space. Proceedings of Workshop at ICLR 2013.
- Mikolov et al. (2013b) Tomas Mikolov, Kai Chen, G.s Corrado, and Jeffrey Dean. 2013b. Efficient Estimation of Word Representations in Vector Space. Proceedings of Workshop at ICLR 2013.
- Mikolov et al. (2013c) Tomas Mikolov, G.s Corrado, Kai Chen, and Jeffrey Dean. 2013c. Efficient Estimation of Word Representations in Vector Space. 1–12.
- Nickel and Kiela (2017) Maximilian Nickel and Douwe Kiela. 2017. Poincaré Embeddings for Learning Hierarchical Representations. In Advances in Neural Information Processing Systems 30, I. Guyon, U. V. Luxburg, S. Bengio, H. Wallach, R. Fergus, S. Vishwanathan, and R. Garnett (Eds.). Curran Associates, Inc., 6341–6350. http://papers.nips.cc/paper/7213-poincare-embeddings-for-learning-hierarchical-representations.pdf
- Parikh et al. (2013) Nish Parikh, Gyanit Singh, and Neel Sundaresan. 2013. Chapter 20 - Query Suggestion with Large Scale Data. In Handbook of Statistics, C.R. Rao and Venu Govindaraju (Eds.). Handbook of Statistics, Vol. 31. Elsevier, 493–518. https://doi.org/10.1016/B978-0-444-53859-8.00020-5
- Peng et al. (2020) Shuang Peng, Cui Hengbin, Niantao Xie, Sujian Li, Jiaxing Zhang, and Xiaolong Li. 2020. Enhanced-RCNN: An Efficient Method for Learning Sentence Similarity. 2500–2506. https://doi.org/10.1145/3366423.3379998
- Pennington et al. (2014) Jeffrey Pennington, Richard Socher, and Christopher Manning. 2014. GloVe: Global Vectors for Word Representation. In Proceedings of the 2014 Conference on Empirical Methods in Natural Language Processing (EMNLP). Association for Computational Linguistics, Doha, Qatar, 1532–1543. https://doi.org/10.3115/v1/D14-1162
- Peters et al. (2018) Matthew Peters, Mark Neumann, Mohit Iyyer, Matt Gardner, Christopher Clark, Kenton Lee, and Luke Zettlemoyer. 2018. Deep contextualized word representations.
- Qi et al. (2016) S. Qi, Dingming Wu, and N. Mamoulis. 2016. Location Aware Keyword Query Suggestion Based on Document Proximity. IEEE Transactions on Knowledge and Data Engineering 28 (2016), 82–97.
- Rennie and Srebro (2005) Jason Rennie and Nathan Srebro. 2005. Loss functions for preference levels: Regression with discrete ordered labels. Proceedings of the IJCAI Multidisciplinary Workshop on Advances in Preference Handling.
- Singh et al. (2012) Gyanit Singh, Nish Parikh, and Neel Sundaresan. 2012. Rewriting Null E-Commerce Queries to Recommend Products. In Proceedings of the 21st International Conference on World Wide Web (Lyon, France) (WWW ’12 Companion). Association for Computing Machinery, New York, NY, USA, 73–82. https://doi.org/10.1145/2187980.2187989
- Sondhi et al. (2018) Parikshit Sondhi, Mohit Sharma, Pranam Kolari, and ChengXiang Zhai. 2018. A Taxonomy of Queries for E-commerce Search. 1245–1248. https://doi.org/10.1145/3209978.3210152
- Sun et al. (2021) Xiaofei Sun, Yuxian Meng, Xiang Ao, Fei Wu, Tianwei Zhang, Jiwei Li, and Chun Fan. 2021. Sentence Similarity Based on Contexts.
- Thyagarajan (2015) Aditya Thyagarajan. 2015. Siamese Recurrent Architectures for Learning Sentence Similarity.
- Wang et al. (2021) Kexin Wang, Nils Reimers, and Iryna Gurevych. 2021. TSDAE: Using Transformer-based Sequential Denoising Auto-Encoder for Unsupervised Sentence Embedding Learning.
- Wang et al. (2017) Zhiguo Wang, Wael Hamza, and Radu Florian. 2017. Bilateral Multi-Perspective Matching for Natural Language Sentences. 4144–4150. https://doi.org/10.24963/ijcai.2017/579
- Xiao et al. (2019) Rong Xiao, Jianhui Ji, Baoliang Cui, Haihong Tang, Wenwu Ou, Yanghua Xiao, Jiwei Tan, and Xuan Ju. 2019. Weakly Supervised Co-Training of Query Rewriting AndSemantic Matching for e-Commerce. In Proceedings of the Twelfth ACM International Conference on Web Search and Data Mining (Melbourne VIC, Australia) (WSDM ’19). Association for Computing Machinery, New York, NY, USA, 402–410. https://doi.org/10.1145/3289600.3291039
- Zhu et al. (2021) Haiping Zhu, Hongming Shan, Yuheng Zhang, Lingfu Che, Xiaoyang Xu, Junping Zhang, Jianbo Shi, and Fei-Yue Wang. 2021. Convolutional Ordinal Regression Forest for Image Ordinal Estimation. IEEE Transactions on Neural Networks and Learning Systems, 1–12. https://doi.org/10.1109/TNNLS.2021.3055816