Quantifying the Predictability of ENSO Complexity Using a Statistically Accurate Multiscale Stochastic Model and Information Theory
Abstract
An information-theoretic framework is developed to assess the predictability of ENSO complexity, which is a central problem in contemporary meteorology with large societal impacts. The information theory advances a unique way to quantify the forecast uncertainty and allows to distinguish the predictability limit of different ENSO events. One key step in applying the framework to compute the information gain representing the predictability is to build a statistically accurate dynamical model. To this end, a recently developed multiscale stochastic model, which succeeds in capturing both the large-scale dynamics and many crucial statistical properties of the observed ENSO complexity, is incorporated into the information-theoretic framework. It is shown that different ENSO events possess very distinct predictability limits. In addition to the ensemble mean, the ensemble spread also has remarkable contributions to the predictability. While the information theory indicates that predicting the onset of the eastern Pacific El Niños is challenging, it reveals a universal tendency to convert strong predictability to skillful forecast for predicting many central Pacific El Niños about two years in advance. In addition, strong predictability is found for the La Niña events, corresponding to the effective discharge process. In the climate change scenario with the strengthening of the background Walker circulation, the predictability of sea surface temperature in central Pacific has a significant response with a notable increase in summer and fall. Finally, the Gaussian approximation is shown to be accurate in computing the information gain, which facilitates the use of more sophisticated models to study the ENSO predictability.
1 Introduction
El Niño-Southern Oscillation (ENSO) is the most significant interannual climate signal in the tropics (62; 42; 53; 56). In the classical viewpoint, ENSO was often regarded as a phenomenon with cyclical attributes (36), in which the positive and negative phases are El Niño and La Niña, respectively. Yet, ENSO is known to show a significant diversity and irregularity (11; 71). Many studies have suggested that there are at least two types of ENSO (2; 79; 39). Based on the features during their mature phase, they are named as the eastern Pacific (EP) and the central Pacific (CP) types when the largest sea surface temperature (SST) anomaly is located near the coast of the South America and the dateline region, respectively (79; 39). In addition to these two major categories, different ENSO events exhibit diverse characteristics in spatial pattern, peak intensity, and temporal evolution, which is known as the ENSO complexity (71; 7; 33).
Due to its crucial impacts on both the regional and the global climate, simulating and forecasting ENSO has long been a focus of research in related fields. Through unremitting efforts, considerable achievements have been made and a series of ENSO models with a hierarchy of complexity have been developed, including conceptual models (75; 64; 36; 57), simple models (47; 27), intermediate complex models (80; 81; 69; 4; 54) and general circulation models. These models can generally successfully forecast the typical indices of ENSO 6 to 12 months in advance, thereby providing a reliable basis for many other climatic predictions that depend on the forecast of ENSO (35; 3).
In spite of these achievements, there is still an expectation to further improve the ENSO forecast skill. However, before that can be done, it is essential to quantitatively understand what is the upper limit of the forecast skill, i.e., the potential predictability of ENSO. Furthermore, in addition to the overall predictability, it is of more practical importance to explore the predictability of different types of the ENSO events due to the distinct features and impacts related to the ENSO complexity. Understanding the gap between the potential predictability and the prediction skill can provide guidelines to the improvement of the existing models and the current forecast methods. Such a study may also suggest that the efforts for further improving the forecast of certain types of the ENSO events is futile if they are inherently unpredictable. It is worthwhile to notice that the conventional time series based path-wise measurements for assessing the ENSO forecast skill, such as the anomaly correlation coefficient and the root-mean-square error (RMSE) of the ensemble mean time series, are not the most suitable metric for quantifying the predictability of ENSO. First, despite being able to reveal some qualitative information related to the predictability, such as the spring prediction barrier, it remains unclear from the results associated with these path-wise errors the exact upper limit of the forecast skill. Second, ENSO is intrinsically a chaotic (or turbulent) system, which means quantifying the forecast uncertainty is indispensable. However, the deterministic forecast (including the ensemble average) together with the path-wise measurements lacks the ability of the uncertainty quantification in the forecast, without which the meaning of the absolute path-wise error is less explainable for chaotic systems. Third, computing these path-wise skill scores requires a large number of data points, which often span for a long observational period. Thus, despite the possible ability to indicate certain overall characteristics, it is challenging to adopt these measurements for understanding the predictability of each individual ENSO event.
In this paper, an information-theoretic framework (41; 21; 49) is developed that allows a systematic study of the potential predictability of the ENSO complexity. Fundamentally different from the deterministic methods, the information-theoretic framework exploits the statistical forecast to quantify the predictability of each individual event in a complex chaotic system. The indicator of the predictability within this framework is the time evolution of the information distance between the forecast distribution resulting from an ensemble forecast and the climatological one from the observational data. It denotes the additional information provided by the ensemble forecast that is beyond the prior known climatology, which is also called the information gain. Therefore, the information distance remaining in a high level suggests a long potential predictability. Similarly, the information distance rapidly decaying to zero implies that there is no need to run the model forecast beyond that point since the forecast becomes indistinguishable from the climatological distribution. It is notable that, if the information distance is near zero, then the ensemble mean forecast is expected to be close to the climatological mean, which often leads to an unskillful forecast in the path-wise sense as well. Thus, the predictability resulting from the information theory naturally provides an upper bound of the prediction skill, which satisfies the general definition of the predictability. There are several desirable features of adopting such an information-theoretic framework to understand the predictability of chaotic systems (40; 20; 19), including the ENSO. First, as the focus of the framework is the entire distribution, which is also called the probability density function (PDF), the quantification of forecast uncertainty has been taken into account in the assessment of the predictability. This is vital for chaotic systems as each single forecast trajectory often deviates quickly from the truth. Second, in contrast to the calculation of the path-wise skill scores at a fixed lead time that requires a large number of the ensemble mean forecast results with different initializations, the information theory allows to quantify the predictability of a specific event starting from a given initial condition. In fact, the forecast distribution at a fixed lead time can be formulated by the collection of different forecast ensemble members. Such a unique feature allows us to distinguish the predictability limit of different ENSO events, which is crucial for understanding and advancing the prediction of the ENSO complexity.
Although the concept of information theory has been proposed for decades, there exists a major barrier in applying the information theory to effectually quantify the predictability of many complex natural phenomena. In fact, the effectiveness of the resulting predictability from the information theory depends on the model that is utilized for the statistical forecast. A necessary condition of the reliable predictability provided by the information theory is the statistical accuracy of the forecast model. Otherwise, the model error rather than the intrinsic predictability may become the dominant component of the information distance (8; 30; 16). However, reproducing the statistical features is often not the most primary focus of the existing dynamical models. Therefore, special cautions need to be paid for assessing the predictability when these models are incorporated into the information-theoretic framework. Although the information theory has been applied to study the basic overall El Niño predictability in the EP region (66) and leads to some interesting insights, it is unclear about the proportion of the explainable information gain there related to the actual predictability and due to the model error, respectively. On the other hand, some simple purely data-driven or statistical models, such as the linear regression models and the linear inverse models, are able to recover certain basic statistics, for example, the climatology covariance (23; 1). However, the lack of the crucial nonlinear dynamics and explainable physics may also impede these models for characterizing the predictability of nature since the transient behavior using the purely data-driven models can be very different from that of the actual nonlinear chaotic systems.
To facilitate the quantification of the ENSO predictability within the information-theoretic framework, a recently developed conceptual multiscale stochastic model for the ENSO complexity is utilized in this study (13). To our knowledge, this is the first simple model that can accurately capture many desirable large-scale dynamical properties and statistical features of the ENSO complexity. The model starts with a deterministic three-region system for the interannual variabilities. Then two stochastic processes of the intraseasonal and decadal variation are incorporated. The model can reproduce not only the general properties of the observed ENSO events, but the complexity in patterns (e.g., CP vs. EP El Niño events), intensity (e.g., 10-20 year reoccurrence of extreme El Niños), and temporal evolution (e.g., more multi-year La Niñas than multi-year El Niños) as well. Notably, the model can also accurately simulate the PDFs, the power spectra and the seasonal phase-locking of the SST variations in both the CP and EP regions. In addition, the low computational cost of such a conceptual model allows us to use a large number of the ensembles for the study here, avoiding the statistical error due to the undersampling issue. Therefore, this model is a suitable candidate for us to explore the predictability of ENSO complexity from the perspective of the above mentioned information-theoretic framework. Notably, understanding the predictability of the ENSO complexity is a much more challenging but important task than studying the overall SST predictability in only the EP region.
The rest of this paper is organized as follows. The general framework of quantifying the predictability of complex natural phenomena using information theory is presented in Section 2. Section 3 introduces the datasets used in this study. It also includes a brief summary of the statistically accurate multiscale stochastic conceptual model. Section 4 presents the overall ENSO predictability while the predictability of different ENSO events related to the ENSO complexity is analyzed in Section 5. The sensitivity analysis, including the ENSO predictability in the climate change scenarios and the role of each multiscale component in affecting the ENSO prediction, is investigated in Section 6. The conclusions and discussions are provided in Section 7.
2 An Information-Theoretic Framework: Quantifying the Predictability of Complex Natural Phenomena
We start with building the general framework of using information theory to quantify the predictability of complex natural phenomena, which will then be applied to the study of the ENSO complexity. The key quantities within the framework are a) the forecast PDF from a suitable model, b) the initial value and the climatological PDF obtained from observational data, and c) a simple and effective approach to compute the information distance between and . A schematic illustration of the framework is summarized in Figure 1, which contains four steps.
Step 1. Computing the climatological PDF and the temporal autocorrelation function (ACF) from observational data.
The observational climatological PDF plays a vital role, serving as a reference solution, in the study of the predictability via the information-theoretic framework. Given the observational data, say for simplicity an index (time series), the climatological PDF can be computed by first drawing the histogram from the data and then normalizing it. In practice, is often a time periodic function with period being one year, representing the seasonal cycle. Therefore, if a partition consisting of 12 equidistant points is used to formulate such a time-periodic function, then all the data corresponding to a specific month can be used to compute the associated climatological PDF for that month.
On the other hand, the ACF is not explicitly involved in computing the information gain for quantifying the predictability. Nevertheless, it is of fundamental importance in Step 2, serving as one of the central guidelines for the development of a statistically accurate dynamical model that is used to compute the time evolution the forecast PDF . Autocorrelation is the correlation of a signal with a delayed copy of itself as a function of delay (28). The ACF measures the overall memory of a chaotic system and describes the averaged convergence rate of the statistics towards the climatology. For a zero mean and stationary time series , the ACF can be calculated as
| (1) |
where is the delay and is the total length of the time series. The limit is taken for the mathematical rigor. In practice, the ACF is approximated by using a finite value of in (1), provided that is sufficiently large.
Step 2. Development of a statistically accurate dynamical model.
This is one of the most vital and challenging steps that involve the incorporation of important physics into the framework. In fact, the prerequisite of applying the information theory for the quantification of predictability is to develop a suitable model that provides the ensemble forecast PDF . The accuracy of the resulting information gain depends on the skill of such a model in reproducing nature. The calculated information gain is exact only when the perfect model of nature is adopted. Otherwise, the resulting information gain used to explain the predictability can be polluted by the model error. However, the perfect model is never known in practice. Therefore, to mitigate the error in computing the information gain, it is important to build a statistically accurate dynamical model for characterizing nature. Specifically, two necessary conditions have to be satisfied that facilitate the mitigation of the model error in calculating the information gain related to the predictability (50; 51).
(a) Model fidelity: The model must have the skill to reproduce the climatological PDF of nature. Such a necessary condition guarantees the consistency of the model at long lead times with the observational statistics. If the model lacks the fidelity, then the information distance between and at long lead time will never become zero. As a consequence, the predictability will become infinity, which is erroneous.
(b) Model memory: The model must be able to capture the overall temporal autocorrelation of nature. Satisfying the model fidelity guarantees the long-term statistics being captured. However, without additional constraints, the model fidelity itself is not sufficient to ensure that the time evolution of the statistics and the associated relaxation tendency towards the climatological distribution of the model are consistent with those of nature. In other words, the time evolution of the information gain computed from the model can be biased due to the failure of model in capturing the transient behavior of nature. Since the ACF measures the overall memory of a chaotic system, the difference between the temporal ACFs can be utilized as a simple and effective practical criterion to characterize the similarity of the transient behavior between the two systems. A suitable model that can be used for the information-theoretic framework should have the ACF that resembles the one of nature.
To provide intuitions, some illustrative example of the model fidelity and the model memory are included at the right top corner of Figure 1. The blue shading area represents the time evolution of the climatological PDF computed from observational data. The red shading area stands for the time evolution of the model PDF starting from a specific observed event, the actual time evolution of which is denoted by the black solid curve. The four rows show the results using different models. The model in the first row satisfies both the model fidelity and model memory since the time evolution of the model statistics tracks the observational trajectory and it converges to the same climatology as the observations. The models in the second and the third row also satisfy the model fidelity but the relaxation of the statistics towards the climatology are either much slower or much faster than that of nature for this given observed event. These two models fail to characterize the overall memory of nature. The model in the last row has a consistent autocorrelation with nature but the variance of the climatological PDF is underestimated compared with nature, which means the model fidelity is not satisfied.
In practice, stochastic parameterizations and statistical closure approximations can be incorporated into the existing models to improve the statistical accuracy (6; 58; 18; 31). The additional components can be calibrated by a certain optimization algorithm with the minimization of the error in the PDFs and ACFs being the cost function. This can be easily implemented for at least simple or conceptual models (63; 14; 17).
Step 3. Ensemble forecast with a given initial value: aiming to obtain the forecast PDF at different lead time .
The forecast PDF is computed by running the model repeatedly forward in time starting from a given initial condition from observations (with a slight perturbation if needed). Due to the random forcing or the intrinsic chaotic behavior of the model, different realizations will be distinct with each other. Collecting all the forecast realizations allows to form a forecast PDF at each lead time .
Step 4. Computing the information gain as a function of forecast lead time .
With the observational climatological PDF and the time evolution of the forecast PDF in hand from the previous steps, what remains is to develop an appropriate information criterion to compute the difference between and . Such a difference represents the additional information in beyond the observational climatology, which naturally reflects the potential predictability (41; 10).
Since the comparison is two PDFs, the information theory is a more appropriate choice than the path-wise measurements. One natural way to assess the information gain in compared with the climatological PDF is through the relative entropy (20; 49; 41),
| (2) |
which is also known as Kullback-Leibler divergence or information divergence (44; 46; 45). Despite the lack of symmetry, the relative entropy has two attractive features. First, with equality if and only if . Second, is invariant under general nonlinear changes of variables. These provide an attractive framework for assessing the information gain as well as quantifying the model error and model sensitivity in other applications (9; 22; 30; 48; 67; 40; 68; 52; 15).
One practical setup for utilizing the framework of information theory in many applications arises when both the measurements involve only the mean and covariance so that
can be approximated by Gaussian distributions. In this case, has the explicit formula
| (3) |
where is the transpose, det is the determinant of a matrix, and is the dimension of the state variable used to compute the relative entropy. In (3), the first term in brackets is called ‘signal’, reflecting the information difference in the mean but weighted by the inverse of the climatological variance, , whereas the second term in brackets, called ‘dispersion’, involves only the information distance regarding the covariance ratio, . The signal and dispersion terms in (3) are individually invariant under any (linear) change of variables which maps Gaussian distributions to Gaussians.
Note that, although the relative entropy has a lower bound when , it has no upper bound. For the convenience of presentation, a rescaled version of the relative entropy will be utilized in the remaining of the paper (29),
| (4) |
and therefore is scaled to the interval . The rescaled relative entropy is still a monotonically increasing function as the difference between and . In the following, the relative entropy, together with its signal and dispersion components, refers to the rescaled version in (4). Such a rescaled information gain in (4) is served as the indicator of the predictability.

3 Observational Data Sets and the Statistically Accurate Model for the ENSO Complexity
3.1 Data Sets
The monthly ocean temperature and current data are both from the GODAS dataset (5). The thermocline depth along the equatorial Pacific is approximated from the potential temperature as the depth of the C isotherm. The analysis period is from 1982 to 2019. Anomalies presented in this study are calculated by removing the monthly mean climatology of the whole period. In this work, the Niño4 () and Niño3 () indices are the average of SST anomalies over the regions E-W, S-N (CP) and W-W, S-N (EP), respectively. The index is the mean thermocline depth anomaly over the western Pacific (WP) region (E-, S-N) while the index is the mean mixed-layer zonal current in the CP region.
The daily zonal wind data at 850 hPa from the NCEP–NCAR reanalysis (37) is used to depict the intraseasonal wind bursts. By removing the daily mean climatology, the wind burst index is obtained by averaging the anomalies over the WP region. Besides, the Walker circulation strength index is adopted to measure the effect of the decadal variation in the characteristics of ENSO. Based on the definition of 38, it is defined as the sea level pressure difference over the CP/EP (W-W, S-N) and over the Indian Ocean/WP (E-E, S-N). Note that the monthly zonal SST gradient between the WP and CP region is highly correlated with this Walker circulation strength index (correlation coefficient of ), suggesting significant air–sea interaction over the equatorial Pacific. Since the latter is more directly related to the zonal advective feedback strength over the CP region, the decadal model () mainly illustrates this variable.
3.2 Definitions of different types of the ENSO events
To quantify the complexity of ENSO, the definitions of different El Niño and La Niña events are as follows [based on the average SST anomalies during boreal winter (December–January–February; DJF)]: Following the definition in 43, when the EP is warmer than the CP and is greater than C, it is classified as the EP El Niño. Among this, based on the definitions used by 74, an extreme El Niño event corresponds to the situation that the maximum of EP SST anomaly from April to the next March is larger than C. When the CP is warmer than the EP and is larger than C, the event is then defined as a CP El Niño. Finally, when either the CP and EP SST anomaly is cooler than C, it is defined as a La Niña event.
3.3 The multiscale stochastic model for ENSO complexity
In this work, a multiscale stochastic conceptual model is used to study the predictability of ENSO complexity, which was recently developed in 13. This is a three-region model, aiming to reproduce the observed dynamical and statistical features in both the CP and EP regions. The combination of suitable stochastic parameterizations with nonlinear interactions between interannual, intraseasonal and decadal variabilities allows the model to generate different types of the observed ENSO events. As is shown in 13, this model succeeds in capturing the large-scale ENSO complexity and the associated statistics. Here, we briefly summarize the main components of this model, while more details can be found in the original paper.
The model starts with a deterministic, linear and stable system for the interannual variabilities (24). It is a general extension of the classical recharge oscillator model (36) and depicts the air-sea interactions over the entire WP, CP and EP. That is, it includes both the ocean heat content discharge/recharge and the ocean zonal advection. Then, two stochastic processes with multiplicative noise describing the intraseasonal wind bursts and the decadal variation in the Walker circulation are incorporated to depict ENSO’s irregularity and the decadal variation in the strength and occurrence frequency of EP and CP El Niño events (71; 26). The model reads:
| (5a) | ||||
| (5b) | ||||
| (5c) | ||||
| (5d) | ||||
| (5e) | ||||
| (5f) | ||||
Here, the interannual component, i.e., Eqs. (5a)-(5d), depicts the main dynamics for both the CP and EP types of ENSO; the intraseasonal equation, Eq. (5e) represents the amplitude of the random wind bursts (); and the decadal part, Eq. (5f) represents the variation in the strength of the background Walker circulation (). In the model, and are the SST in the CP and EP, is the ocean zonal current in the CP and is the thermocline depth in the WP. As was discussed in 13, also stands for the zonal SST difference between the WP and CP, which directly determines the strength of the zonal advective feedback.
In this model, the stochasticity plays a crucial role in coupling variables at different time scales and parameterizing the unresolved features in the model. First, the intraseasonal variation is depicted by a simple stochastic differential equation, Eq. (5e) with a state-dependent (i.e., multiplicative) noise coefficient , where is a white noise source. is then coupled to the processes of the interannual part serving as external forcings. In addition, four Gaussian random noises , , and are further added to the processes describing the interannual variabilities, which effectively parameterize the additional contributions that are not explicitly modeled, such as the subtropical atmospheric forcing at the Pacific Ocean and the influences from the other Ocean basins. In a more general sense, these stochastic noises can be regarded as the simplest way for stochastic parameterization, which increases the model variability such that the PDFs of the model variables can better match those of the observational data (55). Second, since the details of the background Walker circulation consist of uncertainties and randomness (12), a simple but effective stochastic process is used to describe the temporal evolution of the decadal variability (78), where in Eq. (5f) is another white noise source. The multiplicative noise in the process of is aimed at guaranteeing the positivity of due to the fact that the long-term average of the background Walker circulation is non-negative. Besides, the effects of seasonality are added to both the wind activity and the collective damping to depict the seasonal phase-locking characteristics realistically, which manifests as the tendency of ENSO events to peak during boreal winter (73; 65; 25).
The dimensional units and the parameters in the coupled model are summarized in Table 1.
3.4 The dynamical and statistical features of the model
As was studied in 13, this model can reproduce many desirable dynamical and statistical features of the observed ENSO complexity. Figure 2 illustrates a comparison between the model simulations and the observations. Panels (a)–(b) include the Hovmoller diagrams of the SST, which are reconstructed by a bivariate linear regression, where the regression coefficients at each longitude is provided by computing the correlations of its SST value with the time series of and , respectively (13). These two panels reveal that the model can reproduce different types of the ENSO events with dintinct locations, amplitudes, and durations, as are observed in nature. Panels (c)–(j) compare the model statistics with the observations in both the CP and the EP regions. The skillful recovery of the non-Gaussian climatological PDFs and the ACFs indicates that the model satisfies both the necessary conditions in the information-theoretic framework, namely the model fidelity and the model memory. In addition, the observed power spectrum and the seasonal phase-locking features are captured by the model. Therefore, the model utilized here is statistically accurate and involves the basic large-scale dynamical features of the ENSO complexity, which provides a reasonable justification for applying it to the study of the predictability within the information-theoretic framework.
Before analyzing the predictability of ENSO complexity utilizing the information-theoretic framework, it is necessary to conduct a simple test of the model’s representation of the observational forecast errors. To do this, a 2000-year long model simulation is generated and it is divided into 54 non-overlapping segments, each of which has the same length of time as the observations, i.e., 1982–2019. For each segment, we forecast and based on 100 ensembles. For observations, we use the observed , , , , and as the initial values, while for different model segments the corresponding exact values from the simulation are utilized as the initialization. Figure 3 shows the forecast error for each segment (including the observation), i.e., the RMSE between the forecast ensemble mean and the true fields. It is seen that there is no significant difference in the forecasting ability of ENSO between the observation and model simulations for both and . That is, the longer bars corresponding to the observations are all covered by the mean and one standard deviation of the statistics obtained from the model segments. The results here suggest that the model is also capable of producing very realistic ENSO properties from a forecasting perspective, which further strengthens the justification of utilizing the model in studying the predictability of the ENSO complexity.


4 The Overall ENSO Predictability
4.1 The overall predictability, its Gaussian approximation, and the signal-dispersion decomposition
Figures 4 and 5 show the information gain of and , respectively, as a function of the starting date (x-axis) and the lead time (y-axis). The calculation of the information gain follows the information-theoretic framework developed in (2). An ensemble forecast by running the multsicale stochastic model (5) forward is utilized to compute the time evolution of the PDF, where the observation data of all the six variables are directly adopted as the initial value for the ensemble forecast. Since the model is a low-dimensional system, a large number of the ensembles containing members is utilized in the ensemble forecast, which ensures that the sampling error due to the insufficient ensemble number is negligible. The one-dimensional marginal distribution of and is utilized, respectively, in Figures 4 and 5 for computing the information gain from the formula in (4). The same setup is adopted in Section 5 when the predictability of different types of the events is studied. In Figures 4 and 5, the solid red line, purple line and blue line at the top of each panel mark the years with EP El Niño, CP El Niño and La Niña, respectively. To clarify the definition of “an(a) EP El Niño/CP El Niño/La Niña year”, an entire calendar year is treated provided that such an event is observed in the year even if it lasts only for a couple of months (especially at the end of the year corresponding to the boreal winter). The following conclusions can be drawn from these two figures.
First, the time evolution of the information gain, namely the predictability, varies significantly as the starting date. In particular, the predictability limit of the events starting from a La Niña year is longer than those starting from both the CP and the EP El Niño years. Yet, different individual events display distinct predictability limits. Such a finding has a remarkable significance for the study of the predictability of ENSO. It implies that it is too crude to employ a single value of the predictability limit for the entire ENSO, which is however what the path-wise measurements can often provide for assessing the ENSO forecast skill by averaging over the entire testing period. Instead, it is anticipated that the ENSO predictability needs to be quantified for each individual event related to the ENSO complexity. The details will be analyzed in Section 5.
Second, comparing Panel (a) in the two figures, it can be seen that overall has more predictability than . This is somewhat counterintuitive as the strength of the CP events is often weaker than that of the EP ones. However, special cautions need to be paid here: EP events and CP events do not solely correspond to and . In fact, both events have composited variations of and . The reason for the stronger predictability of is that its time series has a stronger temporal correlation than that of (see Figure 2), indicating a potential to have a stronger predictability limit. In fact, it has been shown that the skillful prediction (above the threshold of pattern correlation ) remains at a longer lead time in predicting than (76; 61).
Third, comparing Panels (a) and (b) in both figures, the Gaussian approximation seems to be an efficient and accurate simplification in computing the information gain, which is consistent with the finding in an earlier work that studied the SST in the EP region (66). Such a conclusion has a profound influence on applying the information theory to studying the ENSO predictability based on more sophisticated models, in which only a small number of the ensembles is affordable. A small ensemble size is often insufficient to recover the entire non-Gaussian PDF especially for high dimensional systems but it may provide a reasonably accurate Gaussian approximation of the PDF (28). Yet, it is important to highlight that the skillfulness of the Gaussian approximation only implies that the information gain due to the higher order statistics behaves in a similar way as that from the mean and the variance. It does not suggest a linear model with Gaussian statistics is sufficient for the study of the predictability here. In fact, the information difference between the non-Gaussian climatological PDF with the optimal Gaussian approximation is quite significant, which means a linear model with Gaussian statistics will violate the model fidelity to a large extent. Nevertheless, the high similarity between the total information gain and its Gaussian fit allows us to simply consider the latter in the remaining of the paper, which also facilitates the discussions with its signal-dispersion decomposition.
Finally, from the signal-dispersion decomposition of the information gain, it can be concluded that the signal part dominates the total information gain in while both the signal and dispersion parts have remarkable contributions to . Note that the latter is different from the qualitative conclusion in 66, possibly because the model fidelity was not fully taken into account in that earlier work. The significant contribution from the dispersion part also indicates the importance of considering the entire forecast ensembles in characterizing the predictability instead of focusing on only the ensemble mean that merely impacts the signal part of the total information gain.
4.2 The predictability as a function of the starting month
Figure 6 shows the predictability performance of and as a function of the starting month. The results confirm that has overall a stronger predictability than and its main contributor is the signal part while the dispersion is a non-negligible component for predicting . One particularly interesting finding from this figure is related to the well-known spring prediction barrier problem in many practical model forecasts and the persistence, which says the ENSO forecast skill drops significantly when straddling boreal spring. Yet, from the perspective of information theory, the forecast around spring does not demonstrate any significant barrier. On the contrary, the overall predictability is even longer for the events starting from the spring season, especially the SST in the CP region. This indicates that if accurate and proper information can be obtained around spring, there might be a potential to make meaningful ENSO forecasts at long lead times, beyond the information provided by the climatology. Such a conclusion is also consistent with the results in a recent study (25).
To further understand the difference in the ENSO predictability with different initial conditions, the three columns of Figure 7 show the information gain in predicting and starting from those dates, which belong to the EP El Niño years, the CP El Niño years and the La Niña years, respectively (see the bars at the top of each panel in Figure 4 or 5). The additional messages provided by Figure 7 is as follows. First, a stronger predictability is observed if the forecast starts from a La Niña year than a year with either type of the El Niño, especially when the starting date ranges from January to June. The contribution from these La Niña years accounts for the overall stronger predictability in the spring season, as was shown in Figure 6, since the results associated with the El Niño events are the opposite. The stronger predictability starting from a La Niña year is probably related to the more effective discharge process of El Niño at its mature stage (59). Quantitatively, El Niño has a predictability of 6–10 months in general, while La Niña has a much longer one, which can often exceed two years. Such a finding suggests that there remains a potentially large gap between our current level of ENSO forecast and its predictability, which has a room for the further improvement. Second, it is noticed that the information gain of (red curves) starting from the second half of the year for both the EP and CP El Niño years has a clear reemergence. This is mainly related to the climatological PDF structure of , that is, the PDF of is more concentrated around the mean than that of during summer and autumn. In other words, the variance of is smaller than that of during those seasons (see Panels (g)–(h) in Figure 2). For the El Niño forecast starting from the second half of the year, it tends to become a La Niña event due to its effective discharge process, where the center of the anomalous SST is often closer to the CP. As a consequence, the ensembles have a negative mean value of , which leads to a large difference compared with the climatological PDF. This explains the reemergence of the information gain. Third, comparing the two types of the El Niño events, the EP type of El Niño shows a stronger reemergence at the longer lead time for the forecast that begins in the fall or winter than the CP events. In addition, the EP type of El Niño generally has a slightly stronger predictability than the CP type. This is consistent with our intuition since the EP type of the El Niño usually has stronger amplitude. It is also not contradictory with the conclusion drawn from Figures 4–5 that overall has stronger predictability than .


5 Predictability of Different ENSO Events Consisting of the ENSO Complexity
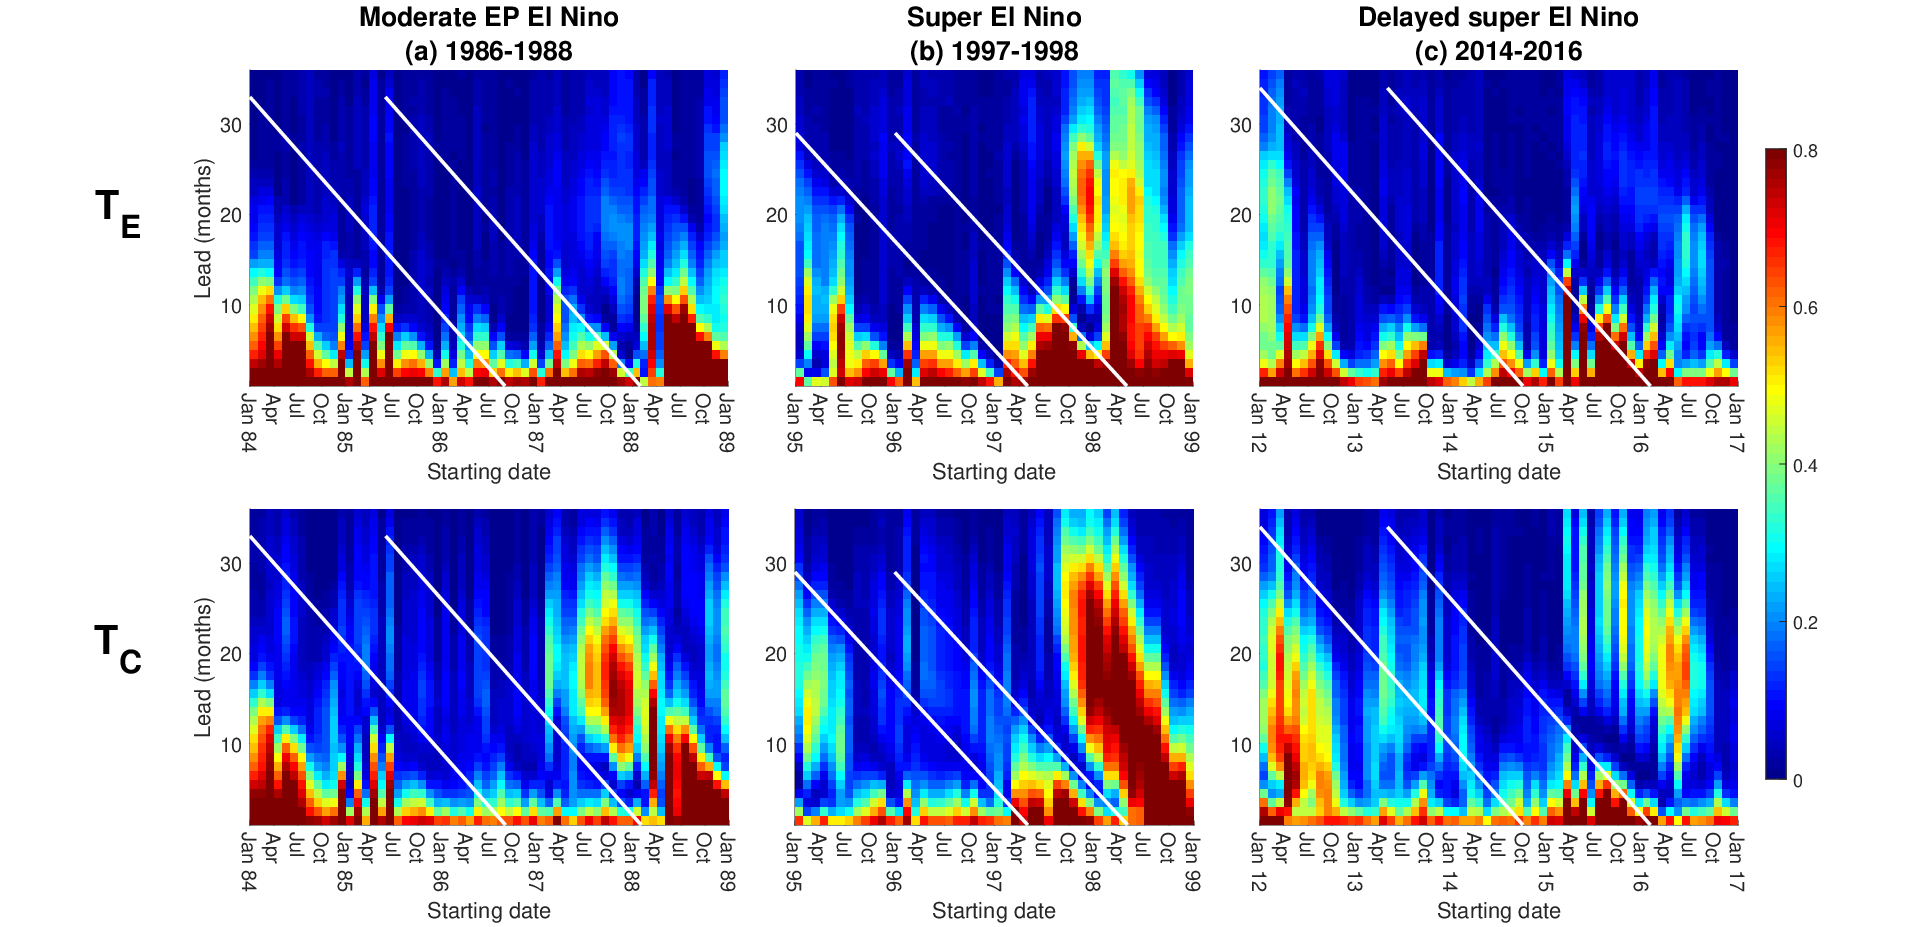
Figures 8, 12 and 14 show the information gain in predicting 7 different ENSO events that consist of the ENSO complexity: 1) a moderate EP El Niño (1986-1988), 2) a super El Niño (1997-1998), 3) a delayed super El Niño (2014-2016), 4) an isolated CP El Niño (2004-2005), 5) a mixed CP-EP El Niño (2009-2010), 6) a single-year La Niña (1988-1989) and 7) a multi-year La Niña (1999-2000). See Section 3.2 for the definitions of these events. In these figures, the x-axis is the starting date while the y-axis is the forecast lead time in the unit of month. The two white solid lines provide the time window within which the corresponding event is active.
5.1 Moderate EP El Niño, super El Niño and delayed super El Niño
First, according to Figure 8, the information gain along the first white solid line for all the three EP El Niño events decays to zero very quickly, which indicates that it is very challenging to predict the onset phase of the EP El Niño events. In fact, the westerly wind bursts are believed to be one of the major triggering effects of the EP El Niño events (32; 72; 60). However, the wind bursts lie in the intraseasonal time scale and are inherently hard to be forecasted in the interannual time scale. This leads to the intrinsic difficulty in effectively predicting the onset of the EP El Niño.
In addition to the common features in the predictability of all the three EP El Niño events, there are also some differences between them. Column (a) of Figure 8 shows the predictability of the 1986-1988 moderate EP El Niño event. When the starting date is at the growing phase of the event (i.e. October 1986 to March 1987), the significant value of the information gain maintains only for about 6 months. When the starting date is after the event peak, i.e., July 1988, the predictability starts to become longer. This is because the initial value of the SST at these time instants is stronger than the climatological mean value, which provides additional important information that facilitates the prediction. One notable finding is that, if the starting time is between July 1988 to January 1989, then the information gain of within the first 10 months is close to zero. Nevertheless, the information gain has a significant increase afterwards and peaks at the lead time of about 15 to 20 months. Such a peak time undoubtedly corresponds to the subsequent La Niña event. The predictability is related to the effective discharge process. The time span before the information gain reemergence corresponds to the phase change time from El Niño to La Niña and the time for the information passing from the EP region to the CP area. Different from the moderate EP El Niño event, Column (b) shows that starting from both the growing phase (April) and the mature phase (October) of the 1997-1998 super El Niño, the information gain is significant for more than 10 months, though the gain is more pronounced for a short lead time in the latter case which is expected. This indicates the potentially stronger predictability of super El Niño than the moderate events, even starting from the late spring season, which is also consistent with the current prediction skill using various models.
Column (c) of Figure 8 shows the result of the 2014-2016 delayed super El Niño. It can be seen that the predictability reaches a local peak if the starting date is around July 2014, which corresponds to the mature phase of the moderate El Niño event in this three-year episode. Then regarding the subsequent super El Niño in 2015, the information gain has a similar tendency as that in 1997-1998. The only difference is that the information gain of the 2015 event seems to be sensitive to the starting date. Specifically, the information gain remains significant if the starting date is April or June 2015 while the gain is consistently tiny regardless of the forecast lead time if the starting date is March, May or July. This is related to the rapid change of the wind bursts in 2015, which is one of the main triggering effects of the super El Niño (34; 12; 70; 77). In fact, as is shown in Figure 9, the westerly wind bursts suddenly disappear in 2015 May while other variables stay in the consistent states. As a consequence, there is no mechanism in lifting the ensemble members towards extreme values, which can be seen in Column (c) of Figure 10. The Hovmoller diagram in Figure 11 validates such a finding. It also shows that the reconstructed spatiotemporal pattern is poorly predicted starting from May 2015 in the ensemble mean forecast while the forecast is much more accurate if the starting date is either April or June. Note that the ensemble forecast PDF starting from March or May 2015 relaxes quickly towards the climatology while that starting from April or June is very distinguishable from the climatological PDF with the help of the strong wind bursts that also account for a large percentile of the ensemble members to forecast the 2015 super El Niño event. These ensemble evolutions explain the sawtooth profile in Column (c) of Figure 8 for the predictability and links the forecast skill with the predictability.
Finally, it is noticeable that, the predictability of extends further in time than that of for all the three types of the EP El Niño events when the starting date is before or during the events. This seems to reach an opposite conclusion compared with the overall predictability shown in Figures 4–5, which says has a weaker potential predictability than . Yet, as was discussed in the previous section, the latter is due to the large contribution from the La Niña events. Therefore, such a comparison again highlights the large discrepancy in the predictability of different types of the ENSO events and indicates necessity of studying each type of the events.


5.2 Isolated CP El Niño and mixed CP-EP event
Column (a) in Figure 12 shows the predictability of a single-year (or isolated) CP event in 2004-2005 while Column (b) displays that of a mixed CP-EP event in 2009-2010. When the forecast starts from anytime during the single-year CP event, the predictability remains quite weak. This is not surprising since the SST anomaly for most of the CP events is not as strong as the EP ones and therefore the additional information provided by the initial condition dissipated within a short time. In contrast, the predictability is more pronounced for the mixed CP-EP event, in which the strong EP SST contributes to the overall predictability and the information passes from the EP to the CP region.
In addition to these basic discoveries, there is one very interesting finding for both the events. That is, starting from about 20 months in advance (January 2003 and May 2008 respectively), the information gain can tell that the ensemble forecast distribution at the CP event peak is significantly different from the climatological PDF. Notably, this is not observed in the EP El Niño or La Niña events (Figures 8 and 14) and it seems to be a unique feature of the CP El Niño. Although a large information gain does not necessarily guarantee an accurate forecast, it does imply the forecast contains additional information beyond the climatology. In other words, there could be a potential to predict the occurrence of the CP events about two years in advance if suitable improvement is implemented in the current forecast systems.
To understand if the information gain remaining significant at the 20-month lead time is a universal characteristic for all CP events, Figure 13 shows the information gain in predicting for different CP El Niño or CP-EP mixed events, which are marked next to the Hovmoller diagram in Panel (a). Among these events, shown in Panels (b)–(g), of them clearly demonstrate such a feature; they are the one in years 1994-1995, 2002-2003, 2004-2005 and 2009-2010. The CP event during 2018-2019 also reveals a tendency of the predictability at this long lead time, although the information gain is quite weak. On the other hand, the CP event during 1991-1992 does not display strong predictability. However, the warm SST center of the 1991-1992 event locates more towards the EP region compared with the other CP events, which might be the reason for the distinct behavior of the information gain of this event. Panels (h)–(j) show the ensemble forecast for the 1994-1995, the 2002-2003, and the 2009-2010 events. Clearly, the ensembles at a lead time around 20 months is quite distinguishable from the climatology, which confirms a large information gain. However, it is worthwhile to highlight again from these results that the predictability does not necessarily mean the skillful prediction. In fact, despite a large information gain, the ensemble mean time series is far from the observations during 1994-1995 event in Panel (h). Fortunately, the observed event is still captured by some ensemble members. Therefore, if a large information gain is obtained, then it is justified to conclude the forecast is distinguishable from the climatology while each plausible event from the forecast is assigned with a certain probability. On the other hand, the ensemble evolutions in Panel (i) show a skillful forecast for the 2002-2003 event, converts the predictability to the actual prediction skill, while those in Panel (j) also accurately predict the occurrence of the 2009-2010 CP El Niño.


5.3 Single-year and multi-year La Niñas
The predictability of a single year La Niña event (1988-1989) and a multi-year La Niña event (1998-2001) is shown in Figure 14. The results here confirm the conclusion discussed in the previous section that the La Niña events usually have stronger predictability since they are the discharge phase of the ENSO cycle. One interesting finding in the 1988-1989 single-year La Niña event is that the bound of the significant value of the information gain is consistent with the La Niña’s demise (the white line). This implies the forecast ensembles reaching the climatological PDF is in phase with the relaxation of the La Niña towards the quiescent state. Such a finding indicates that this La Niña event follows exactly the discharge-recharge paradigm and is therefore predictable. On the other hand, the 1998-2001 multi-year La Niña shows a strong predictability when the forecast begins from either the preceding El Niño event, even with the spring starting time, or the onset of the negative SST phase (middle of year 1998). The information gain decays as the starting time becomes 1999 or 2000, at which the amplitude of the initial value becomes weak.
Finally, Figure 15 includes some intuitive results. It shows the ensemble forecast of the 1998-2001 multi-year La Niña and the 2004-2005 isolated CP El Niño. As is shown in Column (a), starting from January 1998, the ensembles of for the 1998-2001 event evolve in a very different way from the climatological PDF for more than two years, which accounts for the large information gain as was shown in Panel (a) of Figure 14. In fact, the ensemble mean here also tracks the truth in an accurate fashion. Thus, the strong predictability in such a situation indeed converts to the skillful forecast. On the other hand, as is shown in Column (b), the initial values of both and at January 2004 are close to zero and the ensembles spread quickly towards the climatology as well. In such a case, despite that the time series of the true event is consistently included within the ensemble spread, the forecast ensembles cannot effectively provide any useful additional information beyond the climatology.


6 Sensitivity Analysis
6.1 ENSO predictability in the climate change scenarios
Recall, in the multiscale stochastic model (5), the variable represents the background dynamic Walker circulation and varies in the decadal time scale. One important practical issue is to understand the ENSO predictability in the climate change scenarios, which can be implemented by perturbing in the model. The study in this subsection is based on perfect model twin experiments with different choices of the decadal variability . The perfect model twin experiments mean the model is first used to generate synthetic time series as “observations” and then the same model is used for quantifying the predictability. The reason to exploit the perfect model twin experiment is that the observational data of the possible future climate change scenario are not available. Since the model has been shown to be statistically accurate and the predictability of the model-generated time series has been validated to resemble that of the observations under the current climate (not shown here), the perfect model twin experiments are expected to at least provide some qualitatively useful conclusions. In the following, three perfect model twin experiments are carried out:
- (a)
- (b)
- (c)
The main results are illustrated in Figure . Panel (a) shows the number of different ENSO events occurred per 70 years. To include the uncertainty quantification, the confidence intervals are also added to the bar plots. These confidence intervals are computed based on 30 independent model simulations, each of which is 70-year long as the observations from 1950 to 2020. As a further validation of the model, the occurrence frequency of each type of the ENSO events from the standard model run is compared with the observations under the current climate scenario. Despite a slight overestimation of the La Niña events in the model, the occurrence frequencies of all the other types of the events from the model match the observations very well, including the overall El Niño events, the CP events, the EP events, the extreme El Niño events, the multi-year events for both El Niño and La Niña. These comparisons provide reasonable justifications of utilizing the perfect model twin experiments to study the predictability in the climate change scenarios.
Panel (a) also shows that, with the strengthening of the background Walker circulation, the occurrence of the El Niño events increases while that of the La Niña decreases. Among different types of the El Niño events, the occurrence of the CP El Niño turns into more frequent while the extreme EP events become seldom to happen. On the other hand, although the total number of the La Niña events decreases, the frequency of the multi-year La Niña occurrence remains the same as the current climate. Therefore, according to the analysis of the predictability of the ENSO complexity in Section 5, it is anticipated that the predictability of should increase as becomes large while that of remains at the same level as in the current climate. This conjecture is confirmed by Panels (b) and (d). In particular, the extended predictability of is mainly observed in summer and fall seasons. In addition, the predictability of is overall unchanged, although a slightly increment of the dispersion part is found. Similarly, if the dynamic Walker circulation is constantly weakened (with ), then the predictability of decreases, especially in spring and fall (Panel (c)), while that of does not have obvious changes.
To summarize, in the climate change scenarios, the predictability of has the most significant response. When the background Walker circulation becomes stronger (weaker), the predictability of increases in summer and fall (decreases in spring and summer), while the predictability of in winter and that of throughout the year remains almost unchanged.
6.2 Role of the multiscale components in affecting the ENSO prediction
The focus of this subsection is on studying the influence of different model variables on the ENSO forecast, especially those that are not included in the classic recharge-discharge theory but play a crucial role in ENSO complexity. These variables include the intraseasonal zonal wind stress , the decadal variable (proportional to the strength of the zonal advective feedback), and the zonal current .
Such a study can also naturally fit into the information-theoretic framework with a slight rearrangement of the PDFs in computing the information distance,
| (6) |
In (6), the reference solution is the standard run of the ensemble forecast utilizing the full model (5) while the PDF comes from running a “reduced model” in which one of the above mentioned variables is set to be zero. Then the information difference from (6) (after rescaling using (4)) is the information loss by ignoring the contribution from the specific variable.
Figure shows the information loss by in the absence of the intraseasonal zonal wind stress . It has been pointed out that the wind bursts are crucial to the ENSO development, especially to the SST in the EP region (32; 72; 60). This is confirmed by the information theory, where an enormous information loss is found by ignoring in the model ensemble forecast. Notably, the composites of the loss of information in predicting and are very different. The loss of information is mainly on the dispersion part for predicting , which means the ensemble spread is significantly underestimated. Therefore, although the EP SST is dominated by the interannual air–sea interactions, the intraseasonal information provides as a supply by the up-scale cascade. This also indicates that a large portion of the variability in comes from . In other words, triggers many events in the EP area, especially the extreme El Niños (34). On the other hand, despite the role of on is not as strong as that on , it still has a pronounced impact on the information gain in the CP area. Different from the prediction of , the information loss in predicting by excluding is mainly reflected in the signal part. This implies the random wind bursts can influence the deterministic component of the dynamics of and lead to a mean bias in the forecast.
Next, Figure explains the impact of the decadal variability on the ENSO predictability. It is seen that modifies both and with a significant and synchronized decadal variation feature. In particular, strong influence of on the SST is found around 2000, 2010 and 2018, which are the years with La Niña and CP El Niño events. Therefore, although the ENSO events lie in the interannual time scale, the decadal variability is important for improving the predictability of ENSO in both CP and EP regions.
Finally, the loss of information by excluding the contribution from the zonal current in the CP is shown in Figure . The loss of information caused by ignoring in the forecast system is similar to that by disregarding the contribution from the decadal variability , except that the influence of on the ensemble prediction is mainly found in the CP region. In fact, and are strongly correlated in driving the time evolution of . Since is one of the main driven mechanisms of the CP El Niño events, it has a direct contribution to the SST in CP area. On the other hand, the contribution of to the La Niña is not as significant as that of . Taking into account both Figures and , it can be concluded that, in the period of weak that leads to a minor contribution from the ocean zonal current, ENSO’s development can be effectively described by only considering the vertical processes in the EP, e.g., the thermocline feedback. This is the main reason that in the 1980s and 1990s the simulations and forecasts of ENSO utilizing the traditional models with an emphasis on the thermocline feedback are very successful. However, in the period of strong (e.g., after 1999), ignoring the effect of the zonal current has a strong negative impact on the ENSO simulations and forecasts.
7 Conclusions and Discussion
In this paper, an information-theoretic framework is developed to assess the predictability of complex chaotic systems in nature. The information theory advances a unique way to quantify the forecast uncertainty in exploring the predictability and allows to distinguish the predictability limit of each individual event in a complex system, which cannot be achieved by the traditional path-wise measurements. Understanding the gap between the intrinsic predictability and the prediction skill can provide potential guidelines to the improvement of the existing models and the current forecast methods. Such a study may also suggest that the efforts for further improving the forecast of certain types of the events is futile if they are inherently unpredictable. One of the most important steps in applying such a framework in practice is to build a statistically accurate dynamical model that can unbiasedly characterize the target phenomenon. Otherwise, the obtained information gain that represents the predictability may be polluted by the model errors.
The information-theoretic framework is then applied to quantifying the predictability of ENSO complexity, which includes different types of the ENSO events in both the EP and the CP regions with diverse characteristics in spatial pattern, peak intensity, and temporal evolution. While most of the conventional models focus on describing certain key dynamical properties of ENSO, a recently developed multiscale stochastic model succeeds in capturing both the large-scale dynamics and many crucial statistical properties of the observed ENSO complexity, including the PDFs, the seasonal phase-locking, the power spectrums and the ACFs of the SST in both the EP and CP regions. These desirable features allow the model to be a unique statistically accurate dynamical system that facilitates the use of the information-theoretic framework to study the predictability of the ENSO complexity. Main conclusions are summarized as follows:
- •
[Distinct predictability for different events]. Different ENSO events possess very distinct predictability limits. Therefore, it is too crude to employ a single value of the predictability limit for the entire ENSO, as the path-wise measurements often do for assessing the ENSO forecast skill.
- •
[Importance in both signal and dispersion]. The CP SST overall has more predictability than the EP SST . Although the signal part dominates the total information gain in , both the signal and dispersion parts have remarkable contributions to . The latter indicates the importance of considering the entire forecast ensembles in characterizing the predictability instead of focusing on only the ensemble mean.
- •
[No obvious spring barrier]. The overall predictability starting from the spring season does not demonstrate any significant barrier. This indicates that if accurate and proper information can be obtained around spring, there might be a potential to make meaningful ENSO forecasts at long lead times, beyond the information provided by the climatology.
- •
[EP El Niños]. The information theory based predictability indicates that it is overall challenging to accurately predict the onset of the EP events, as the random wind bursts are one of its main triggering mechanisms. Both the predictability and the prediction skill may also differ significantly with a slight change of the starting date due to the rapid adjustment of the wind burst amplitude.
- •
[CP El Niños]. There seems to be a universal tendency that, starting from about 20 months in advance of a CP El Niño event, the time evolution of the information gain is always significant at the timing of the target CP event. Remarkably, the strong predictability indeed converts to the skillful forecast for predicting many CP events about 2 years in advance.
- •
[La Niñas]. Stronger predictability is found in the La Niña events than both types of the El Niños, which is related to the more effective discharge process of ENSO at its mature stage.
- •
[Climate change scenario]. In the climate change scenario with the strengthening of the background Walker circulation, the predictability of has a significant response with a notable increase in summer and fall. The predictability of remains almost unchanged.
- •
[Role of different variables]. The loss of information becomes significant for predicting EP El Niño if the wind bursts are ignored and the main loss comes from the dispersion part, which is particularly detrimental to predicting the extreme events. The information loss in predicting by excluding the wind is also notable in the signal part, which may lead to a mean bias in forecasting . In contrast, the ocean zonal advection mainly affects the predicability of the CP El Niño. In addition, the decadal variability is important for improving the predictability of ENSO in both CP and EP regions.
- •
[Justification of the Gaussian approximation]. The Gaussian approximation is shown to be efficient and accurate in computing the information gain. Such a justification facilitates the use of the information theory to studying the ENSO predictability based on more sophisticated models, in which only a small number of the ensembles is affordable.
This paper presents a first step towards utilizing the information theory for understanding the predictability of the ENSO complexity. One practical task is to utilize the findings from the information-theoretic framework as the potential guidelines to improve the existing models and forecast methods. In particular, taking into account the potential predictability corresponding to the dispersion part deserves more emphasis in the model improvement. Another interesting topic is the multi-model forecast, where the information theory can be used for the model selection that allows an optimal combination of different models to predict each type of the ENSO events. In addition, the exact initial conditions are used in the study of this paper. Yet, data assimilation is an essential step towards the practical forecast, which however will introduce additional uncertainty that may weaken the potential predictability. It is thus important to understand how data assimilation affects the predictability limit of the ENSO complexity and whether coupled atmosphere-ocean data assimilation is helpful in extending the predictability.
Acknowledgments
The research of X.F. is supported by Guangdong Major Project of Basic and Applied Basic Research (Grant No. 2020B0301030004), the Ministry of Science and Technology of the People’s Republic of China (Grant No. 2020YFA0608802) and the National Natural Science Foundation of China (Grant No: 42192564). The research of N.C. is partially funded by the Office of VCRGE at UW-Madison and ONR N00014-21-1-2904.
Datastatement
The monthly ocean temperature and current data were downloaded from GODAS (https://www.esrl.noaa.gov/psd/data/gridded/data.godas.html). The daily zonal wind data at 850 hPa were downloaded from the NCEP–NCAR reanalysis (https://psl.noaa.gov/data/gridded/data.ncep.reanalysis.html).
References
- Forecasting pacific ssts: linear inverse model predictions of the PDO. Journal of Climate 21 (2), pp. 385–402. Cited by: §1.
- El Niño Modoki and its possible teleconnection. Journal of Geophysical Research: Oceans 112 (C11). Cited by: §1.
- Skill of real-time seasonal ENSO model predictions during 2002–11: Is our capability increasing?. Bulletin of the American Meteorological Society 93 (5), pp. 631–651. Cited by: §1.
- Interannual variability in a tropical atmosphere–ocean model: influence of the basic state, ocean geometry and nonlinearity. Journal of the Atmospheric Sciences 46 (12), pp. 1687–1712. Cited by: §1.
- Evaluation of the global ocean data assimilation system at NCEP: The Pacific Ocean. In Proc. Eighth Symp. on Integrated Observing and Assimilation Systems for Atmosphere, Oceans, and Land Surface, Cited by: §3.1.
- Stochastic parameterization: toward a new view of weather and climate models. Bulletin of the American Meteorological Society 98 (3), pp. 565–588. Cited by: §2.
- On the influence of ENSO complexity on Pan-Pacific coastal wave extremes. Proceedings of the National Academy of Sciences 118 (47). Cited by: §1.
- Non-Gaussian test models for prediction and state estimation with model errors. Chinese Annals of Mathematics, Series B 34 (1), pp. 29–64. Cited by: §1.
- Two limits of initial-value decadal predictability in a CGCM. Journal of Climate 23 (23), pp. 6292–6311. Cited by: §2.
- The forecast skill horizon. Quarterly Journal of the Royal Meteorological Society 141 (693), pp. 3366–3382. Cited by: §2.
- Understanding ENSO diversity. Bulletin of the American Meteorological Society 96 (6), pp. 921–938. Cited by: §1.
- Strong influence of westerly wind bursts on El Niño diversity. Nature Geoscience 8 (5), pp. 339–345. Cited by: §3.3, §5.1.
- A multiscale model for El Niño complexity. npj Climate and Atmospheric Science. Note: Accepted Cited by: §1, §3.3, §3.3, §3.4.
- Predicting the cloud patterns of the Madden-Julian Oscillation through a low-order nonlinear stochastic model. Geophysical Research Letters 41 (15), pp. 5612–5619. Cited by: §2.
- Information barriers for noisy Lagrangian tracers in filtering random incompressible flows. Nonlinearity 27 (9), pp. 2133. Cited by: §2.
- Model error in filtering random compressible flows utilizing noisy Lagrangian tracers. Monthly Weather Review 144 (11), pp. 4037–4061. Cited by: §1.
- Conditional gaussian systems for multiscale nonlinear stochastic systems: prediction, state estimation and uncertainty quantification. Entropy 20 (7), pp. 509. Cited by: §2.
- Stochastic parameterization and El Niño–Southern Oscillation. Journal of Climate 30 (1), pp. 17–38. Cited by: §2.
- Elements of information theory. John Wiley & Sons. Cited by: §1.
- Predictability: recent insights from information theory. Reviews of Geophysics 45 (4). Cited by: §1, §2.
- Predictability and information theory. Part I: measures of predictability. Journal of the Atmospheric Sciences 61 (20), pp. 2425–2440. Cited by: §1.
- Predictability and information theory. Part II: imperfect forecasts. Journal of the Atmospheric Sciences 62 (9), pp. 3368–3381. Cited by: §2.
- Improvement of ENSO prediction using a linear regression model with a southern Indian Ocean sea surface temperature predictor. Geophysical Research Letters 32 (18). Cited by: §1.
- A three-region conceptual model for central Pacific El Niño including zonal advective feedback. Journal of Climate 31 (13), pp. 4965–4979. Cited by: §3.3.
- Effect of the air–sea coupled system change on the ENSO evolution from boreal spring. Climate Dynamics, pp. 1–12. Cited by: §3.3, §4.2.
- A brief review of ENSO theories and prediction. Science China Earth Sciences 63 (4), pp. 476–491. Cited by: §3.3.
- Simulating eastern-and central-pacific type ENSO using a simple coupled model. Advances in Atmospheric Sciences 35 (6), pp. 671–681. Cited by: §1.
- Stochastic methods. Vol. 4, Springer Berlin. Cited by: §2, §4.1.
- Information theory, model error, and predictive skill of stochastic models for complex nonlinear systems. Physica D: Nonlinear Phenomena 241 (20), pp. 1735–1752. Cited by: §2.
- Quantifying the predictive skill in long-range forecasting. Part II: model error in coarse-grained markov models with application to ocean-circulation regimes. Journal of Climate 25 (6), pp. 1814–1826. Cited by: §1, §2.
- The role of additive and multiplicative noise in filtering complex dynamical systems. Proceedings of the Royal Society A: Mathematical, Physical and Engineering Sciences 469 (2155), pp. 20130096. Cited by: §2.
- Westerly wind events in the tropical pacific, 1986–95. Journal of Climate 10 (12), pp. 3131–3156. Cited by: §5.1, §6.2.
- ENSO complexity induced by state dependence of westerly wind events. Journal of Climate 30 (9), pp. 3401–3420. Cited by: §1.
- Exceptionally strong easterly wind burst stalling El Niño of 2014. Proceedings of the National Academy of Sciences 113 (8), pp. 2005–2010. Cited by: §5.1, §6.2.
- Current status of ENSO prediction skill in coupled ocean–atmosphere models. Climate Dynamics 31 (6), pp. 647–664. Cited by: §1.
- An equatorial ocean recharge paradigm for ENSO. Part I: Conceptual model. Journal of the Atmospheric Sciences 54 (7), pp. 811–829. Cited by: §1, §1, §3.3.
- The NCEP/NCAR 40-year reanalysis project. Bulletin of the American Meteorological Society 77 (3), pp. 437–472. Cited by: §3.1.
- Walker circulation response to extratropical radiative forcing. Science Advances 6 (47), pp. eabd3021. Cited by: §3.1.
- Contrasting eastern-Pacific and central-Pacific types of ENSO. Journal of Climate 22 (3), pp. 615–632. Cited by: §1.
- Measuring dynamical prediction utility using relative entropy. Journal of the Atmospheric Sciences 59 (13), pp. 2057–2072. Cited by: §1, §2.
- Information theory and dynamical system predictability. Entropy 13 (3), pp. 612–649. Cited by: §1, §2, §2.
- Remote sea surface temperature variations during ENSO: evidence for a tropical atmospheric bridge. Journal of Climate 12 (4), pp. 917–932. Cited by: §1.
- Two types of El Niño events: cold tongue El Niño and warm pool El Niño. Journal of Climate 22 (6), pp. 1499–1515. Cited by: §3.2.
- On information and sufficiency. The Annals of Mathematical Statistics 22 (1), pp. 79–86. Cited by: §2.
- Statistics and information theory. J Wiley Sons, New York. Cited by: §2.
- Letter to the editor: the kullback-leibler distance. AMERICAN STATISTICIAN. Cited by: §2.
- Balanced ocean-data assimilation near the equator. Journal of Physical Oceanography 32, pp. 25092519Caniaux. Cited by: §1.
- Predictability of the Indian Ocean Dipole in the coupled models. Climate Dynamics 48 (5), pp. 2005–2024. Cited by: §2.
- Information theory and stochastics for multiscale nonlinear systems. Vol. 25, American Mathematical Soc.. Cited by: §1, §2.
- Model error, information barriers, state estimation and prediction in complex multiscale systems. Entropy 20 (9), pp. 644. Cited by: §2.
- Strategies for reduced-order models for predicting the statistical responses and uncertainty quantification in complex turbulent dynamical systems. SIAM Review 60 (3), pp. 491–549. Cited by: §2.
- A mathematical framework for quantifying predictability through relative entropy. Methods and Applications of Analysis 9 (3), pp. 425–444. Cited by: §2.
- ENSO as an integrating concept in earth science. Science 314 (5806), pp. 1740–1745. Cited by: §1.
- Modes of interannual tropical ocean–atmosphere interaction—a unified view. Part II: analytical results in the weak-coupling limit. Journal of Atmospheric Sciences 50 (21), pp. 3504–3522. Cited by: §1.
- Stochastic parametrization and model uncertainty. ECMWF Technical Memorandum 598. Cited by: §3.3.
- El Niño Southern Oscillation phenomena. Nature 302 (5906), pp. 295–301. Cited by: §1.
- Mechanism of the zonal displacements of the pacific warm pool: implications for ENSO. Science 274 (5292), pp. 1486–1489. Cited by: §1.
- A stochastic parameterization for deep convection based on equilibrium statistics. Journal of the Atmospheric Sciences 65 (1), pp. 87–105. Cited by: §2.
- Western pacific oceanic heat content: A better predictor of La Niña than of El Niño. Geophysical Research Letters 45 (18), pp. 9824–9833. Cited by: §4.2.
- Modulation of equatorial Pacific westerly/easterly wind events by the Madden–Julian oscillation and convectively-coupled Rossby waves. Climate Dynamics 46 (7-8), pp. 2155–2178. Cited by: §5.1, §6.2.
- Statistical predictability of niño indices for two types of ENSO. Climate Dynamics 52 (9), pp. 5361–5382. Cited by: §4.1.
- Global and regional scale precipitation patterns associated with the El Niño/Southern Oscillation. Monthly Weather Review 115 (8), pp. 1606–1626. Cited by: §1.
- Statistically accurate low-order models for uncertainty quantification in turbulent dynamical systems. Proceedings of the National Academy of Sciences 110 (34), pp. 13705–13710. Cited by: §2.
- Vacillations in a coupled ocean–atmosphere model. Journal of Atmospheric Sciences 45 (3), pp. 549–566. Cited by: §1.
- ENSO seasonal synchronization theory. Journal of Climate 27 (14), pp. 5285–5310. Cited by: §3.3.
- Reliability of ENSO dynamical predictions. Journal of the Atmospheric Sciences 62 (6), pp. 1770–1791. Cited by: §1, §4.1, §4.1.
- A predictability measure applied to seasonal predictions of the Arctic Oscillation. Journal of Climate 20 (18), pp. 4733–4750. Cited by: §2.
- Initial-value predictability of prominent modes of North Pacific subsurface temperature in a CGCM. Climate Dynamics 36 (9-10), pp. 1813–1834. Cited by: §2.
- Simple stochastic model for El Niño with westerly wind bursts. Proceedings of the National Academy of Sciences 113 (37), pp. 10245–10250. Cited by: §1.
- Statistical occurrence and mechanisms of the 2014–2016 delayed super El Niño captured by a simple dynamical model. Climate Dynamics 52 (3-4), pp. 2351–2366. Cited by: §5.1.
- El Niño-Southern Oscillation complexity. Nature 559 (7715), pp. 535–545. Cited by: §1, §3.3.
- Quantifying the dependence of westerly wind bursts on the large-scale tropical Pacific SST. Journal of Climate 20 (12), pp. 2760–2768. Cited by: §5.1, §6.2.
- Mechanisms of seasonal–ENSO interaction. Journal of the Atmospheric Sciences 54 (1), pp. 61–71. Cited by: §3.3.
- Historical change of El Niño properties sheds light on future changes of extreme El Niño. Proceedings of the National Academy of Sciences 116 (45), pp. 22512–22517. Cited by: §3.2.
- Understanding ENSO physics—A review. Earth’s Climate: The Ocean–Atmosphere Interaction, Geophys. Monogr 147, pp. 21–48. Cited by: §1.
- Improving prediction of two ENSO types using a multi-model ensemble based on stepwise pattern projection model. Climate Dynamics 54 (7), pp. 3229–3243. Cited by: §4.1.
- The unusual 2014–2016 El Niño events: dynamics, prediction and enlightenments. Science China Earth Sciences 63 (5), pp. 626–633. Cited by: §5.1.
- ENSO diversity in a tropical stochastic skeleton model for the MJO, El Niño, and dynamic Walker circulation. Journal of Climate, pp. 1–56. Cited by: §3.3.
- Decadal changes of ENSO persistence barrier in SST and ocean heat content indices: 1958–2001. Journal of Geophysical Research: Atmospheres 112 (D13). Cited by: §1.
- A model El Niño–Southern Oscillation. Monthly Weather Review 115 (10), pp. 2262–2278. Cited by: §1.
- A new intermediate coupled model for El Niño simulation and prediction. Geophysical Research Letters 30 (19). Cited by: §1.
| m | C | ||
| m/s | months | ||
| m/s | |||
| in | |||
| 0.15(2-0.2I) | |||
| mean of | |||