The 700 ks Chandra Spiderweb Field I: Evidence for widespread nuclear activity in the protocluster
Abstract
Aims. We present an analysis of the 700 ks Chandra ACIS-S observation of the field around the radio galaxy J1140-2629 (the Spiderweb Galaxy) at , focusing on the nuclear activity in the associated large-scale environment.
Methods. We identified unresolved X-ray sources in the field down to flux limits of and erg/s/cm2 in the soft (0.5-2.0 keV) and hard (2-10 keV) band, respectively. We searched for counterparts in the optical, near-infrared (NIR), and submillimeter catalogs available in the literature to identify X-ray sources belonging to the protocluster and derived their X-ray properties.
Results. We detect 107 X-ray unresolved sources within 5 arcmin (corresponding to 2.5 Mpc) of J1140-2629, among which 13 have optical counterparts with spectroscopic redshift , and 1 source has a photometric redshift consistent with this range. The X-ray-emitting protocluster members are distributed approximately over a Mpc2 rectangular region. An X-ray spectral analysis for all the sources within the protocluster shows that their intrinsic spectral slope is consistent with an average . Excluding the Spiderweb Galaxy, the best-fit intrinsic absorption for five protocluster X-ray members is cm-2, while another six have upper limits of the order of a few times 1022 cm-2. Two sources can only be fitted with very flat , and are therefore considered Compton-thick candidates. The 0.5-10 keV rest-frame luminosities of the 11 Compton-thin protocluster members corrected for intrinsic absorption are greater than erg/s. These values are typical for the bright end of a Seyfert-like distribution and significantly greater than X-ray luminosities expected from star formation activity. The X-ray luminosity function of the AGN in the volume associated to the Spiderweb protocluster in the range erg/s is at least ten times higher than that in the field at the same redshift and significantly flatter, implying an increasing excess at the bright end. The X-ray AGN fraction is measured to be % of the spectroscopically confirmed members in the stellar mass range . This value corresponds to an enhancement factor of for the nuclear activity with erg/s with respect to the COSMOS field at comparable redshifts and stellar mass range.
Conclusions. We conclude that the galaxy population in the Spiderweb protocluster is characterized by enhanced X-ray nuclear activity triggered by environmental effects on megaparsec scales.
Key Words.
galaxies: clusters: general – galaxies: active – X-rays: galaxies: clusters1 Introduction
Protoclusters are defined as overdense regions in the high- Universe and are expected to evolve into massive, virialized clusters of galaxies at the present epoch (see Overzier 2016, for a review). Finding and characterizing protoclusters is key to studying the large-scale structure of the Universe and the transformational processes that affect star formation and nuclear activity in the member galaxies, such as powerful mergers, gas cooling, and feedback effects. In practice, although a protocluster is observationally identified as a high-z structure that is overdense compared to its surroundings, the dynamical state of the structure, and therefore whether it will evolve into a low-z cluster, is usually highly uncertain (Muldrew et al. 2015, see, e.g.,). At present, there are no standard methods to systematically search for bona fide protoclusters, and this is why biased-tracer techniques are often used to identify interesting targets. One of these consists in searching around high-redshift, powerful radio galaxies, which are often found to be a beacon for overdense regions (Miley et al. 2006, see). Independently of the selection method, in order to confirm their nature and to trace the activity of several processes occurring during their rapid evolution, protocluster candidates must be followed up intensively with multiwavelength campaigns.
In this respect, X-ray observations play a key role, particularly for studying: (1) unresolved emission from active galactic nuclei (AGN) indicative of accretion onto nuclear supermassive black holes (SMBHs); (2) the less intense emission from strongly star forming galaxies; and (3) diffuse emission from hot gas and/or relativistic plasma. Unfortunately, protoclusters are usually very faint in the X-rays and therefore only deep, high-resolution observations can provide useful information in this band. Until now only a few deep ( ks) observations of protoclusters have been made with Chandra or XMM-Newton. In a few cases a faint, extended emission has been interpreted as the signature of a low-mass virialized halo (Gobat et al. 2011; Valentino et al. 2016; Wang et al. 2016). In some other studies, the thermal or relativistic nature of the diffuse emission is still unclear (Gilli et al. 2019; Champagne et al. 2021). In addition to the fact that X-ray data on protoclusters are so few, another clear requirement to search for and characterize the diffuse emission in high-z protoclusters and at the same time the unresolved emission from AGN members is data of sufficiently high sensitivity and angular resolution ( arcsec).
Regarding the X-ray nuclear activity, there is increasing evidence that this is enhanced in overdense, protocluster regions. Lehmer et al. 2009 and Digby-North et al. 2010 found, respectively, 12 and 4 X-ray sources with erg s-1 probably associated to the protoclusters identified in the SSA22 and HS1700+64 fields. These numbers exceed the X-ray source counts in deep fields at the same redshifts by a factor of 10-20, although the uncertainties are large (Krishnan et al. 2017, see also). The enhancement of X-ray AGN in high-z protoclusters is particularly impressive when compared with the overdensity of X-ray sources in evolved clusters at , which is only a factor of (Martini et al. 2006; Branchesi et al. 2007; Kocevski et al. 2009; Ehlert et al. 2015). However, we note that the physical quantity that should be measured is not the X-ray source density, but the AGN fraction among protocluster members, and therefore the ratio of this fraction to the same quantity measured in the field, defined as the enhancement factor . To be meaningful, this quantity should be evaluated in a well-defined stellar mass range, and possibly differentiated between star-forming and passive galaxies, in order to compare the full distribution of AGN accretion rates in the protocluster members to those in field galaxies at comparable redshift. A robust characterization of in protoclusters that accounts for the dependence on redshift and on the mass scale is still not available. Furthermore, the lack of quantitative estimates on the luminosity function of AGN in protoclusters and on their obscuration implies large uncertainties on an important, related quantity, namely the energy budget released in the surrounding medium by the nuclear activity.
Finally, another relevant missing piece of information in protoclusters is the measurement of the hot component in the surrounding diffuse baryons (the forming intracluster medium, ICM), which can be used to constrain the virialization status of the halo. Characterization of the proto-ICM, including its morphology and its thermodynamical and chemical properties, can provide an independent and direct measure of the heating efficiency associated to the feedback and, at the same time, of the gas accretion into the protocluster potential well. In addition, feedback processes not only affect the ICM, but can also couple directly with the member galaxies. An interesting example was recently found in the field of the high-redshift quasar SDSSJ1030 (observed by Chandra with a 500 ks exposure), where a protocluster at centered on a bright FRII radio galaxy shows star-forming member galaxies apparently triggered by the AGN radio jet (Gilli et al. 2019). If confirmed, this phenomenon may shed new light on the strong interplay between the member galaxies and the surrounding medium in the first stages of formation of large structures.
As of today, the available data are providing tantalizing evidence for the complex and intricate phenomena that occur in such high-density, rapidly evolving regions at cosmic noon. A comprehensive physical picture of the accretion, aggregation, and phase transformation of baryons in protoclusters will require large sample statistics (still limited by the number of currently known protoclusters) and a multiwavelength approach, including high-resolution X-ray observations. Here we address these issues using deep Chandra ACIS-S observations ( ks) of the remarkable Spiderweb Galaxy (J1140-2629) complex at (van Ojik 1995, redshift obtained from low-resolution spectroscopy by ). The central, powerful radio galaxy, which is embedded in a giant Ly halo (Pentericci et al. 1997; Miley et al. 2006), is surrounded by a Mpc-sized overdensity (corresponding to a radius of 4 arcmin) of star forming galaxies (Ly and H emitters), dusty starbursts, and red galaxies likely in the process of shaping a nascent red sequence (Zirm et al. 2008). The complex around the Spiderweb Galaxy is considered to be a typical protocluster region and is expected to evolve into a massive cluster in less than 1.5 Gyr, with the radio galaxy itself showing characteristics of a cD progenitor (Miley et al. 2006).
In the present paper, we focus on the nuclear activity in the protocluster members, while the physics associated to the diffuse emission surrounding the Spiderweb Galaxy is investigated in a companion paper based on X-ray and SZ data (Tozzi et al. in preparation; DiMascolo et al. in preparation). This paper is organized as follows. In Section 2 we summarize the properties of the Spiderweb Galaxy complex on the basis of previous observations. In Section 3 we briefly describe the multiwavelength data set used in this work. In Section 4 we outline the X-ray data acquisition and reduction techniques. Section 5 deals with the identification all the X-ray sources in the field and their number counts. In Section 6 we list the galaxies associated to the large-scale structure (protocluster members) and characterize their nuclear activity in terms of X-ray luminosity and spectral properties. In Sections 7 and 8, we present the X-ray luminosity function and the AGN fraction of the protocluster members, respectively. In Section 9, we discuss the enhancement factor implied by our new measurements and discuss our results in comparison to previous X-ray studies of protoclusters. Possible extensions of this work in promising directions are briefly discussed in Section 10. Finally, our conclusions are summarized in Section 11. For the sake of clarity, we refer to the radio galaxy and its immediate surroundings as the Spiderweb Galaxy, or J1140-2629, while ”Spiderweb Complex” indicates the large-scale structure potentially associated to the radio galaxy in a broad redshift range (). The term ”protocluster” is instead used to include only the galaxies in the narrower redshift range (Jin et al. 2021, see also), assuming that all the protocluster members will end up in a massive (few times 10) cluster today. Throughout this paper, we adopt the seven-year WMAP cosmology with , , and km s-1 Mpc-1 (Komatsu et al. 2011). In this cosmology, at , 1 arcsec corresponds to 8.473 kpc, the Universe is 3.13 Gyr old, and the lookback time is 77% of the age of the Universe. Quoted error bars correspond to a 1 confidence level unless noted otherwise.
2 The Spiderweb Complex: previous observational campaigns and main results
Since its discovery in 1994, the Spiderweb Galaxy (J1140-2629) and the Spiderweb Complex have become an intensively studied region. In the last 25 years, 54 papers have been published about this field including observations in radio, sub-millimeter (submm), infrared (IR), optical, and X-ray wavelengths. In this section, we summarize the main results that have been obtained so far, focusing on the protocluster environment.
2.1 Discovery and peculiarities
The Spiderweb Galaxy was discovered during the implementation of an ESO Key Program designed to find high-z radio galaxies (HzRG) by targeting ultra-steep spectrum radio sources (Roettgering et al. 1994). The object was noticed as peculiar because of its unusually clumpy and bent radio morphology coupled with an exceptionally high rotation measure ( rad/m), indicating that the radio synchrotron jet is surrounded and its propagation constrained by a dense (cm-3) external medium (Carilli et al. 1997; Pentericci et al. 1997; Athreya et al. 1998). Optical follow-up classified it as a narrow emission-line galaxy at (Roettgering et al. 1997, see), and revealed a clumpy optical continuum morphology and a spectacular Ly halo (still one of the largest known in the Universe) with a luminosity of erg/s elongated along the jet. The total stellar mass inferred from the K-band luminosity is (Pentericci et al. 1997), confirmed by Spitzer data (Seymour et al. 2007), making the Spiderweb one of the most massive high-z galaxies known. Using the Hubble Space Telescope (HST) Advanced Camera for Surveys (ACS) observations, the clumpy features, embedded in the 200 kpc Ly halo, whose distribution resembles that of flies trapped in a spiderweb, have been shown to correspond to approximately ten star-forming satellite galaxies moving with peculiar velocities of several hundred km/s and presumed to be merging with the central radio galaxy (Miley et al. 2006).
Eventually, Nesvadba et al. 2011 found that the optical and near-infrared (NIR) spectrum of the nucleus of J1140-2629 shows a broad, spatially unresolved H line (blended with [NII]) with a FWHM of km/s. The presence of broad nuclear lines is rare in optical counterparts of high-redshift radio sources typically classified as TypeII AGN. The black hole mass is estimated to be , putting J1140-2629 a factor of above the local relation, in agreement with its expected evolution. Taken together, the observed characteristics suggest that the Spiderweb is indeed a massive radio galaxy forming at the center of a dynamically evolving protocluster region and is likely to evolve into a brightest cluster galaxy. The Spiderweb is therefore one of the most revealing laboratories for studying the evolution of a protocluster in the early Universe, and may represent a typical phase in the formation of massive galaxy clusters with prominent central galaxies.
2.2 Identification of protocluster members and their properties
The search for protocluster members of the Spiderweb Complex was based on a series of works with spectroscopic follow-up and narrow band imaging in the field. A first sample of 50 candidate Ly emitters in a arcmin2 field (Kurk et al. 2000) provided support to the existence of several star forming galaxies in the protocluster. Of these candidates, 15 were eventually confirmed to have redshift in the range with VLT-FORS spectroscopy by Pentericci et al. 2000. One of these confirmed sources shows clear signs of AGN activity with very broad Ly and CIV emission lines, while all the others simply show narrow Ly emission. More extensive VLT imaging in NB0.38, B, R, and I bands with FORS2 and in the , H, , and NB2.07 bands with ISAAC identified 40 H candidate emitters and 44 extremely red objects (EROs) consistent with , whose density increases towards the central galaxy suggesting a physical association (Kurk et al. 2004b). Estimated star formation rates (SFRs) without dust correction are in the range 2-50 /yr and 0.4-4.3 /yr for the H- and Ly-emitter candidates, respectively. The SFR per unit mass, estimated from K-band magnitudes, are times higher than in local massive clusters.
In a spectroscopic follow-up in the IR band with ISAAC on the VLT, an additional nine H emitter candidates within 0.6 Mpc from J1140-2629 were confirmed as protocluster members (Kurk et al. 2004a). The narrowness of the emission lines of eight of the nine confirmed sources indicates that they are powered by star formation dominated by a very young ( Myr) stellar population with moderately high metallicity. Only in one of the emitters does the H appear extremely broad with a FWHM exceeding 5000 km/s. The contribution of these nine candidates to the SFR density in the protocluster shows it to be at least an order of magnitude larger than that found at in the HDF-N.
Near-infrared spectroscopy of narrow-band-selected H emitters with MOIRCS on Subaru presented by Shimakawa et al. 2014; Shimakawa et al. 2018 significantly increased the number of spectroscopically confirmed protocluster members. An additional 4 protocluster members were identified among 13 H emitter candidates using ALMA CO(3–2) ( GHz) observations (Tadaki et al. 2019), all of them also detected in CO(4–3) by Emonts et al. 2018. Recently, Jin et al. 2021 obtained 46 CO(1-0) detections in the range , using 13 individual pointings with ATCA.
Photometric studies also helped to characterize the protocluster population. Infrared Surveys indicated an overdensity of 3-4 with respect to the field at m (Mayo et al. 2012), with Spitzer IRAC colors (Galametz et al. 2012), and with Herschel SPIRE (Valtchanov et al. 2013; Rigby et al. 2014). The distribution of IR protocluster galaxy candidates confirms the approximate filamentary shape of the protocluster, previously obtained using optical narrowband selection. In the submm band, an overdensity of a factor of four is observed with APEX LABOCA at 870 m (Dannerbauer et al. 2014). The submm flux distribution at the protocluster redshift would imply an SFR that is higher by about an order of magnitude with respect to the H-derived values. The sample of narrow-band-selected candidates was extended to 68 H emitters with the MAHALO Deep Cluster Survey (Shimakawa et al. 2018) with the Subaru Telescope, 17 of which are newly discovered. In addition, selection identified 34 distant red galaxies, half of which have photo-z consistent with being protocluster members.
Overall, the galaxy population of the Spiderweb Complex appears to be a mix of active and star forming galaxies, and already massive, passive galaxies that constitute a nascent red sequence (Kodama et al. 2007; Zirm et al. 2008; Zirm et al. 2012), and that approximately follow an elongated structure extending Mpc in diameter. Tanaka et al. 2013 found that the weak red sequence is consistent with a formation redshift in the range . In addition, Koyama et al. 2013 found that the properties of the H emitters are consistent with them having formed a large part of their stellar mass at , but observed in a still intense star-forming phase. The presence of both star forming and red galaxies may be related to a typical phase associated to environmental effects driven by the protocluster collapse that accelerates their formation and evolution.
Finally, we note that four out of six (%) massive emitters (HAEs) () were previously identified as bright X-ray sources (Pentericci et al. 2002; Croft et al. 2005, see). Also, Croft et al. 2005 confirmed two X-ray sources as protocluster members using LRIS Keck spectroscopy, and classified both as AGN due to the presence of NV, CIV, and [CIII] in the spectrum, bringing the total number of X-ray-emitting members to five. This finding suggests that protocluster members that host X-ray AGNs may be in the transition stage from dusty star-forming galaxies to passive populations.
2.3 Role of the new X-ray observations
The nature of the galaxy population of the Spiderweb Protocluster will be further investigated in this work thanks to the addition of our deep X-ray data. Our study relies on a collection of 252 unique sources in the field that have spectroscopic or narrow-band/photometric redshift in the range (see Section 3). A detailed list of all the spectroscopic members and color- or narrow-band-selected candidates, and the identification of the Spiderweb Complex candidates, is shown in Section 3.
Using our deep Chandra observation, we explore the following aspects: (i) the frequency of X-ray nuclear activity among the protocluster members; (ii) the enhancement of nuclear activity in the protocluster; (iii) the distribution of phases in the diffuse baryons in the halo of the Spiderweb Galaxy, and the relation with its strong nuclear activity; and (iv) the presence of diffuse thermal emission possibly associated to the virialization of a central halo. In this paper, we focus on the AGN population. The presence of hot, diffuse baryons around the Spiderweb Galaxy and their relation to its nuclear activity is discussed in two papers based on X-rays and the SZ signal (Tozzi et al. in preparation; Di Mascolo et al. in preparation). The main results and the data products of the present paper can be found on the project webpage11 1 http://www.arcetri.inaf.it/spiderweb/.
3 Multiwavelength data used in this work
In this work, we exploited part of the large set of multiwavelength data publicly available for the Spiderweb Complex field. We used the HST images for the central regions and the Subaru images —which cover the entire Chandra field of view (FOV)— to identify the optical counterparts of the X-ray sources. In particular, we used a 23 ks exposure in the F814W band with ACS (HST Proposal 10327, PI H. Ford), and B, , exposures obtained with the Suprime camera at the Subaru telescope and covering a arcmin2 field. We also used VLT-VIMOS imaging data in the U band, and VLT-HAWKI images in Y, H, and K bands. The Suprime B, , and raw data were retrieved from the SMOKA archive (Baba et al. 2002). The images were reduced with a custom pipeline because of the four-ports-readout layout of the camera chips. Images have been overscan, master bias, and master flats corrected. We then used an improved version of own pipeline as described in (Nonino et al. 2009), which currently uses Scamp (Bertin 2006) with GAIA-EDR3 as astrometric reference, and Swarp (Bertin et al. 2002) for the final coaddition. A similar approach was used for the VLT-VIMOS and VLT-HAWKI images, with the raw data retrieved from the ESO Archive. Removal of the instrumental signatures was performed using IRAF22 2 IRAF was distributed by the National Optical Astronomy Observatory, which was managed by the Association of Universities for Research in Astronomy (AURA) under a cooperative agreement with the National Science Foundation.. For the NIR HAWKI images, the appropriate darks were retrieved from the ESO Archive, stacked and applied to the raw data. For the optical data, the bias and the flats were used to create static weights which account for chips defects. For the NIR data, darks and flats were instead used.
We used optical and NIR photometry to estimate host galaxy masses and rest-frame luminosities of the X-ray AGNs in our sample. Detailed descriptions of the photometric measurements, the multi-wavelength catalog, the photometric redshift, and our stellar mass estimation will be provided elsewhere (Pannella et al., in preparation). In the following, for the sake of completeness we briefly summarize the data and procedures relevant here.
| Filter | Instrument | FWHM | 5 | Science Archive |
|---|---|---|---|---|
| /Telescope | (arcsec) | (AB) | /Project ID(s) | |
| VIMOS/VLT | 0.86 | 26.4 | ESO - 383.A-0891 | |
| S-Cam/Subaru | 1.12 | 25.8 | SMOKA - o17409 | |
| S-Cam/Subaru | 0.73 | 25.2 | SMOKA - o17409 | |
| S-Cam/Subaru | 0.65 | 24.4 | SMOKA - o10144 | |
| HAWK-I/VLT | 0.46 | 24.5 | ESO - 088.A-0754, 091.A-0106 | |
| HAWK-I/VLT | 0.58 | 23.2 | ESO - 088.A-0754, 091.A-0106 | |
| HAWK-I/VLT | 0.40 | 22.8 | ESO - 088.A-0754, 091.A-0106 |
We used Very Large Telescope (VLT) and Subaru stacked images to create a multi-wavelength catalog with seven passbands (U,B,,,Y,H,Ks) from U to K. In Table 1 we summarize the main properties of the dataset used. We used SExtractor in dual image mode to measure photometry. The -band HAWK-I image was adopted as the primary detection image, because it represents the best compromise —among all available bands— between the need for a robust tracer of galaxy stellar mass and sufficient angular resolution (0.4”), which simplifies catalog assembly and photometry measurements. The whole catalog contains 2 279 objects over the image field of approximately 84 arcmin2 and down to an AB magnitude of 22.8 (i.e., the image 5 limiting magnitude). The images used here have very different resolutions. Rather than convolving all images to the lower resolution, which would result in a significant loss of information, we account for this in the estimate of aperture colors by applying PSF-matching corrections based on the growth curve of point-like sources. To limit uncertainties in such corrections we use 2” diameter apertures to sample the galaxy spectral energy distributions (SEDs).
Photometric redshifts are computed using EAZY (Brammer et al. 2008). Global photometric zero points are adjusted iteratively by minimizing the difference between the various photo-z values and the available spectroscopic redshifts (Gabasch et al. 2004; Ilbert et al. 2010; Pannella et al. 2015, e.g.,). By comparison with the available spectroscopic sample, the rms of is 6%. Stellar masses are derived using a modified version44 4 https://github.com/cschreib/fastpp of FAST (Kriek et al. 2009), adopting the Salpeter 1955 IMF, Bruzual & Charlot 2003 stellar population synthesis models, delayed exponentially declining star formation histories (SFHs), the Calzetti et al. 2000 dust extinction law (with AV = 0 to 4), and solar metallicity. In deriving the stellar mass, we use the photo-z obtained using the FAST code, while we use the spectroscopic redshifts when available.
To compile a comprehensive list of spectroscopic redshifts, we use a collection of catalogs of all the spectroscopically confirmed protocluster members, member candidates selected on the basis of color or narrow-band photometry, and random sources with redshift in the field. The 17 catalogs, based on 12 different publications, are listed in Table 2. The catalogs have a significant overlap, because several of them include and extend previous results. The total number of unique sources with any redshift information in the field is 252, out of which 161 have spectroscopic redshifts. We also compile a complementary list of 91 protocluster member candidates that were identified thanks to narrow-band or color selection in previous works. Most (90%) of the sources (both confirmed and candidate members) are included in a box of arcmin2 (corresponding to Mpc at ) roughly centered on the Spiderweb Galaxy and elongated along the E-W direction. Only nine sources with redshift information are outside a circle of 5 arcmin centered on the Spiderweb Galaxy, and none of them are in the range .
The distribution of the 161 available spectroscopic redshifts is shown in Figure 1. Clearly the majority of the redshift values are close to the Spiderweb redshift , because mostly protocluster member candidates have been targeted. We consider a redshift interval roughly symmetric with respect to the Spiderweb redshift, corresponding to a velocity difference of associated to the Hubble flow. This interval spans all the sources possibly associated to the Spiderweb large-scale structure. If we consider the range , corresponding to a maximum km/s, we find 112 sources. We do not expect to see a normal distribution for the redshift, and therefore we adopt the biweight estimator for the central value and the standard deviation, as suggested by Beers et al. 1990 for sample size 55 5 See equations 5, 6 and 9 in Beers et al. 1990. We find and . Therefore, two- and three-sigma intervals centered on are and , respectively. We decided to assume the intervals (approximated as ) as the protocluster redshift range.
In the range , corresponding to a maximum km/s, we find 96 sources. We compute the formal velocity dispersion in this range and find km/s. This value should be compared to that expected for a flat distribution in the same redshift range as expected for sources following the Hubble flow, which is km/s. We conclude that the sources are clearly detached from the Hubble flow, and show a global velocity dispersion that would correspond to a very-high-mass (), virialized single halo. Given the mass scale and the distribution of sources in the sky, the virialized, single-halo hypothesis is clearly unrealistic. In addition, we notice that excluding the new spectroscopic sources identified by Jin et al. 2021 with the CO(1-0) line, the velocity dispersion drops to km/s (that would correspond to a temperature of keV for a virialized halo). As already shown in Jin et al. 2021, this points out that the CO sources show a different dynamical behavior, and are probably distributed along a large-scale filament or a galaxy superprotocluster. In addition, half of the CO emitters have measured velocities larger than the escape velocities of any realistic virialized halo hosting the Spiderweb Galaxy, suggesting that the outer regions traced by the CO sources are still far from being accreted onto the main halo. In this work we do not attempt to further investigate the dynamical structure of the Spiderweb complex. However, the number of spectroscopically confirmed members in the Spiderweb Complex is now the highest for a single structure at and a detailed, spatially resolved dynamical analysis will be a relevant piece of information to constrain the current status and the future evolution of the structure.
In summary, in this paper we consider the 96 sources included in the narrow redshift bin as belonging to the protocluster, while the additional 16 sources included in the range are considered part of the large-scale structure associated to the Spiderweb Complex, and are most likely not dynamically bound. The corresponding redshift intervals are shown in Figure 1 with vertical dashed lines.
| Reference | Selection method | Members |
|---|---|---|
| Spectroscopic | ||
| Pentericci et al. 2000 | Ly emission | 15 |
| Kurk et al. 2004a | H emission | 9 |
| Croft et al. 2005 | Ly emission | 7 [17] |
| Doherty et al. 2010 | H emission | 2 [2] |
| Kuiper et al. 2011 | OII emission | 15 [1] |
| Tanaka et al. 2013 | OII/OIII emission | 4 [10] |
| Dannerbauer et al. 2014 | Specz | 11 [4] |
| Shimakawa et al. 2014 | H emission | 23 |
| Tadaki et al. 2019 | CO emission | 4 |
| Jin et al. 2021 | CO emission | 46 |
| Color or narrow-band selected | ||
| Pentericci et al. 2002 | photo-z | 3 |
| Kurk et al. 2004b | Ly emitter | 40 |
| Kurk et al. 2004b | H emitter | 40 |
| Kurk et al. 2004b | EROs | 44 |
| Dannerbauer et al. 2014 | FIR photo-z | 2 [4] |
| Shimakawa et al. 2018 | H emitter | 68 |
| Tadaki et al. 2019 | H emitter | 9 |
4 X-ray data reduction
| Obsid | date | Exptime (s) |
|---|---|---|
| 898 | 2000-06-06 | 27 378 |
| 21483 | 2019-11-18 | 49 312 |
| 22924 | 2020-02-26 | 33 475 |
| 22923 | 2020-02-28 | 34 598 |
| 23175 | 2020-03-01 | 29 938 |
| 22925 | 2020-03-06 | 39 541 |
| 22926 | 2020-03-07 | 43 375 |
| 22921 | 2020-03-17 | 24 642 |
| 23190 | 2020-03-17 | 24 736 |
| 23069 | 2020-03-23 | 19 648 |
| 23201 | 2020-03-26 | 27 613 |
| 21482 | 2020-04-02 | 34 492 |
| 22927 | 2020-04-02 | 32 534 |
| 23205 | 2020-04-03 | 23 514 |
| 22928 | 2020-04-10 | 29 572 |
| 23215 | 2020-04-13 | 19 803 |
| 21484 | 2020-04-22 | 46 504 |
| 22929 | 2020-04-23 | 51 231 |
| 23186 | 2020-06-13 | 14 770 |
| 22922 | 2020-07-22 | 18 487 |
| 21481 | 2020-08-13 | 40 383 |
| 22905 | 2020-08-04 | 49 291 |
The Spiderweb Galaxy was observed with a Chandra Large Program observation of 700 ks with ACIS-S granted in Cycle 20 (PI P. Tozzi). The observations were completed in the period November 2019 –August 2020, split into 21 separate pointings. To this data set, we add the first X-ray observation with ACIS-S, dating back to June 2000 for a total of 39.5 ks. All the 22 Obsid used in this work are listed in Table 3.
Data reduction is performed starting from the level = 1 event files with CIAO 4.13, with the latest release of the Chandra Calibration Database at the time of writing (CALDB 4.9.4). We run the task destreak to flag and remove spurious events (with moderate to small pulse heights) along single rows, which is particularly important for ACIS-S4. We run the tool acis_detect_afterglow to flag residual charge from cosmic rays in CCD pixels. Finally, as all our new observations are taken in the VFAINT mode we run the task acis_process_events with the parameter apply_cti=yes to flag background events that are most likely associated to cosmic rays and reject them. With this procedure, the ACIS particle background can be significantly reduced compared to the standard grade selection. The data are then filtered to include only the standard event grades 0, 2, 3, 4, and 6. The level 2 event files generated in this way are visually inspected for flickering pixels or hot columns left after the standard reduction but we find none after filtering out bad events. We also carefully inspect the image of the removed photons, particularly to verify whether we have pile-up effects88 8 https://cxc.cfa.harvard.edu/ciao/ahelp/acis_pileup.html. We find that slightly more than 100 net counts in the total band are removed at the position of the nucleus of J1140-2629 across the 22 exposures. This indicates that the source, which is by far the brightest in the field, suffers some amount of pile-up. However, we verify a posteriori that this effect does not impact the spectral analysis of the nucleus and therefore it is not worth giving up the VFAINT cleaning to recover less than 1% of the flux in the nucleus. In particular, the VFAINT cleaning is very important for characterization of the diffuse emission, which is presented in detail in further papers from the collaboration focused on the inverse Compton emission associated to the radio jets (Carilli & Anderson 2022; Anderson & Carilli 2022) and on the thermal component (Tozzi et al. in preparation; see also Di Mascolo et al. in preparation).
Finally, time intervals with high background are filtered by performing a 3 clipping of the background level. The light curves are extracted in the 2.3–7.3 keV band, and binned with a time interval of 200 s. The time intervals when the background exceeds the average value by are removed with the tool deflate. The final total exposure time after data reduction and excluding the dead-time correction amounts to 715 ks (corresponding to the LIVETIME keyword in the header of Chandra fits files), including the first observation. The average removed time interval for the new observations amounts to only % of the observing time, except for Obsid 898, where % of the exposure time has been removed due to high-background time intervals. The monochromatic exposure maps are created at the energies of 1.5 and 4.5 keV for the soft and hard band respectively by running the tools mkinstmap and mkexpmap.
The 22 level 2 event files are merged together with the tool reproject_obs, using the reference coordinates of Obsid 21483. The exposure maps are reprojected onto the reference frame of Obsid 21483 with the tool reproject_image, and are then added together weighting each map by the fractional exposure time of the corresponding Obsid. Images for source detection are created in the 0.5-2 keV, 2-7 keV and total (0.5-7 keV) bands, with no binning to preserve the full angular resolution of arcsec (FWHM) at the aimpoint (1 pixel corresponds to 0.492 arcsec). The images include all the CCDs that were ”on” while observing, namely ACIS-S3 (where the aimpoint is always located), ACIS-S2, ACIS-S4, and ACIS-I3 (except Obsid=898, in which also ACIS-S5 and ACIS-I2 were on). As the aimpoint is approximately the same for the 22 Obsid, and considering the geometry of the CCD positions, the effective exposure is optimal within a radius of few arcmin from the J1140-2629 position, while it is significantly lower in a wide annulus covered by the flanking CCDs. We identify a region with a radius of 5 arcmin centered on J1140-2629, roughly coincident with all the points with an effective area larger than 240 cm2. This radius corresponds to Mpc at . Within this region, the sensitivity falls by a factor of about two from the center to the border. Beyond this radius, the flanking CCDs cover a larger area up to a radius of arcmin, but with a much lower sensitivity and a significantly degraded angular resolution. The two regions drawn on the monochromatic 1.5 keV exposure map of the field are shown in Figure 2. The region at off-axis angle between 5 and 14 arcmin is not studied in this work.

The upper panels of Figure 3 show an image of the central part of the field (a box arcmin by side) in the soft and hard band. The images have been smoothed with a arcsec kernel to emphasize the unresolved sources. The color scales are the same in both bands (max 200 counts in log scale) and therefore the larger background in the 2-7 keV band with respect to the soft 0.5 -2 keV band is noticeable. In the lower panels, close-up images of the Spiderweb Galaxy (a box of arcmin by side, no smoothing applied) are shown in the soft and hard band. The radio contours in the 10 GHz band obtained with JVLA (Carilli & Anderson 2022) are shown in red. Upon visual inspection, we see that the unresolved sources surrounding the Spiderweb Galaxy are distributed approximately along the jet directions, as already noticed for the spatial distribution of the narrow-band selected sources. Finally, we note that the extended emission in the soft band appears not only along the jets but also in the direction perpendicular to the jet axis.
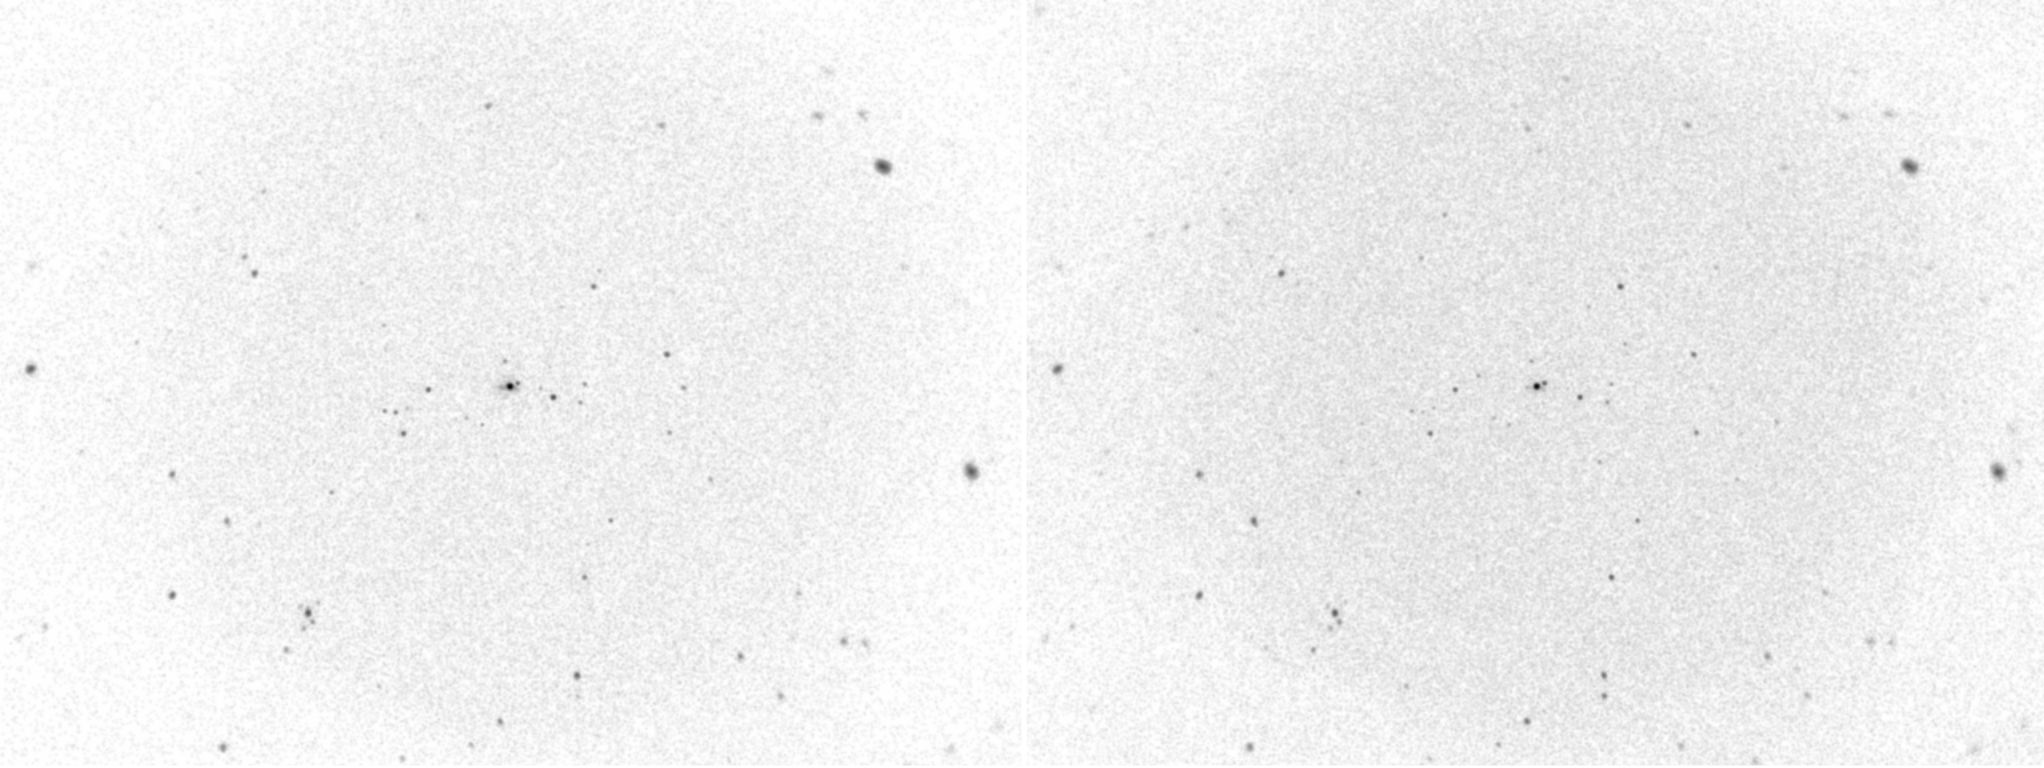

To perform spectral analyses, we extract the spectra and compute the ancillary response file (ARF) and redistribution matrix file (RMF) at the source position for each observation separately with the commands mkarf and mkacisrmf. Our default spectral analysis of unresolved sources uses a local background that, given the small extent of the sources, is directly extracted from a source-free region on the same chip. This applies both to the unresolved sources and the diffuse emission. Below, a more careful treatment is applied to the analysis of the nucleus of the Spiderweb Galaxy, which is embedded in the diffuse emission. For most of the sources in the field, the soft and hard band fluxes are estimated simply by converting the count rate obtained by aperture photometry to energy flux through the conversion factors. We prefer aperture photometry to a more model-dependent photometry, relying on the modelization of the point spread function (PSF), because this last procedure can introduce systematic biasing effects that may be hard to control. On the other hand, the Poissonian noise associated to aperture photometry can be handled with simple statistical methods. The fluxes obtained in this way account for the full uncertainty due to Poisson noise, allowing us to obtain a reliable measurement for the entire source population across three orders of magnitude. The derivation of the conversion factors is detailed in the following subsections.
5 X-ray sources in the Spiderweb Complex
In this paper, we focus on the field of view within a radius of 5 arcmin (corresponding to Mpc at ) centered on the nucleus of the Spiderweb, which results in a total of 78.5 arcmin2. This region includes the solid angle covered by our observation with a sensitivity that is greater than about half of the highest sensitivity reached at the aimpoint, and with an angular resolution that is higher than 3 arcsec (FWHM). This allows us to have a smooth sky coverage, thereby avoiding large corrections when evaluating the number counts.
5.1 X-ray source detection
X-ray source detection was performed with a hybrid procedure combining visual inspection and a standard detection algorithm (wavdetect). The goal is to maximize the completeness of the final source list. In the first step, we considered the entire FOV included in the arcmin radius, and visually identify 238 sources in at least one of the three images (soft, hard, and total band), with approximate position and size.
We then ran wavdetect99 9 https://cxc.cfa.harvard.edu/ciao/threads/wavdetect/, setting the scale parameter to scales = "2 4 8 16 32" and the detection threshold set to sigthresh = 1e-05. This parameter should be approximately equal to the number of pixels in the image, a choice that implies about one background fluctuation detected as a source. As we are searching for sources within 5 arcmin, we have about pixels, setting sigthresh = 1e-05 means approximately 12 strong background fluctuations detected as sources1010 10 https://cxc.cfa.harvard.edu/ciao/ahelp/wavdetect.html#plist.sigthresh. Our choice is therefore optimal for selection of unresolved sources down to low signal and low significance, with an acceptable level of contamination. Considering that our final selection is based on a threshold in the of aperture photometry, our final list of sources show a significantly higher S/N than the lower limit of the wavdetect selection, implying a much lower number of spurious sources with respect to the initial selection. We expect to have a completeness of very close to unity, particularly in the inner 5 arcmin, where the angular resolution is a few arcsecs. However, we note that running wavdetect with pixel scales below and equal to is less efficient for detecting extended sources, or sources at off-axis angle arcmin and larger, where the angular resolution of Chandra rapidly deteriorates. As we focus on the sky region at off-axis angle arcmin, this choice does not affect our results. In addition, visual inspection confirms that there are no relevant extended sources in the field within 5 arcmin. The extended emission surrounding the Spiderweb Galaxy will instead be discussed in a separate publication.
We find 249, 289, and 381 unresolved source candidates in the soft, hard, and total-band images, respectively, selected by wavdetect. We match the wavdetect-detected sources with the visually selected sample assuming a matching radius of 1 arcsec, and collect the wavdetect positions for all the matched sources, with the exception of the source candidates identified only by visual inspection. We then obtain a master catalog with 398 sources. All but 11 of the visually identified sources are recovered by the wavdetect algorithm, and these latter are at more than 5 arcmin from the Spiderweb, and therefore have no impact on this work. We define a circular extraction region for each source to perform aperture photometry. The extraction radius is computed with a simple relation depending only on the off-axis angle . We set arcsec (see Rosati et al. 2002, and references therein). We find that this choice ensures that at least 95% of the expected flux is included in the circular extraction region, both in the soft and hard band1111 11 For details see https://space.mit.edu/cxc/marx/tests/PSF.html. We manually adjusted the position and size of the extraction regions to avoid overlapping of nearby source candidates: in three cases we manually reduced by one pixel ( arcsec) and shifted the centroid by 1 arcsec; in three other cases we simply reduced the by three pixels ( arcsec). We verified a posteriori that, on average, the photometry of the six sources (flagged in Table 7) changes by less than 10%, with a negligible impact on our final results. The background was estimated locally in an annulus around each source (outer radius , inner radius ) after removing nearby unresolved sources. This choice, thanks to the depth of the total exposure, ensures a fair sampling of the background, and takes into account local variation of the background.
We estimated the Poisson probability of being a background fluctuation for each candidate source following the procedure described in Puccetti et al. 2020. First, we computed a radius (with ) within which the is maximum. We then computed
| (1) |
where is the estimated background counts within , and is the total counts within . Puccetti et al. 2009 showed that assuming ensures a very high reliability, and so we can use this threshold to select a sample of sources with a negligible spurious component. On the other hand, computing the completeness as a function of requires extensive simulations to take into account the sensitivity and the PSF effects across the field of view. Therefore, for the completeness we prefer to use a criterion directly relying on the S/N from aperture photometry. This approach has been shown to be reliable in deep Chandra surveys such as the Chandra Deep Field South (CDFS), where we adopted a threshold of to compute the point-source sky coverage (Giacconi et al. 2001; Tozzi et al. 2001, see). In this work we combine these two criteria to best exploit the sensitivity of the Chandra data whilst maintaining the very high purity of the sample.
We split our candidate list according to the distance from the Spiderweb Galaxy, finding 264 candidates at more than 5 arcmin and 134 detection candidates within 5 arcmin. For the remainder of the paper, we consider only the candidate detections in the central FOV. We computed in the soft, hard, and total (0.5-7 keV) bands for each source, and consider any source that satisfies in any of the three bands to be a detection. This step selects 107 source candidates. We then applied our completeness criterion , and find that 9 out of 107 sources do not reach the S/N threshold in any band. However, we find that 5 of them have in the hard band, and after a careful revision by visual inspection, we decided to keep them in the final source list, while discarding the remaining 4 sources.
In addition, we search for robust candidates that may have been missed by our reliability criterion by searching for sources with in all three bands, but selecting only sources with in the soft or hard bands. We find only four such sources and all have a value very close to our threshold (of the order of ). After visual inspection, we decided to include them in the final sample, which, after this final step, includes 107 sources.
Incidentally, the same selection procedure identifies a final list of 176 sources in the outer ring, which has a field of view 6.8 times larger than the central 5 arcmin radius circle. This shows that the detected source density in the outer ring is on average four times lower. Considering that sources at more than 5 arcmin from the aimpoint have significantly larger errors on position and photometry due to the rapid degradation of the PSF, and that the multiwalength data coverage essentially drops at distances arcmin, we strengthen the conclusion that the data quality in the field beyond 5 arcmin does not allow us to further extend the study of the Spiderweb Complex with the current dataset. The analysis of the field at distances larger than 2.5 Mpc from the Spiderweb is potentially interesting, in particular to investigate the possible extension of the Spiderweb Complex at radii larger than 2.5 physical Mpc, but requires additional data and must be postponed to a future work.
5.2 Measurement of source fluxes
The exposure-corrected count rates are estimated by rescaling the measured net count rate by the ratio of the exposure map values at the aimpoint to the emission-weighted exposure within the extraction region. The average monochromatic exposure map values at the aimpoint are cm2 and cm2 in the soft and hard band, respectively. Soft- and hard-band fluxes are computed from the net count rates corrected for vignetting and assuming the typical conversion factors and in the corresponding band. The conversion factors clearly depend on the spectral shape, which itself is well known to depend on average on the source flux (Tozzi et al. 2001, see), and can be approximately described with a power law with a slope in the range . Slopes in the range are typical of unabsorbed AGN, as measured in deep surveys such as the CDFS (see Liu et al. 2017, and references therein). Harder spectra are mostly due to intrinsic absorption, which depends on the intrinsic column density and source redshift. Clearly, this information is not available for the full catalog. We proceed by assuming an average redshift of 1.5 (Luo et al. 2017, representative of AGN in the CDFS; see Figure 23 in), and a typical intrinsic absorption cm-2. We find that the conversion factor obtained with these assumptions, and allowing for at least a factor of three variation in the average redshift and absorption, is well inside the range that we obtain assuming . Therefore, without providing a detailed description of the spectral shape of our unresolved sources, we adopt the full range and consider the corresponding variation in the conversion factors as a systematic uncertainty. This is a fair choice for the estimation of the source flux and a reliable measurement of the number counts. The X-ray sources identified as members of the Spiderweb Complex are further investigated with a detailed spectral analysis (see Section 6.4).
After correcting for a Galactic absorption column density of cm-2, we obtain cgs/ counts/s in the soft band. In the hard band, we derive two conversion factors of cgs/counts/s and cgs/count/s to convert from the 2-7 keV count rate to the 2-7 keV and 2-10 keV fluxes, respectively. We note that we apply a factor 1.05 to account for the average flux loss outside the extraction region, and also note that while the net detected counts in the hard band refer to the 2–7 keV energy range, we compute the energy fluxes in the 2–10 keV band, for a better comparison with the literature, despite our unresolved sources showing very little signal above 7 keV. The list of 107 sources with X-ray position, net count rate in both bands, and soft and hard fluxes is shown in Table 7. A negative count rate may be measured when a source is detected only in one band, in which case we report the 2 upper limit for the energy flux.
| Count rate | Energy | Conversion factor |
|---|---|---|
| band (keV) | band (keV) | cgs/counts/s |
| 0.5 - 2.0 | 0.5 - 2.0 | |
| 2.0 - 7.0 | 2.0 - 7.0 | |
| 2.0 - 7.0 | 2.0 - 10.0 |
5.3 X-ray number counts
To derive the number counts, we first compute the point-source sky coverage as a function of the energy flux. To do that, we first create images of the soft and hard background. These are obtained by removing all the detected sources and replacing the signal in the extraction region with a Poisson realization of the emission measured in the background annulus. Using the same conversion factors, and the monochromatic exposure maps, we then compute the solid angle in which a source of a given soft or hard flux is detected according to our completeness criterion . As shown in Figure 4, the sky coverage rapidly drops to zero at fluxes of erg/s/cm2 and erg/s/cm2 in the soft and hard band, respectively1313 13 Formally, the flux limit is defined as the flux at which the sky coverage drops to 1/10 of the full field of view of 78.5 arcmin2.. The deepest X-ray field to date (and until a new X-ray mission with arcsec resolution), is provided by the CDFS (Giacconi et al. 2001; Rosati et al. 2002; Luo et al. 2017) which has reached the unparalleled depth of 7 Ms. Comparison with the sky coverage of the CDFS shows that the field of view analyzed in this work is five times smaller than the maximum solid angle covered in the CDFS. The flux limit is about 13 and 10 times higher than in the CDFS in the soft and hard band, respectively. We note that the flux limits of the two fields roughly scale as the ratio of the total exposure times (a factor of 10), despite the sensitivity loss due to the contamination build-up over ACIS. This is because we take advantage of the larger effective area of the back-illuminated CCD in ACIS-S with respect to the front-illuminated CCDs in ACIS-I (used for the CDFS), partially compensating the sensitivity loss.
The cumulative number counts (logNlogS) are computed directly as
| (2) |
where and are the flux and the corresponding sky coverage of the source, respectively. To compute the soft and hard number counts, we consider only the sources with in the corresponding band. We select 72 sources in the soft and 96 sources in the hard band, which, combined together, add up to a total of 107 unique sources within the 5 arcmin radius.
The soft band logNlogS is shown in Figure 5. The shaded area shows the formal uncertainty obtained as the sum in quadrature of the statistical error due to the source statistics and the error on the source fluxes. The last error is in turn the sum in quadrature of the Poissonian photometric error and the systematic error associated to the conversion factors. The uncertainty is dominated by the source statistics at large fluxes, and by the photometric errors at low fluxes. The same figure shows the soft band logNlogS measured in the CDFS by Luo et al. 2017, and the predicted logNlogS based on the X-ray background synthesis model developed by Gilli et al. 20071414 14 http://cxb.oas.inaf.it/, see also Hasinger et al. 2005., which includes an exponential decline in the AGN space density at redshifts above to cope with the results from wide-area surveys (Richards et al. 2006; Fan 2006, e.g., SDSS). As the Gilli et al. 2007 model includes only AGN, we add the steep galaxy number counts as measured by Luo et al. 2017 in the CDFS (Marchesi et al. 2020, see also). Normal (star forming) galaxies are relevant only at fluxes well below erg/s/cm2, and therefore have a negligible impact on our results. In particular, the expected contribution of normal galaxies is equal to that of AGN at erg s-1 cm-2 both in the 0.5-2 keV and 2-7 keV bands (Luo et al. 2017, see Figure 31 in). The hard-band logNlogS is shown in Figure 6. In both cases, we find very good agreement with the model expectation, while both model and counts in the Spiderweb Field appear to be % higher than the CDFS in the soft band at fluxes erg/s/cm2. The measured counts in the hard band show a % excess in a small range around fluxes erg/s/cm2 with respect to the model and CDFS. Overall, the logNlogS in the Spiderweb Field appear to be broadly in line with expectations, with the small hint of an excess on a limited flux range. Whether or not this excess is related to the presence of the Spiderweb Complex is investigated in Section 6.
6 Identification of X-ray-emitting protocluster members
On the basis of the shallow Chandra observation (Pentericci et al. 2002, Obsid 898), only five X-ray sources have been identified among the spectroscopically confirmed or narrow-band-selected protocluster members. These sources are firmly identified in the X-ray band as bright AGN in the 2–10 keV luminosity range 0.8-4 erg s-1. No emission has been detected from any of the remaining galaxies in the protocluster down to a rest-frame 2–10 keV luminosity limit of erg s-1. Four out of these five sources are aligned along the radio and X-ray diffuse emission (Croft et al. 2005). However, this is not surprising because confirmed and candidate protocluster members, irrespective of their selection, appear to be aligned in the same direction as the radio jets and the X-ray emission. The relatively high AGN fraction estimated around the Spiderweb Galaxy, despite the low statistics, suggests that the AGN were probably triggered by the ongoing formation of the protocluster. Another possible mechanism may be associated to the radio-mode feedback of the central radio galaxy, in a scenario similar to the observation of the protocluster in the SDSSJ1030 field (Gilli et al. 2019). However, the extension of the jets in the case of the Spiderweb Galaxy is limited to less than 100 kpc from the nucleus, making it a different case with respect to the SDSSJ1030 protocluster, where the jet extension is significantly larger (about 700 kpc between the two lobes). In any case, to demonstrate a trigger effect on the protocluster members, it is necessary to compute the fraction of X-ray-emitting (at the Seyfert level or higher) members over the entire protocluster population. In this section, we proceed to identify all the secure X-ray-emitting protocluster members, with the final goal to estimate the AGN fraction in the Spiderweb system.
6.1 Matching X-ray sources to spectroscopic members
We match the X-ray sources with the optical source list, both with spectroscopic and photometric redshift, or narrow-band-selected sources. Based on the accuracy of the X-ray centroid and of the error on the position of the CO-selected sources, and neglecting the errors on the optical and NIR positions, we assume an initial matching radius of 1 arcsec for optical and NIR sources, and 2 arcsec for CO sources. Based on these values, we can immediately compute the expected number of false matches. Considering the entire FOV (a circle of 5 arcmin radius), and a cross-section of arcsec2, we have a total fractional cross-section of for the 252 unique sources (including spectroscopic redshifts and narrow-band-selected members). If the 107 X-ray sources are randomly distributed in this field of view, the expected number of random matches to protocluster members (confirmed or candidate) is 0.30. Therefore we expect significantly less than one spurious counterpart.
We obtain a list of 14 X-ray-emitting protocluster members (including the Spiderweb), 13 of which matched with members with spectroscopic redshift (including the Spiderweb), and 1 (XID 73) with an ERO from Kurk et al. 2004b. Incidentally, we note than none of the ”flies” are X-ray emitting. This is not surprising, because given the measured mass range and SFR range yr-1 (Hatch et al. 2009), the corresponding cumulative X-ray emission from star formation only is estimated to be more than an order of magnitude lower than our current flux limit. The selected sources were visually checked on the X-ray, HST, and Subaru images to identify potentially spurious counterparts. We find that all the counterparts are unique within 1 arcsec except XID 90, which has a secondary counterpart that has also been selected as an ERO candidate at Kurk et al. 2004b. Therefore, XID 90 may be considered, at worst, to be another X-ray member candidate without spectroscopic confirmation, similarly to XID 73.
The scatter plot of the offsets between all the X-ray counterparts and all the optical matches from the catalogs we used in this work is shown in Figure 7. The closest counterparts for each single source are marked with a white dot inside the red (spectroscopic) or green (photometric) point, showing that all the counterparts are well within 1 arcsec from the X-ray centroid, with most of them within 0.5 arcsec. We inspected the two sources (XID 12 and XID 80) that have an offset of arcsec, and find that their X-ray centroid is not coincident with the X-ray peak, but is slightly displaced because of an apparent extension of the X-ray emission. The signal is too weak to classify these X-ray sources as extended 1515 15 The extension may be associated to radio jets, an occurrence that will be tested when the wide-field, high-resolution radio images are available., but when considering the X-ray peak instead of the X-ray centroid, the offsets drop below arcsec. Therefore, we find that, overall, we can safely assume that the offsets between the X-ray sources and the spectroscopic counterparts can be considered equal to or less than 0.5 arcsec, which brings the expected number of spurious matches below 0.1. We carefully inspected all the counterparts in the HST and Subaru images, finding no alternative optical counterpart candidates except those already mentioned. In the rest of the paper, we consider a sample of 12 X-ray spectroscopically confirmed members (excluding the Spiderweb) and an additional X-ray color-selected member candidate. Considering the 112 and 96 spectroscopically confirmed sources in the range and , this corresponds to a fraction of % and %, respectively. However, this fraction does not take into account the dependence on the stellar mass, which is a key quantity that must be considered when computing the AGN fraction. This aspect is discussed in Section 8.
In Figure 8 we show the X-ray image of the field in the 0.5-7 keV band with the X-ray-emitting protocluster members marked with blue circles, and all the spectroscopically confirmed protocluster members marked with red circles. For better visualization, here we show only a box of arcsec entirely comprised within 5 arcmin from the Spiderweb Galaxy (the FOV we consider), which includes all but two (which are nonX-ray-emitting) of the spectroscopic protocluster members. The filamentary distribution appears to be more evident in the X-ray sources than in the spectroscopically confirmed members, but given the low statistics, the difference is not significant.
In Figure 9 we plot the azimuthally averaged fraction of sources of a given class as a function of the distance from the Spiderweb Galaxy, finding that the protocluster members are clearly more clustered than the bulk of the X-ray sources. This is not surprising because the clustered distribution of the spectroscopic members was already noted in all the works listed in Table 2. On the other hand, when compared to the spectroscopically confirmed protocluster members, the X-ray-emitting members show only a slightly higher concentration, which is not statistically significant. This suggests that, based on current data, there is no evidence of enhanced X-ray activity closer to the Spiderweb Galaxy. We checked whether or not the 15 sources considered to be part of the Spiderweb Complex but not in the protocluster (therefore belonging to the ranges and ) show a different behavior, but we find their distribution similar to that of the protocluster members. We note that our conclusion on the X-ray activity being independent on the distance from the protocluster center relies on the assumption of spectroscopic completeness, an aspect that nevertheless cannot be properly quantified given the composite nature of our spectroscopic sample.
Finally, in Figure 10 we plot the redshift distribution of the X-ray sources identified as protocluster members including the ERO (magenta filled histogram) compared to the redshift distribution of all the sources in the field with spectroscopic redshift in the range . The two distributions are statistically equivalent, showing again that the X-ray-emitting members are drawn uniformly in redshift among the spectroscopically confirmed members.

6.2 A note on the X-ray sources not associated to the protocluster
In addition to the X-ray sources identified as cluster members in the innermost 5 arcmin (13 spectroscopically confirmed, including the Spiderweb Galaxy, plus 1 color-selected member), we find counterparts for 9 sources with redshift , which are therefore in the foreground (6 of them are identified in the spectroscopic survey of X-ray sources in the field by Croft et al. 2005, and 3 are found in NED by chance). In the innermost 5 arcmin, we have 84 X-ray sources that have no redshift information. Clearly, the most important question is whether or not we should expect more X-ray-emitting protocluster members among this set of sources. To give a first-cut estimate, we report here some preliminary results on the photo-z measurements of band-detected sources in the field (Pannella et al. in preparation) obtained with the method described in Section 3. Driven by the comparison of spectroscopic and photometric redshifts in the field, we conservatively consider all the sources with as potentially associated to the protocluster. We have 20 additional X-ray-emitting sources in this sample. If we assume a flat distribution of the true redshift in this range, we expect approximately two additional X-ray sources belonging to the protocluster ().
Also, there are 58 X-ray sources within the central 5 arcmin that are matched with sources with or . As it is very unlikely for these sources to have redshift in the protocluster range, we consider them as foreground and background sources. These leave out 15 X-ray sources without any redshift information. By visual inspection, most of these sources do not have a possible counterpart in the HST and Subaru images, and therefore some of them may be high-z sources. Therefore, a reasonable assumption is to consider that all the 15 sources without any redshift information are outside the range. We also note that the fraction of X-ray sources without optical counterparts () is larger than that found in deep multiwavelength surveys like the CDFS (a few %). This effect is not significant and depends on the depth and solid angle of the available optical and NIR coverage. This aspect will be further investigated in forthcoming papers (Pannella et al. in preparation).
As a final step, we selected all the band detected sources complementary to the spectroscopy- and narrow-band-selected candidates we considered in this work and find 380 sources within 5 arcmin with . Following the previous argument, we may expect an additional approximately 38 protocluster members without X-ray emission. If we focus on sources with , we may expect about 75% of these sources above this threshold (see Section 8), therefore an additional 28 protocluster members. In summary, preliminary results on the SED of galaxies detected in the Spiderweb field show that further spectroscopic follow-up campaigns may increase the number of protocluster members by a 20%–30%. Nevertheless, this simple order-of-magnitude estimate of the X-ray protocluster members that could have been missed is useful to bracket the AGN fraction and AGN enhancement factor in the Spiderweb protocluster, as discussed in Section 8 and Section 9.
6.3 Number counts in the redshift range
To quantify the overdensity of X-ray sources with respect to the field, we computed the X-ray number counts separately in a narrow redshift bin centered on the Spiderweb Galaxy. We decided to adopt the range , and compute the logNlogS inside and outside this redshift range, both in the data and in the model of Gilli et al. 2007.
The left panel of Figure 11 shows the logNlogS in the soft band after excluding the X-ray sources identified in the range compared to the model expectations. We find substantial agreement, with the counts in the Spiderweb field being slightly below the model, in line with the CDFS data. The right panel of Figure 11 shows the soft-band logNlogS only for the redshift interval compared with the expected number counts from the model (black solid line). A much higher normalization is observed, and a different slope, showing that the excess is at relatively bright fluxes. Clearly, the excess above fluxes at soft erg/s/cm2 is merely due to the presence of the Spidwerweb Galaxy. However, at fluxes erg/s/cm2 the excess can be robustly estimated and is found to be more than a factor of , and more than an order of magnitude at erg/s/cm2. We find the same behavior in the hard band, as shown in Figure 12. Also in this case, the excess is more than a factor of at fluxes erg/s/cm2, and up to at erg/s/cm2. Finally, we note that the strikingly different slopes in the range is due to the presence of relatively bright ( erg s-1 cm-2) sources, which are therefore not affected by any means by our completeness correction. Therefore, we are able to confirm an excess in the number of X-ray sources per square degree at the same level estimated from spectroscopy-, narrow-band-, or color-selected sources. The different shape of the number counts with respect to the model may be a sign that the X-ray population in this redshift range is not uniformly extracted from the field population, but there may be some environmental effect at play.
6.4 Properties of X-ray-emitting protocluster members
We then investigated how different the population of X-ray protocluster members is with respect to the bulk of the field X-ray sources in the Spiderweb Galaxy field. As a first check, we plotted the differential distribution of soft and hard-band fluxes; see Figure 13. We note that in the soft and hard bands, the distribution of X-ray fluxes of the protocluster members is slightly shifted towards higher values with respect to the entire X-ray sample.
| ID | EW | ||||
|---|---|---|---|---|---|
| cm-2 | keV | erg/s | erg/s | ||
| 7 | |||||
| 36 | |||||
| 57 | |||||
| 58 | |||||
| 74 | |||||
| 75 | |||||
| 80 | |||||
| 86 | ()∗ | † | † | ||
| 9 | |||||
| 12 | |||||
| 34 | 0 ()∗ | † | † | ||
| 73 | |||||
| 87 | 0 | ||||
| 90 |
We then proceeded with a standard X-ray spectral analysis of the sources. We adopted a simple model consisting in an intrinsically absorbed power law, using the model components zwabs and powerlaw within Xspec. Galactic absorption is described with the model tbabs, and its value was fixed to cm-2 (HI4PI Collaboration et al. 2016). We also added a Gaussian line with intrinsic width below the spectral resolution, at an energy corresponding to the redshift neutral iron Kα line at 6.4 keV rest-frame, which was allowed to vary in energy by 5% around this interval (corresponding to a redshift uncertainty of ). We formally measured the equivalent width in the observed band of this Gaussian component without making an attempt to quantify the confidence level of a line detection given the low signal regime. We leave the two shape parameters and both free to vary when a source has more than 40 counts in at least one observed band (0.5-2 keV or 2-7 keV), while we fix in the other cases. The best-fit values are shown in Table 5. In addition, we performed a simplified spectral analysis for the remaining six sources, where the intrinsic spectral slope is frozen to , and the intrinsic absorption is estimated. In Appendix B, we show the spectra of the 8 sources suitable for spectral analysis, along with the best-fit model, and the spectra of the fainter 6 sources, despite the coarse binning. In this section, we discuss the X-ray properties of the 13 protocluster members, while the Spiderweb Galaxy, apart from a few basic spectral parameters, will be discussed in a companion paper (Tozzi et al. in preparation).
First, we note that we are able to measure the intrinsic slope with good accuracy in eight sources, finding an average . Source XID 86 has un unusual, hard slope (with an hardness ratio ) and a measured equivalent width for the neutral Fe line of keV, close to the value expected for reflection-dominated, Compton-thick sources (Norman et al. 2002; Gilli et al. 2011; Iwasawa et al. 2020, see, e.g.,). We consider it a Compton-thick candidate with cm-2. Therefore, the slope of its spectrum is not representative of the spectral shape of the intrinsic emission. If we exclude this source, we measure an average intrinsic slope of , in line with expectations (Tozzi et al. 2006; Iwasawa et al. 2020, see, e.g.,). Another source with an unusually flat spectrum is XID 34. This source is the faintest among the protocluster X-ray members (17 net counts in the 0.5-7 keV band) and cannot be meaningfully fitted with a frozen . We tentatively considered it another Compton-thick candidate.
For all the remaining sources, we are able to directly measure the intrinsic absorption or an upper limit for it. In Figure 14 we show the distribution of the intrinsic absorption for the 14 protocluster members (including the Spiderweb Galaxy). We also include upper limits (shown with the dashed histogram), while we exclude the two Compton-thick candidates. The five sources (not including the Spiderweb) for which we robustly measure unsurprisingly have cm-2, which is simply a consequence of the high-redshift and the low-signal regime. We also show upper limits for six sources, finding values of of less than a few times 1022 cm-2. The limited statistics and the low signal prevent us from making any general conclusions as to the distribution of among the protocluster members. A visual comparison with the distribution of expected in the model by Gilli et al. 2007 in the redshift bin (black line) normalized to the number of sources in our small sample suggests that the number of strongly absorbed sources (7 sources with cm-2) is broadly consistent with that expected in the field at the same redshift. However, we note that the Compton-thin source with the highest intrinsic absorption that we are able to measure (XID 7, cm-2) is still more than four times less absorbed than the most absorbed sources detected in protoclusters (Gilli et al. 2019; Vito et al. 2020, see).
Having the intrinsic absorption, and an estimate of the intrinsic power law, we can compute the unabsorbed luminosity in the rest frame 0.5-2 and 2-10 keV bands. The unabsorbed luminosities of all sources but the two Compton-thick candidates and the Spiderweb Galaxy are shown in Figure 15. All sources have a rest-frame, hard-band luminosity of greater than erg/s. The luminosity range puts all these sources in the Seyfert regime, far from normal star forming galaxies. In principle, we may expect obscured star formation at a high level, up to 1000 /year. Using the average relation in the redshift range 2.0-2.5 as measured from deep fields by Lehmer et al. 2016, we obtain and erg/s for a SFR of 100 and 1000 /yr, respectively. On the other hand, sources with high intrinsic absorption are unambiguously dominated by nuclear emission with absorption due to an optically thick torus, while absorption at the level of cm-2 and below can be associated to the interstellar medium of the host, if sufficiently dense (but see recent results in Norman et al. 2021, where column densities of cm-2 can be reached at ). In Figure 16 we plot the intrinsic as a function of and show with green lines the corner where and are consistent with being powered by star formation at the level of 100 and 1000 /yr. We conclude that all the X-ray sources detected in the protocluster are consistent with being in the Seyfert and QSO regime.
We made an attempt to detect variations in the average properties of the X-ray protocluster members as a function of the distance from the Spiderweb Galaxy. We find that half of the spectroscopically confirmed protocluster members are distributed within a radius of 90 arcsec (corresponding to kpc). Therefore, we consider the properties of the X-ray-emitting protocluster members below and above this radius. As already shown in Figure 9, the distribution of the X-ray sources is very similar to that of all the spectroscopically confirmed members. The fraction within and beyond 90 arcsec is % and %, respectively. If we consider only protocluster members with (see Section 8), we find % and % within and beyond 90 arcsec, respectively. The X-ray properties do not change either. The distribution of intrinsic absorption in the two subsamples is almost exactly symmetric (with one C-thick candidate per side) apart from source ID=7, which shows the highest measured and is the closest to the Spiderweb. Also, the average soft (hard) band luminosity is erg/s and erg/s, within and beyond 90 arcsec, respectively. Our preliminary investigation shows (possibly) marginally higher X-ray fraction, intrinsic absorption, and lower luminosities towards the protocluster center. However, this trend, if present, can only be reliably measured with a much larger sample, implying population studies of protoclusters with comparable X-ray depth.
Finally, apart from the X-ray-detected sources, we note that there are no protocluster members that have been identified as AGN from the optical and NIR spectrum. A detailed discussion of the single sources can be found in Appendix C.
6.5 Average X-ray properties of X-ray silent, spectroscopic, and color-selected protocluster members
We investigated the presence of X-ray emission below our detection threshold in the other spectroscopically identified protocluster members. We extracted a list of 82 sources with spectroscopic redshift in the range after removing the sources already detected in the X-ray band, and all the sources embedded in the diffuse emission close to the Spiderweb Galaxy within a radius of 12 arcsec (the so called flies). We then used the background images already used to compute the sky coverage, where all the 107 identified X-ray sources have already been removed. These soft and hard-band “background-only” images were obtained simply by cutting out the X-ray-detected sources and replacing the signal at their position with random noise consistent with the signal in the annular region surrounding it. These images therefore contain only the sky X-ray emission from sources below our detection threshold. We then simply stack the images at the position of the 82 optical sources previously selected. The resulting images, shown in Figure 17, provide an estimate of the cumulative emission from spectroscopically confirmed, nonX-ray-detected protocluster members in the soft and hard band. If we perform a simple aperture photometry in a circle of 2 arcsec (corresponding to a reasonable photometric aperture enclosing 95% of the flux in our field), we do not obtain significant detection in either band, formally measuring and in the soft and hard band, respectively. However, in the total (0.5 - 7 keV) band we have net counts, which formally has a statistical significance of . If we consider this as a marginal detection, after correction for average vignetting (%), we obtain a soft-band flux of erg/s/cm-2 and a hard-band flux of erg/s/cm-2 per source. Assuming a typical spectrum with and cm-2, this gives an intrinsic, rest-frame luminosity range of erg/s and erg/s (after correcting for intrinsic and Galactic absorption) in the 0.5-2.0 and 2-10 keV bands, respectively. The average, total band X-ray luminosity of these sources is therefore well below erg/s, which in turn corresponds to a maximum SFR of significantly less than M⊙/yr per source. This shows us that, with current Chandra capabilities, we can barely detect the average X-ray signal from spectroscopically confirmed members at the level of approximately one net count in our deep 715 ks exposure. At the same time, this would imply a widespread star formation activity at the level of a few tens of M⊙/yr on average for all the protocluster members, while optical and NIR spectroscopy do not confirm this. Therefore, if such a weak X-ray signal were confirmed, it may be ascribed to the combination of low-level nuclear activity and moderate star formation. Clearly, to explore the low-X-ray-luminosity regime of the bulk of the protocluster members, we should increase the current exposure by at least a factor of five. This would allow us to explore the star formation regime corresponding to M⊙/yr in each single source, implying that all the strong-starburst galaxies may be detected. We conclude that X-ray silent spectroscopic members do not contribute to the AGN luminosity function of the protocluster, but they may be hosting starburst events or low-level AGN activity. This is currently beyond the capability of Chandra (considering regular and large programs) and it definitely constitutes an interesting luminosity range to be explored by future high-angular-resolution X-ray missions, such as Lynx (The Lynx Team 2018) and AXIS (Mushotzky & AXIS Team 2019; Marchesi et al. 2020).

We then applied the same procedure to the 81 color- or narrow-band-selected sources that have no X-ray detection, and find similar results, possibly with a more convincing detection in the soft band, as shown in Figure 18. The usual aperture photometry within a circle of 2 arcsec provides net counts in the soft band, and therefore a formal detection at . The soft band photometry corresponds to a soft flux of erg/s/cm-2, and, assuming the usual mildly absorbed power law and , to a luminosity of and erg/s per source in the soft and hard band, respectively. This luminosity range is typical of starburst galaxies with SFR of the order of M⊙/yr. In the hard band, we obtain only an upper limit (formally the photometry gives net counts), which translates to upper limits of and erg/s per source in the soft and hard band, respectively. This tells us that the average source is softer than the adopted, AGN-like model. Despite the small signal obtained in the soft band, we further split the 81 color- or narrow-band-selected sources without X-ray detection into four subsamples according to their selection criteria: emitter, emitter, ERO (Kurk et al. 2004b), and photo-z (Dannerbauer et al. 2014; Shimakawa et al. 2018; Tadaki et al. 2019). We find 1 positive photometry in the soft band for (13)- and ERO (29)-selected sources, and 1.5 positive photometry for photo-z (30). In the hard band we have both positive and negative photometry. Therefore, the signal in the soft band is confirmed, and is contributed mostly by the 30 protocluster member candidates selected by photo-z. However, we have no control on the contamination of this list of protocluster member candidates. This aspect, coupled to the large statistical uncertainty associated to stacked emission measurements, hampers any conclusion on the X-ray emission from color-selected protocluster member candidates, except that we do not expect them to host significant nuclear activity.
Our general conclusion is that there is no significant X-ray emission that we have missed so far among all the confirmed or candidate protocluster members that have not been X-ray detected. However, the obtained marginal detections confirm that potentially we are able to detect star formation in the protocluster galaxies at the level of M⊙/yr by stacking their X-ray emission. Additional work must be done before we can draw any strong conclusion, in particular it is necessary to increase the number of spectroscopically confirmed members by more than a factor of two. From this perspective, future observations of this target with JWST and further spectroscopic follow-up may have strong synergy with the available X-ray data and reveal further relevant properties of the galaxy population in the Spiderweb protocluster.

7 X-ray luminosity function of protocluster members
To compute a cumulative luminosity function in the protocluster region, we need a comoving volume representative of our sample. If we consider the comoving volume corresponding to a circle of 5 arcmin centered on the Spiderweb Galaxy, and the difference in the comoving radial distance between and , we find a value of Mpc3. The comoving mass corresponding to this volume in the assumed cosmology is , which is in the range of predicted virial mass at for the Spiderweb protocluster. However, this is rather a lower limit to the mass included within a radius of 5 arcmin, because the central part of the protocluster is definitely overdense with respect to the ambient cosmic density.
Second, we need an estimate of the intrinsic luminosity of the Compton-thick candidates. As mentioned above, the luminosity values listed in Table 5 for XID 86 and XID 34 simply refer the observed luminosity that, in the case of a reflection-dominated spectrum, is only a fraction of the intrinsic power. We conservatively assume that the observed hard (2-10 keV) luminosity is % of the intrinsic one (Marchesi et al. 2019; Zhao et al. 2021, corresponding to the upper envelope of the values observed for local Compton-thick AGN; see), and that the soft-band luminosity is 1.6 times the hard-band luminosity, roughly corresponding to a power-law spectrum with . This very crude approximation allows us to obtain a first-order estimate of the intrinsic luminosity of the two Compton-thick candidates, and therefore to have the soft- and hard-band luminosities for all the 13 protocluster members.
Finally, we need to include the sky coverage correction in the luminosity function. We collected the weight factor corresponding to the soft- and hard-band fluxes of each source, which is similar to our method used to compute the number counts. We then considered the smallest weight for each source, computed according to Equation 2. Given the relatively high luminosities of the protocluster members, we only have a small () correction for the two faintest sources (XID 12 and XID 34). For the sake of clarity, we note that their S/N in the corresponding detection bands is , which is far enough from the detection limit and therefore corresponds to a very mild sky coverage correction.
In Figure 19 we show the cumulative rest-frame luminosity in the soft and hard band after excluding the Spiderweb Galaxy. In both cases we show this luminosity with and without the two Compton-thick candidates, given the large uncertainties in their estimated luminosities. We also plot the cumulative luminosity function predicted at in the model of Gilli et al. 2007. As expected, the excess measured in the Spiderweb protocluster volume is consistent with the excess previously measured in the number counts. The excess is always about an order of magnitude at the lowest end and increases with luminosity, reaching a factor of 20 and beyond at erg/s in both bands. This is also clear in Figure 20, where we show the ratio of the X-ray AGN luminosity function in the Spiderweb protocluster to the field luminosity function in the field from the model by Gilli et al. 2007. To compute the ratio we include the Compton-thick candidates. Removing them will result in a lower excess, decreased by a factor of , as shown in Figure 19. As discussed above, this excess is due to the combination of the average galaxy overdensity in the protocluster region and the enhancement factor. In Section 9, we provide an estimate of the enhancement factor alone.
8 AGN fraction in the Spiderweb protocluster
The measurement of the AGN fraction as a function of the environment is an important observable that can provide insight into the SMBH feeding mechanisms. Several studies in the X-ray band have been performed for relatively low redshift in massive systems. Typically, the AGN fraction among cluster members increases with distance from the center, and reaches values comparable with the field (of the order of %) when considering the full X-ray luminosity range (- erg/s), or significantly lower than the field when focusing on luminosities erg/s (see Puccetti et al. 2020, and discussion therein). Overall, the X-ray nuclear emission in cluster galaxies (with the noticeable exception of the central galaxy) is expected to be triggered by interactions (Ehlert et al. 2015, see), or by ram pressure in the outskirts (Poggianti et al. 2017), while several other mechanism are contributing in the field. The situation is expected to be significantly different in protoclusters, where the lower density of galaxies, the different velocity distribution, and the much larger availability of cold gas, may contribute to produce an AGN fraction that is significantly larger than in the field. Here we focus on the AGN fraction, and try to compare the results we obtained in the Spiderweb Complex with the literature, focusing on the best-studied protoclusters.
The first aspect to notice is that the presence of activity (star formation and/or nuclear) in galaxies has some dependence on the environment and on the cosmic epoch at the same time. The two dependencies cannot be easily decoupled, because the main characteristics of dense environments change with epoch as well. Locally, it is well established that star formation and nuclear activity —at least at the bright end— are suppressed in dense environments such as massive, virialized halos. At the same time, the AGN fraction seems to increase in cluster progenitors at redshift (Martini et al. 2013; Alberts et al. 2016; Kalita et al. 2021), while several studies have found intense star formation in at least some cluster cores at (Tran et al. 2010; Brodwin et al. 2013; Santos et al. 2014; Santos et al. 2015; Coogan et al. 2018), suggesting an inversion of the SF-density anticorrelation observed in local clusters. An important aspect is the large diversity among the cluster population in the range , with some of them hosting passive evolved galaxies, and some a rapidly evolving active population.
This is consistent with an increase (possibly a co-evolution) of SF and AGN in massive halos in the range when approaching their formation epoch. At present, we do not have a comprehensive understanding of how the connection between AGN activity and large-scale galaxy environment proceeds with redshift. This connection may be particularly effective when entering the regime of protoclusters. The deep Chandra observation of the Spiderweb Complex presented in this work gives us the possibility to measure the X-ray AGN fraction in a protocluster environment, and the X-ray AGN enhancement factor with respect to the field at the same redshift. Clearly, the member galaxy selection is key in this case, because protocluster members are usually picked up from a selection of Ly emitters, or from color–color-selected subsamples, potentially introducing a bias associated to galaxy type. Here, a convenient parameter is the stellar mass.
We recall that the fraction of X-ray AGN among Ly emitters is usually low, both in the field and in protoclusters (Malhotra et al. 2003; Zheng et al. 2016, see, e.g.,). However, several works have claimed that there is enhanced nuclear activity in massive protoclusters. Apart from early claims in the Spiderweb based on two spectroscopically confirmed X-ray-detected AGN and three X-ray member candidates (Pentericci et al. 2002), a high AGN fraction at the level of % has been found in 2QZ (Lehmer et al. 2013) at , DRC at (Vito et al. 2020), and at lower redshift in Cl0218.3-0510 at (Krishnan et al. 2017). Recently, AGN identified through optical spectroscopy of X-ray data in the Planck-selected protocluster at have been shown to amount to % of all the identified protocluster members (Polletta et al. 2021). In all cases, the limited statistics make the uncertainty on the AGN fraction significantly larger than %. On the other hand, other protoclusters in the range appear to have a significantly lower fraction, implying an enhancement factor consistent with unity (Lehmer et al. 2009; Digby-North et al. 2010; Macuga et al. 2019). The fraction of X-ray-emitting AGN in protoclusters measured so far in the literature is shown in Table 6.
| Protocluster | z | X-ray AGN fraction | Ref |
|---|---|---|---|
| Cl0218.3-0510 | 1.62 | % | Krishnan et al. 2017 |
| Spiderweb | 2.156 | % | This work |
| PHz G237.01 | 2.16 | % | Polletta et al. 2021 |
| 2QZ | 2.23 | % | Lehmer et al. 2013 |
| HS1700 | 2.3 | % | Digby-North et al. 2010 |
| USS 1558-003 | 2.53 | % | Macuga et al. 2019 |
| SSA22 | 3.09 | % | Lehmer et al. 2009 |
| DRC | 4.002 | % | Vito et al. 2020 |
To measure the AGN fraction in the Spiderweb protocluster, we need to control the selection in stellar mass. As detailed in Section 3, we estimated stellar masses for about 80% of the sample. Among the 96 protocluster members (), we have a robust measurement of for 62 of them, while 34 are not detected. We assume a nominal upper limit of (which is irrelevant in this work). We note that most of the sources without a counterpart are from the COALAS survey. In fact, from Table 3 of Jin et al. 2021, we notice that half of them are not detected in the band, while 90% of them are detected in the band, and therefore these sources should correspond to relatively low-mass galaxies.
The distribution of in the protocluster is shown in Figure 21. We note that we include all the sources that do not have a band counterpart in our image in the first bin . This is clearly an oversimplification but has no effect on our results. Ideally, we may compute an AGN fraction as a function of , but given the low statistics, we simply consider all the sources with . For completeness, we briefly discuss preliminary results on the distribution of protocluster sources in the plane in Section D. Finally, we reiterate that, apart from the X-ray-detected sources, there are no protocluster members that have been identified as AGN from the optical and NIR spectrum. Therefore, excluding the Spiderweb Galaxy, we have 13 X-ray AGN (11 excluding the source with a photometric counterpart and the one with a double counterpart) over a total of 44 sources for an X-ray AGN fraction with erg/s of % (%). To bracket this value, we consider a maximum of additional members, two with X-ray emission, as discussed in Section 6.2. Their inclusion would bring the AGN fraction to %. Considering this as a lower limit, we can estimate the AGN fraction in the Spiderweb protocluster as %, where the error bar also accounts for the maximum systematic uncertainty. We stress that the uncertainty we quote here, based on the photometric study of Pannella et al. (in preparation), also includes the effect of the different area coverage between X-ray data and spectroscopic or color/emission line selection. A detailed treatment of the effects of the protocluster member selection within 5 arcmin would imply a significant additional effort and would only mildly reduce the uncertainty we have estimated.
As shown in Table 6, this value is somewhat higher but consistent with the measurement from Krishnan et al. 2017 at and to the highest values found at by Lehmer et al. 2013, and by Vito et al. 20201717 17 We note that Vito et al. 2020 considers only X-ray selection among submm-detected galaxies, revising for example the value found in SSA22 to %.. Three different works instead find values in the range of 2%–5%, within an uncertainty of a factor of 2. We plot these values in Figure 22, where the measurement in this work is marked with a blue dot. We present this plot simply to compare the different values obtained in the literature so far, with no attempt to explore a possible behavior with redshift. The main problem with the measurement of the evolution of the AGN fraction in protoclusters is that these values were obtained from data with different X-ray depth and different selection for the protocluster membership; the first aspect is not an issue, because all the medium-deep Chandra data used in these works reach luminosity levels of erg/s in both bands. On the other hand, we lack an homogeneous and complete selection of the protocluster members in the optical. As of today, the only robust constraint on the evolution of the X-ray AGN fraction is a clear increase from the low local values at the level of % to % in a few protoclusters at . Similar but slightly larger uncertainties are found for the enhancement factor, which is discussed in the following section.
9 AGN enhancement factor in the Spiderweb protocluster
To compare the AGN fraction in the Spiderweb protocluster with that in the field, we refer to the few works in the literature that provide an estimate of this latter, key quantity. Lehmer et al. 2009 estimate an average fraction of % and % from Lyman Break Galaxies and Ly emitters in the CDF + SSA22 field, respectively, for . These values were obtained for , which, for a power law with , corresponds to . Only seven sources satisfy this threshold, or nine if we consider the Compton-thick candidates and assume that the hard-band intrinsic luminosity is ten times the observed one. Therefore, the fraction of AGN with in our spectroscopic sample is %. In this case, we find the enhancement factor for in the Spiderweb protocluster to be or , depending on the assumed field value.
Another estimate of the field X-ray AGN fraction is provided by Lehmer et al. 2013, who use an independent sample of HAEs from the High Redshift Emission Line Survey (HiZELS) in the wide-area deg2 COSMOS survey field (Sobral et al. 2013). Lehmer et al. 2013 found 10 Chandra sources matched to the 210 HiZELS HAEs within the C-COSMOS footprint, giving an AGN fraction in the low-density environment of %. The COSMOS flux limit of erg/s/cm2 in the 0.5–10 keV (Marchesi et al. 2016, see) corresponds to erg/s. This limit is equivalent to that previously used for a comparison with LBG and HAE sources in the CDF + SSA22 field. In this case, the enhancement factor is found to be .
Previous estimates of the enhancement factor range from (Krishnan et al. 2017) to (Lehmer et al. 2013) and (Lehmer et al. 2009), in broad agreement with our results. However, as mentioned above, there are works that measure substantially lower X-ray AGN fractions in protoclusters, concluding that there is no enhancement with respect to the field (Digby-North et al. 2010; Macuga et al. 2019). This difference may simply reflect the diversity among protoclusters and their different dynamical stage, as expected in such a rapidly evolving phase.
In all these cases, the uncertainties on the AGN fraction in the field clearly dominate the error budget. Nevertheless, we find that we always obtain an enhancement factor in the range 5-20 for X-ray AGN with erg/s and . On the other hand, it is well known that the enhancement factor drops below 1 in all the virialized halos at relatively low redshift (), except in the cluster outskirts (Koulouridis & Bartalucci 2019). Therefore, we confirm the existence of a strong evolution of the X-ray AGN enhancement factor in the central regions of clusters and protoclusters with redshift. However, we do expect to also see a strong dependence on the environment, and therefore a large diversity among the observed protoclusters, as probably suggested by the different conclusions on the enhancement factor at presented in the literature. Only by disentangling the complex pattern due to the combination of environmental effects and cosmic evolution can we hope to reach a comprehensive picture of the galaxy population evolution in clusters.
10 Future perspectives
There are several promising approaches to extending this work in order to gain further insight into the evolution of nuclear activity in protoclusters and connect it to the dearth of activity in virialized, mature clusters. In addition to the difficult characterization of the protocluster candidates already discussed in Sect. 1, the first obvious key aspect is the selection of the protocluster members, which largely differ among the few cases presented in the literature. Ideally, the protocluster membership should have a well-defined completeness as a function of stellar mass and distance from the center. Stellar mass should be used to compute AGN fraction above a given mass limit (typically, ). The information on the stellar mass of the active galaxies may also provide clues as to the physical mechanisms that trigger the activity. Krishnan et al. 2017 explore the distribution of the stellar mass of the X-ray-emitting AGN in the field and in protoclusters, and find no differences. These authors suggest that triggering mechanisms are similar in both environments and that the higher X-ray AGN fraction in protoclusters is simply due to the same mechanism occurring more frequently because of the denser environment. However, Monson et al. 2021 recently speculated that the enhanced AGN fraction in the protocluster SSA22 at is due to the larger masses (a factor of 2) of the LBG with respect to the field rather than an enhanced merger activity. This issue is also relevant for the process quenching the rapidly star forming galaxies that are observed as quiescent galaxies in the protocluster, forming the mentioned nascent red sequence. Similarly, a census of the nuclear activity in the radio band is needed to complete the picture offered by the X-ray data and provide robust constraints on the feedback processes in the member galaxies.
Focusing on the Spiderweb protocluster, we foresee the following next steps. First, an extension of the protocluster membership based on NIR images and eventual spectroscopic follow-up, to achieve a well-defined and complete stellar-mass function. Then, a detailed investigation of the archival high-resolution HST data, that, coupled to the submm data, may provide clues as to the role of interactions and/or the presence of cold gas in triggering nuclear activity. Finally, we plan to exploit new radio data in the L band with JVLA and GMRT to characterize the protocluster population in this band.
Such efforts would make the Spiderweb an ideal science case for the study of protoclusters. In this respect, the role of X-ray data with high-angular resolution will be key for the extension of this approach to a large sample. Currently, Chandra is the only facility that can provide data of the required quality. The future of this science case heavily depends on the future of high-resolution X-ray astronomy, which is currently embodied in the Lynx (The Lynx Team 2018) and AXIS (Mushotzky & AXIS Team 2019) mission concepts.
11 Conclusions
We present the deep (715 ks) X-ray observation of the radio galaxy J1140-2629 (the Spiderweb Galaxy) and the surrounding large-scale structure with Chandra. The deep X-ray data allow us to map the nuclear activity in a dense environment down to the low-luminosity end of the Seyfert galaxy population, and to test whether dense large-scale structure environments enhance X-ray nuclear activity, a phenomenon that has been investigated only recently at such a high redshift and only with shallower X-ray data. In addition, the sensitivity and exquisite angular resolution of Chandra allow us to characterize the extended emission around the Spiderweb Galaxy and possibly identify thermal X-ray emission from the ICM, a key piece of information with which to constrain both the dynamical state of the protocluster and the feedback mechanism at work in the Spiderweb complex, and ultimately, to provide an overview of the baryon cycling in such an active environment at . In this first paper, we focus on the nuclear activity of the galaxies in the Spiderweb protocluster, exploiting the combination of our deep X-ray data in the field and the large body of multi-wavelength and spectroscopic data available from the literature. The main results and the data products used in this work are made available on the project webpage1818 18 http://www.arcetri.inaf.it/spiderweb/. Our results can be summarized as follows:
- •
We identify 107 X-ray sources within a radius of 5 arcmin centered on the Spiderweb Galaxy, down to flux limits of erg/s/cm2 and erg/s/cm2 in the soft and hard band, respectively. We compute the cumulative number counts which are found to be consistent with results from X-ray deep fields in the literature.
- •
We identify 13 X-ray sources with spectroscopically confirmed counterparts belonging to the Spiderweb Complex (including the Spiderweb Galaxy itself) and 1 with a color-selected member candidate. As these sources are found in the redshift range , we classify them as protocluster members (as opposed to member of the Spiderweb Complex, which includes a larger redshift window ). The X-ray-emitting protocluster members are distributed over an approximately rectangular region with and Mpc by side.
- •
The X-ray spectral analysis finds five strongly absorbed AGN ( cm-2), two sources with flat spectra, which we classify as Compton-thick candidates with reflection-dominated spectrum, and seven sources with moderate or low absorption. After correcting for Galactic and intrinsic absorption, and with an educated guess for the intrinsic luminosity of the two Compton-thick candidates, the rest-frame 0.5-10 keV luminosities are found to be above erg/s for all the sources. By combining intrinsic absorption and intrinsic luminosities, we conclude that all the X-ray-emitting protocluster members are powered by nuclear activity. We do not find hints of a change of the X-ray properties of the protocluster members with the distance from the Spiderweb Galaxy.
- •
We stack the images of all the X-ray silent, spectroscopically confirmed members, finding a marginal detection corresponding to average luminosities below erg/s, showing that there is no significant nuclear activity at about one order of magnitude below our detection threshold. A slightly stronger detection is obtained for the stacked emission of the color or narrow-band selected members, consistent with being powered by star formation at the level of M⊙/year, but the unknown contamination fraction prevents us from deriving robust conclusions on their nature.
- •
The X-ray luminosity function of AGN in the volume associated to the Spiderweb protocluster is more than an order of magnitude larger than in the field at the same redshift in the range erg/s in both bands, and significantly flatter, implying an increasing excess at the bright end.
- •
For erg/s, we measure an X-ray AGN fraction of % among galaxies with , which is higher but still consistent with the values found at least in four protoclusters at similar redshift.
- •
The measured AGN fraction in the Spiderweb protocluster at erg/s corresponds to an enhancement factor with respect to the field that ranges from 5 to 20 (with a preferred value with respect to the COSMOS field at comparable redshifts and stellar mass range), suggesting a significant environmental effect triggering nuclear activity in the Spiderweb protocluster.
Unfortunately, the decreasing sensitivity of Chandra due to the contamination layer on the ACIS detector makes future studies of this kind very hard, and we can realistically foresee that only a handful of new targets will be studied with comparable detail in the future. Nevertheless, the confirmation of an enhanced X-ray AGN activity in protoclusters is an important ingredient with which to plan studies of high-z large-scale structure with future X-ray facilities. By exploiting the available multiwavelength dataset on the Spiderweb field, we plan to further explore the properties of the X-ray protocluster members to investigate the main physical mechanism responsible for triggering the X-ray emission.
Acknowledgements.
This work was carried out during the ongoing COVID-19 pandemic. The authors would like to acknowledge the health workers all over the world for their role in fighting in the frontline of this crisis. We thank the anonymous referee for detailed comments and positive criticism that helped improving the quality of the paper. We thank Stefano Marchesi for useful discussions. P.T. and R.G. acknowledge financial contribution from the agreement ASI-INAF n.2017-14-H.0. M.N. acknowledges INAF-1.05.01.86.20. S.B. acknowledges partial financial support from the Indark INFN Grant. A.S. is supported by the FARE-MIUR grant ’ClustersXEuclid’ R165SBKTMA and INFN InDark grant. AS, MP, VS, LDM are supported by the ERC-StG ‘ClustersXCosmo’ grant agreement 716762. HD acknowledges financial support from the AEI-MCINN under grant with reference PID2019-105776GB-I00/DOI:10.13039/501100011033, and from the ACIISI, Consejería de Economía, Conocimiento y Empleo del Gobierno de Canarias and the European Regional Development Fund (ERDF) under grant with reference PROID2020010107. We thank Hans Moritz Günther for help with the use of the MARX software. We thank Malgorzata Sobolewska for assistance during the Chandra observations. This work is based in part on data collected at Subaru Telescope and obtained from the SMOKA, which is operated by the Astronomy Data Center, National Astronomical Observatory of Japan, (Baba et al. 2002). This research has made use of the services of the ESO Science Archive Facility.References
- Alberts et al. (2016) Alberts, S., Pope, A., Brodwin, M., et al. 2016, ApJ, 825, 72
- Anderson & Carilli (2022) Anderson, C. S. & Carilli, C. L. 2022, ApJ, in press
- Athreya et al. (1998) Athreya, R. M., Kapahi, V. K., McCarthy, P. J., & van Breugel, W. 1998, A&A, 329, 809
- Baba et al. (2002) Baba, H., Yasuda, N., Ichikawa, S.-I., et al. 2002, in Astronomical Society of the Pacific Conference Series, Vol. 281, Astronomical Data Analysis Software and Systems XI, ed. D. A. Bohlender, D. Durand, & T. H. Handley, 298
- Beers et al. (1990) Beers, T. C., Flynn, K., & Gebhardt, K. 1990, AJ, 100, 32
- Bertin (2006) Bertin, E. 2006, in Astronomical Society of the Pacific Conference Series, Vol. 351, Astronomical Data Analysis Software and Systems XV, ed. C. Gabriel, C. Arviset, D. Ponz, & S. Enrique, 112
- Bertin et al. (2002) Bertin, E., Mellier, Y., Radovich, M., et al. 2002, in Astronomical Society of the Pacific Conference Series, Vol. 281, Astronomical Data Analysis Software and Systems XI, ed. D. A. Bohlender, D. Durand, & T. H. Handley, 228
- Branchesi et al. (2007) Branchesi, M., Gioia, I. M., Fanti, C., Fanti, R., & Cappelluti, N. 2007, A&A, 462, 449
- Brodwin et al. (2013) Brodwin, M., Stanford, S. A., Gonzalez, A. H., et al. 2013, ApJ, 779, 138
- Bruzual & Charlot (2003) Bruzual, G. & Charlot, S. 2003, MNRAS, 344, 1000
- Calzetti et al. (2000) Calzetti, D., Armus, L., Bohlin, R. C., et al. 2000, ApJ, 533, 682
- Carilli & Anderson (2022) Carilli, C. L. & Anderson, C. S. 2022, ApJ, in press
- Carilli et al. (1997) Carilli, C. L., Röttgering, H. J. A., van Ojik, R., Miley, G. K., & van Breugel, W. J. M. 1997, ApJS, 109, 1
- Champagne et al. (2021) Champagne, J. B., Casey, C. M., Zavala, J. A., et al. 2021, ApJ, 913, 110
- Coogan et al. (2018) Coogan, R. T., Daddi, E., Sargent, M. T., et al. 2018, MNRAS, 479, 703
- Croft et al. (2005) Croft, S., Kurk, J., van Breugel, W., et al. 2005, AJ, 130, 867
- Dannerbauer et al. (2014) Dannerbauer, H., Kurk, J. D., De Breuck, C., et al. 2014, A&A, 570, A55
- Digby-North et al. (2010) Digby-North, J. A., Nandra, K., Laird, E. S., et al. 2010, MNRAS, 407, 846
- Doherty et al. (2010) Doherty, M., Tanaka, M., De Breuck, C., et al. 2010, A&A, 509, A83
- Ehlert et al. (2015) Ehlert, S., Allen, S. W., Brandt, W. N., et al. 2015, MNRAS, 446, 2709
- Emonts et al. (2018) Emonts, B. H. C., Lehnert, M. D., Dannerbauer, H., et al. 2018, MNRAS, 477, L60
- Fan (2006) Fan, X. 2006, New A Rev., 50, 665
- Gabasch et al. (2004) Gabasch, A., Salvato, M., Saglia, R. P., et al. 2004, ApJ, 616, L83
- Galametz et al. (2012) Galametz, A., Stern, D., De Breuck, C., et al. 2012, ApJ, 749, 169
- Giacconi et al. (2001) Giacconi, R., Rosati, P., Tozzi, P., et al. 2001, ApJ, 551, 624
- Gilli et al. (2007) Gilli, R., Comastri, A., & Hasinger, G. 2007, A&A, 463, 79
- Gilli et al. (2019) Gilli, R., Mignoli, M., Peca, A., et al. 2019, A&A, 632, A26
- Gilli et al. (2011) Gilli, R., Su, J., Norman, C., et al. 2011, ApJ, 730, L28
- Gobat et al. (2011) Gobat, R., Daddi, E., Onodera, M., et al. 2011, A&A, 526, A133
- Hasinger et al. (2005) Hasinger, G., Miyaji, T., & Schmidt, M. 2005, A&A, 441, 417
- Hatch et al. (2009) Hatch, N. A., Overzier, R. A., Kurk, J. D., et al. 2009, MNRAS, 395, 114
- HI4PI Collaboration et al. (2016) HI4PI Collaboration, Ben Bekhti, N., Flöer, L., et al. 2016, A&A, 594, A116
- Ilbert et al. (2010) Ilbert, O., Salvato, M., Le Floc’h, E., et al. 2010, ApJ, 709, 644
- Iwasawa et al. (2020) Iwasawa, K., Comastri, A., Vignali, C., et al. 2020, A&A, 639, A51
- Jin et al. (2021) Jin, S., Dannerbauer, H., Emonts, B., et al. 2021, A&A, 652, A11
- Kalita et al. (2021) Kalita, B. S., Daddi, E., Coogan, R. T., et al. 2021, MNRAS, 503, 1174
- Kocevski et al. (2009) Kocevski, D. D., Lubin, L. M., Gal, R., et al. 2009, ApJ, 690, 295
- Kodama et al. (2007) Kodama, T., Tanaka, I., Kajisawa, M., et al. 2007, MNRAS, 377, 1717
- Komatsu et al. (2011) Komatsu, E., Smith, K. M., Dunkley, J., et al. 2011, ApJS, 192, 18
- Koulouridis & Bartalucci (2019) Koulouridis, E. & Bartalucci, I. 2019, A&A, 623, L10
- Koyama et al. (2013) Koyama, Y., Kodama, T., Tadaki, K.-i., et al. 2013, MNRAS, 428, 1551
- Kriek et al. (2009) Kriek, M., van Dokkum, P. G., Labbé, I., et al. 2009, ApJ, 700, 221
- Krishnan et al. (2017) Krishnan, C., Hatch, N. A., Almaini, O., et al. 2017, MNRAS, 470, 2170
- Kuiper et al. (2011) Kuiper, E., Hatch, N. A., Miley, G. K., et al. 2011, MNRAS, 415, 2245
- Kurk et al. (2004a) Kurk, J. D., Pentericci, L., Overzier, R. A., Röttgering, H. J. A., & Miley, G. K. 2004a, A&A, 428, 817
- Kurk et al. (2004b) Kurk, J. D., Pentericci, L., Röttgering, H. J. A., & Miley, G. K. 2004b, A&A, 428, 793
- Kurk et al. (2000) Kurk, J. D., Röttgering, H. J. A., Pentericci, L., et al. 2000, A&A, 358, L1
- Lehmer et al. (2009) Lehmer, B. D., Alexander, D. M., Geach, J. E., et al. 2009, ApJ, 691, 687
- Lehmer et al. (2016) Lehmer, B. D., Basu-Zych, A. R., Mineo, S., et al. 2016, ApJ, 825, 7
- Lehmer et al. (2013) Lehmer, B. D., Lucy, A. B., Alexander, D. M., et al. 2013, ApJ, 765, 87
- Liu et al. (2017) Liu, T., Tozzi, P., Wang, J.-X., et al. 2017, ApJS, 232, 8
- Luo et al. (2017) Luo, B., Brandt, W. N., Xue, Y. Q., et al. 2017, ApJS, 228, 2
- Macuga et al. (2019) Macuga, M., Martini, P., Miller, E. D., et al. 2019, ApJ, 874, 54
- Malhotra et al. (2003) Malhotra, S., Wang, J. X., Rhoads, J. E., Heckman, T. M., & Norman, C. A. 2003, ApJ, 585, L25
- Marchesi et al. (2019) Marchesi, S., Ajello, M., Zhao, X., et al. 2019, ApJ, 872, 8
- Marchesi et al. (2016) Marchesi, S., Civano, F., Elvis, M., et al. 2016, ApJ, 817, 34
- Marchesi et al. (2020) Marchesi, S., Gilli, R., Lanzuisi, G., et al. 2020, A&A, 642, A184
- Martini et al. (2006) Martini, P., Kelson, D. D., Kim, E., Mulchaey, J. S., & Athey, A. A. 2006, ApJ, 644, 116
- Martini et al. (2013) Martini, P., Miller, E. D., Brodwin, M., et al. 2013, ApJ, 768, 1
- Mayo et al. (2012) Mayo, J. H., Vernet, J., De Breuck, C., et al. 2012, A&A, 539, A33
- Miley et al. (2006) Miley, G. K., Overzier, R. A., Zirm, A. W., et al. 2006, ApJ, 650, L29
- Monson et al. (2021) Monson, E. B., Lehmer, B. D., Doore, K., et al. 2021, ApJ, 919, 51
- Muldrew et al. (2015) Muldrew, S. I., Hatch, N. A., & Cooke, E. A. 2015, MNRAS, 452, 2528
- Mullaney et al. (2012a) Mullaney, J. R., Daddi, E., Béthermin, M., et al. 2012a, ApJ, 753, L30
- Mullaney et al. (2012b) Mullaney, J. R., Pannella, M., Daddi, E., et al. 2012b, MNRAS, 419, 95
- Mushotzky & AXIS Team (2019) Mushotzky, R. & AXIS Team. 2019, in The Space Astrophysics Landscape for the 2020s and Beyond, Vol. 2135, 5025
- Nesvadba et al. (2011) Nesvadba, N. P. H., De Breuck, C., Lehnert, M. D., et al. 2011, A&A, 525, A43
- Nonino et al. (2009) Nonino, M., Dickinson, M., Rosati, P., et al. 2009, ApJS, 183, 244
- Norman et al. (2002) Norman, C., Hasinger, G., Giacconi, R., et al. 2002, ApJ, 571, 218
- Osterbrock (1989) Osterbrock, D. E. 1989, Annals of the New York Academy of Sciences, 571, 99
- Overzier (2016) Overzier, R. A. 2016, A&A Rev., 24, 14
- Pannella et al. (2015) Pannella, M., Elbaz, D., Daddi, E., et al. 2015, ApJ, 807, 141
- Pentericci et al. (2002) Pentericci, L., Kurk, J. D., Carilli, C. L., et al. 2002, A&A, 396, 109
- Pentericci et al. (2000) Pentericci, L., Kurk, J. D., Röttgering, H. J. A., et al. 2000, A&A, 361, L25
- Pentericci et al. (1997) Pentericci, L., Roettgering, H. J. A., Miley, G. K., Carilli, C. L., & McCarthy, P. 1997, A&A, 326, 580
- Poggianti et al. (2017) Poggianti, B. M., Jaffé, Y. L., Moretti, A., et al. 2017, Nature, 548, 304
- Polletta et al. (2021) Polletta, M., Soucail, G., Dole, H., et al. 2021, A&A, 654, A121
- Puccetti et al. (2020) Puccetti, S., Fiore, F., Bongiorno, A., et al. 2020, A&A, 634, A137
- Puccetti et al. (2009) Puccetti, S., Vignali, C., Cappelluti, N., et al. 2009, ApJS, 185, 586
- Richards et al. (2006) Richards, G. T., Strauss, M. A., Fan, X., et al. 2006, AJ, 131, 2766
- Rigby et al. (2014) Rigby, E. E., Hatch, N. A., Röttgering, H. J. A., et al. 2014, MNRAS, 437, 1882
- Roettgering et al. (1994) Roettgering, H. J. A., Lacy, M., Miley, G. K., Chambers, K. C., & Saunders, R. 1994, A&AS, 108, 79
- Roettgering et al. (1997) Roettgering, H. J. A., van Ojik, R., Miley, G. K., et al. 1997, A&A, 326, 505
- Rosati et al. (2002) Rosati, P., Tozzi, P., Giacconi, R., et al. 2002, ApJ, 566, 667
- Salpeter (1955) Salpeter, E. E. 1955, ApJ, 121, 161
- Santos et al. (2014) Santos, J. S., Altieri, B., Tanaka, M., et al. 2014, MNRAS, 438, 2565
- Santos et al. (2015) Santos, J. S., Altieri, B., Valtchanov, I., et al. 2015, MNRAS, 447, L65
- Seymour et al. (2007) Seymour, N., Stern, D., De Breuck, C., et al. 2007, ApJS, 171, 353
- Shimakawa et al. (2014) Shimakawa, R., Kodama, T., Tadaki, K. I., et al. 2014, MNRAS, 441, L1
- Shimakawa et al. (2018) Shimakawa, R., Koyama, Y., Röttgering, H. J. A., et al. 2018, MNRAS, 481, 5630
- Sobral et al. (2013) Sobral, D., Smail, I., Best, P. N., et al. 2013, MNRAS, 428, 1128
- Tadaki et al. (2019) Tadaki, K.-i., Kodama, T., Hayashi, M., et al. 2019, PASJ, 71, 40
- Tanaka et al. (2013) Tanaka, M., Toft, S., Marchesini, D., et al. 2013, ApJ, 772, 113
- The Lynx Team (2018) The Lynx Team. 2018, arXiv e-prints, arXiv:1809.09642
- Tozzi et al. (2006) Tozzi, P., Gilli, R., Mainieri, V., et al. 2006, A&A, 451, 457
- Tozzi et al. (2001) Tozzi, P., Rosati, P., Nonino, M., et al. 2001, ApJ, 562, 42
- Tran et al. (2010) Tran, K.-V. H., Papovich, C., Saintonge, A., et al. 2010, ApJ, 719, L126
- Valentino et al. (2016) Valentino, F., Daddi, E., Finoguenov, A., et al. 2016, ApJ, 829, 53
- Valtchanov et al. (2013) Valtchanov, I., Altieri, B., Berta, S., et al. 2013, MNRAS, 436, 2505
- van Ojik (1995) van Ojik, R. 1995, PhD thesis, Leiden University, Netherlands
- Vito et al. (2020) Vito, F., Brandt, W. N., Lehmer, B. D., et al. 2020, A&A, 642, A149
- Wang et al. (2016) Wang, T., Elbaz, D., Daddi, E., et al. 2016, ApJ, 828, 56
- Zhao et al. (2021) Zhao, X., Marchesi, S., Ajello, M., et al. 2021, A&A, 650, A57
- Zheng et al. (2016) Zheng, Z.-Y., Malhotra, S., Rhoads, J. E., et al. 2016, ApJS, 226, 23
- Zirm et al. (2008) Zirm, A. W., Stanford, S. A., Postman, M., et al. 2008, ApJ, 680, 224
- Zirm et al. (2012) Zirm, A. W., Toft, S., & Tanaka, M. 2012, ApJ, 744, 181
Appendix A Source list
In Table 7 we list the properties of the 107 X-ray sources detected in the FOV included in a circle of 5 arcmin centered on the Spiderweb Galaxy. Soft (0.5-2 keV) and hard (2-7 keV) net counts are obtained with aperture photometry. Values have been rounded to the first decimal place except in a few cases. Negative values are sometimes obtained due to background fluctuations. Soft and hard (2-10 keV) band energy fluxes are obtained multiplying the net counts, corrected for vignetting, by the corresponding conversion factors listed in Table 4. The errors are obtained combining independently the statistical photometric error with the systematic uncertainty on the spectral shape (hence, on the conversion factors). In case the in a given band does not reach our threshold value , we quote the upper limit to the energy flux. The original ASCII file of Table 1 can be retrieved from the webpage1919 19 http://www.arcetri.inaf.it/spiderweb/.
| XID | RA | DEC | Cts/s (soft) | Cts/s (hard) | ||
| erg/s/cm2 | erg/s/cm2 | |||||
| 1 | 175.18593 | -26.54934 | ||||
| 2 | 175.27884 | -26.50376 | ||||
| 3 | 175.24638 | -26.50113 | ||||
| 4 | 175.22588 | -26.49542 | ||||
| 5 | 175.20786 | -26.49363 | ||||
| 6 | 175.22015 | -26.48645 | ||||
| 7 | 175.19974 | -26.48512 | ||||
| 8 | 175.28694 | -26.47671 | ||||
| 9 | 175.23038 | -26.47326 | ||||
| 10 | 175.25893 | -26.51378 | ||||
| 11 | 175.29327 | -26.48855 | ||||
| 12 | 175.22990 | -26.47804 | ||||
| 13r3 | 175.28102 | -26.44954 | ||||
| 14 | 175.13669 | -26.53742 | ||||
| 15 | 175.12944 | -26.49295 | ||||
| 16 | 175.23132 | -26.54720 | ||||
| 17r1 | 175.18042 | -26.53844 | ||||
| 18 | 175.21500 | -26.52062 | ||||
| 19 | 175.17738 | -26.51848 | ||||
| 20 | 175.11499 | -26.48742 | ||||
| 21 | 175.21033 | -26.55919 | ||||
| 22 | 175.20374 | -26.55444 | ||||
| 23 | 175.18608 | -26.54500 | ||||
| 24 | 175.25270 | -26.53977 | ||||
| 25 | 175.26349 | -26.53928 | ||||
| 26r1 | 175.16380 | -26.53818 | ||||
| 27 | 175.24773 | -26.53220 | ||||
| 28 | 175.24940 | -26.53080 | ||||
| 29 | 175.24535 | -26.53001 | ||||
| 30 | 175.27881 | -26.52859 | ||||
| 31 | 175.18436 | -26.52488 | ||||
| 32 | 175.17839 | -26.51327 | ||||
| 33 | 175.24586 | -26.50403 | ||||
| 34 | 175.24149 | -26.49342 | ||||
| 35 | 175.19250 | -26.48165 | ||||
| 36 | 175.16551 | -26.47922 | ||||
| 37 | 175.18231 | -26.46532 | ||||
| 38 | 175.26686 | -26.46100 | ||||
| 39 | 175.26224 | -26.45923 | ||||
| 40 | 175.28162 | -26.45306 | ||||
| 41 | 175.27260 | -26.44206 | ||||
| 42 | 175.16692 | -26.43220 | ||||
| 43 | 175.20650 | -26.42832 | ||||
| 44 | 175.14221 | -26.54348 | ||||
| 45 | 175.15338 | -26.53828 | ||||
| 46 | 175.13422 | -26.51784 | ||||
| 47 | 175.26782 | -26.45793 | ||||
| 48 | 175.15282 | -26.45285 | ||||
| 49 | 175.16095 | -26.44319 | ||||
| 50 | 175.14491 | -26.44095 | ||||
| 51 | 175.23083 | -26.43491 | ||||
| 52 | 175.20361 | -26.43283 | ||||
| 53 | 175.19453 | -26.42296 | ||||
| 54 | 175.13251 | -26.46288 | ||||
| 55 | 175.18709 | -26.50135 | ||||
| 56 | 175.18121 | -26.47711 | ||||
| 57 | 175.15547 | -26.50483 | ||||
| 58 | 175.20148 | -26.48577 | ||||
| 59 | 175.27609 | -26.48332 | ||||
| 60 | 175.22218 | -26.43210 | ||||
| 61 | 175.20068 | -26.43743 | ||||
| 62 | 175.19254 | -26.43634 | ||||
| 63 | 175.22252 | -26.45065 | ||||
| 64 | 175.25787 | -26.44586 | ||||
| 65 | 175.27296 | -26.44957 | ||||
| 66 | 175.27232 | -26.45238 | ||||
| 67 | 175.13544 | -26.52808 | ||||
| 68 | 175.14703 | -26.47453 | ||||
| 69 | 175.16040 | -26.46140 | ||||
| 70 | 175.16412 | -26.46660 | ||||
| 71 | 175.16164 | -26.48617 | ||||
| 72 | 175.18102 | -26.46208 | ||||
| 73 | 175.18962 | -26.46955 | ||||
| 74 | 175.18440 | -26.48541 | ||||
| 75 | 175.19153 | -26.48805 | ||||
| 76 | 175.20314 | -26.46463 | ||||
| 77 | 175.22797 | -26.45959 | ||||
| 78 | 175.23540 | -26.46467 | ||||
| 79 | 175.25610 | -26.46475 | ||||
| 80 | 175.25993 | -26.46278 | ||||
| 81 | 175.20267 | -26.48068 | ||||
| 82 | 175.27940 | -26.47438 | ||||
| 83 | 175.14645 | -26.49300 | ||||
| 84 | 175.15465 | -26.49537 | ||||
| 85 | 175.16492 | -26.49530 | ||||
| 86 | 175.18535 | -26.48916 | ||||
| 87 | 175.19443 | -26.48622 | ||||
| 88 | 175.20360 | -26.48595 | ||||
| 89 | 175.21483 | -26.48368 | ||||
| 90 | 175.21136 | -26.49230 | ||||
| 91 | 175.22507 | -26.49026 | ||||
| 92 | 175.22772 | -26.49112 | ||||
| 93 | 175.23019 | -26.49082 | ||||
| 94r1 | 175.23413 | -26.48683 | ||||
| 95 | 175.24232 | -26.50758 | ||||
| 96 | 175.26640 | -26.51311 | ||||
| 97 | 175.26569 | -26.51449 | ||||
| 98 | 175.24670 | -26.53411 | ||||
| 99 | 175.24873 | -26.53539 | ||||
| 100 | 175.22601 | -26.56204 | ||||
| 101 | 175.18367 | -26.51827 | ||||
| 102 | 175.14857 | -26.54114 | ||||
| 103 | 175.16844 | -26.55954 | ||||
| 104r3 | 175.20998 | -26.56691 | ||||
| 105 | 175.13370 | -26.49614 | ||||
| 106r3 | 175.26247 | -26.43484 | ||||
| 107 | 175.26004 | -26.49588 |
Appendix B Spectra of X-ray members
In Figure 23, we show the folded spectra of the eight X-ray members of the Spiderweb protocluster that have at least 40 net counts in the soft (0.5-2 keV) or hard (2-7 keV) band, along with the best-fit spectral model. Spectra have been rebinned with a minimum of 20 counts per energy bin for display purpose. The spectrum of the Spiderweb Galaxy (XID 58) will be discussed in much greater detail in a companion paper (Tozzi et. al. in preparation). The spectral model used in all the fits consists in a fixed modelization of the Galactic absorption with the Xspec model tbabs, with cm-2, an intrinsic power law with a free slope , an intrinsic absorption modeled with zwabs, and a Gaussian line component that is allowed to vary in a range keV, approximately centered on the energy 2.03 keV corresponding to the neutral iron Kα line at a rest frame energy of 6.4 keV.
For completeness, in Figure 24, we show the folded spectra of the six X-ray members of the Spiderweb protocluster that do not reach 40 in the soft and in the hard band. Spectra have been rebinned with a minimum of only ten counts per energy bin for display purposes. The spectral model used in the fits is significantly simpler than the previous one, and consists in a fixed modelization of the Galactic absorption with the Xspec model tbabs, with cm-2, an intrinsic power law with a slope frozen to , and an intrinsic absorption modeled with zwabs. We note that for sources XID 34 and XID 87, the spectral slope is left free instead of the intrinsic absorption, because the simple Compton-thin model is not able to provide acceptable fits. Best-fit parameters for all the sources are shown in Table 5.
Appendix C Notes on single sources
In this Appendix we briefly discuss specific features of all the X-ray-detected members of the Spiderweb protocluster, except the Spiderweb Galaxy (XID 58).
C.1 XID 7
This source has been identified as a candidate H emitter in Kurk et al. 2004b (ID=272), and a photometric redshift of (ID=493) has been measured by Tanaka et al. 2013. Kuiper et al. 2011 investigated the NIR spectrum with SINFONI (see their ID 12), and found a spectroscopic redshift of from the O[III] line, observed with a flux of erg/s/cm2/. In the X-ray, this source shows a Compton thin spectrum with the highest intrinsic absorption in the sample ( cm-2), and a luminosity in the QSO range ( erg/s). It is the X-ray source closest to the Spiderweb Galaxy.
C.2 XID 9
The optical counterpart of source XID 9 has been originally selected as a candidate Ly emitter. The optical spectrum is shown in Pentericci et al. 2002 (ID=1612), where the Ly line has been measured to have a flux of erg/s/cm2, with an and a km/s This source has been confirmed also with Keck spectroscopy by Croft et al. 2005 (ID=L675) and the Ly has been revised to have km/s with a flux of erg/s/cm2. The NV line is also detected with km/s for a flux of erg/s/cm2.
C.3 XID 12
The redshift of XID 12 (z=2.1628) has been obtained with Subaru in Shimakawa et al. 2014 (ID=71). The X-ray spectrum is consistent with negligible intrinsic absorption, while the total luminosity erg/s is the lowest among the X-ray protocluster member, but still in the Seyfert-like regime. This source has the largest offset from its optical counterpart, due to the extended nature of its emission as noted in the text. Possible association of the extended emission with radio jets will be investigated when the wide-field, high-resolution radio images are available.
C.4 XID 34
This source has been identified with APEX LABOCA in Dannerbauer et al. 2014 (ID=DKB12a) with a flux mJy for a . It also has a strong detection at 24 with Jy and significant detection in the range 160 - 500 Jy, but it only have an upper limit at 1.4 GHz with JVLA. There are four H emitters consistent with the LABOCA position, however DKB12a is the closest to the X-ray position. The H and FIR-SED derived SFR are 240 and 860 /yr, respectively, suggesting the presence of dust. The total FIR luminosity is . Eventually, a redshift of was measured with Subaru in Shimakawa et al. 2014 (ID 29). Shimakawa et al. 2018 identified a possible subgroup at the position of this source. The source was also detected in the CO line in the COALAS survey (Jin et al. 2021, see their Table 3), with an offset of 2 arcsec between the ATCA and X-ray centroids. The high FIR luminosity is consistent with the X-ray tentative classification as a Compton-thick AGN, due to an extremely flat (if not inverted) power-law spectrum. Despite the very low flux, the estimated intrinsic luminosity would be erg/s in our simplistic assumption that the observed (reflected) luminosity is % of the intrinsic emission.
C.5 XID 36
The optical counterpart of source XID 36 was originally selected as a Ly emitter with . The optical spectrum is shown in Pentericci et al. 2002, where the source was classified as a QSO (ID=1687). Its spectrum shows Ly, SiIV and CIV emission lines. The Ly line was measured to have a flux of erg/s/cm2, with an and a km/s. The Ly and CIV lines have a double-peaked profile due to absorption by neutral, metal-enriched gas. The presence of dust is suggested by the low Ly/CIV line ratio compared to normal values for QSOs (Osterbrock 1989, Ly/CIV from composite spectra of QSO BLRs).
The spectrum (ID=X3/L968d) obtained by Croft et al. 2005 found only moderate absorption blueward of Ly, and corrected the redshift from Pentericci et al. 2002 to . This AGN shows broad and narrow Ly, broad and narrow CIV 1549, and broad NV. The CIV emission was fitted with two Gaussian components, and the broad and narrow Ly and NV were fitted with three Gaussian components. For the Ly these latter authors found km/s and km/s for the broad and narrow component, respectively. For the CIV they found km/s and km/s for the broad and narrow component, respectively. The NV line has a measured km/s. The QSO nature of this source is confirmed by the high X-ray luminosity ( erg/s). The source shows a moderate absorption in the X-ray at the level of cm-2, but also shows hints of a strong Fe line with rest-frame EW keV, despite with large uncertainties.
C.6 XID 57
The redshift of XID 57 (z=2.1426) was obtained with Subaru in Shimakawa et al. 2014 (ID=14). The X-ray spectrum is typical of a Type I AGN with typical Seyfert luminosity erg/s.
C.7 XID 73
The source was identified with an ERO candidate in Kurk et al. 2004b with ID=463. It is the only X-ray-emitting protocluster member in our catalog that has not been spectroscopically confirmed. In the X-ray, it appears as an obscured Seyfert galaxy.
C.8 XID 74
This source is classified as a quiescent galaxy despite it being detected in H probably due to the presence of the AGN that nevertheless does not contribute significantly to the overall SED. This source is investigated in detail in Doherty et al. 2010 where they measure it to have (ID 456) and to be consistent with being formed in an intense burst of star formation, with a derived age of Gyr. The low current star formation rate /yr derived from the SED fit confirms that the galaxy is now in a quiescent phase. The X-ray spectrum is consistent with a Type I or moderately obscured Seyfert galaxy. Also, the neutral Fe emission line is detected with keV, despite with significant uncertainties.
C.9 XID 75
This source was selected as an H emitter candidate in Kurk et al. 2004b and eventually spectroscopically confirmed (Kurk et al. 2004a) (ID=215). Its spectrum shows continuum emission plus a very broad line which almost covers the full spectral range, and it is identified with H. For this AGN the N[II] line is blended with the very broad H line and impossible to discern. The measured FWHM of the line is km/s for a flux of erg/s/cm2 and an . The H emission is therefore not considered to be associated to star formation rate. The X-ray spectrum is typical of an unobscured QSO, with erg/s, consistent with the presence of the broad optical line.
C.10 XID 80
Source XID 80 has been identified with source ID 16 in Pentericci et al. 2002 as a candidate Ly emitter encompassed by a very strong and extended Ly emission, and therefore classified as an AGN. Eventually its spectrum was obtained by Croft et al. 2005 at (ID X16/L778d). The spectrum shows a broad Ly (rest-frame deconvolved FWHM 890 km/s), and several emission lines such as NV (1240), CIV (1549), HeII (1640), CIII] (1909),[CII] (2326), and MgII (2798), all with ranging from 1200 to 2000 km/s (Croft et al. 2005, see Table 2 of).
This source was also identified with APEX LABOCA at 870 with mJy for a in Dannerbauer et al. 2014 (ID=DKB16). Despite the faint signal, this source is clearly detected in IR and radio bands (from Jy to Jy with the VLA (see their Table 2). The estimated SFR is /yr and /yr from the H and FIR SED, respectively, and the total FIR luminosity is measured to be . The X-ray spectrum shows that this source is an obscured Type II QSO with with an unobscured luminosity erg/s.
Finally, this source has the second-largest offset from its optical counterpart due to a possible extended nature of the emission as noted in the text. Possible association of the extended emission with radio jets will be investigated when the wide-field, high-resolution radio images are available.
C.11 XID 86
Source XID 86 is identified in Pentericci et al. 2002 (Source ID=5) with a faint extended ERO with () consistent with having a redshift close to the Spiderweb Galaxy. Eventually, the source was spectroscopically confirmed by Croft et al. 2005 at (ID 5Xd). Faint but significant Ly emission (rest-frame deconvolved km/s) has been detected. It was not possible to classify this source as a starburst or an AGN, but the X-ray luminosity provides strong evidence for the presence of an AGN, as already noted in the literature (Pentericci et al. 2002; Croft et al. 2005). In the X-ray, this source 86 shows a flat spectrum (), with hardness ratio . We consider it a candidate Compton-thick source, with the X-ray spectrum dominated by a reflection component, and an estimated intrinsic luminosity erg/s. The detection of the neutral Fe emission line with keV strengthen the Compton-thick hypothesis.
C.12 XID 87
Source XID 87 was selected as an ERO candidate in Kurk et al. 2004b with ID=284 and identified as an H emitter in Shimakawa et al. 2018 (ID=48). The redshift was measured thanks to a ALMA CO(3–2) observation presented in Tadaki et al. 2019. The CO(3-2) line has a redshift of 2.157 with a km/s. This source was also detected in the CO(1-0) line in the COALAS survey (Jin et al. 2021, see their Table 3). The X-ray spectrum shows the steepest slope in the sample, and is typical of a Type I AGN, with erg/s.
C.13 XID 90
This source was originally selected as an H emitter candidate in Kurk et al. 2004b with ID=154. It was also detected in the CO line in the COALAS survey (Jin et al. 2021, see their Table 3). We note that the X-ray centroid is closer to a nearby source that nevertheless has similar color and preliminary photo-z consistent with being in the protocluster. This is the only X-ray source in our sample that has two possible counterparts, both consistent with being in the protocluster, but with only one spectroscopically confirmed. The X-ray spectrum is typical of Type II AGN, with a Seyfert-like unabsorbed luminosity of erg/s.
Appendix D - relation
In Figure 25 we show the plane for all the protocluster members with spectroscopic redshift. We plot 11 sources with X-ray emission, excluding the spiderweb and excluding also the two Compton-thick candidates, whose intrinsic luminosity cannot be estimated accurately. In addition, we also show the average X-ray luminosity per source that we obtain by stacking the sources without X-ray detection in four stellar mass bins. The mass bins have been chosen in order to have a similar number of sources () in each of them, except for the first bin () where we include all the sources without a -band counterpart. Before stacking the X-ray images at the source position, we removed the sources closer than 12 arcsec to the Spiderweb Galaxy in order to avoid spurious signal due to the irregular diffuse emission. We have 38 sources in the first bin, then 13 sources in the bin, and 11 and 12 sources in the and bin, respectively. Despite in all the cases we formally have a positive photometry, most of them are very close to zero, and, in all the cases, consistent with zero whitin 1 or 1.5 . Therefore, we must consider the blue points and the corresponding error bars as upper limits. The error bars on are for the X-ray detected sources, while corresponds to the bin width for the stacked points.
Apart from a very scattered, global trend of having higher intrinsic at higher , we note that the sources not detected in X-ray do not have luminosity close to our detection limit, but at least an order of magnitude lower, implying that they are not hosting AGN comparable to those hosted by the X-ray detected protocluster members. In the right panel of Figure 25 we also plot, as a reference, the average - relation obtained in the field at in Mullaney et al. 2012a for the rest-frame 2-10 keV band. Apart from the expected scatter at high masses (Mullaney et al. 2012b, see), which is entirely expected because the relation holds for average values of the X-ray luminosity, we notice that the stacked values of the protocluster galaxies without X-ray detection appear to be lower than the relation measured in the field. This comparison is preliminary, because only star forming galaxies should be included. However, this is a hint that, at low mass, the accretion onto the SMBH may have been suppressed among the protocluster members, while it is enhanced at high masses. In other words, the average – relation may be significantly steeper within the protocluster. This issue will be explored in Pannella et al. (in preparation).