Investigation of metamagnetism and crystal-field splitting in pseudo-hexagonal CeRh3Si2
Abstract
CeRh3Si2 has been reported to exhibit metamagnetic transitions below 5 K, a giant crystal field splitting, and anisotropic magnetic properties from single crystal magnetization and heat capacity measurements. Here we report results of neutron and x-ray scattering studies of the magnetic structure and crystal-field excitations to further understand the magnetism of this compound. Inelastic neutron scattering (INS) and resonant inelastic x-ray scattering (RIXS) reveal a = 1/2 groundstate for Ce when considering the crystallographic direction as quantization axis, thus explaining the anisotropy of the static susceptibility. Furthermore, we find a total splitting of 78 meV for the = 5/2 multiplet. The neutron diffraction study in zero field reveals that on cooling from the paramagnetic state, the system first orders at K in a longitudinal spin density wave with ordered Ce moments along the -axis (i.e. the [0 1 0] crystal direction) and an incommensurate propagation vector ). Below the lower-temperature transition K, the propagation vector locks to the commensurate value , with a so-called lock-in transition. Our neutron diffraction study in applied magnetic field -axis shows a change in the commensurate propagation vector and development of a ferromagnetic component at kOe, followed by a series of transitions before the fully field-induced ferromagnetic phase is reached at kOe. This explains the nature of the steps previously reported in field-dependent magnetization measurements. A very similar behaviour is also observed for the [0 1 1] crystal direction.
I Introduction
In cerium-based intermetallic compounds, the interplay between crystal-field effects, hybridization, magnetic ordering and Kondo screening is responsible for many electronic and magnetic properties that continute to challenge our understanding. In particular, compounds of the CeT3X2 family (T = Rh, Ir; X = B, Si) have short Ce-Ce distances and extremely large crystal-field splittings (which gained them the name giant crystal-field compounds), which are accompanied by some very unusual magnetic behaviors. The best known compound in that series is CeRh3B2, which crystallizes in an hexagonal () structure characterized by chains of Ce ions along the hexagonal -axis, with extremely short intra-chain distances of 3.09 Å Lawson et al. 1987. It orders ferromagnetically (with the cerium moments lying in the hexagonal plane) below K, a record-high Curie temperature among cerium intermetallics, but the saturation magnetic moment of /formula unit is strongly reduced compared to what would be expected for a Ce3+ ion in a hexagonal crystal field Dhar et al. 1981; Allen et al. 1990; Vijayaraghavan 1985. Tentative explanations of such properties have focused on unusually strong hybridization of Ce 4 electrons with the neighboring Rh or Ce states Allen et al. 1990, and/or unusually large crystal-field effect that mixes the and multiplets Galatanu et al. 2003.

The isoelectronic compound CeIr3B2, hexagonal at 473 K, adopts a slightly distorted monoclinic structure at room temperature Kubota et al. 2013, and is in the valence fluctuating regime, where strong hybridization causes loss of the localized moments Yang et al. 1984.
CeRh3Si2 and CeIr3Si2, on the other hand, crystallize in an orthorhombic () structure, which is also a slightly distorted version of that of the hexagonal CeRh3B2, if their crystallographic direction is taken as the (pseudo-) hexagonal quantization axis (see Fig. 1). Both compounds order antiferromagnetically at low K, and both show complex behavior that indicates a rearrangement of the moments below at zero applied magnetic field and a cascade of metamagnetic transitions in applied field.
Given the variety of properties arising from similar crystal structures, the CeT3X2 family is a valuable testing ground to study the interplay between unusually large crystal-field effects, hybridization, and magnetic interactions. In particular, it is important to understand (i) the origin of the giant crystal field and its effects on the resulting local Ce states, (ii) the relevant states and mechanisms responsible for the hybridization, and (iii) ultimately the interactions determining the different magnetic structures.
The first step in that direction is the characterization of the electronic states and magnetically ordered phases of Ce. Motivated by this goal, we present microscopic measurements of the crystal-field transitions and magnetic structures in CeRh3Si2. Its crystal structure and macroscopic magnetic properties were determined by Pikul et al. Pikul et al. 2010. It crystallizes in the orthorhombic ErRh3Si2-type structure with lattice constants Å, Å, and Å at 293 K. According to Cenzual et al. Cenzual et al. 1988, the structure can be treated as a deformed hexagonal structure with lattice constants and defined by the relations: , , and . Figure 1 shows that the Ce ions in CeRh3Si2 are surrounded by a distorted hexagonal environment with the hexagonal axis perpendicular to the plane, and with zigzag chains of Ce atoms along the orthorhombic axis. The interchain Ce–Ce distances (3.58 Å) are fairly short among the intermetallic Ce compounds Miyahara et al. 2018. The magnetic properties of the system are strongly anisotropic, with moments confined in the orthorhombic plane with a small in-plane anisotropy that favors as the easy axis Pikul et al. 2010. The electrons are localized, and the effective magnetic moment at high is close to that calculated for a free Ce3+ ion. Analysis of the experimental magnetic susceptibility curves in terms of a crystal-field model suggests splittings as large as 60 meV for the groundstate multiplet, and 240 meV for the higher multiplet.
In zero field, CeRh3Si2 orders antiferromagnetically at K with a subsequent first-order phase transition at K, which was ascribed to a rearrangement of the antiferromagnetic structure Pikul et al. 2010. In the presence of applied magnetic field, these transitions split and evolve independently with temperature Kaczorowski and Komatsubara 2008, and in addition a broad ferromagnetic-like hump appears in the susceptibility plots below K. The complex magnetic behavior manifests itself in the isothermal magnetization curves at with field in the plane as a sequence of distinct steps, which suggests the presence of a cascade of metamagnetic transitions, with a saturation moment of 1.16 per Ce ion Pikul et al. 2010.
To fully understand the nature of the magnetic ground state and obtain direct information on the magnetic structure and crystal-field energy levels in CeRh3Si2 we performed neutron and x-ray scattering experiments. Neutron diffraction gives insight into the size and direction of the ordered magnetic moment as a function of temperature and magnetic field, and the combination of inelastic neutron scattering (INS) and high-resolution resonant inelastic X-ray scattering (RIXS) provides a complete picture of the crystal-field split multiplet scheme of the Ce3+ configuration Burlet et al. 1994; Anand et al. 2018a; Princep et al. 2013; Amorese et al. 2016; Amorese et al. 2018a; Amorese et al. 2018b; Amorese et al. 2019a. The results obtained from the present study will allow direct comparison with the existing data on CeRh3B2 (Ref. Givord et al. 2007a) and CeIr3Si2 (Refs. Shigetoh et al. 2007; Muro et al. 2007).
II Experiment
II.1 Sample Preparation
The polycrystalline samples of CeRh3Si2 and LaRh3Si2 used for inelastic neutron scattering and neutron powder diffraction studies were prepared by conventional arc melting of stoichiometric amounts of the constituents Ce (3N purity, Ames Laboratory), Rh ingot (3N purity, Chempur), and Si chips (6N purity, Chempur). A single crystal of CeRh3Si2 was grown by the Czochralski pulling method employing a tetra-arc furnace under protective ultrapure argon atmosphere for RIXS and single crystal neutron diffraction. The starting polycrystalline melt was prepared as mentioned above. The pulling rate was 10 mm/h and the copper heart’s rotation speed was 3 rpm. The final ingot of CeRh3Si2 was about 4 mm in diameter and 40 mm in length. The single crystal as well as the polycrystalline samples were wrapped in Ta foil, sealed in an evacuated silica tube, and annealed at 900∘C for 2 weeks. From this single-crystalline rod, a fragment of about 4 mm length, 3 mm width and 2 mm thickness was cut for neutron diffraction experiments. The quality of the product was verified by means of X-ray powder-diffraction measurements and single crystal Laue diffraction measurements.
II.2 Inelastic Neutron Scattering (INS)
Inelastic neutron scattering measurements on 6.5 g polycrystalline samples of CeRh3Si2 and LaRh3Si2 were performed on the high flux time-of-flight (TOF) spectrometer MERLIN Bewley et al. 2006 at the ISIS Facility, UK. The samples were placed in an annular geometry thin-wall Al-can with outer diameter 40 mm and height 40 mm. A closed-cycle refrigerator (CCR) with helium exchange gas was used to cool the samples down to 5 K. A sloppy chopper was used to select the incident neutron energies of meV with 350 Hz frequency, and 600 meV with 600 Hz frequency. The elastic resolution (FWHM) for meV is meV (and meV at meV energy transfer) and for meV is meV (and meV at meV). We measured a standard vanadium sample under identical conditions to normalize the samples data in absolute units of mb/sr/meV/f.u.
II.3 Resonant Inelastic X-ray Scattering (RIXS)
The RIXS experiment was performed at the state-of-the-art soft X-ray beamline ID32 at the European Synchrotron Radiation Facility (ESRF) in Grenoble, France Brookes et al. 2018. The experiment was performed at the Ce edge detecting the process, with resonant energy around 882 eV Amorese et al. 2016. The combined beamline resolution during the experiment varied between 30 meV and 37 meV and was monitored before and after each acquisition by measuring the (non-resonant) elastic signal from conductive carbon adhesive tape placed close to the sample. The carbon tape elastic signal was also used to determine the zero energy loss position for each spectrum, with an accuracy of meV. The spectra were acquired in the single photon centroiding mode and treated with the RIXSToolBox Kummer et al. 2017; the energy step size was set to 6.2 meV, corresponding to splitting each 15 m-pixel of the Andor iKon-L CCD detector in 2.7 points, a value tuned to maximize the performance of the centroiding algorithm Amorese et al. 2019b; Amorese et al. 2019c. The scattering geometry, the incident photon polarization, and the incident photon energies were varied for each acquisition to gain more information by exploiting the cross-section dependence of the different RIXS excitations. The incident photon energy was fixed at the central energy of the Ce M5 edge ( eV) for most acquisitions, and some spectra (see Appendix) were measured with 1 eV higher photon energies, halfway down the high energy tail. A total of 22 RIXS spectra were acquired with various experimental settings on three samples. The samples were post-cleaved in the cleaving chamber ( mbar) shortly before being transferred to the main measuring chamber with a base pressure of mbar. 18 spectra were acquired at the sample temperature of 20 K, and 4 more at 300 K, to search for temperature dependencies of the features and to search for excitations from thermally populated low-lying excited states. The full set of acquired spectra is shown in the Supplemental Material SuppMat.
II.4 Neutron Diffraction (ND)
Neutron powder diffraction measurements in zero field and neutron single crystal diffraction measurements in applied magnetic field on CeRh3Si2 were carried out using the time-of-flight (TOF) neutron diffractometer WISH Chapon et al. 2011 at the ISIS Facility, UK. In order to reduce the absorption from Rh, an annular vanadium can of 8 mm outer diameter was used. 6.5 g of powder sample was placed in the annular can with thickness of 1 mm. The sample was cooled to a base temperature of 1.5 K using a so-called orange cryostat under helium exchange gas to thermalize the sample. Data were collected at several temperatures between 1.5 and 6 K. Rietveld refinements of the crystal and magnetic structures were performed with the Fullprof program Carvajal 1993 on the data measured in detector banks at average values of , , and , each covering of the scattering plane.
For single crystal neutron diffraction measurements on the WISH diffractometer in applied magnetic field, the CeRh3Si2 crystal (with dimension of 4 mm 3 mm 2 mm and a mass of 90 mg) was mounted on an aluminium holder with the -axis vertical and the field was applied parallel to the -axis. The single crystal data at 1.5 K were collected with 5 orientations of the -axis of the crystal with respect to the incident beam and then projected in the reciprocal plane to identify the magnetic Bragg peaks. We collected data with applied magnetic fields of 0, 3, 4, 6 and 7 kOe. Further, we performed field-dependent neutron diffraction measurements with magnetic fields applied parallel to the [0 1 1] crystal direction (i.e. field in the -plane) using the thermal neutron single crystal instrument ZEBRA at SINQ, PSI, Switzerland. The experiment was performed with neutron wavelength 2.3 Å in the normal beam geometry. We also performed neutron powder diffraction measurements between 2 and 300 K with wavelength 2.41 Å on the D20 diffractometer at Institut Laue–Langevin, Grenoble, to investigate the temperature dependence of the lattice parameters of CeRh3Si2 (Appendix C).
II.5 Crystal-field model used for the analysis
The spin–orbit interaction splits the 14-fold degenerate energy levels of Ce3+ configuration into the sixfold degenerate Hund’s rule ground state and the eight-fold degenerate multiplet at about 280 meV above the ground state. The crystal field lifts the remaining degeneracies further by splitting the ground state multiplet into three and the excited multiplet into four Kramers doublets. Since the crystal-field potential must reflect the point symmetry of the Ce ion site, it is convenient to express the crystal-field Hamiltonian as a sum of tensor operators which transform in the same way as the (renormalized) spherical harmonics, , with parameters , that are coefficients of and have the same normalization as that used by Wybourne in Ref. Wybourne and Meggers 1965 (see also Refs. Rotter; Boothroyd 2020 for more information about the conversion between different crystal field conventions). For the orthorhombic C2v point symmetry of Ce in CeRh3Si2, nine parameters (, , , , , , , and ) have to be determined experimentally, and the resulting crystal-field wave functions are given by linear combinations of the components that fulfill = 2 and = 4.
The crystal field analysis can be simplified considerably when treating the structure as pseudo-hexagonal, as described above (see Fig. 1). Treating the CeRh3Si2 as an hexagonal system implies that the axis, with its pseudo-sixfold rotational symmetry, is used as the quantization axis. We, therefore, express the new coordinate system as (where the minus can be neglected thanks to the mirror symmetry about the hexagonal plane) in order to avoid confusion with the usual reference system that uses the axis as quantization axis (e.g. Ref. Pikul et al. 2010). The hexagonal crystal field only mixes basis functions that fulfill , so that the eigenfunctions are the pure states , , for the lowest multiplet, and , , and for the excited multiplet. The active crystal-field parameters are reduced to , , , and . The parameter determines the parameter of the mixed states and is known to have a minor effect on the splitting scheme and on the measurable properties so that it can often be neglected. This further reduces the number of crystal-field parameters to 3. We used inelastic neutron scattering (INS) and resonant inelastic x-ray scattering (RIXS) to determine the parameters experimentally.
III Results
III.1 Crystal-Field Scheme
Figure 2 shows the INS data of CeRh3Si2 and of the non-magnetic reference sample LaRh3Si2, taken just above the magnetic ordering transition. The spectrum of CeRh3Si3 at small momentum transfers, Fig. 2(a), exhibits one sharp excitation at 57.5 meV, which is not visible in the La data nor at large momentum transfer, Fig. 2(b), and must therefore be attributed to a crystal-field excitation. The narrow line width ( meV) is resolution-limited and in agreement with the localized character of the electrons in CeRh3Si2. Fig. 2(c) shows the temperature dependence of that crystal-field excitation: its intensity decreases, the excitation broadens, and its energy moves towards 55.5 meV as the temperature is increased up to 300 K. These changes are reversed when cooling the sample back down to 6 K. Figure 2(d) shows the data in Fig. 2(a) after subtracting the phonon and background scattering, both estimated from the non-magnetic reference compound LaRh3Si2. There is tentative evidence for a magnetic peak near 78 meV (see inset to Fig. 2(d)), and also for a magnetic signal between 250 and 450 meV where transitions between the and multiplets are expected (see Appendix D). These weak signals in the INS data have insufficient strength to be interpreted conclusively. This is due to limitations of the INS cross-section, as discussed below and in Appendix D.
RIXS, which has recently proved its ability to overcome the cross-section limitations of INS Amorese et al. 2018b can measure the crystal-field splitting scheme of both the and the multiplets of Ce3+ multiplets Amorese et al. 2018a; Amorese et al. 2018b, provided the splittings are comparable or larger than the experimental resolution that currently amounts to about 30 meV at state-of-the-art beamlines. A selection of three RIXS spectra acquired at sample temperature of 20 K with various scattering geometries and photon polarizations are shown in Fig. 3 (a)–(c) (black dots). Excitations from the ground state at zero energy transfer into both multiplets are clearly visible: at first glance one peak at about 60 meV, and more than one excitation around 300 meV. Fig. 3 (d) shows a spectrum acquired in the same geometry as that in (c), but at the higher temperature of 300 K.
The hexagonal crystal-field potential splits the multiplet into three doublets, one of which will be the ground state, and the multiplet, centered at about 300 meV, into four doublets, hence we expect to see two excitations from the ground state into the low energy multiplet, and four into the higher multiplet. After fitting Voigt profiles to the 18 RIXS spectra measured at 20 K, we found that the transition energies cluster at 59 meV, 78 meV, 265 meV, 308 meV and 353 meV (see Appendix A and Fig. 8 for details). We could not find the sixth transition, which must either be buried under another close-lying excitation or it must have a next-to-zero cross-section. Comparing the spectrum at 300 K with the corresponding one at 20 K [Fig. 3 (c) and (d)] only minor differences are visible in the positive energy loss side, while an anti-Stokes peak appears at about 59 meV negative energy loss. This confirms that the state at 59 meV is the first excited crystal-field state because, if present, the lower lying states would have been significantly populated at 300 K, thus, leading to additional excitations from the excited states. In RIXS we cannot study the temperature dependence of the excitation energies observed in our INS data due to the experimental accuracy of about meV on the determination of the peak positions.
Having determined the crystal-field transition energies, we now describe the RIXS spectra with a full multiplet RIXS calculation using the Quanty code Haverkort et al. 2012, including the hexagonal crystal-field approximation. Details about the calculations (reduction factors, optimization of the crystal-field parameters, etc.) can be found in Appendix B. The following crystal-field parameters best describe the majority of the RIXS spectra: meV, meV, meV and meV, with a spin-obit constant meV, obtained by reducing the Hartree-Fock atomic parameter to 88% of its value. The resulting crystal-field energy levels and wave functions are listed in Table 1. The ground state is a virtually pure , followed by the almost pure states and . The mixing between the two and multiplets was found to be very small. For example, the squared amplitudes of the components in the first three crystal-field wave functions amount to 0.0018 for the ground state, 0.02 for the first excited state and 0.00015 for the second excited state, respectively (see Table IV in Appendix B). We recall that the notation indicates that the pseudo-hexagonal axis is the quantization axis used to express the crystal field, while previous literature as Ref. Pikul et al. 2010 expressed the crystal field scheme along (see Fig. 1 and Supplemental Material SuppMat for further details). The vertical lines in Figs. 3 (a)–(c) represent the peak position and intensities obtained from the crystal-field fits, and the red lines show the calculated crystal-field excitation spectra convoluted with the Voigt lineshape. The expected excitation at 345 meV corresponds to the transition i.e. it is forbidden by the RIXS selection rules and therefore not observable. The elastic intensity (i.e. the difference between the full red line and the dashed red line), being affected by other parameters not included in the calculation (such as the surface roughness), was tuned to best fit the data. The effect of the surface roughness can be clearly seen as an increase in the elastic intensity in the spectrum in Fig. 3 (a), which was acquired on a cleaved surface different from that of the spectra in the other panels. The same crystal-field model used to fit the spectra at 20 K also describes very well the data at 300 K, including the anti-Stokes intensity, further confirming the validity of our analysis, see Fig. 3 (d).
The proposed crystal-field scheme (Table 1) also agrees well with the INS data. The red line in Fig. 2(d) shows the calculated INS cross-section including both dipole and quadrupole contributions Rotter 2004; SPE, using the same crystal-field scheme obtained by the RIXS analysis. The calculation reproduces the shape of the spectrum, with only one clearly visible peak at 58 meV, but the calculated intensity had to be scaled down by a factor of 2.5 to be comparable with the measured spectrum. This discrepancy in the intensity is due to sample attenuation effects, caused mainly by the relatively large neutron absorption by Rh.
The state at 78 meV has a negligible neutron cross-section at low- because it corresponds to a transition for the assumed hexagonal point symmetry, and such a transition is dipole-forbidden Zaliznyak and Lee 2005. Therefore, the small but non-zero signal at energies around 78 meV in the low- INS spectrum [see Fig. 2(d)] must be either due to the imperfect subtraction of the non-magnetic (phonon) background, or because the true point-symmetry is orthorhombic, and therefore some mixing of the states could connect this excitation to the ground state via the dipole interaction. At the same time, the low intensity at 78 meV confirms the validity of the hexagonal approximation for the crystal-field analysis, meaning that the orthorhombic mixing, if present, is small. To further compare with the RIXS crystal-field scheme, we show INS data at larger momentum transfer [see the inset to Fig. 2(d)], at which quadrupole transitions are expected to gain intensity in INS. The 78 meV transition appears in the beyond-dipole INS simulations (red line in the inset), while it is just barely detectable in the experimental data due to the relatively large noise and background (see Appendix D for more details).
| Energy (meV) | |
|---|---|
| 0 | |
| 59 | |
| 78 | |
| 265 | |
| 308 | |
| (345) | |
| 353 |
III.2 Magnetic Structure
The powder neutron diffraction patterns collected above K can be satisfactorily fitted in the orthorhombic structural model proposed by Cenzual, Chabot and Parthe for ErRh3Si2 Cenzual et al. 1988. Below , a set of additional diffraction peaks appears, indicating the onset of a long-range magnetic ordering in agreement with the magnetization and specific heat data Pikul et al. 2010. The magnetic peaks can be indexed using an incommensurate propagation vector with at K. A quantitative magnetic structure refinement revealed that the Ce moments are aligned along the -axis forming amplitude modulated longitudinal spin density waves with ferromagnetic coupling along the - and -directions (Fig. 4(b)). The structure is associated with the two-dimensional irreducible representation of the paramagnetic space group, where and are components of the order parameter in the representation space. In the present case, the order parameter is the long-range ordering of magnetic moments localized on the Ce sites and described by a Fourier series as specified below. The symmetry of the magnetic structure is described by the superspace group with the basis vectors and origin related to the paramagnetic structure as , , , and , respectively. Below the second magnetic transition at K, the propagation vector locks to the commensurate value (Fig. 4(a)) giving rise to an equal-moment magnetic structure with up-up-down-down (UUDD) stacking of the ferromagnetic planes as shown in Fig. 4(c). The moment size refined at K is 1.23(3) . This value of the moment along the axis is in good agreement with the value calculated for a pure ground state (the expectation value of the magnetic moments along the axis in presence of a magnetic or exchange field that aligns the moments along is for a ground state doublet). This value is further reduced to about if the small intermultiplet mixing is taken into account. The magnetic space group corresponding to the magnetic structure found is 52.314 . This space group appears with the basis vectors and origin related to the paramagnetic structure as , , and , respectively, in the list of , generated by the ISODISTORT Campbell et al. 2006 and MAXSYM Perez-Mato et al. 2015 software. The low temperature transition from the incommensurate to commensurate magnetic order is a so-called lock-in transition associated with free-energy terms activated at specific values of propagation vectors. In particular, in the present case with the propagation vector along the -line of symmetry of the space group, the free-energy term, is allowed when the component takes the commensurate value 1/2. The invariance of this term can be verified using the matrix operators for the generating symmetry elements of the paramagnetic space group, listed in Table 2. This type of magnetic phase transitions has also been observed in some other Ce-based intermetallic compounds such as CeIrGe3 Anand et al. 2018b and CeRhGe3 Hillier et al. 2012.
| T | |||||
|---|---|---|---|---|---|
To explore the origin of the magnetization steps reported by Pikul et al. Pikul et al. 2010, we performed single-crystal neutron diffraction measurements in magnetic field applied along the -axis. The reciprocal plane demonstrating the field evolution of magnetic satellites is shown in Fig. 5 (top and middle). In agreement with the powder diffraction data, the zero-field magnetic structure is characterized by the propagation vector. The corresponding UUDD magnetic structure with the unit cell twice as big as the nuclear one (see the bottom of Fig. 5) can be presented as a Fourier series with special choice of the magnetic phases as shown in Table 3. The series specifies a magnetic moment, , localized on -th Ce ion in a unit cell with the lattice translation . This is the standard way to describe magnetic ordering in crystalline solids Izyumov et al. 1991 and it is a convenient way to discuss the field-induced magnetic structures. Application of the magnetic field = 3 kOe results in a change of the magnetic satellites (Fig. 5). The new satellites reveal the presence of two commensurate propagation vectors and . The corresponding magnetic ordering can be interpreted as a UUUDD structure whose Fourier decomposition involves these two propagation vectors along with the ferromagnetic component (see Table 3). Increasing the field up to = 4 kOe re-establishes the propagation vector but in addition the second harmonic , which violates the -centring lattice condition, is also observed. This experimental result reveals another unusual magnetic structure with UUUD stacking of the ferromagnetic layers (Fig. 5). Further increasing the field results in a reappearance of the magnetic satellites with the and propagation vectors and roughly the same intensity at kOe. The Fourier analysis indicates that these two components, combined with equal amplitudes and an additional ferromagnetic moment, constitute a UUUUD magnetic structure (Table 3) with the magnetic unit cell five times bigger than the nuclear one (Fig. 5). Finally, increasing the field up to kOe results in the disappearance of the magnetic satellites, and only a ferromagnetic contribution to the fundamental nuclear reflections satisfying the -centring condition is observed.
| Field (kOe) | Propagation vector | Ce1 | Ce2 |
|---|---|---|---|
| 0 | |||
| 3 | |||
| 4 | |||
| 6 | |||
| 7 | |||
The observed sequence of the field-induced transitions indicates progressive flipping of the ferromagnetic layers initially aligned antiparallel to the field direction. The number of layers with the moments polarized up becomes bigger, increasing the magnetization along the field direction and resulting in the magnetization steps Pikul et al. 2010. The presence of the four distinct field-induced phases with large magnetic unit cells points to the fact that exchange interactions stabilizing these exotic phases have a long-range nature, far beyond the nearest and next nearest neighbour interactions.
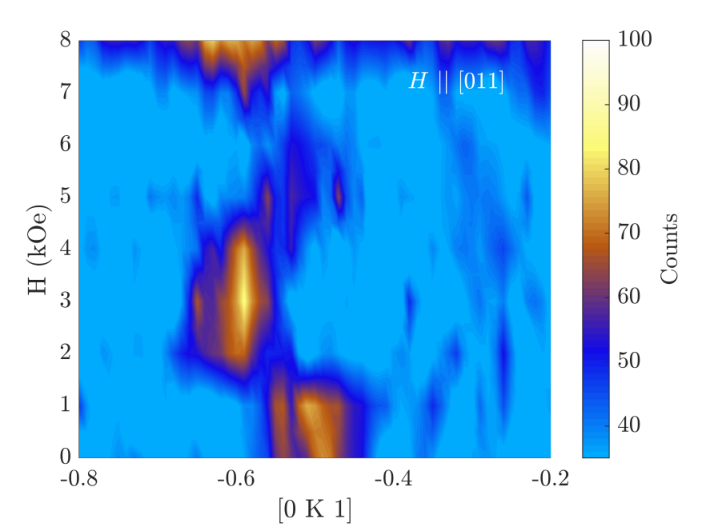
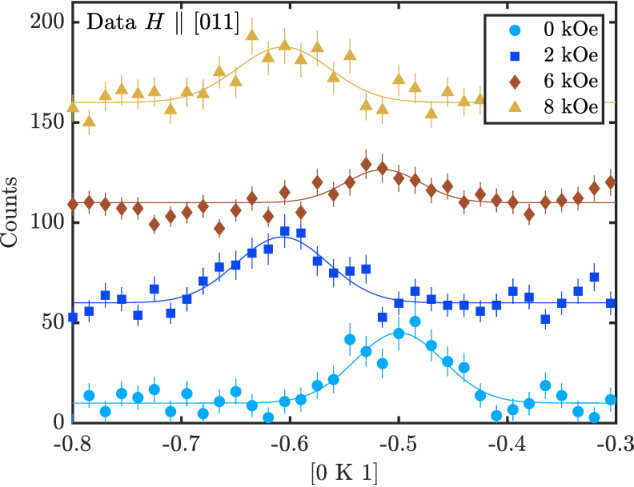
The same sequence of magnetic phases were also observed for the field applied along the direction (see Fig. 6), although the critical fields were slightly higher. The orthorhombic structure is a distorted version of the hexagonal lattice shown in Fig. 1(a) with the plane of the orthorhombic cell corresponding to the plane of the hexagonal one. The two studied field directions correspond to the and directions of the hexagonal lattice and it is not surprising that the response of the crystal is qualitatively similar in both cases.


IV Discussion
Our crystal-field analysis of the RIXS and INS spectra found rather large splitting of the low energy multiplet and a pure ground state with the pseudo-hexagonal axis as the quantization direction (see Supplemental Material SuppMat for the comparison of the two reference systems, in the present work, and in Ref. Pikul et al. 2010). Our INS spectra show a resolution-limited crystal-field excitation (Fig. 2) indicating the absence of hybridization of the states, in agreement with previous core-level photoemission data Pikul et al. 2010. The small temperature dependence of the crystal-field excitation at 58 meV that has been observed with INS is well explained with the thermal expansion of the lattice, as further discussed in Appendix C.
The deviation from the hexagonal approximation for the crystal field, which would allow some mixing in all crystal field levels, must be small. This can be inferred from (i) the quality of the fits shown in Fig. 3 and in the Supplemental Material SuppMat, (ii) the fact that the 78 meV excitation is barely visible in the INS spectra (Fig. 2), and (iii) the non-observability of the sixth transition in RIXS spectra (see Appendix A). Furthermore, the proposed crystal-field scheme is in very good agreement with the magnetic susceptibility data from Pikul et al. Pikul et al. 2010 (Fig. 7 (a)). It is interesting to note that the orthorhombic crystal-field scheme proposed in that study, once rotated onto the basis, corresponds to a 98.2% pure ground state, meaning that the same almost pure ground state was found independently and without making the hexagonal approximation.
The state is spatially elongated along the quantization axis as shown in Fig. 1(b) and, in the hexagonal approximation, is symmetric about that axis. Such a ground state explains the strong magnetocrystalline anisotropy that constraints the moments in the easy magnetization plane and is in good agreement with the value of the in-plane moment of 1.23 measured with neutron diffraction and 1.16 estimated from the bulk properties studies Pikul et al. 2010. The value calculated based on our crystal-field model is 1.26 . The good agreement of the measured and crystal-field only moment confirms the absence of Kondo screening and also the absence of frustration that potentially could play a role in a pseudo-hexagonal lattice.
It is worth noting that the same almost pure ground state is found along the pseudo-hexagonal quantization axis in CeIr3Si2, which has a similar structure and similar magnetic behavior Shigetoh et al. 2007; Muro et al. 2007 and in the strongly hybridized hexagonal ferromagnet CeRh3B2 Givord et al. 2007b; Givord et al. 2007c. The crystal-field scheme resulting from our spectroscopic analysis does not support strong effects due to multiplet intermixing in CeRh3Si2, contrary to the expectation from the crystal-field analysis of the static susceptibility Pikul et al. 2010.
Our neutron diffraction data revealed the appearance of an incommensurate (amplitude modulated) antiferromagnetic structure below , with moments aligned along the orthorhombic axis, followed by a so-called lock-in of the propagation vector to below , with a UUDD stacking of the ferromagnetic layers. Upon increasing the magnetic field at K, we observe a series of different magnetic structures, alternating between and with , with, for each structure, a progressive flip of the layers aligned antiparallel to the field direction. These different structures correspond each to a different step seen in the magnetization measurement, explaining the origin of the stair-like shape up to the highest field measured in our experiment. The ratio between the values of the magnetization calculated on the basis of the disproportion between moments pointing “up” and “down” for the different structures at each field value (0 at 0 kOe, 1/5 at 3 kOe, 2/4 at 4 kOe, 3/5 at 6 kOe and 1 at 7 kOe), perfectly agrees with the ratio between the steps in the magnetization reported in literaturePikul et al. 2010 (see Fig.7 (b)). The crystal structure was found to be rigid across all the transitions.
Various rare-earth based systems have been reported to show similar magnetic behavior, with incommensurate antiferromagnetism in the proximity of the Néel temperature, and/or metamagnetic transitions upon changing field strength Ball et al. 1993; Ball et al. 1994; Bud’ko et al. 1999; Shigeoka et al. 1992; Morosan et al. 2004; Goddard et al. 2007; Abliz et al. 2003; Gabáni et al. 2008; Rossat-Mignod et al. 1983; Gignoux and Schmitt 1991; Date 1990. These phenomena can originate from: strong magnetocrystalline anisotropy, competition between long-range ferromagnetic and antiferromagnetic interactions, energy crossing of crystal-field levels upon increasing fields, locking of the moments in intermediate easy directions, or frustration. Recently, the metamagnetic transitions in the famous metamagnetic compound CeSb have been linked to a reorganization of the electronic structure Kuroda et al. 2020.
Based on our data, we can make some considerations on the mechanisms ruling the magnetism in CeRh3Si2. The crystal-field ground state explains the strong magnetic anisotropy. The large crystal-field splitting, on the other hand, excludes crossing or depopulation of crystal-field states upon cooling or applying a magnetic field to be responsible for the metamagnetic transitions. The collinearity of the magnetism at all temperatures and fields further excludes the locking of the moments in several intermediate easy directions while rotating towards the field.
Having stacks of collinear ferromagnetic planes, and no in-plane propagation vector, one can reduce the problem to a one dimensional Ising chain (along the normal to the planes) with oscillating exchange interactions between nearest and next-nearest neighbor planes, and possibly extending even farther. If limited to the next-nearest neighbors, the model is reduced to the so-called axial next nearest-neighbor Ising model (ANNNI), which was shown able to generate, depending on the parameters, a series of commensurate and incommensurate phases, resulting in the so-called devil’s staircase shape of the magnetisation and in the incommensurate propagation vector near the paramagnetic transition Bak 1986; Bak and Bruinsma 1982; Bak 1982.
Interestingly, the ANNNI model yields, for a wide range of its parameters, an up-up-down-down ordered ground state at low temperature Bak 1986; Bak 1982; Kaplan 2009, i.e. the same magnetic structure found here for CeRh3Si2. Therefore, the metamagnetism is most likely related to oscillating long range exchange interactions, which in rare-earth based compounds can naturally be explained with the Ruderman–Kittel–Kasuya–Yosida interaction.
V Conclusion
We have investigated the electronic and magnetic structure of CeRh3Si2. Inelastic neutron scattering and resonant inelastic X-ray scattering allowed us to fully characterize the crystal-field scheme of the Ce3+ ions, and measured rather large crystal-field splittings of about 58 meV and 78 meV for the Hund’s rule ground state multiplet. The INS and RIXS spectra can be well reproduced by simulations using an hexagonal approximation for crystal-field potential (with quantization axis ). The details of the spectra have been explained on the basis of the cross-section and its selection rules. The resulting crystal-field scheme with a ground state explains the strong planar anisotropy previously reported in susceptibility measurement, and provides a good agreement with those data and with the measured value of the saturated moment of about along . The residual in-plane anisotropy must be due to the additional orthorhombicity of the system, not considered in our crystal-field analysis.
Neutron diffraction in zero field revealed an incommensurate antiferromagnetic structure below K, followed by a locking of the propagation vector below K, resulting in an up-up-down-down alternation of the moments, aligned along the axis. In applied field, we identified four different magnetic structures, each corresponding to a step in the field-dependent magnetization. The size of the moment measured is in agreement with the single-ion crystal-field ground state, further confirming the absence of hybridization and/or frustration.
VI Appendix
VI.1 Finding transition energies in RIXS spectra
In order to determine the crystal-field splittings from the RIXS data, the position of the peaks were determined from a Voigt fit using the fityk program for data fitting Wojdyr 2010. Each of the 18 spectra acquired at 20 K (the full set of spectra is shown in the Supplemental Material SuppMat) was fitted independently using 5 Voigt peaks for the crystal-field excitation, plus one Gaussian function located at 0 meV to account for the the elastic signal. The fit was constrained by assuming the same linewidth for all five peaks, with a Gaussian contribution given by the width of the elastic peak. Two peaks were restricted to energies lower than meV, representing the two excited levels, and the other 3 peaks were assigned in the 150–450 meV region, representing the 3 visible excitations in the multiplet.
Figure 8 shows the peak positions obtained from all these fits, and their relative heights normalized to the sum of the peak heights in each spectrum. The size of the circles is proportional to the absolute intensity of the peaks, to give more importance to the fits of spectra with better statistics. The five inelastic peaks are at about the same positions for all the fitted spectra, their intensity-weighted average positions being: 0 meV, 59 meV, 78 meV, 265 meV, 308 meV and 353 meV. The yellow dots in Fig. 8 refer to transitions into the multiplet and the blue ones to transitions into . We can observe that independently on the experimental configuration (geometry, polarization, incident photon energy) the first inelastic peak at 59 meV is stronger than the peak at 78 meV, while the last peak at 353 meV has always very low intensity. As discussed in Appendix B, the comparison between these observations and the peak ratios in the calculated RIXS spectra can ease the identification of the crystal field excitations associated to those peaks.
VI.2 Full multiplet calculation of RIXS process including crystal-field model
We performed full-multiplet calculations using the Quanty code by Maurits Haverkort Haverkort et al. 2012. In the calculations, the Slater integrals for the electron–electron interactions in the intermediate RIXS state, as well as the and spin-orbit parameters, were obtained from the Robert D. Cowan’s Atomic Structure Code Cowan 1981. To best reproduce the peak positions, the spin-orbit parameter was reduced to 88% of the value calculated for an isolated ion ( eV eV). The integrals for the intermediate RIXS state were scaled to 55% and the and integrals to 75% of their calculated value, having been tuned by fitting the isotropic XAS spectrum.

| Energy (meV) | |
|---|---|
| 0.9991 | 0 |
| 0.9899 | 59 |
| 0.9999 | 78 |
| 0.9991 | 265 |
| 0.9899 | 308 |
| 345 | |
| 0.9999 | 353 |
We searched in the phase space (, , , ) for sets of crystal-field parameters which correspond to the observed splittings. The parameters were varied in a fine grid of steps and the regions of the phase space compatible with the crystal-field splittings observed in our data are highlighted in Fig. 9. In particular, the , , and parameters were each varied in the region eV in steps of 0.01, 0.02, 0.03 and 0.05 eV, respectively. The brown spheres in Fig. 9 represent the solutions compatible with a ground state as determined by magnetic susceptibility studies, Pikul et al. 2010 (once rotated in the reference system used in this work, see Supplemental Material SuppMat for more details), and the measured splittings, allowing for a meV error on the position of the crystal-field levels, in order to be sure to take into account all the sets of parameters that yield similar splittings. This region can be further reduced by noticing that in the RIXS calculations the excitation always has higher intensity than the one, and that the excitation in the and states has in general a lower intensity relative to the other excitations in the spectrum. Combining this information with the relative peak intensities of Fig. 8, we can assign the 59 meV peak to the state, the 78 meV peak to the and 353 meV peak to one of the two mixed . The red spheres in Fig. 8 indicate the combination of crystal-field parameters complying with these further restrictions. Finally, the yellow spheres show the sets of crystal-field parameters that fit the spectra, obtained by further restricting the condition on the peak positions to a maximum error of meV. The parameter (not shown in Fig. 9) was found to have a minor effect on the calculated spectra. In particular, the most important effect of the parameter it to mix the and components in the two states with highest energy. The measured crystal field splittings agree with any value of in the [-0.05, +0.05] eV range, and from this we can estimate that the maximum allowed mixing is of the order of 25%.
With the crystal-field scheme found, the mixing between the two multiplets is found to be negligible (see Table 4).
VI.3 Temperature dependence of crystal-field excitation
In order to understand the origin of the temperature dependence of the crystal-field peak positions of CeRh3Si2, we have measured the temperature dependence of lattice parameters with neutron diffraction on the D20 diffractometer at the Institut Laue–Langevin (ILL), Grenoble, France. The results for the temperature dependence of the lattice parameters and unit cell volume are presented in Fig. 10. All lattice parameters decrease with decreasing temperature from 300 K. Below 20 K, the lattice parameter is nearly temperature-independent, while the parameter exhibits a small upturn. A smaller upturn was also observed in the lattice parameter below 10 K. The unit cell volume decreases with temperature from 300 K and becomes temperature-independent below 20 K. Considering there is no obvious anomaly observed in the lattice parameters and unit cell volume with temperature, the temperature dependence of the INS peak position could be associated with gradual changes in the lattice and the volume expansion with increasing temperature. In order to estimate the change in the crystal-field peak position, we have used point change model to calculate the crystal-field energy using the lattice parameters at 7 K and 300 K. We used the McPhase program for this calculation. Although the first excited crystal-field level estimated from the point-charge model is very high (412.64 meV at 7 K and 410.72 meV at 300 K), the difference between 7 K and 300 K is 1.92 meV, which is in good agreement with the experimental results.
VI.4 Details of Inelastic Neutron Scattering cross-section and calculations
In Fig. 11 we report the INS spectrum acquired with an incident neutron energy of meV, and a calculation of the spectrum from the crystal-field model presented in this work. The calculation includes all relevant multipoles in the neutron– scattering potential Boothroyd 2020, and the cross-section is averaged over the same range of as the data. The calculation predicts four excitations into the multiplet between 250 and 450 meV, which are only barely visible in our INS data due to low counting statistics, see Fig. 11(b). The detectability of this part of the spectrum is strongly suppressed by the magnetic form factor and by the broadening given by the resolution, which at these energies transfers is about 28 meV. However, our calculation shows that with larger samples and longer counting time, it is in principle possible to observe these to excitations by INS.
As discussed in the main text, the excitation near 78 meV is a quadrupolar transition, and, therefore, it is not expected to be visible in the experimental data at the low Q values ( Å-1) of the data in Fig. 2(d), or in the calculation of the dipole cross-section using the hexagonal CEF approximation, also shown in Fig. 2(d). For larger momentum transfers, quadrupole excitations gain intensity and the structure factor (or form factor) has a maximum at Å-1 for Ce3+. To compare with the RIXS results we have plotted the INS data at higher momentum transfers, averaged from to Å-1, and calculated the neutron scattering cross-section going beyond the dipole approximation (Fig. 2(d), inset). The calculation shows how these excitations with =2 are accessible at these values of , and some extra intensity is indeed detected in the experiment around 78 meV, although it is near the detection threshold due to the noise.
VI.5 Gaussian fits of neutron diffraction data
In Fig. 12 are shown the 1D cuts of the 2D neutron diffraction intensity map (Fig. 6 the main text) used to determine the magnetic propagation vectors.
VII Acknowledgements
We would like to thank Oliver Stockert for many instructive and useful discussions. DTA would like to thank the Royal Society of London for provision of a Newton Advanced Fellowship for exchange between the UK and China, and International exchange funding between the UK and Japan. We thank the ISIS Facility for beam time on MERLIN, proposal number RB2010784 Pikul et al. 2020, and WISH, proposal number RB2010798 Adroja et al. 2020; SINQ-PSI for beam time on ZEBRA, proposal ID 202100097; and EPSRC UK for the funding grant reference EP/W00562X/1. AA and AS acknowledge support from the German Research Foundation (DFG) - Project No. 387555779. O.P. was supported by the Foundation for Polish Science (FNP), program START 66.2020.
References
- Lawson et al. (1987) A. C. Lawson, A. Williams, and J. G. Huber, Structural properties of CeRh3B2, Journal of the Less Common Metals 136, 87 (1987).
- Dhar et al. (1981) S. K. Dhar, S. K. Malik, and R. Vijayaraghavan, Strong itinerant magnetism in ternary boride CeRh3B2, Journal of Physics C: Solid State Physics 14, L321 (1981).
- Allen et al. (1990) J. W. Allen, M. B. Maple, J.-S. Kang, K. N. Yang, M. S. Torikachvili, Y. Lassailly, W. P. Ellis, B. B. Pate, and I. Lindau, Density-of-states-driven transition from superconductivity to ferromagnetism in Ce(Ru1-xRhx)3B2: Scenario for an exchange-split Kondo resonance, Phys. Rev. B 41, 9013 (1990).
- Vijayaraghavan (1985) R. Vijayaraghavan, NMR in some mixed valent alloys, Journal of Magnetism and Magnetic Materials 52, 37 (1985).
- Galatanu et al. (2003) A. Galatanu, E. Yamamoto, T. Okubo, M. Yamada, A. Thamizhavel, T. Takeuchi, K. Sugiyama, Y. Inada, and Y. Onuki, On the unusual magnetic behaviour of CeRh3B2, Journal of Physics: Condensed Matter 15, S2187 (2003).
- Kubota et al. (2013) K. Kubota, E. Matsuoka, Y. Funasako, T. Mochida, T. Sakurai, H. Ohta, T. Onimaru, T. Takabatake, and H. Sugawara, Weak Ferromagnetism below 41 K and Structural Transition at 395 K in CeIr3B2 Single Crystal, J. Phys. Soc. Jpn. 82, 104715 (2013).
- Yang et al. (1984) K. N. Yang, M. S. Torikachvili, M. B. Maple, and H. C. Ku, Intermediate valence behavior of ternary cerium and uranium transition metal borides, Journal of Low Temperature Physics 56, 601 (1984).
- Pikul et al. (2010) A. P. Pikul, D. Kaczorowski, Z. Gajek, J. Stȩpień-Damm, A. Ślebarski, M. Werwiński, and A. Szajek, Giant crystal-electric-field effect and complex magnetic behavior in single-crystalline CeRh3Si2, Phys. Rev. B 81, 174408 (2010).
- Cenzual et al. (1988) K. Cenzual, B. Chabot, and E. Parthé, ErRh3Si2 and isotypes with an orthorhombic deformation superstructure of the CeCo3B2 type, Acta Crystallographica Section C 44, 221 (1988).
- Miyahara et al. (2018) J. Miyahara, N. Shirakawa, Y. Setoguchi, M. Tsubota, K. Kuroiwa, and J. Kitagawa, Hill plot focusing on Ce compounds with high magnetic ordering temperatures and consequent study of Ce2AuP3, J. Superconductivity and Novel Magnetism 31, 3559 (2018).
- Kaczorowski and Komatsubara (2008) D. Kaczorowski and T. Komatsubara, Complex magnetic behavior in single-crystalline CeRh3Si2, Physica B: Condensed Matter 403, 1362 (2008).
- Burlet et al. (1994) P. Burlet, L. P. Regnault, J. Rossat-Mignod, C. Vettier, and J. Flouquet, Neutron scattering and heavy fermion compounds, Journal of Magnetism and Magnetic Materials 129, 10 (1994).
- Anand et al. (2018a) V. K. Anand, A. D. Hillier, D. T. Adroja, D. D. Khalyavin, P. Manuel, G. Andre, S. Rols, and M. M. Koza, Understanding the magnetism in noncentrosymmetric CeIrGe3: Muon spin relaxation and neutron scattering studies, Phys. Rev. B 97, 184422 (2018a).
- Princep et al. (2013) A. J. Princep, D. Prabhakaran, A. T. Boothroyd, and D. T. Adroja, Crystal-field states of Pr3+ in the candidate quantum spin ice Pr2Sn2O7, Phys. Rev. B 88, 104421 (2013).
- Amorese et al. (2016) A. Amorese, G. Dellea, M. Fanciulli, S. Seiro, C. Geibel, C. Krellner, I. P. Makarova, L. Braicovich, G. Ghiringhelli, D. V. Vyalikh, N. B. Brookes, and K. Kummer, excitations in Ce Kondo lattices studied by resonant inelastic x-ray scattering, Phys. Rev. B 93, 165134 (2016).
- Amorese et al. (2018a) A. Amorese, N. Caroca-Canales, S. Seiro, C. Krellner, G. Ghiringhelli, N. B. Brookes, D. V. Vyalikh, C. Geibel, and K. Kummer, Crystal electric field in CeRh2Si2 studied with high-resolution resonant inelastic soft x-ray scattering, Phys. Rev. B 97, 245130 (2018a).
- Amorese et al. (2018b) A. Amorese, K. Kummer, N. B. Brookes, O. Stockert, D. T. Adroja, A. M. Strydom, A. Sidorenko, H. Winkler, D. A. Zocco, A. Prokofiev, S. Paschen, M. W. Haverkort, L. H. Tjeng, and A. Severing, Determining the local low-energy excitations in the Kondo semimetal CeRu4Sn6 using resonant inelastic x-ray scattering, Phys. Rev. B 98, 081116(R) (2018b).
- Amorese et al. (2019a) A. Amorese, O. Stockert, K. Kummer, N. B. Brookes, D.-J. Kim, Z. Fisk, M. W. Haverkort, P. Thalmeier, L. H. Tjeng, and A. Severing, Resonant inelastic x-ray scattering investigation of the crystal-field splitting of Sm3+ in SmB6, Phys. Rev. B 100, 241107(R) (2019a).
- Givord et al. (2007a) F. Givord, J.-X. Boucherle, A. P. Murani, R. Bewley, R.-M. Galéra, and P. Lejay, Crystal electric field excitations in the cerium compound CeRh3B2 studied by inelastic neutron scattering, Journal of Physics: Condensed Matter 19, 506210 (2007a).
- Shigetoh et al. (2007) K. Shigetoh, A. Ishida, Y. Ayabe, T. Onimaru, K. Umeo, Y. Muro, K. Motoya, M. Sera, and T. Takabatake, Easy-plane magnetocrystalline anisotropy in the multistep metamagnet CeIr3Si2, Phys. Rev. B 76, 184429 (2007).
- Muro et al. (2007) Y. Muro, Y. Ohno, T. Okada, and K. Motoya, Multi-step metamagnetism in CeIr3Si2, Journal of Magnetism and Magnetic Materials 310, 389 (2007).
- Bewley et al. (2006) R. I. Bewley, R. S. Eccleston, K. A. McEwen, S. M. Hayden, M. T. Dove, S. M. Bennington, J. R. Treadgold, and R. L. S. Coleman, MERLIN, a new high count rate spectrometer at ISIS, Physica B: Condensed Matter 385-386, 1029 (2006).
- Brookes et al. (2018) N. B. Brookes, F. Yakhou-Harris, K. Kummer, A. Fondacaro, J. C. Cezar, D. Betto, E. Velez-Fort, A. Amorese, G. Ghiringhelli, L. Braicovich, R. Barrett, G. Berruyer, F. Cianciosi, L. Eybert, P. Marion, P. van der Linden, and L. Zhang, The beamline ID32 at the ESRF for soft X-ray high energy resolution resonant inelastic X-ray scattering and polarisation dependent X-ray absorption spectroscopy, Nuclear Instruments and Methods in Physics Research Section A: Accelerators, Spectrometers, Detectors and Associated Equipment 903, 175 (2018).
- Kummer et al. (2017) K. Kummer, A. Tamborrino, A. Amorese, M. Minola, L. Braicovich, N. B. Brookes, and G. Ghiringhelli, RixsToolBox: software for the analysis of soft X-ray RIXS data acquired with 2D detectors, Journal of synchrotron radiation 24, 531 (2017).
- Amorese et al. (2019b) A. Amorese, C. Langini, G. Dellea, K. Kummer, N. B. Brookes, L. Braicovich, and G. Ghiringhelli, Enhanced spatial resolution of commercial soft X-ray CCD detectors by single-photon centroid reconstruction, Nuclear Instruments and Methods in Physics Research Section A: Accelerators, Spectrometers, Detectors and Associated Equipment 935, 222 (2019b).
- Amorese et al. (2019c) A. Amorese, C. Langini, G. Dellea, K. Kummer, N. B. Brookes, L. Braicovich, and G. Ghiringhelli, Enhanced spatial resolution of commercial soft X-ray CCD detectors by single-photon centroid reconstruction: Technical Note, Nuclear Instruments and Methods in Physics Research Section A: Accelerators, Spectrometers, Detectors and Associated Equipment 935, 227 (2019c).
- (27) See Supplemental Material at [URL to be inserted by publisher] for the full set of RIXS spectra acquired and the corresponding crystal field calculations, for more information on the crystal field scheme proposed in this work, and for comparison with the crystal field scheme and reference system used in previous works .
- Chapon et al. (2011) L. C. Chapon, P. Manuel, P. G. Radaelli, C. Benson, L. Perrott, S. Ansell, N. J. Rhodes, D. Raspino, D. Duxbury, E. Spill, and J. Norris, WISH: The new powder and single crystal magnetic diffractometer on the second target station, Neutron News 22, 22 (2011), https://doi.org/10.1080/10448632.2011.569650 .
- Carvajal (1993) J. R. Carvajal, Recent advances in magnetic structure determination by neutron powder diffraction, Physica B 192, 55 (1993).
- Wybourne and Meggers (1965) B. G. Wybourne and W. F. Meggers, Spectroscopic properties of rare earths, Physics Today 18, 70 (1965).
- (31) M. Rotter, McPhase User Manual.
- Boothroyd (2020) A. T. Boothroyd, Principles of Neutron Scattering from Condensed Matter (Oxford University Press, 2020).
- Haverkort et al. (2012) M. W. Haverkort, M. Zwierzycki, and O. K. Andersen, Multiplet ligand-field theory using Wannier orbitals, Phys. Rev. B 85, 165113 (2012).
- Rotter (2004) M. Rotter, Using McPhase to calculate magnetic phase diagrams of rare earth compounds, Journal of Magnetism and Magnetic Materials 272-276, E481 (2004), proceedings of the International Conference on Magnetism (ICM 2003).
- (35) A. T. Boothroyd, SPECTRE: a program for calculating spectroscopic properties of rare-earth ions in crystals (1990–2014). Available at https://xray.physics.ox.ac.uk/software.htm.
- Zaliznyak and Lee (2005) I. A. Zaliznyak and S.-H. Lee, Modern techniques for characterizing magnetic materials (Springer Science & Business Media, 2005) Chap. Chapter 1: Magnetic neutron scattering, pp. 1 – 85.
- Campbell et al. (2006) B. J. Campbell, H. T. Stokes, D. E. Tanner, and D. M. Hatch, ISODISPLACE: a web-based tool for exploring structural distortions, Journal of Applied Crystallography 39, 607 (2006).
- Perez-Mato et al. (2015) J. Perez-Mato, S. Gallego, E. Tasci, L. Elcoro, G. de la Flor, and M. Aroyo, Symmetry-based computational tools for magnetic crystallography, Annual Review of Materials Research 45, 217 (2015), Https://doi.org/10.1146/annurev-matsci-070214-021008 .
- Anand et al. (2018b) V. K. Anand, A. D. Hillier, D. T. Adroja, D. D. Khalyavin, P. Manuel, G. Andre, S. Rols, and M. M. Koza, Understanding the magnetism in noncentrosymmetric CeIrGe3: Muon spin relaxation and neutron scattering studies, Phys. Rev. B 97, 184422 (2018b).
- Hillier et al. (2012) A. D. Hillier, D. T. Adroja, P. Manuel, V. K. Anand, J. W. Taylor, K. A. McEwen, and M. M. Rainford, B. D. Koza, Muon spin relaxation and neutron scattering investigations of the noncentrosymmetric heavy-fermion antiferromagnet CeRhGe3, Phys. Rev. B 85, 134405 (2012).
- Aroyo et al. (2006) M. I. Aroyo, A. Kirov, C. Capillas, J. M. Perez-Mato, and H. Wondratschek, Bilbao Crystallographic Server. II. Representations of crystallographic point groups and space groups, Acta Cryst. A62, 115 (2006).
- Izyumov et al. (1991) Y. A. Izyumov, V. E. Naish, and R. P. Ozerov, Neutron diffraction of magnetic materials (New York: Consulting Bureau, 1991).
- Givord et al. (2007b) F. Givord, J.-X. Boucherle, R.-M. Galéra, G. Fillion, and P. Lejay, Ferromagnetism and crystal electric field in the cerium compound CeRh3B2, J. Phys.: Cond. Matter 19, 356208 (2007b).
- Givord et al. (2007c) F. Givord, J.-X. Boucherle, A. P. Murani, R. Bewley, R.-M. Galéra, and P. Lejay, Crystal electric field excitations in the cerium compound CeRh3B2 studied by inelastic neutron scattering, Journal of Physics: Condensed Matter 19, 506210 (2007c).
- Ball et al. (1993) A. R. Ball, D. Gignoux, A. P. Murani, and D. Schmitt, Crystal field and complex phase diagram in hexagonal PrGa2, Physica B: Condensed Matter 190, 214 (1993).
- Ball et al. (1994) A. R. Ball, D. Gignoux, J. Rodriguez Fernandez, and D. Schmitt, Magnetic properties and complex phase diagram of hexagonal NdGa2, Journal of Magnetism and Magnetic Materials 137, 281 (1994).
- Bud’ko et al. (1999) S. L. Bud’ko, Z. Islam, T. A. Wiener, I. R. Fisher, A. H. Lacerda, and P. C. Canfield, Anisotropy and metamagnetism in the RNi2Ge2 (R=Y, La–Nd, Sm–Lu) series, Journal of Magnetism and Magnetic Materials 205, 53 (1999).
- Shigeoka et al. (1992) T. Shigeoka, H. Fujii, M. Nishi, Y. Uwatoko, T. Takabatake, I. Oguro, K. Motoya, N. Iwata, and Y. Ito, Metamagnetism in TbNi2Si2 single crystal, Journal of the Physical Society of Japan 61, 4559 (1992).
- Morosan et al. (2004) E. Morosan, S. L. Bud’ko, P. C. Canfield, M. S. Torikachvili, and A. H. Lacerda, Thermodynamic and transport properties of RAgGe (R=Tb–Lu) single crystals, Journal of Magnetism and Magnetic Materials 277, 298 (2004).
- Goddard et al. (2007) P. A. Goddard, J. Singleton, A. L. Lima Sharma, E. Morosan, S. J. Blundell, S. L. Bud’ko, and P. C. Canfield, Separation of energy scales in the kagome antiferromagnet TmAgGe: A magnetic-field-orientation study up to 55T, Phys. Rev. B 75, 094426 (2007).
- Abliz et al. (2003) M. Abliz, K. Kindo, K. Kadowaki, and H. Takeya, High-field magnetization measurements and crystalline electric-field effect in HoNi2B2C, Journal of the Physical Society of Japan 72, 2599 (2003).
- Gabáni et al. (2008) S. Gabáni, S. Maťaš, P. Priputen, K. Flachbart, K. Siemensmeyer, E. Wulf, A. Evdokimova, and N. Shitsevalova, Magnetic structure and phase diagram of TmB4, Acta Physica Polonica A 113, 227 (2008).
- Rossat-Mignod et al. (1983) J. Rossat-Mignod, P. Burlet, S. Quezel, J. M. Effantin, D. Delacôte, H. Bartholin, O. Vogt, and D. Ravot, Magnetic properties of cerium monopnictides, Journal of Magnetism and Magnetic Materials 31-34, 398 (1983).
- Gignoux and Schmitt (1991) D. Gignoux and D. Schmitt, Rare earth intermetallics, Journal of Magnetism and Magnetic Materials 100, 99 (1991).
- Date (1990) M. Date, Field-induced magnetic phase transitions, Journal of Magnetism and Magnetic Materials 90-91, 1 (1990).
- Kuroda et al. (2020) K. Kuroda, Y. Arai, N. Rezaei, S. Kunisada, S. Sakuragi, M. Alaei, Y. Kinoshita, C. Bareille, R. Noguchi, M. Nakayama, S. Akebi, M. Sakano, K. Kawaguchi, M. Arita, S. Ideta, K. Tanaka, H. Kitazawa, K. Okazaki, M. Tokunaga, Y. Haga, S. Shin, H. S. Suzuki, R. Arita, and T. Kondo, Devil’s staircase transition of the electronic structures in CeSb, Nature Communications 11, 2888 (2020).
- Bak (1986) P. Bak, The devil's staircase, Physics Today 39, 38 (1986).
- Bak and Bruinsma (1982) P. Bak and R. Bruinsma, One-dimensional ising model and the complete devil’s staircase, Phys. Rev. Lett. 49, 249 (1982).
- Bak (1982) P. Bak, Commensurate phases, incommensurate phases and the devil's staircase, Reports on Progress in Physics 45, 587 (1982).
- Kaplan (2009) T. A. Kaplan, Frustrated classical Heisenberg model in one dimension with nearest-neighbor biquadratic exchange: Exact solution for the ground-state phase diagram, Phys. Rev. B 80, 012407 (2009).
- Pikul et al. (2020) A. Pikul, A. Amorese, A. Severing, D. T. Adroja, and D. Kaczorowski, Inelastic neutron scattering study to investigate giant crystal-electric-field and intermultiplet splitting in CeRh3Si2 (2020).
- Adroja et al. (2020) D. T. Adroja, D. Khalyavin, A. Pikul, and D. Kaczorowski, Investigation of Multiple Magnetic Structures of CeRh3Si2 using Neutron Diffraction Study (2020).
- Wojdyr (2010) M. Wojdyr, Fityk: a general-purpose peak fitting program, Journal of Applied Crystallography 43, 1126 (2010).
- Cowan (1981) R. Cowan, The Theory of Atomic Structure and Spectra. (University of California, Berkeley, 1981).
VIII Supplemental Material
VIII.1 Experimental RIXS spectra and crystal field calculation
We show here in Figs 13, 14, 15 and 16 the full set of experimental RIXS spectra of CeRh3Si2 acquired on ID32 at ESRF (black circles) The red dots indicate the transition intensities resulting from our crystal-field analysis presented in the main text, and the full red line is the calculated spectrum with the present experimental resolution The elastic intensity at 0 eV, not obtainable with simulations, was adjusted to fit the spectra.
VIII.2 Crystal field scheme in different reference systems and comparison with previous literature
Tables 5, 6, 7 and 8 contain energies, wave functions, and moments for all states as obtained from the crystal-field calculations based on the two different quantization axis ( and ), for the present set of crystal-field parameters obtained from fits to RIXS and INS data, and for the parameters obtained by Pikul et al. Pikul et al. 2010 from the fit of the static susceptibility From the tables it is evident that the two works find essentially the same crystal field ground state, which expressed in the reference system of this work (, , , see Tables 5 and 7) is an almost pure doublet It is to be noted that the choice of quantization axis does not change the energy eigenvalues (i.e the energy of crystal field levels), but it changes the eigenvectors, because the basis functions change.
| Energy | components | Moments | ||||||||||||||||
| meV | Kelvin | |||||||||||||||||
| 0 | 0 | 0 | 0 | 0.9991 | 0 | 0 | 0 | 0 | 0 | 0 | -0.0426 | 0 | 0 | 0 | 0 | -0.47 | -1.26 | -1.26 |
| 0 | 0 | 0 | 0 | 0 | 0.9991 | 0 | 0 | 0 | 0 | 0 | 0 | 0.0426 | 0 | 0 | 0 | 0.47 | 1.26 | 1.26 |
| 59.7 | 692 | 0 | 0.99899 | 0 | 0 | 0 | 0 | 0 | 0 | -0.1415 | 0 | 0 | 0 | 0 | 0 | -1.42 | 0 | 0 |
| 59.7 | 692 | 0 | 0 | 0 | 0 | 0.99899 | 0 | 0 | 0 | 0 | 0 | 0 | 0.1415 | 0 | 0 | 1.42 | 0 | 0 |
| 78.1 | 906 | 0.9999 | 0 | 0 | 0 | 0 | 0 | 0 | 0.0122 | 0 | 0 | 0 | 0 | 0 | 0 | -2.13 | 0 | 0 |
| 78.1 | 906 | 0 | 0 | 0 | 0 | 0 | 0.9999 | 0 | 0 | 0 | 0 | 0 | 0 | -0.0122 | 0 | 2.13 | 0 | 0 |
| 265.7 | 3082 | 0 | 0 | 0.0426 | 0 | 0 | 0 | 0 | 0 | 0 | 0.9991 | 0 | 0 | 0 | 0 | -0.53 | -2.26 | -2.26 |
| 265.7 | 3082 | 0 | 0 | 0 | -0.0426 | 0 | 0 | 0 | 0 | 0 | 0 | 0.9991 | 0 | 0 | 0 | 0.53 | 2.26 | 2.26 |
| 304.9 | 3537 | 0 | 0.1415 | 0 | 0 | 0 | 0 | 0 | 0 | 0.9899 | 0 | 0 | 0 | 0 | 0 | -1.58 | 0 | 0 |
| 304.9 | 3537 | 0 | 0 | 0 | 0 | -0.1415 | 0 | 0 | 0 | 0 | 0 | 0 | 0.9899 | 0 | 0 | 1.58 | 0 | 0 |
| 344.7 | 3999 | 0 | 0 | 0 | 0 | 0 | 0 | 1 | 0 | 0 | 0 | 0 | 0 | 0 | 0 | -4 | 0 | 0 |
| 344.7 | 3999 | 0 | 0 | 0 | 0 | 0 | 0 | 0 | 0 | 0 | 0 | 0 | 0 | 0 | 1 | 4 | 0 | 0 |
| 352.9 | 4094 | -0.0122 | 0 | 0 | 0 | 0 | 0 | 0 | 0.9999 | 0 | 0 | 0 | 0 | 0 | 0 | -2.87 | 0 | 0 |
| 352.9 | 4094 | 0 | 0 | 0 | 0 | 0 | 0.0122 | 0 | 0 | 0 | 0 | 0 | 0 | 0.9999 | 0 | 2.87 | 0 | 0 |
Crystal field parameters:
: -135 meV (-1566 K), : -172 meV (-1995 K), : 30 meV (348 K), : 76.6 meV (888 K).
| Energy | components | Moments | ||||||||||||||||
| meV | Kelvin | |||||||||||||||||
| 0 | 0 | 0 | 0.353 | 0 | -0.499 | 0 | 0.790 | 0.032 | 0 | -0.021 | 0 | 0.016 | 0 | -0.012 | 0 | -0.47 | -1.26 | -1.26 |
| 0 | 0 | 0.790 | 0 | -0.499 | 0 | 0.353 | 0 | 0 | 0.012 | 0 | -0.016 | 0 | 0.021 | 0 | -0.032 | 0.47 | 1.26 | 1.26 |
| 59.7 | 692 | 0 | 0.742 | 0 | -0.350 | 0 | -0.553 | 0.081 | 0 | 0.018 | 0 | -0.068 | 0 | 0.092 | 0 | -1.42 | 0 | 0 |
| 59.7 | 692 | -0.553 | 0 | -0.35 | 0 | 0.74 | 0 | 0 | -0.092 | 0 | 0.068 | 0 | -0.018 | 0 | -0.081 | 1.42 | 0 | 0 |
| 78.1 | 906 | 0 | 0.559 | 0 | 0.791 | 0 | 0.250 | -0.004 | 0 | -0.008 | 0 | 0.003 | 0 | 0.008 | 0 | -2.13 | 0 | 0 |
| 78.1 | 906 | 0.250 | 0 | 0.791 | 0 | 0.559 | 0 | 0 | -0.008 | 0 | -0.003 | 0 | 0.008 | 0 | 0.004 | 2.13 | 0 | 0 |
| 265.7 | 3082 | 0 | -0.015 | 0 | 0.021 | 0 | -0.034 | 0.739 | 0 | -0.484 | 0 | 0.375 | 0 | -0.279 | 0 | -0.53 | -2.26 | -2.26 |
| 265.7 | 3082 | 0.034 | 0 | -0.021 | 0 | 0.015 | 0 | 0 | -0.279 | 0 | 0.375 | 0 | -0.484 | 0 | 0.739 | 0.53 | 2.26 | 2.26 |
| 304.9 | 3537 | -0.079 | 0 | -0.05 | 0 | 0.106 | 0 | 0 | 0.643 | 0 | -0.479 | 0 | 0.124 | 0 | 0.567 | -1.58 | 0 | 0 |
| 304.9 | 3537 | 0 | -0.106 | 0 | 0.050 | 0 | 0.079 | 0.567 | 0 | 0.124 | 0 | -0.479 | 0 | 0.643 | 0 | 1.58 | 0 | 0 |
| 344.7 | 3999 | 0 | 0 | 0 | 0 | 0 | 0 | 0.125 | 0 | 0.573 | 0 | 0.740 | 0 | 0.331 | 0 | -4 | 0 | 0 |
| 344.7 | 3999 | 0 | 0 | 0 | 0 | 0 | 0 | 0 | 0.331 | 0 | 0.740 | 0 | 0.573 | 0 | 0.125 | 4 | 0 | 0 |
| 352.9 | 4095 | 0 | 0.007 | 0 | 0.010 | 0 | 0.003 | 0.331 | 0 | 0.650 | 0 | -0.279 | 0 | -0.625 | 0 | -2.87 | 0 | 0 |
| 352.9 | 4095 | -0.003 | 0 | -0.010 | 0 | -0.007 | 0 | 0 | -0.625 | 0 | -0.279 | 0 | 0.650 | 0 | 0.331 | 2.87 | 0 | 0 |
Crystal field parameters:
: 67.5 meV (783 K), : -82.6 meV (-959 K), : -64.5 meV (-748 K), : 68 meV (788 K), : -90 meV (-1043 K), : -9.4 meV (-109 K), : 9.6 meV (112 K), : -10.5 meV (-122 K), : 14.2 meV (165 K), : 76.6 meV (888 K).
| Energy | components | Moments | ||||||||||||||||
| meV | Kelvin | |||||||||||||||||
| 0 | 0 | 0.09 | 0 | 0.991 | 0 | -0.009 | 0 | 0 | 0.024 | 0 | -0.021 | 0 | 0.042 | 0 | 0.085 | -0.43 | -1.3 | -1.19 |
| 0 | 0 | 0 | -0.009 | 0 | 0.991 | 0 | 0.09 | -0.085 | 0 | -0.042 | 0 | 0.021 | 0 | -0.024 | 0 | 0.43 | 1.3 | 1.19 |
| 56.4 | 655 | -0.602 | 0 | 0.039 | 0.000 | 0.736 | 0 | 0 | 0.209 | 0 | 0.008 | 0 | -0.032 | 0 | 0.221 | -0.12 | -0.75 | -0.64 |
| 56.4 | 655 | 0 | 0.736 | 0 | 0.039 | 0 | -0.602 | -0.221 | 0 | 0.032 | 0 | -0.008 | 0 | -0.209 | 0.0 | 0.12 | 0.75 | 0.64 |
| 59.7 | 693 | 0.695 | 0 | -0.052 | 0 | 0.591 | 0 | 0 | 0.213 | 0 | 0.05 | 0 | 0.252 | 0 | -0.232 | -0.15 | -0.54 | -0.87 |
| 59.7 | 693 | 0 | 0.591 | 0 | -0.052 | 0 | 0.695 | 0.232 | 0 | -0.252 | 0 | -0.05 | 0 | -0.213 | 0 | 0.15 | 0.54 | 0.87 |
| 267.1 | 3099 | 0 | 0.01 | 0 | 0.024 | 0 | -0.034 | 0.371 | 0 | 0.304 | 0 | 0.843 | 0 | -0.240 | 0 | -0.11 | -0.48 | -2.21 |
| 267.1 | 3099 | 0.034 | 0 | -0.024 | 0 | -0.01 | 0 | 0 | -0.240 | 0 | 0.843 | 0 | 0.304 | 0 | 0.371 | 0.11 | 0.48 | 2.21 |
| 300.4 | 3485 | -0.058 | 0 | -0.048 | 0 | 0.028 | 0 | 0 | -0.389 | 0 | -0.486 | 0 | 0.738 | 0 | 0.249 | -0.67 | -1.33 | -2.51 |
| 300.4 | 3485 | 0 | -0.028 | 0 | 0.048 | 0 | 0.058 | 0.249 | 0 | 0.738 | 0 | -0.486 | 0 | -0.389 | 0 | 0.67 | 1.33 | 2.51 |
| 471.8 | 5473 | 0 | -0.166 | 0 | 0.065 | 0 | -0.366 | 0.67 | 0 | -0.503 | 0 | -0.212 | 0 | -0.295 | 0 | -1.56 | -0.5 | -0.77 |
| 471.8 | 5473 | 0.366 | 0 | -0.065 | 0 | 0.166 | 0 | 0 | -0.295 | 0 | -0.212 | 0 | -0.503 | 0 | 0.67 | 1.56 | 0.5 | 0.77 |
| 507.7 | 5889 | 0.088 | 0 | -0.083 | 0 | -0.284 | 0 | 0 | 0.784 | 0 | -0.078 | 0 | 0.209 | 0 | 0.491 | -0.63 | -0.21 | -1.94 |
| 507.7 | 5889 | 0 | 0.284 | 0 | 0.083 | 0 | -0.088 | 0.491 | 0 | 0.209 | 0 | -0.078 | 0 | 0.784 | 0 | 0.63 | 0.21 | 1.94 |
Crystal field parameters:
: -190.5 meV (-2210 K), : 15.3 meV (177 K), : -278.3 meV (-3229 K), : -101.3 meV (-1175 K), : 83.2 meV (965 K), : 78.4 meV (910 K), : 73.5 meV (853 K), : 457 meV (5302 K), : -364.8 meV (-4232 K), : 80.5 meV (934 K)
| Energy | components | Moments | ||||||||||||||||
| meV | Kelvin | |||||||||||||||||
| 0 | 0 | 0.801 | 0 | -0.427 | 0 | 0.408 | 0 | 0 | 0.046 | 0 | 0.028 | 0 | 0.080 | 0 | 0.027 | -0.43 | -1.3 | -1.19 |
| 0 | 0 | 0 | 0.408 | 0 | -0.427 | 0 | 0.801 | -0.027 | 0 | -0.080 | 0 | -0.028 | 0 | -0.046 | 0 | 0.43 | 1.3 | 1.19 |
| 56.5 | 655 | -0.290 | 0 | 0.239 | 0 | 0.874 | 0 | 0 | 0.08 | 0 | -0.126 | 0 | -0.255 | 0 | -0.083 | -0.12 | -0.75 | -0.64 |
| 56.5 | 655 | 0 | 0.874 | 0 | 0.239 | 0 | -0.290 | 0.083 | 0 | 0.255 | 0 | 0.126 | 0 | -0.080 | 0 | 0.12 | 0.75 | 0.64 |
| 59.7 | 693 | 0.464 | 0 | 0.783 | 0 | -0.077 | 0 | 0 | -0.061 | 0 | -0.334 | 0 | 0.014 | 0 | 0.223 | -0.15 | -0.54 | -0.87 |
| 59.7 | 693 | 0 | -0.077 | 0 | 0.783 | 0 | 0.464 | -0.223 | 0 | -0.014 | 0 | 0.334 | 0 | 0.061 | 0 | 0.15 | 0.54 | 0.87 |
| 267.1 | 3099 | -0.016 | 0 | 0.035 | 0 | 0.018 | 0 | 0 | 0.237 | 0 | 0.510 | 0 | -0.313 | 0 | 0.764 | -0.11 | -0.48 | -2.21 |
| 267.1 | 3099 | 0 | -0.018 | 0 | -0.035 | 0 | 0.016 | 0.764 | 0 | -0.313 | 0 | 0.510 | 0 | 0.237 | 0 | 0.11 | 0.48 | 2.21 |
| 300.4 | 3485 | 0 | 0.071 | 0 | 0.011 | 0 | 0.036 | -0.035 | 0 | 0.218 | 0 | -0.247 | 0 | 0.940 | 0 | -0.67 | -1.33 | -2.51 |
| 300.4 | 3485 | -0.036 | 0 | -0.011 | 0 | -0.071 | 0 | 0 | 0.940 | 0 | -0.247 | 0 | 0.218 | 0 | -0.035 | 0.67 | 1.33 | 2.51 |
| 471.8 | 5474 | 0.133 | 0 | 0.381 | 0 | 0.056 | 0 | 0 | 0.139 | 0 | 0.742 | 0 | 0.228 | 0 | -0.461 | -1.56 | -0.5 | -0.77 |
| 471.8 | 5474 | 0 | -0.056 | 0 | -0.381 | 0 | -0.133 | -0.461 | 0 | 0.228 | 0 | 0.742 | 0 | 0.139 | 0 | 1.56 | 0.5 | 0.77 |
| 507.7 | 5890 | -0.201 | 0 | 0.013 | 0 | 0.233 | 0 | 0 | -0.170 | 0 | 0.017 | 0 | 0.855 | 0 | 0.381 | -0.63 | -0.21 | -1.94 |
| 507.7 | 5890 | 0 | -0.233 | 0 | -0.013 | 0 | 0.201 | 0.381 | 0 | 0.855 | 0 | 0.017 | 0 | -0.170 | 0 | 0.63 | 0.21 | 1.94 |
Crystal field parameters:
: 114 meV (1322 K), : -109 meV (-1265 K), : 63 meV (727 K), : 114 meV (1327 K), : -202 meV (-2345 K), : -645 meV (-7478 K), : -190 meV (-2197 K), : 264 meV (3060 K), : 193 meV (2239 K), : 80.5 meV (934 K)
References
- Pikul et al. (2010) A. P. Pikul, D. Kaczorowski, Z. Gajek, J. Stȩpień-Damm, A. Ślebarski, M. Werwiński, and A. Szajek, Giant crystal-electric-field effect and complex magnetic behavior in single-crystalline CeRh3Si2, PhysRevB 81, 174408 (2010).