An Age-dependent Feedback Control Model for Calcium and Reactive Oxygen Species in Yeast Cells
Abstract
Calcium and reactive oxygen species (ROS) interact with each other and play an important role in cell signaling networks. Based on the existing mathematical models, we develop an age-dependent feedback control model to simulate the interaction. The model consists of three subsystems: cytosolic calcium dynamics, ROS generation from the respiratory chain in mitochondria, and mitochondrial energy metabolism. In the model, we hypothesized that ROS induces calcium release from the yeast endoplasmic reticulum , Golgi apparatus, and vacuoles, and that ROS damages calmodulin and calcineurin by oxidizing them. The dependence of calcium uptake by Vcx1p on ATP is incorporated into the model. The model can approximately reproduce the log phase calcium dynamics. The simulated interaction between the cytosolic calcium and mitochondrial ROS shows that an increase in calcium results in a decrease in ROS initially (in log phase), but the increase-decrease relation is changed to an increase-increase relation when the cell is getting old. This could accord with the experimental observation that calcium diminishes ROS from complexes I and III of the respiratory chain under normal conditions, but enhances ROS when the complex formations are inhibited. The model predicts that the subsystem of the calcium regulators Pmc1p, Pmr1p, and Vex1p is stable, controllable, and observable. These structural properties of the dynamical system could mathematically confirm that cells have evolved delicate feedback control mechanisms to maintain their calcium homeostasis.
Keywords: calcium, reactive oxygen species, ATP, feedback control, controllability, observability, stability, aging.

1 Introduction
Calcium and reactive oxygen species (ROS) interact with each other and play an important role in cell signaling networks, as demonstrated in Fig.1. Mitochondrial Ca2+ activates allosterically pyruvate dehydrogenase, isocitrate dehydrogenase, and -ketoglutarate dehydrogenase (McCormack et al, 1993), and stimulates the ATP synthase (Das et al, 1990), -glycerophosphate dehydrogenase (Wernette et al, 1981), and the adenine nucleotide translocase (ANT) (Mildaziene et al, 1995). Under physiological conditions, mitochondrial Ca2+ upregulates the mitochondrial oxidative phosphorylation pathway and results in faster respiratory chain activity and higher ATP output (for review, see Brookes et al, 2004).
ROS can damage cellular components such as proteins, lipids, and DNA. A rise of ROS may cause mutations in mitochondrial DNA or loss of heterozygosity in chromosomal DNA and lead to cell death. ROS is required for cell proliferation, but can also induce apoptosis (Beckman et al, 1998). Although ROS clearly possess the capacity to behave in a random and destructive fashion, growing evidence highlights a specific role in redox cell signaling and suggests that in many instances the production of ROS is tightly regulated and its downstream targets are exquisitely specific (for review, see Brookes et al, 2004 and Finkel, 2003).
ROS as a marker for cell senescence are generated by mitochondria and several other intracellular sources. The respiratory chain of mitochondria is the main source. Other sources include a wide range of extramitochondrial enzymes (Gordeeva et al, 2003), such as NADPH-oxidase and myeloperoxidase, and the endoplasmic reticulum, where the superoxide is generated by a leakage of electrons from NADPH-cytochrome-P450 reductase (Gordeeva et al, 2003). In addition, elevated ROS was caused by elevated redox potentials including elevated GSSG levels and NADP+ levels (Monteiro et al., 2004).
ROS generation has been shown to be modulated by calcium. A rise of calcium can increase ROS. On the other hand, an elevated ROS may result in an increase in calcium (Gordeeva et al, 2003). In mitochondria, it appears that calcium diminishes ROS from complexes I and III under normal conditions, but enhances ROS when the complex formations are inhibited (Brookes et al, 2004). Deletion of yeast cytosolic thioredoxin perosidase I greatly decreases the reduced glutathione GSH / the oxidized glutathione GSSG ratio in mitochondria upon calcium treatment (Monteiro et al., 2004). A low ratio of GSH/GSSG indicates a high oxidative potential within a cell. In yeast cells, Dawes and co-workers observed a switch of anti-ROS system from log phase (young) to stationary phase (Drakulic et al., 2005). Augmenting the anti-ROS system is one mechanism of the longevity mediated by caloric restriction (Agarwal et al., 2005). These previous observations suggest the contribution of cytosolic calcium homeostasis to organelle functions and overall cellular redox homeostasis.
It appears that Ca2+ is a global positive effector of cell function. Malfunction of the calcium homeostasis may cause intracellular senescence and aging (for review see Foster, 2007; Murchison and Griffith, 2007; Tang et al, 2008b). Indeed, the calcium hypothesis of brain aging is widely accepted (Thibault et al., 2007). The transition from a robust control to malfunction of calcium homeostasis may signal or be the cause of aging.
The cytosolic calcium concentration is the net results of pump proteins (Mid1p, Cch1p, Yvc1p, etc) that increase the concentration and pump proteins (Pmc1p, Pmr1p, Vcx1p, etc) that decrease the concentration. The functions of these two categories of proteins are coordinated by calmodulin and calcineurin. Yeast cells uptake calcium from the environment via Mid1p, Cch1p, and possibly other unidentified transporters (Courchesne and Ozturk, 2003). The rise of cytosolic calcium activates calmodulin which in turn activates the serine/threonine phosphatase calcineurin. The activated calcineurin de-phosphorylates Crz1p and suppresses the activity of Vcx1p. Activated Crz1p enters the nucleus and up-regulates the expression of PMR1 and PMC1 (for review, see Cyert 2001). Pmr1p pumps calcium ions into the organelle Golgi and possibly endoplasmic reticulum (ER). The calcium in ER and Golgi will be secreted along with the canonical secretory pathways. Pmc1p pumps calcium ions into vacuole, an organelle that stores excess ions and nutrients. While most calcium ions inside vacuoles form polyphosphate salts and are not re-usable, a small fraction of calcium ions can be pumped to the cytosol by Yvc1p. Yvc1p channels calcium to the cytosol and also contributes to the rise of cytosolic calcium concentration (Dennis and Cyert, 2002). In this intricate system, damage of one protein such as Pmc1p or Vcx1p may not affect cell’s ability to adjust to small variations of calcium burst. On the contrary, a decline of the whole system will ruin the robustness.
Based on the intracellular calcium model developed by the authors (Tang and Liu, 2008a), mitochondrial calcium models developed by Cortassa et el (2003) and Magnus et al (1997, 1998), and the mitochondrial energy metabolism model developed by Cortassa et el (2003), we further established an age-dependent feedback control model to simulate aging calcium and ROS dynamics and their interaction. The model consists of three subsystems: cytosolic calcium dynamics, ROS generation from the respiratory chain in mitochondria, and mitochondrial energy metabolism. In smooth muscle, superoxide radical O has been shown to inhibit both Ca2+-ATPase activity and Ca2+ uptake into the sarcoplasmic reticulum (SR) while stimulating inositol 1,4,5-trisphosphate-induced Ca2+ release (Suzuki et al, 1991, 1992). Favero et al (1995) reported that hydrogen peroxide stimulates the Ca2+ release channel from skeletal muscle sarcoplasmic reticulum. Thus, in our model, we hypothesized that ROS induces calcium release from the yeast endoplasmic reticulum, Golgi apparatus, and vacuoles although there is no such a report about yeast cells. We also hypothesized that ROS damages calmodulin and calcineurin by oxidizing them. The dependence of calcium uptake by Vcx1p on ATP is incorporated into the model.
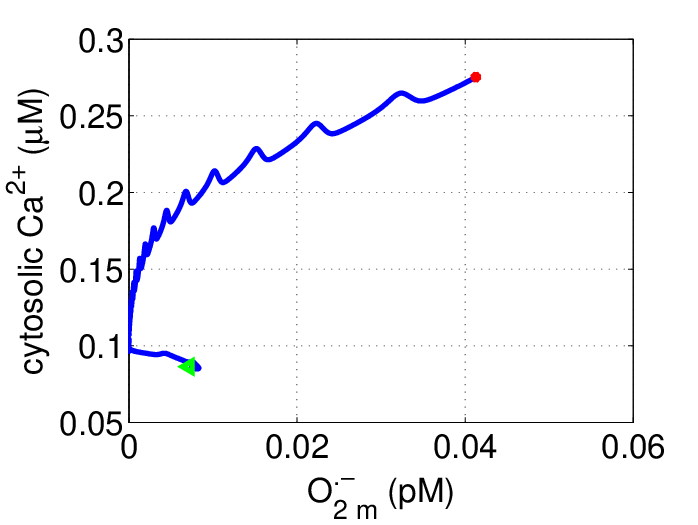
The model can approximately reproduce the log phase calcium dynamics. The simulated interaction between the cytosolic calcium and mitochondrial ROS shows that an increase in calcium results in a decrease in ROS initially (in log phase), but the increase-decrease relation is changed to an increase-increase relation when the cell is getting old. This could accord with the experimental observation that calcium diminishes ROS from complexes I and III of the respiratory chain under normal conditions, but enhances ROS when the complex formations are inhibited. Such inhibition could come from a dis-proportion of lipid component or other alterations in the membrane during the aging process. The model predicts that the subsystem of the calcium regulators Pmc1p, Pmr1p, and Vex1p is stable, controllable, and observable. These structural properties of the dynamical system could mathematically confirm that cells have evolved delicate feedback control mechanisms to maintain their calcium homeostasis.
2 Results
2.1 The model contains two new features
Our model presented in the next section, Feedback control model, is built on the intracellular calcium model developed by the authors (Tang and Liu, 2008a), mitochondrial calcium models developed by Cortassa et el (2003) and Magnus et al (1997, 1998), and the mitochondrial energy metabolism model developed by Cortassa et el (2003). Two new features are added to these existing models.
In smooth muscle, superoxide radical O has been shown to inhibit both Ca2+-ATPase activity and Ca2+ uptake into the sarcoplasmic reticulum (SR) while stimulating inositol 1,4,5-trisphosphate-induced Ca2+ release (Suzuki et al, 1991, 1992). Favero et al (1995) reported that hydrogen peroxide stimulates the Ca2+ release channel from skeletal muscle sarcoplasmic reticulum. Thus we hypothesized that ROS induces calcium release from the yeast endoplasmic reticulum, Golgi apparatus, and vacuoles although there is no such a report about yeast cells. The release rate is determined by fitting the experimental data of Favero et al (1995) into the Michaelis-Menton function
| (1) |
with (nmol/mg/min) and (mM), as shown in Fig.2. The unit, nmol/mg/min, is converted into min-1 by multiplying the factor of 0.2/0.685. This leads to changes in the equations (22), (26), (27), and (28) in the next section.

We also hypothesized that ROS damages calmodulin and calcineurin by oxidizing them:
where CaM denotes the Ca2+-bound calmodulin and CaN denotes the CaM-bound calcineurin. The ROS-calmodulin and other ROS-damaged molecules are dead in function. They will likely be removed by the proteolysis systems such as autophagy of the cell. Using the law of mass action, we can write down the differential equations for these reactions as follows:
| (2) | |||||
| (3) | |||||
| (4) | |||||
| (5) |
Adding the equations (2), (3), and (5) together gives
which implies
where denotes the total initial concentration of Ca2+-free and Ca2+-bound calmodulin. This results in the equation (23) in the next section. Adding the equations (4) and (5) together gives
which implies
where denotes the total initial concentration of -free and -bound calcineurin. This leads to the equation (24) in the next section.
Another new feature is that the dependence of calcium uptake by Vcx1p on ATP is incorporated into the model. Ohsumi et al (1983) showed that calcium uptake by the antiporter Vcx1p is driven by an energy provided by hydrolysis of ATP. Thus we used their data to determine the calcium uptake rate with respect to ATP by fitting their data into the following polynomial
| (6) |
with
as shown in Fig.3. The unit, nmol/mg/min, is converted into min-1 by multiplying the factor of 2. This feature can be seen from the equations (22) and (26) in the next section.

2.2 The model can approximately reproduce the log phase calcium dynamics


Figs.4 and 5 indicate that the model can approximately reproduce the experimental results of log phase calcium dynamics. In reproducing the result (Fig.4) obtained by Förster and Kane (2000), the environmental calcium is set to 20 M during the initial 10 seconds and then is suddenly changed to 50000 M, following the experiment of Förster and Kane (2000). All parameters and initial conditions are listed in Tables 1 and 2. To simulate the case where calcineurin is inhibited, the rate constants and are set to 0. In reproducing the result (Fig.5) obtained by Ohsumi and Anraku (1983), the environmental calcium is set to 300 M. In both cases, the simulated calcium dynamics agrees approximately with the experimental data in a general tendency, although they do not match perfectly.
2.3 Lifespan can be predicted by the calcium level simulated by the model
The cytosolic calcium level in yeast cells is maintained in a narrow range of 50 - 200 nM (Aiello et al, 2002; Dunn et al, 1994; Miseta et al, 1999a). A higher calcium level could result in cell death. Using the model, we simulated calcium levels during aging. Fig.6. shows that the calcium level gradually increases with time and exceeds 0.2 M around 4000 minutes. If the cell dies at the calcium level of 0.2 M, then the lifespan of the cell is 4000/120 =33 generations, which is close to the experimental average lifespan of 29 generation (Tang and Liu, 2008a).

2.4 The model can simulate the interaction between calcium and ROS
ROS generation has been shown to be modulated by calcium. A rise of calcium can increase ROS. On the other hand, an elevated ROS may result in an increase in calcium (Gordeeva et al, 2003). In mitochondria, it appears that calcium diminishes ROS from complexes I and III of the electron transport chain under normal conditions, but enhances ROS when the complex formations are inhibited (Brookes et al, 2004). We used the model to simulate this interaction. The phase plot of Fig.7 shows that an increase in calcium results in a decrease in ROS initially (in log phase), but the increase-decrease relation is changed to an increase-increase relation when the cell is getting old. An explanation about the increase-increase relation is a “two-hit” hypothesis: in addition to calcium increase, the function of the complexes of the electron transport chain is declining as the cell is getting old. Such declination may have an effect similar to the inhibition of the complexes.
2.5 The model predicts that the subsystem of the calcium regulators Pmc1p, Pmr1p, and Vex1p is stable, controllable, and observable
Following control analysis (Liu and Tang, 2008), we analyzed the stability, controllability, and observability of the subsystem of the calcium regulators Pmc1p, Pmr1p, and Vex1p:
| (7) | |||||
| (8) | |||||
| (9) | |||||
| (10) | |||||
| (11) | |||||
| (12) | |||||
| (13) | |||||
| (14) |
Detailed explanations about the model and various functions are presented in the next section. From the point of view of control theory, the equations (7)-(11) are state equations of a plant, and the equations (12)-(14) constitute a controller. Thus, variables and in the equations (7)-(11) are control inputs (manipulated variables) that control the calcium pumps Pmc1p, Pmr1p, and Vcx1p. In order to use control theory to analyze the problem, we rewrite the equations (13)-(14) as follows
| (15) | |||||
| (16) |
where
| (17) | |||||
| (18) |
are feedback controllers. Then the equations (7)-(11) and (15)-(16) constitute a standard nonlinear open-loop control system with the following output equation
| (19) |
Since the steady state equations of the control system cannot be solved explicitly, we use MATLAB to solve it numerically to obtain the following equilibrium
Using the Maple software to linearize the system (7)-(11) and (15)-(16) at the equilibrium, we obtain the following Jacobian
The input matrix is given by
and the output matrix is This leads to a standard linear control system
| (20) | |||||
| (21) |
The eigenvalues of the Jacobian are all negative: -8219.8, -74.079, -20.208, -1.0004, -0.5, -5, -0.1. Thus the linear control system (20) is exponentially stable and then the original nonlinear control system (7)-(11) and (15)-(16) is locally exponentially stable (Khalil, 2002, Corollary 5.1).
The system (20) is controllable if for any initial state and any desired state , there exists a control such that for some . The system (20)-(21) is observable if any initial state can be uniquely determined by the output (cytosolic calcium) over for some .
To check the controllability of (20), it suffices to examine the rank of the Kalman controllability matrix (Morris, 2001, Ogata, 2002)
Using the MABLAB control system toolbox, we found that the matrix has a rank of and then the system (20) is controllable (Morris, 2001). In the same way, we found that Kalman observability matrix
has a rank of and then the system (20)-(21) is observable (Morris, 2001).
It is well known that if a control system is controllable and observable, we can design (locally stabilizable) linear output feedback controllers, such as observer-based feedback controllers, to regulate the calcium to its equilibrium. This could confirm that cells have developed the smart feedback controllers (17) and (18) to maintain their calcium homeostasis. In control engineering, it is usually difficult to design globally-stabilizable nonlinear output feedback controllers. Thus such a cell-developed output controller could have potential applications in control engineering.
3 Feedback control model
Based on the intracellular calcium model developed by the authors (Tang and Liu, 2008a), mitochondrial calcium models developed by Cortassa et el (2003) and Magnus et al (1997, 1998), and the mitochondrial energy metabolism model developed by Cortassa et el (2003), we establish the following feedback control model
| (22) | |||||
| (23) | |||||
| (24) | |||||
| (25) | |||||
| (26) | |||||
| (27) | |||||
| (28) | |||||
| (29) | |||||
| (30) | |||||
| (31) | |||||
| (32) | |||||
| (33) | |||||
| (34) | |||||
| (35) |
| (36) | |||||
| (37) | |||||
| (38) | |||||
| (39) | |||||
| (40) | |||||
| (41) | |||||
| (42) | |||||
| (43) | |||||
| (44) | |||||
| (45) | |||||
| (46) | |||||
| (47) | |||||
| (48) | |||||
| (49) |
For the detailed derivation of the equations (22)-(32), we refer to the work by Cui et al (2006), and Tang and Liu (2008a). For the other equations, we refer to the work by Cortassa et al (2003, 2004) and Magnus el al (1997, 1998).
The state variables are described as follows:
- 1.
: the concentration of cytosolic calcium (M);
- 2.
: the concentration of Ca2+-bound calmodulin (M);
- 3.
: the concentration of -bound calcineurin (M);
- 4.
: the total concentration of Ca2+-free and Ca2+-bound calmodulin (M);
- 5.
: the total concentration of -free and -bound calcineurin (M);
- 6.
: the total nuclear fraction of Crz1p;
- 7.
: the concentration of calcium in the vacuole (M);
- 8.
: the concentration of calcium in the Golgi apparatus (M);
- 9.
: the concentration of calcium in ER (M);
- 10.
: delayed cytosolic calcium signal (M);
- 11.
: the cyclin (dimensionless);
- 12.
: the maturation promoting factor (dimensionless),
- 13.
: the concentration of IP3 (M);
- 14.
: the concentration of mitochondrial ATP (mM);
- 15.
: the electrical potential difference across the inner mitochondrial membrane (V), where denotes the voltage of the outside of the inner mitochondrial membrane and is the voltage of the matrix side;
- 16.
: the concentration of mitochondrial calcium (M);
- 17.
: the concentration of mitochondrial superoxide (mM);
- 18.
: the concentration of intracellular superoxide (mM);
- 19.
: the concentration of intracellular hydrogen peroxide (mM);
- 20.
: the concentration of intracellular glutathione (mM);
- 21.
: the concentration of isocitrate (mM);
- 22.
: the concentration of -ketoglutarate (mM);
- 23.
: the concentration of succinyl CoA (mM);
- 24.
: the concentration of succinate (mM);
- 25.
: the concentration of fumarate (mM);
- 26.
: the concentration of malate (mM);
- 27.
: the concentration of oxalacetate (mM);
- 28.
: the concentration of aspartate (mM);
- 29.
: the concentration of NADH in mitochondrial matrix (mM);
- 30.
: the concentration of intracellular ATP (mM);
In what follows, is the experimental survival curve of wild type yeast (BY4742) cells to describe the aging process of proteins (see Fig. 2 of Tang and Liu (2008a)). Reaction velocities are described as follows:
- 1.
The velocity of calcium transport through a unknown channel X on the plasma membrane:
where is the environmental calcium.
- 2.
The velocity of calcium transport through Pmc1p:
- 3.
The velocity of calcium transport through Vcx1p:
- 4.
The velocity of calcium transport through Yvc1p:
- 5.
The velocity of calcium transport through Pmr1p:
- 6.
The velocity of calcium transport through Pmr1p on ER:
- 7.
The velocity of calcium transport through Cord1p:
- 8.
The velocity of calcium transport through a unknown channel X on Golgi stimulated by IP3:
- 9.
The velocity of calcium transport through a unknown channel X on the vacuole stimulated by IP3:
- 10.
The velocity of calcium binding to calmodulin:
- 11.
The velocity of binding of calcium-bound calmodulin to calcineurin:
- 12.
The velocity of proton H+ transport across inner mitochondrial membrane driven by NADH:
- 13.
The velocity of proton H+ transport across inner mitochondrial membrane driven by FADH2:
- 14.
The velocity of ATP synthesis by the -ATPase:
- 15.
The velocity of H+ uptake by mitochondria via -ATPase:
- 16.
The velocity of ATP and ADP translocation across inner mitochondrial membrane via the adenine nucleotide translocator (ANT):
- 17.
The velocity of H+ leak across the inner mitochondrial membrane:
- 18.
The velocity of calcium transport into mitochondria through the calcium uniporter:
- 19.
The velocity of calcium transport out of mitochondria through the Na+/Ca2+ antiporter:
- 20.
The velocity of oxygen consumption in the respiratory chain of mitochondria:
- 21.
The velocity of conversion of the intracellular superoxide into hydrogen peroxide by superoxide dismutase (SOD):
- 22.
The velocity of conversion of the intracellular hydrogen peroxide into water by catalase (CAT):
- 23.
The velocity of reduction of by glutathione peroxidease (GPX):
- 24.
The velocity of reduction of oxidized glutathione (GSSH) by glutathione reductase (GR):
- 25.
The velocity of transport out of the mitochondrial matrix through the inner membrane anion channel:
- 26.
The velocity of conversion of oxaloacetic acid (OAA) and acetyl CoA (AcCoA) to citrate (CIT) by citrate synthase (CS):
- 27.
The velocity of conversion of citrate to isocitrate by aconitase:
- 28.
The velocity of conversion of isocitrate to -ketoglutarate by isocitrate dehydrogenase (IDH):
- 29.
The velocity of conversion of -ketoglutarate to succinyl CoA by -ketoglutarate dehydrogenase (KGDH):
- 30.
The velocity of conversion of succinyl CoA into succinate by Succinyl CoA lyase (SL):
- 31.
The velocity of conversion of succinate to fumarate by Succinate dehydrogenase (SDH):
- 32.
The velocity of conversion of fumarate to malate by Fumarase (FH):
- 33.
The velocity of conversion of malate to oxaloacetate (OAA) by the enzyme malate dehydrogenase (MDH):
- 34.
The velocity of conversion between Oxaloacetate and -ketoglutarate of the TCA cycle and the amino acids aspartate (ASP) and glutamate (GLU) by aspartate aminotransferases (AAT):
- 35.
The velocity of consumption of the aspartate:
Numerous functions used in the above velocities are described as follows. The function
| (50) |
control the Ca2+ entering the cell from the environment through the unknown pump . The function is given by
| (51) |
where is a basic equilibrium constant, is an increment factor, and is an integer. Within the nuclear fraction, the fully dephosphorylated state is transcriptionally active and is given by
| (52) |
where
| (53) |
The function
| (54) |
is an aging factor of various proteins such as calmodulin, calcineurin, Pmc1p, Vcx1p, and Yvc1p. For feedback control laws
| (55) | |||||
| (56) | |||||
| (57) | |||||
| (58) |
represents the negative regulation of calcineurin on Vcx1p, is a feedback control describing how Vcx1p is activated by Ca2+ directly, is a feedback control describing how Ca2+ are transported back to the cytosol through Yvc1p in response to a low cytosolic Ca2+ concentration, is a feedback control describing how Ca2+ are transported out of the Golgi by vesicles in response to a high Ca2+ concentration in the Golgi. The function
| (59) |
is a feedback control that maintains the calcium homeostasis in the ER. The electrochemical gradient, or proton motive force (), is given by
| (60) |
Mitochondrial NAD+ is assumed to be conserved as follows
with as the total concentration of pyrimidine nucleotides. Mitochondrial ATP, [ATP]m, is assumed to be conserved as follows
with as the total concentration of adenine nucleotides and [ADP]m. Here are other relations:
Numerous parameters and their values in the model are listed in Table 1.
| Parameter | Value | Description |
|---|---|---|
| 2500 (M/min) | Rate constant of Channel X | |
| 40000 (M/min) | Rate constant of Pmc1p | |
| 70000 (M/min) | Rate constant of Vcx1p | |
| 10 (M/min) | Rate constant of Yvc1p | |
| 7000 (M/min) | Rate constant of Pmr1p on Golgi | |
| 10 (M/min) | Rate constant of a unknown IP3-stimulated | |
| calcium pump on Golgi | ||
| 100 (M/min) | Rate constant of Pmr1p on ER | |
| 10 (M/min) | Rate constant of Cod1p | |
| 100 (M/min) | Rate constant of a unknown IP3-stimulated | |
| calcium pump on vacuole | ||
| 500 (M) | Michaelis-Menten constant of Channel X (Cui et al, 2006) | |
| 2.3 (M) | Michaelis-Menten constant of Pmc1p (Cui et al, 2006) | |
| 100 (M) | Michaelis-Menten constant of Vcx1p (Cui et al, 2006) | |
| 0.2 (M) | Michaelis-Menten constant of Yvc1p | |
| 100 (M) | Michaelis-Menten constant of a unknown IP3-stimulated | |
| calcium pump on vacuole | ||
| 0.1 (M) | Michaelis-Menten constant of Pmr1p on Golgi (Cui et al, 2006) | |
| 50 (M) | Michaelis-Menten constant of a unknown IP3-stimulated | |
| calcium pump on Golgi | ||
| 0.1 (M) | Michaelis-Menton constant of Pmr1p on ER | |
| 0.1 (M) | Michaelis-Menton constant of Cod1p | |
| 0.06 (M) | Steady state of Ca2+ in the cytosol (Aiello et al, 2002) | |
| 300 (M) | Steady state of Ca2+ in Golgi (Pinton et al, 1998) | |
| 10 (M) | Steady state of Ca2+ in ER (Aiello et al, 2002) | |
| 25 (M) | The total concentration of calmodulin (Cui et al, 2006) | |
| 25 (M) | The total concentration of calcineurin (Cui et al, 2006) | |
| 13 | The number of relevant regulatory phosphorylation sites | |
| (Cui et al, 2006) | ||
| The basic equilibrium constant (Cui et al, 2006) | ||
| 5 | The increment factor (Cui et al, 2006) | |
| 1 (1/min) | Calcium signal delay rate |
Table 1 continued
| Parameter | Value | Description |
|---|---|---|
| 0.1 | The feedback control constant | |
| 15 (1/M) | The feedback control constant | |
| 1 | The feedback control constant | |
| 50 (1/M) | The feedback control constant | |
| 100 | The feedback control constant | |
| 100 (1/M) | The feedback control constant | |
| 50 | The feedback control constant | |
| 0.05 (1/M) | The feedback control constant | |
| 50 | The feedback control constant | |
| 1 (1/M) | The feedback control constant | |
| 500 (1/((M)3 min)) | The forward rate constant (Cui et al, 2006) | |
| 5 (1/(M min)) | The forward rate constant (Cui et al, 2006) | |
| 0.4 (1/min) | The nuclear import rate constant (Cui et al, 2006) | |
| 0.1 (1/min) | The nuclear export rate constant (Cui et al, 2006) | |
| 10 (1/M) | The feedback control constant (Cui et al, 2006) | |
| 0.5 (1/min) | The feedback control constant | |
| 0.3 | The feedback control constant | |
| 40 (1/min) | The feedback control constant | |
| 5.5 (1/min) | The feedback control constant | |
| 0.1 | The feedback control constant | |
| 3.5 | Cell cycle constant (Norel et al, 1991) | |
| 1 | Cell cycle constant (Norel et al, 1991) | |
| 10 | Cell cycle constant (Norel et al, 1991) | |
| 50000 (M/min) | Rate constant in cell cycle | |
| 100 | Cell cycle constant | |
| 100 | Cell cycle constant | |
| 0.3 (1/min) | Degradation Rate of IP3 | |
| 100 (1/min) | The backward rate constant (Cui et al, 2006) | |
| 5 (1/min) | The backward rate constant (Cui et al, 2006) | |
| 0.01 | Cell cycle scaling | |
| 1.2 | Cyclin input (Norel et al, 1991) | |
| 0.92 | The aging constant | |
| 0.08 | The aging constant | |
| 0.00115 (1/min) | The aging rate constant |
Table 1 continued (descriptions of the rest of parameters are referred to Cortassa et al (2003, 2004))
| Parameter | Value | |
|---|---|---|
| 2.1255 (/min) | ||
| 11.28 (mM) | ||
| 15 (mM) | ||
| 2 (mM) | ||
| 10 (mM) | ||
| 60 (s) | ||
| minute 6.394 10-10 (/min) | ||
| minute 1.762 10-13 (/min) | ||
| 2.077 10-18 | ||
| 1.728 10-9 | ||
| 1.059 10-26 | ||
| 0.0006 (mM) | ||
| 0.0045 (mM ) | ||
| 1.35 1018 | ||
| 5.765 1013 | ||
| 0.05 (V) | ||
| 0.85 | ||
| 1.24 (mM) | ||
| 0.01 (mM) | ||
| minute 1.656 10-5 (/min) | ||
| minute 3.373 10-7 (/min) | ||
| minute 9.651 10-14 (/min) | ||
| minute 4.585 10-19 (/min) | ||
| 1.346 10-8 | ||
| 7.739 10-7 | ||
| 6.65 10-15 | ||
| 0.525 (mM) | ||
| 1.71 106 | ||
| 8.315 (V C/mol/K) | ||
| 310.6 (K) | ||
| 96480 (C/mol) | ||
| 20 (mM) | ||
| 0.05 (mM) | ||
| 0.5 | ||
| 0.01 (mM/s/V) | ||
| -0.6 (pH units) | ||
| 1.812 ( MM/V) | ||
| minute 0.625 (muM/min) | ||
| 0.091 (Volts) |
Table 1 continued
| Parameter | Value | |
|---|---|---|
| 3.8 10-4 (mM) | ||
| 0.019 (mM) | ||
| 110 | ||
| 2.8 | ||
| minute 0.005 (muM/min) | ||
| 0.5 | ||
| 10 (muM) | ||
| 9.4 (mM) | ||
| 3.75 10-4 (mM) | ||
| 3 | ||
| 0.0003 | ||
| minute 2.656 10-19 (/min) | ||
| minute 8.632 10-27 (/min) | ||
| 0.0782 (mM/s/V) | ||
| 7.82 (mM/s/V) | ||
| 10-3 | ||
| 104 | ||
| 70 (/V) | ||
| 0.004 (V) | ||
| 0.01 (mM) | ||
| minute 2.4 106 (/mM/min) | ||
| minute 4.8 104 (/mM/min) | ||
| minute 0.5 (/min) | ||
| 1 10-3 (mM) | ||
| 0.5 (mM) | ||
| minute 1.7 104 (/mM/min) | ||
| 0.001 (mM) | ||
| 50 | ||
| 0.00141 (mM) | ||
| 2.5/minute (mM min) | ||
| 0.5/minute (mM min) | ||
| 1.94 (mM) | ||
| 38.7 (mM) | ||
| minute 0.0308 (/min) | ||
| 1.27 10-3 (mM) | ||
| 1.5 (mM) | ||
| 0.05 | ||
| 0.12 |
Table 1 continued
| Parameter | Value | |
|---|---|---|
| 3550 (/min/mM) | ||
| 50 (mM) | ||
| minute 3.2 (/min) | ||
| 0.4 (mM) | ||
| 1.26 10-2 (mM) | ||
| 6.4 10-4 (mM) | ||
| 1.0 (mM) | ||
| minute 12.5 (/min) | ||
| 2.22 | ||
| minute 9 (/min) | ||
| 0.109 (mM) | ||
| 0.19 (mM) | ||
| 6.2 10-2 (mM) | ||
| 2.5 10-5 (mM) | ||
| 8.1 10-5 (mM) | ||
| 5.98 10-5 (mM) | ||
| 1.52 (mM) | ||
| 0.00141 (mM) | ||
| minute 2.5 (/min) | ||
| 0.5 (mM) | ||
| 1.94 (mM) | ||
| 38.7 (mM) | ||
| 0.0308 (mM) | ||
| 1.27 10-3 (mM) | ||
| 1.2 | ||
| 1.7 | ||
| 0.4 (mM) | ||
| minute 0.127 (/mM/min) | ||
| 3.115 | ||
| 0.02 (mM) | ||
| minute 1.0 (/min) | ||
| 0.5 (mM) | ||
| 3 10-2 (mM) | ||
| 1.3 (mM) | ||
| 0.15 (mM) | ||
| minute 0.83 (/min) | ||
| 1 |
Table 1 continued
| Parameter | Value | |
|---|---|---|
| 1.13 10-5 (mM) | ||
| 26.7 (mM) | ||
| 6.68 10-9 (mM) | ||
| 5.62 10-6 (mM) | ||
| 3.99 10-2 | ||
| minute 27.75 (/min) | ||
| 0.154 (mM) | ||
| 1.493 (mM) | ||
| 3.1 10-3 (mM) | ||
| minute 0.644 (/min) | ||
| 6.6 | ||
| minute 0.01 (/min) | ||
| 6 (mM) | ||
| 15 | ||
| 1.1 | ||
| 0.05 (muM) | ||
| 126 0.125 (/min/mM) | ||
| 1.66 (/mM) | ||
| 4 (/mM) | ||
| 2.83 (/mM) | ||
| 1.3 (/mM) | ||
| 2.66 (/mM) | ||
| 0.16 (/mM) |
Initial conditions used in our computations are listed in Table 2 and all other initial conditions not listed are zero.
| Parameter | Value | References |
|---|---|---|
| 0.08 (M) | ||
| (M) | ||
| 0.8 | Norel et al, 1991 | |
| 0.4 | Norel et al, 1991 | |
| 10 (mM) | ||
| 0.1 (V) | ||
| 2 (mM) | ||
| 1 (mM) | ||
| 0.2 (mM) | ||
| 1 (mM) |
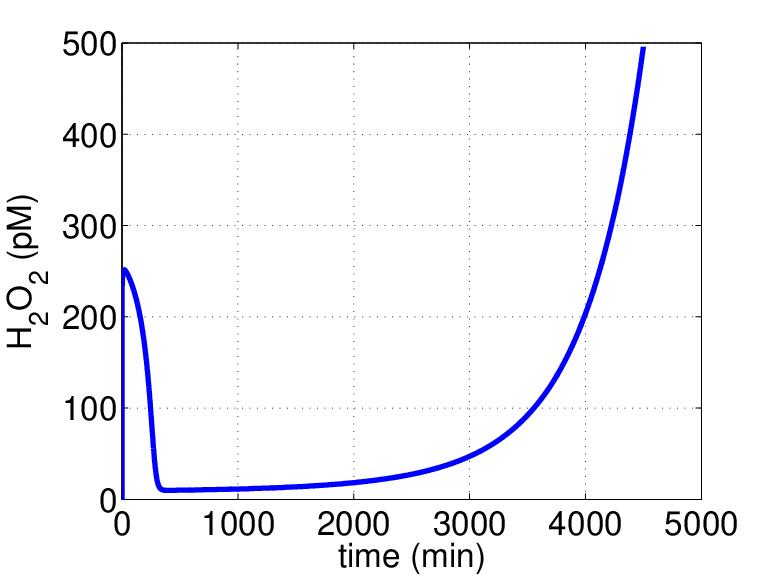
To simulate calcium, ROS, and ATP responses to glucose inputs (Glc), we used the experimental data of the exogenous glucose input obtained by Korach-André et al (2004). The data was extended periodically, as shown in Fig.8. Using MATLAB, we solved numerically the system (22)-(49). Fig.9 shows that the calcium and ROS stay at their equilibrium levels for about 3000 minutes and then increase with time while ATP stays in its homeostasis ranges all the time.


4 Discussion
We established an age-dependent feedback control model to simulate aging calcium and ROS dynamics and their interaction by integrating the existing calcium models, ROS model, and the mitochondrial energy metabolism model. The model approximately reproduced the log phase calcium dynamics. The simulated interaction between the cytosolic calcium and mitochondrial ROS showed that an increase in calcium results in a decrease in ROS initially (in log phase), but the increase-decrease relation was changed to an increase-increase relation when the cell is getting old. The model predicted that the subsystem of the calcium regulators Pmc1p, Pmr1p, and Vex1p is stable, controllable, and observable. These structural properties of the dynamical system could mathematically confirm that cells have evolved delicate feedback control mechanisms to maintain their calcium homeostasis.
Although high levels of ROS are toxic to cells, moderate levels of ROS may be beneficial. In this paper, we only focused on ROS production by mitochondria. Jazwinski and co-workers identified that mitochondrial dysfunction triggers a retrograde response, which is beneficial for lifespan extension (Kirchman et al., 1999; Jazwinsk 2005). Moreover, moderate ROS stimulation enhances autophagy, a vacuolar process that degrades damaged proteins and organelles (Scherz-Shouval and Elazar 2007). We recently found that inability to degrade the ROS-damaged materials inside vacuoles shortens the lifespan (Tang et al., 2008c). On the other hand, over-activation of autophagy usually leads to autophagic cell death (Chen et al., 2007). Including the retrograde response and the vacuole-dependent removal of ROS-damaged materials in our future studies should provide a model about the fine-tuning of ROS.
Mathematical models for the ions H+, Na+, and K+ have been established by Kapela et al (2008) and Pokhilko et al (2006). Our model may be enhanced by including these models. Since the functions of calmodulin and calcineurin depend on pH in cytosol, the integration of the dynamics of ions H+ into our model is important.
In our recent work (Tang and Liu, 2008a), a sensitivity analysis showed that the subsystem of calcium regulators Pmc1p, Pmr1p, and Vcx1p is robust with respect to perturbations of some important parameters, such as the proportional feedback control gains and . In another work (Liu and Tang, 2008), a sensitivity analysis showed that the simulated glucose regulation by insulin is robust with respect to feedback control gains. Thus we speculate that cells may have developed the robustness during their evolution and it can be expected that a similar robustness result can be obtained for the augmented system through a sensitivity analysis. In control engineering, the feedback gain robustness is required in the feedback control designs.
An interesting control problem is to design observer-based output feedback controllers for the subsystem of the calcium regulators. Since we have shown that the subsystem is controllable and observable, such a output feedback controller can be designed. It is interesting to compare the human-designed controllers with the cell-developed controllers and then to apply the cell-developed controller to problems in control engineering.
Acknowledgement
The author thanks Dr. Fusheng Tang for constant discussions on the biology of the addressed problem and Dr. Patricia Kane for providing the data on calcium studies (Forster and Kane, 2000) to validate our model (Fig.4). The author was supported by the University Research Council Fund of the University of Central Arkansas.
References
- [1] Agarwal S., Sharma S., Agrawal V., and Roy N., 2005. Caloric restriction augments ROS defense in S. cerevisiae, by a Sir2p independent mechanism. Free Radic Res., 39(1), 55-62.
- [2] Aguilaniu H., Gustafsson L., Rigoulet M., Nyström T., 2003. Asymmetric inheritance of oxidatively damaged proteins during cytokinesis. Science, 299 (5613),1751-1753.
- [3] Aiello D. P, Fu L., Miseta A., and Bedwell D. M., 2002. Intracellular Glucose 1-Phosphate and Glucose 6-Phosphate Levels Modulate Ca2+ Homeostasis in Saccharomyces cerevisiae. J. Boilogical Chemistry, 277, No. 48, 45751-45758.
- [4] Amdam G. V., Omholt S. W., 2002. The regulatory anatomy of honeybee lifespan. J Theor Biol., 216(2), 209-228.
- [5] Annunziato L, Cataldi M, Pignataro G, Secondo A, and Molinaro P., 2007. Glutamate-Independent Calcium Toxicity. Stroke, 38, 661-664.
- [6] Ashrafi K., Sinclair D., Gordon J. I., Guarente L., 1999. Passage through stationary phase advances replicative aging in Saccharomyces cerevisiae. Proc. Natl. Acad. Sci. U S A, 96 (16), 9100-9105.
- [7] Baran I., 1996. Calcium and cell cycle progression: possible effects of external perturbations on cell proliferation. Biophys J., 70(3), 1198-1213.
- [8] Batiza A. F., Schulz T., and Masson P. H., 1996. Yeast Respond to Hypotonic Shock with a Calcium Pulse. J. Boilogical Chemistry, 271, No. 38, 23357-23362.
- [9] Beckman, K. B. and Ames, B. N., 1998. The free radical theory of aging matures. Physiol. Rev., 78, 547-581.
- [10] Belde P. J ., Vossen J. H., Borst-Pauwels G. W., and Theuvenet A. P., 1993. Inositol 1,4,5-trisphosphate releases Ca2+ from vacuolar membrane vesicles of Saccharomyces cerevisiae. FEBS Lett., 323(1-2), 113-118.
- [11] Bigelow D. J. and Squier T. C., 2005. Redox modulation of cellular signaling and metabolism through reversible oxidation of methionine sensors in calcium regulatory proteins. Biochim Biophys Acta., 1703(2), 121-134.
- [12] Bonilla M., Nastase K. K., and Cunningham K. W., 2002. Essential Role of Calcineurin in Response to Endoplasmic Reticulum Stress. EMBO J. 21, 2343-2353.
- [13] Boustany L. M. and Cyert M. S., 2002. Calcineurin-dependent regulation of Crz1p nuclear export requires Msn5p and a conserved calcineurin docking site. Genes & Dev. 16, 608-619.
- [14] Brookes, P. S., Yoon, Y., Robotham, J. L., Anders, M. W., and Sheu, S. S., 2004. Calcium, ATP, and ROS: a mitochondrial love-hate triangle, Am. J. Physiol. Cell Physiol., 287, C817-C833.
- [15] Chen Y., McMillan-Ward E., Kong J., Israels S. J., Gibson S.B., 2007. Mitochondrial electron-transport-chain inhibitors of complexes I and II induce autophagic cell death mediated by reactive oxygen species. J Cell Sci., 120(Pt 23), 4155-4166.
- [16] Cho J. H., Ko K. M., Singaravelu G., Ahnn J., 2005. Caenorhabditis elegans PMR1, a P-type calcium ATPase, is important for calcium/manganese homeostasis and oxidative stress response. FEBS Lett., 579(3), 778-782.
- [17] Choi J., Chiang A., Taulier N., Gros R., Pirani A., and Husain M., 2006. A calmodulin-binding site on cyclin E mediates Ca2+-sensitive G1/s transitions in vascular smooth muscle cells. Circ Res., 98(10), 1273-1281.
- [18] Cortassa, S, Aon, M. A., Marban, E., Winslow, R. L., O’Rourke, B., 2003. An integrated model of cardiac mitochondrial energy metabolism and calcium dynamics, Biophysical J., 84, 2734-2755.
- [19] Cortassa, S, Aon, M. A., Winslow, R. L., O’Rourke, B., 2004. A mitochondrial oscillator dependent on reactive oxygen species, Biophysical J., 87, 2060-2073.
- [20] Courchesne W. E. and Ozturk S., 2003. Amiodarone induces a caffeine-inhibited, MID1 -depedent rise in free cytoplasmic calcium in Saccharomyces cerevisiae. Molecular Microbiology, 47 (1), 223-234.
- [21] Crabtree G. R., 2001. Calcium, Calcineurin, and the Control of Transcription. J. Biological Chemistry, 276, No. 4, 2313-2316.
- [22] Cronin S. R., Rao R., and Hampton R. Y., 2002. Cod1p/Spf1p is a P-type ATPase involved in ER function and Ca2+ homeostasis. J. Cell Biology, 157, No. 6, 1017-1028.
- [23] Cui J. and Kaandorp J. A., 2006. Mathematical modeling of calcium homeostasis in yeast cells. Cell Calcium, 39, 337-348.
- [24] Cunningham K. W., Fink G. R., 1994. Calcineurin-dependent growth control in Saccharomyces cerevisiae mutants lacking PMC1, a homolog of plasma membrane Ca2+ ATPases. J Cell Biol., 124(3), 351-363.
- [25] Cunningham K. W., Fink G. R., 1996. Calcineurin Inhibits VCX1-Dependent H+/Ca2+ Exchange and Induces Ca2+ ATPases in Saccharomyces cerevisiae. Molecular and Cellular Biology, 16, No. 5, 2226-2237.
- [26] Cyert M. S., 2001. Genetic analysis of calmodulin and its targets in Sacchromyces cerevisiae, Annu. Rev. Genet. 35, 647-672.
- [27] Das A. M. and Harris D. A., 1990. Control of mitochondrial ATP synthase in heart cells: inactive to active transitions caused by beating or positive inotropic agents. Cardiovasc. Res., 24, 411-417.
- [28] Denis V. and Cyert M. S., 2002. Internal Ca2+ release in yeast is triggered by hypertonic shock and mediated by a TRP channel homologue. J. Cell Biology, 156, No. 1, 29-34.
- [29] Díaz J., Martínez-Mekler G., 2005. Interaction of the IP3-Ca2+ and MAPK signaling systems in the Xenopus blastomere: a possible frequency encoding mechanism for the control of the Xbra gene expression. Bull Math Biol., 67(3), 433-465.
- [30] Drakulic T., Temple M. D., Guido R., Jarolim S., Breitenbach M., Attfield P. V. , and Dawes I. W., 2005. Involvement of oxidative stress response genes in redox homeostasis, the level of reactive oxygen species, and ageing in Saccharomyces cerevisiae. FEMS Yeast Res., 5(12), 1215-28.
- [31] Dunn T., Gable K., and Beeler T., 1994. Regulation of Cellular Ca2+ by Yeast Vacuoles. J. Biol. Chem., 269, 7273-7278.
- [32] Terence G. Favero, Anthony C. Zable, and Jonathan J. Abramson, 1995. Hydrogen peroxide stimulates the Ca2+ release channel from skeletal muscle sarcoplasmic reticulum, J. Biol. Chem., 270, No. 43, 25557-25563.
- [33] Finkel, T., 2003. Oxidant signals and oxidative stress, Current Opinion in Cell Biology, 15, 247-254.
- [34] Förster C. and Kane P. M., 2000. Cytosolic Ca2+ Homeostasis Is a Constitutive Function of the V-ATPase in Saccharomyces cerevisiae. J. Biological Chemistry, 275, No. 49, 38245-38253.
- [35] Foster T. C. 2007. Calcium homeostasis and modulation of synaptic plasticity in the aged brain. Aging Cell. 6(3), 319-325.
- [36] Flanagan W. M., Corthesy B., Bram R. J., and Crabtree G. R., 1991. Nuclear association of a T-cell transcription factor blocked by FK-506 and cyclosporin A. Nature 352, 803-807.
- [37] Gillespie C. S., Proctor C. J., Boys R. J., Shanley D. P., Wilkinson D. J., Kirkwood T. B., 2004. A mathematical model of ageing in yeast. J Theor Biol., 229(2), 189-196.
- [38] Gordeeva, A. V, R. A. Zvyagilskaya, and Y. A. Labas, 2003. Cross-Talk between Reactive Oxygen Species and Calcium in Living Cells. Biochemistry (Moscow), Vol. 68, No. 10, pp. 1077-1080.
- [39] Gourlay C. W., Ayscough K. R. 2005. The actin cytoskeleton: a key regulator of apoptosis and ageing? Nat. Rev. Mol. Cell. Biol., 6(7), 583-589.
- [40] Jain J., McCaffrey P. G., Miner Z., Kerppola T. K., Lambert J. N., Verdine G. L., Curran T., and Rao A. 1993. The T-cell transcription factor NFATp is a substrate for calcineurin and interacts with Fos and Jun. Nature 365, 352-355.
- [41] Jazwinski S. M., 2005. Rtg2 protein: at the nexus of yeast longevity and aging. FEMS Yeast Res., 5(12), 1253-1259.
- [42] Kaeberlein M., Kirkland K. T., Fields S., Kennedy B. K., 2004. Sir2-independent life span extension by calorie restriction in yeast. PLoS Biol., 2(9), E296.
- [43] Kaeberlein M., Kennedy B. K., 2005a. Large-scale identification in yeast of conserved ageing genes. Mech. Ageing Dev., 126(1), 17-21.
- [44] Kaeberlein M., Powers R. W. 3rd, Steffen K. K., Westman E. A., Hu D., Dang N., Kerr E. O., Kirkland K. T., Fields S., Kennedy B. K., 2005b. Regulation of yeast replicative life span by TOR and Sch9 in response to nutrients. Science, 310(5751), 1193-1196.
- [45] Kapela, A., Bezerianos, A., Tsoukias, N. M., 2008. A mathematical model of Ca2+ dynamics in rat mesenteric smooth muscle cell: Agonist and NO stimulation, Journal of Theoretical Biology, 253, 238-260.
- [46] Khalil, H. K., 2002. Nonlinear Systems. Prentice Hall, New Jersey.
- [47] Kirchman P. A., Kim S., Lai C. Y., and Jazwinski S.M., 1999. Interorganelle signaling is a determinant of longevity in Saccharomyces cerevisiae. Genetics., 152(1), 179-190.
- [48] Kishi T, Ikeda A, Nagao R, and Koyama N., 2007. The SCFCdc4 ubiquitin ligase regulates calcineurin signaling through degradation of phosphorylated Rcn1, an inhibitor of calcineurin. Proc. Natl. Acad. Sci. U S A, 104(44), 17418-17423.
- [49] Korach-André, M., Roth, H., Barnoud, D., Péan, M. Péronnet, F., and Leverve, X., 2004. Glucose appearance in the peripheral circulation and liver glucose output in men after a large C starch meal. Am. J. Clin. Nutr., 80, 881-886.
- [50] Kowald A., Kirkwood T. B., 2000. Accumulation of defective mitochondria through delayed degradation of damaged organelles and its possible role in the ageing of post-mitotic and dividing cells. J. Theor. Biol., 202(2), 145-160.
- [51] Kuepfer L., Peter M., Sauer U., and Stelling J., 2007. Ensemble modeling for analysis of cell signaling dynamics. Nat. Biotechnol. 25(9), 1001-1006.
- [52] Li Y., Camacho P., 2004. Ca2+-dependent redox modulation of SERCA 2b by ERp57. J Cell Biol., 164(1), 35-46.
- [53] Liu W. and Tang F., 2008. Modeling a Simplified Regulatory System of Blood Glucose at Molecular Levels, J. Theor. Biol., 252, 608-620.
- [54] MacLeod K. J., Vasilyeva E., Baleja J. D., and Forgac M., 1998. Mutational Analysis of the Nucleotide Binding Sites of the Yeast Vacuolar Proton-translocating ATPase. J. Biological Chemistry, 273, No. 1, 150-156.
- [55] Magnus, G., and Keizer, J., 1997. Minimal model of -cell mitochondrial Ca2+ handling, Am. J. Physiol. Cell Physiol., 273, C717-C733.
- [56] Magnus, G., and Keizer, J., 1998. Model of -cell mitochondrial calcium handling and electrical activity. I. Cytoplasmic variables, Am. J. Physiol. Cell Physiol., 274, C1158-C1173.
- [57] Mahieu F., Owsianik G., Verbert L., Janssens A., De Smedt H., Nilius B., and Voets T., 2007. Trpm8-independent mentholl-induced Ca2+ release from endoplasmic reticulum and Golgi. J. Biol. Chem., . 282, Issue 5, 3325-3336.
- [58] Mao L., Zabel C., Wacker M. A., Nebrich G., Sagi D., Schrade P., Bachmann S., Kowald A., and Klose J., 2006. Estimation of the mtDNA mutation rate in aging mice by proteome analysis and mathematical modeling. Exp Gerontol., 41(1), 11-24.
- [59] Matsuura I., Kimura E., Tai K., and Yazawa M., 1993. Mutagenesis of the fourth calcium-binding domain of yeast calmodulin. J. Bio. Chem., 169, 13267-13273.
- [60] McCormack J. G. and Denton R. M., 1993. Mitochondrial Ca2+ transport and the role of intramitochondrial Ca2+ in the regulation of energy metabolism. Dev. Neurosci. 15, 165-173.
- [61] Merz A. J., Wickner W. T., 2004. Trans-SNARE interactions elicit Ca2+ efflux from the yeast vacuole lumen. J. Cell. Biol., 164(2), 195-206.
- [62] Mildaziene V., Baniene R., Nauciene Z., Bakker B. M., Brown G. C., Westerhoff H. V., and Kholodenko B. N., 1995. Calcium indirectly increases the control exerted by the adenine nucleotide translocator over 2-oxoglutarate oxidation in rat heart mitochondria. Arch. Biochem. Biophys. 324, 130-134.
- [63] Miseta A., Kellermayer R., Aiello, D. P., Fu L., and Bedwell D. M., 1999a. The vacuolar Ca2+/H+ exchanger Vcx1p/Hum1p tightly controls cytosolic Ca2+ levels in S. cerevisiae. FEBS Letters, 451, 132-136.
- [64] Miseta A., Fu L., Kellermayer R., Buckley J., and Bedwell D. M., 1999b. The Golgi Apparatus Plays a Significant Role in the Maintenance of Ca2+ Homeostasis in the vps33 Vacuolar Biogenesis Mutant of Saccharomyces cerevisiae. J. Biological Chemistry, 274, No. 9, 5939-5947.
- [65] Miyakawa T., Mizunuma M., 2007. Physiological roles of calcineurin in Saccharomyces cerevisiae with special emphasis on its roles in G2/M cell-cycle regulation. Biosci Biotechnol Biochem., 71(3), 633-645.
- [66] Monteiro G., Kowaltowski A. J., Barros M. H., Netto L. E., 2004. Glutathione and thioredoxin peroxidases mediate susceptibility of yeast mitochondria to Ca2+-induced damage. Arch. Biochem. Biophys. 425(1), 14-24.
- [67] Morris, K. A., 2001. Introduction to Feedback Control. Academic Press, San Diego.
- [68] Murchison D., Griffith W. H., 2007. Calcium buffering systems and calcium signaling in aged rat basal forebrain neurons. Aging Cell., 6(3), 297-305.
- [69] Norel R. and Agur Z., 1991. A model for the adjustment of the mitotic clock by cyclin and MPF levels. Science, 251, no. 4997, 1076 - 1078.
- [70] Ogata, K., 2002. Mordern Control Engineering, Fouth Edtion. Prentice Hall, Upper Saddle River, New Jersey.
- [71] Ohsumi Y. and Anraku Y., 1983. Calcium transport driven by a proton motive force in vacuolar membrane vesicles of Saccharomyces cerevisiae. J. Biol. Chem., 258, 5614-5617.
- [72] Okamura H., Aramburu J., Garcia-Rodriguez C., Viola J. P. B., Raghavan A., Tahiliani M., Zhang X., Qin J., Hogan P. G., and Rao A., 2000. Concerted Dephosphorylation of the Transcription Factor NFAT1 Induces a Conformational Switch that Regulates Transcriptional Activity. Molecular Cell, 6, 539-550.
- [73] Palmer C. P. , Zhou X., Lin J., Loukin S. H., Kung C., and Saimi Y., 2001. A TRP homolog in Saccharomyces cerevisiae forms an intracellular Ca2+-permeable channel in the yeast vacuolar membrane. Proc. Natl. Acad. Sci. U. S. A. 98, 7801-7805.
- [74] Perlin D. S., Harris S. L., Seto-Young D., and Haber J. E., 1989, Defective H+-ATPase of Hygromycin B-resistant pmal Mutants from Saccharomyces cerevisiae. J. Biol. Chem., 264, No. 36, 21857-21864.
- [75] Pinton P., Pozzan T., and Rizzuto1 R., 1998. The Golgi apparatus is an inositol 1,4,5-trisphosphate-sensitive Ca2+ store, with functional properties distinct from those of the endoplasmic reticulum. EMBO Journal, 17, No.18, 5298-5308.
- [76] Pokhilko, A. V., Ataullakhanov, F. I., Holmuhamedov, E. L., 2006. Mathematical model of mitochondrial ionic homeostasis: Three modes of Ca2+ transport, Journal of Theoretical Biology, 243, 152-169.
- [77] Pozos T. C., Sekler I., Cyert M. S., 1996. The product of HUM1, a novel yeast gene, is required for vacuolar Ca2+/H+ exchange and is related to mammalian Na+/Ca2+ exchangers. Mol. Cell. Biol., 16(7), 3730-3741.
- [78] Saavedra-Molina A., Villalobos R., Borbolla M., 1983. Calcium uptake during the cell cycle of Saccharomyces cerevisiae. FEBS Lett. 160(1-2), 195-197.
- [79] Salazar C. and Höfer T., 2003. Allosteric Regulation of the Transcription Factor NFAT1 by Multiple Phosphorylation Sites: A Mathematical Analysis. J. Mol. Biol., 327, 31-45.
- [80] Scherz-Shouval R. and Elazar Z., 2007. ROS, mitochondria and the regulation of autophagy. Trends Cell Biol., 17(9), 422-427.
- [81] Shaw K. T., Ho A. M., Raghavan A., Kim J., Jain J., Park J., Sharma S., Rao A., and Hogan P.G., 1995. Immunosuppressive drugs prevent a rapid dephosphorylation of transcription factor NFAT1 in stimulated immune cells. Proc. Natl. Acad. Sci. 92, 11205-11209.
- [82] Shukla N., Rowe D., Hinton J., Angelini G. D., Jeremy J. Y., 2005. Calcium and the replication of human vascular smooth muscle cells: studies on the activation and translocation of extracellular signal regulated kinase (ERK) and cyclin D1 expression. Eur. J. Pharmacol., 509(1), 21-30.
- [83] Sible J. C., Tyson J. J., 2007. Mathematical modeling as a tool for investigating cell cycle control networks. Methods, 41(2), 238-247.
- [84] Sorin A., Rosas G., and Rao R., 1997. PMR1, a Ca2+-ATPase in Yeast Golgi, Has Properties Distinct from Sarco/endoplasmic Reticulum and Plasma Membrane Calcium Pumps. J. Biol. Chem., 272, No. 15, 9895-9901.
- [85] Squier T. C., Bigelow D.J., 2000. Protein oxidation and age-dependent alterations in calcium homeostasis. Front Biosci. 5, D504-D526.
- [86] Starovasnik M. A., Davis T. N., and Klevit R. E., 1993. Similarities and differences between yeast and vertebrate calmodulin: an examination of the calcium-binding and structural properties of calmodulin from the yeast Saccharomyces cerevisiae. Biochemistry, 32, 3261-3270.
- [87] Stathopoulos-Gerontides A., Guo J. J., and Cyert M. S., 1999. Yeast calcineurin regulates nuclear localization of the Crz1p transcription factor through dephosphorylation. Genes & Dev. 13, 798-803.
- [88] Strayle J., Pozzan T., and Rudolph H. K., 1999. Steady-state free Ca2+ in the yeast endoplasmic reticulum reaches only 10 mM and is mainly controlled by the secretory pathway pump Pmr1. EMBO Journal, 18, No.17,4733-4743.
- [89] Sudbrak R., Brown J., Dobson-Stone C., Carter S., Ramser J., White J., Healy E., Dissanayake M., Larrègue M., Perrussel M., Lehrach H., Munro C. S., Strachan T., Burge S., Hovnanian A., Monaco A. P., 2000. Hailey-Hailey disease is caused by mutations in ATP2C1 encoding a novel Ca2+ pump. Hum. Mol. Genet., 9(7), 1131-1140.
- [90] Suzuki, Y. J., and Ford, G. D., 1991. Inhibition of Ca2+-ATPase of vascular smooth muscle sarcoplasmic reticulum by reactive oxygen intermediates, Am. J. Physiol. 261, H568-H574.
- [91] Suzuki, Y. J., and Ford, G. D., 1992. Superoxide stimulates IP3-induced Ca2+ release from vascular smooth muscle sarcoplasmic reticulum, Am. J. Physiol. 262, H114-H116.
- [92] Swanson C. A., Arkin A. P., Ross J., 1997. An endogenous calcium oscillator may control early embryonic division. Proc. Natl. Acad. Sci. U S A, 94(4), 1194-1199.
- [93] Tang F., Peng Y., Nau J. J., Kauffman E. J., Weisman L. S., 2006. Vac8p, an armadillo repeat protein, coordinates vacuole inheritance with multiple vacuolar processes. Traffic., 7(10), 1368-1377.
- [94] Tang, F. and Liu, W., 2008a. An Age-dependent Feedback Control Model for Calcium in Yeast, Journal of Mathematical Biology, 60 (6), 2010, 849-879
- [95] Tang, F., Bush, J. M., and Liu, W., 2008b. Identification of Longevity Genes with Systems Biology Approaches, (under review).
- [96] Tang, F., Watkins J. W., Bermudez, B., Gray, R., Gaban, G.,, Portie, K., Grace, S., Kleve, M., and Craciun, G., 2008c. A lifespan-extending form of autophagy employs the vacuole-vacuole fusion machinery. (Revised manuscript submitted to Autophagy).
- [97] Tanida I., Hasegawa A., Iida H., Ohya Y., Anraku Y., 1995. Cooperation of calcineurin and vacuolar H+-ATPase in intracellular Ca2+ homeostasis of yeast cells. J. Biol. Chem., 270(17), 10113-10119.
- [98] Thibault O., Gant J. C., Landfield P. W., 2007. Expansion of the calcium hypothesis of brain aging and Alzheimer’s disease: minding the store. Aging Cell. 6(3):307-317.
- [99] Tu B. P., Kudlicki A., Rowicka M., McKnight S. L., 2005. Logic of the yeast metabolic cycle: temporal compartmentalization of cellular processes. Science, 310(5751):1152-1158.
- [100] Ungermann C., Wickner W., Xu Z., 1999. Vacuole acidification is required for trans-SNARE pairing, LMA1 release, and homotypic fusion. Proc. Natl. Acad. Sci. U S A, 96(20), 11194-11199.
- [101] Watson J. B., Khorasani H., Persson A., Huang K. P., Huang F. L., O’Dell T. J., 2002. Age-related deficits in long-term potentiation are insensitive to hydrogen peroxide: coincidence with enhanced autophosphorylation of Ca2+/calmodulin-dependent protein kinase II. J. Neurosci. Res., 70(3), 298-308.
- [102] Wernette M. E., Ochs R. S., and Lardy H. A., 1981. Ca2+ stimulation of rat liver mitochondrial glycerophosphate dehydrogenase. J. Biol. Chem., 256, 12767-12771.
- [103] Yoshimoto H., Saltsman K., Gasch A. P., Li H. X., Ogawa N., Botstein D., Brown P. O., and Cyert M. S., 2002. Genome-wide analysis of gene expression regulated by the calcineurin/Crz1p signaling pathway in Saccharomyces cerevisiae. J. Biol. Chem., 277, 31079-31088.
- [104] Zhang Y. Q., Rao R., 2007. Global disruption of cell cycle progression and nutrient response by the antifungal agent amiodarone. J. Biol. Chem., 282(52), 37844-37853.
- [105] Zinser E., Paltauf F., Daum G., 1993. Sterol composition of yeast organelle membranes and subcellular distribution of enzymes involved in sterol metabolism. J. Bacteriol., 175(10), 2853-2858.