Photocatalytic water oxidation on SrTiO3 [001] surfacesPreprint: LA-UR-22-20654
Abstract
SrTiO3 is a highly efficient photocatalyst for the overall water splitting reaction under UV irradiation. However, an atomic-level understanding of the active surface sites responsible for the oxidation and reduction reactions is still lacking. Here we present a unified experimental and computational account of the photocatalytic activity at the SrO- and TiO2- terminations of aqueous-solvated [001] SrTiO3. Our experimental findings show that the overall water-splitting reaction proceeds on the SrTiO3 surface only when the two terminations are simultaneously exposed to water. Our simulations explain this, showing that the photogenerated hole-driven oxidation primarily occurs at SrO surfaces in a sequence of four single hole transfer reactions, while the TiO2 termination effects the crucial band alignment of the photocatalyst relative to the water oxidation potential. The present work elucidates the interdependence of the two chemical terminations of SrTiO3 surfaces, and has consequent implications for maximizing sustainable solar-driven water splitting.
Keywords:
Density Functional Theory, SrTiO3, photocatalysis, water splittingI Introduction
Photocatalytic water splitting is a promising route to decrease our energy dependence on fossil fuels Kudo and Miseki 2009; Maeda and Domen 2007. Redox-active oxides like TiO2 are ideal material platforms to study and optimize the heterogeneous oxidation and reduction reactions to convert water into H2 and O2 using solar photons as the sole source of energy Rousseau et al. 2020; Linsebigler et al. 1995; Eidsvåg et al. 2021; Miyoshi et al. 2018. Some of the best photocatalysts are oxide materials Rajeshwar 2007; Lee et al. 2021 and specifically perovskite oxides Kanhere and Chen 2014. Perovskite oxide materials have the ability to selectively separate the photogenerated electrons and holes and efficiently transfer them to the semiconductor surfaces, where they can drive the two redox half reactions Li et al. 2013.
SrTiO3 is a prototypical cubic perovskite and was first proposed as photocatalyst for water splitting to generate hydrogen in 1976 Wrighton et al. 1976. Despite having a band gap of 3.25 eV van Benthem et al. 2001 which restricts the photons absorbed to the ultraviolet range of the solar spectrum, SrTiO3 is a well-studied photo-reactive material and serves as a platform for understanding photocatalytic water splitting in more complex systems Wrighton et al. 1976; Giocondi and Rohrer 2003; Kato et al. 2013; Kato and Kudo 2002; Wang et al. 2006; Wei et al. 2009; Niishiro et al. 2005; Konta et al. 2004; Ohsawa et al. 2006; Tanaka et al. 2010; Wang et al. 2009; Subramanian et al. 2006. Thus many different factors influencing the quantum efficiency of SrTiO3 have been investigated. These include, for example, the effects of doping Asai et al. 2014; Furuhashi et al. 2013; Jiang et al. 2020, the influence of different facets Kato et al. 2013; Zhu et al. 2016, and the effects of the pH of the solution Zhang et al. 2020. However, a complete microscopic picture of the photocatalytic process, even in this model system, is missing. A significant reason for this is that many aspects of the process depend on the details of the SrTiO3 surface, and its aqueous interface. Considerable work has been performed in recent years on understanding the photocatalytic nature of these surfaces Zhu et al. 2016; Zhang et al. 2020; Giocondi and Rohrer 2003; Schultz et al. 2011; Ham et al. 2016, but far less is known about the atomistic details of the oxidation mechanism at the aqueous interface Shen et al. 2010. In part this is due to a lack of experimental data obtained from samples designed with controlled surface properties. Such information would be critical in integrating theoretical models and experiments in a unified study Lee et al. 2021.
The oxidation reaction of water to molecular oxygen is a complicated four-electron reaction, coupled to the reduction of water into molecular hydrogen. In heterogeneous photocatalysis, the photogenerated holes drive the water oxidation at the semiconductor surface:
| (1) |
In an overall water-splitting material, the hydrogen production or proton reduction also occurs at the surface:
| (2) |
The two half reactions need to proceed at the same rate or else the full redox reaction will be shut down by charge accumulation. Hence among the factors limiting the quantum efficiency, charge separation is a dominant one Li et al. 2013; Zhu et al. 2016; Zhang et al. 2020; Selcuk and Selloni 2016. This means that the photogenerated electron hole pairs, which in SrTiO3 usually exist in the form of a self-trapped exciton or separated electron and hole polarons Crespillo et al. 2019 need to arrive at their corresponding surface reaction active sites at similar rates in order to maximize the efficiency of the overall water splitting reaction. This idea was already proposed by Zhang et al. Zhang et al. 2020, in their study of photochemical reactivity at different SrTiO3 surfaces.
In this work, we identify the explicit role that surface chemistry and termination have in the overall water splitting reaction in SrTiO3 [001] surfaces, using a combination of experimental and computational approaches. Crucially, our surface treatment techniques allow us to deterministically produce samples with only SrO termination, only TiO2 termination, or a mixture of both.
To experimentally evaluate the redox reaction, we replace Eq. (2) by the reduction of an electron scavenger. Specifically, we observe the reduction of Ag+ into metallic Ag; thus the detection of metallic Ag at the surface of the semiconductor serves as a proxy for the evaluation of the efficiency of the overall redox reaction Giocondi and Rohrer 2003; Schultz et al. 2011; Zhang et al. 2020. These experiments demonstrate that SrTiO3 is only photocatalytically active if both SrO and TiO2 terminations are present on the surface. A microscopic explanation for this result is given by ab initio molecular dynamics simulations (AIMD) of water atop an SrTiO3 slab with the two relevant surfaces exposed to water. In addition to providing a clear atomistic description of these interfaces, the simulation results allow us to evaluate and propose a model for the oxidation reaction at the surface that explains the experimental results. Even more, the combined results provide information on the nature of the photo-excited carriers, by identifying the spatial correlation between the oxidation and reduction sites at the surfaces.
II Photocatalysis on engineered [001] surfaces
The focus of this work is characterizing photocatalysis on the [001] surfaces of SrTiO3. Along the (001) direction the material can be viewed as a stack of alternating TiO2 and SrO planes, and [001] surfaces can be terminated in either of these two planes. Practically, all substrates cut from a crystal will have a small miscut angle so that the surface will not be an exact [001] plane. In the absence of further treatment, the surface of a substrate that has been cut and polished will present a mixture of the two possible terminations. However, there are procedures to obtain atomically-flat surfaces with a well-defined step and terrace structure, typically used as preparation for the growth of epitaxial thin films Kawasaki et al. 1994; Koster et al. 1998; Ohnishi et al. 2004. We leverage these techniques to provide a controlled surface for the study of photocatalysis.
The substrate vendor (Cyrstec) provided us with two type of substrates. (i) untreated substrates, which are just cut and polished and (ii) single termination substrates substrates that had been treated to achieve a TiO2 termination Koster et al. 1998. Untreated substrates were subsequently etched, via high-temperature high-pressure water etching Velasco-Davalos et al. 2013. The water etching method has an advantage over treatments that involve buffered HF in that it avoids F- impurities which can be introduced by traditional buffered hydrofluoric acid etching Chambers et al. 2012. The water treatment leads to mostly pure TiO2 surfaces with patches of SrO. Subsequent annealing can then be used to modify the SrO coverage of the substrates Bachelet et al. 2009a.
Photocatalytic activity on all surfaces is evaluated using the Ag+ proxy reduction method for water splitting developed in Giocondi and Rohrer 2003; Kudo and Miseki 2009; Tiwari and Dunn 2009; Kato et al. 2013. Upon UV illumination, water is oxidized to O2 and H+ (see Eq. (1)) while the reduction of H+ (Eq. (2)) is replaced with the reduction of Ag+ ions, resulting in Ag deposited on the surface. The photocatalytically deposited silver can then be observed using atomic force microscopy (AFM). As explained in the Methods section, our standard experiment is to expose the sample to UV illumination for 5 minutes while it is placed in a AgNO3 solution. When this experiment is performed on an untreated surface (Fig. 1 (a, left)) the silver appears to be deposited fairly uniformly (Fig. 1 (a, right)), with no particular order visible.

Fig. 1 (b, left) shows a sample that was treated using a high pressure water etch, annealed at 650∘C for 24 hrs, retreated, and then annealed again for 24h at 750∘C. The step edges are now visible in the etched sample, but are not very straight. The thermal treatment of this sample has led to residual SrO starting to diffuse towards the step edges. Photocatalyzed silver deposition appears to be associated with the residual SrO, as observed in Fig. 1 (b, right).
That indeed Ag deposition seems to occur in the vicinity of SrO patches is more evident in our next treated sample shown in Fig. 1 (c). This sample is obtained after adding an additional 2hr anneal at 900∘C. This results in the SrO completing its diffusion along the TiO2 step and collecting on the step edge as a 1/2 unit cell layer (Fig. 1 (c, left)). This is most obvious in a line profile taken perpendicular to the step edges (Fig. 2 (a)). Here it can be seen that there is a 0.6 nm jump at each step edge which corresponds to 1.5 unit cell steps, the change from SrO to TiO2 termination happens with a 0.2 nm drop which corresponds to 0.5 unit cell steps. The preference of SrO to segregate along the step edges is a known property Szot and Speier 1999 and a similar surface was previously achieved by Bachelet et al., albeit with a different heat treatment Bachelet et al. 2009a; Bachelet et al. 2009b. After photo-reactivity on this surface, the silver is clearly found in the vicinity of the step edges where the SrO has collected (see Fig.1(c) and Fig.2(a)).


A fully SrO terminated surface can be obtained by replacing the anneal after the second treatment with a sustained high temperature anneal (38hrs at 900∘C). This extended high temperature anneal causes SrO to vertically diffuse from the bulk of the sample Szot and Speier 1999 and produces a highly ordered single termination SrO surface (Fig. 1 (d, left)). As shown in Fig. 2 (b) this surface has single unit cell transitions at the step edges. Remarkably, as observed in Fig. 1 (d, right) little silver is deposited on this surface, indicating that a pure SrO surface is not photocatalytically active.
We also carried out the silver deposition procedure on two TiO2 terminated surfaces. The first is on a TiO2-substrate treated by the vendor with a buffered HF etch and high temperature anneal. Here we observe some silver being deposited, (Fig. 3 (a)) but there is no apparent correlation between the deposition sites and the surface morphology of the film. We associate this small amount of Ag deposited to the presence of F- impurities at the surface.
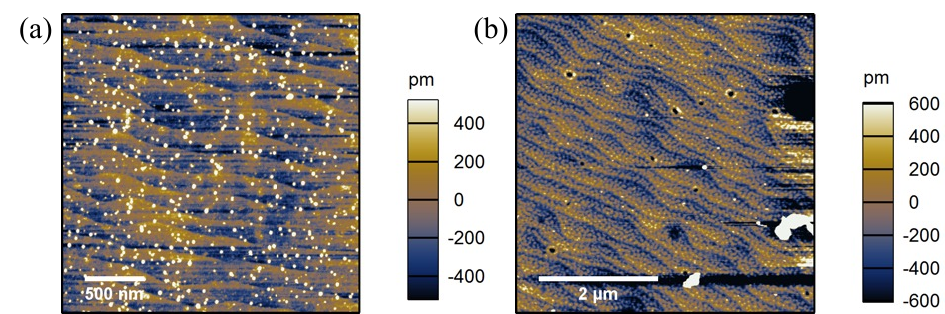
For the second surface, we grew SrTiO3 thin films using an off-axis RF magnetron sputtering on top of vendor-SrTiO3 substrates with TiO2 termination. It is expected that these films will maintain a TiO2 termination. After performing a photocatalytic silver deposition very few silver particles were formed on these surfaces, even if we extend the exposure time to 1 hour, as shown in Fig. 3 (b).
Hence our experiments show that (i) single terminated surfaces (SrO or TiO2) are not photocatatytically active, and (ii) mixed terminated surfaces are active, and Ag is deposited near SrO terminations.
III Atomistic structure of solvated SrTiO3 (001) surfaces
In order to obtain an atomistic picture of the photocatalytic process, we performed ab initio molecular dynamics simulations (AIMD) of a SrTiO3 slab in the presence of liquid water. The slab was 3 unit cells along the (001) direction and unit cells along the in-plane (110) direction. Since we choose to have the slab contain an integer number of unit cells, it is necessarily terminated by a SrO surface on one side, and a TiO2 surface on the other. This choice allows us to explore in one single simulation the structure of the two different terminations. We add 64 water molecules between the periodically-repeated slabs, which we confirmed were enough to screen the two different potential offsets arising from this asymmetric slab.

Fig. 4 shows a snapshot of the simulated system. The two surfaces quickly dissociate water and achieve an equilibrium state within 10 ps of simulation. Experimentally, the presence of OH- at the [001] SrTiO3 surface has been thoroughly studied by Domingo et al. Domingo et al. 2019. As seen in Fig. 4(c), the two surface terminations are active in dissociating water into OH- (which binds to Sr/Ti depending on the surface termination) and H+ (which always binds to surface O atoms). However, the SrO terminated surface is more effective than TiO2 in this task. SrO presents 35 of adsorbed and dissociated water molecules versus 25 for TiO2. In addition, we observe secondary dissociation events at the SrO surface, which cause the additional peak shoulder in Fig. 4(c) (right). These are transient proton transfer reactions between surface OH- and nearby H2O molecules, indicating that this surface has a lower Pka or higher surface acidity Wang et al. 2012 than a TiO2 termination.
IV Electronic structure and Band alignment
Among the many factors that control the photocatalytic efficiency of a semiconductor surface, the relative alignment of the semiconductor band edge and the corresponding redox level in water determines whether the photo-excited carriers can carry the oxidation and reduction reactions. In our case, the reduction half reaction is bypassed by the reduction of Ag+ and we seek to understand the oxidation reaction, and in particular, its dependence on the semiconductor surface termination. To this end, we must obtain the alignment of the valence band edge (VBE) with respect to the electrochemical water oxidation potential Shen et al. 2010; Kharche et al. 2014 for each surface termination. In oxide perovskites (ABO3), the work function difference between the AO- and BO2-terminated (001) surfaces is theoretically predicted to be on the scale of a few eV Zhong and Hansmann 2016; Sung et al. 2020. While the specific case of pure SrTiO3 has been studied in detail using density functional theory (DFT)-based methods Ma et al. 2020; Ricca et al. 2020; Kim et al. 2015, the aqueous interface band alignment remains unexplored. Here we evaluate the electronic structure on samples of the previously described STO slab, after dissociation at the two water exposed surfaces reaches equilibrium. In the procedure proposed by Kharche et al. Kharche et al. 2014, the alignment with respect to vacuum for the solvated slab is done using the 1 level of the bulk water region of the simulated system as a reference. This level is itself aligned with the 1 level obtained from an independent water/vacuum slab calculation. In Fig. 5 we present the vacuum-aligned band edge positions of a fully solvated asymmetric SrTiO3 slab using a hybrid functional HSE06 Heyd et al. 2003; Heyd et al. 2006. The first two columns show the band edges of pure SrO and TiO2 terminated surfaces with respect to vacuum, as reported by Ma et al. Ma et al. 2020, which we use as a reference for nonsolvated systems. Additional calculations and discussion about the dependence of the results on the choice of exchange and correlation functional are presented in the methods and Supplementary Information. The water redox potentials are shown as red dotted lines. As seen in this figure, a pure SrO surface is not favorable for water splitting, given that the corresponding VBE is less positive (that is, closer to vacuum) than the water oxidation potential by eV. On the other hand, pure TiO2 surfaces present a VBE sufficiently positive to catalyze the water oxidation reaction, albeit with a small 0.3 eV overpotential Ma et al. 2020.

The fully solvated SrTiO3 slab used to compute the alignment in Fig. 5 has one of each, i.e. SrO and TiO2 surfaces exposed to water. Hence we refer to this system as a 50 mixed surface slab. Although in vacuum each surface has a different work function, in aqueous solution, the surface water screens completely and within a very short distance (less than 5 Å) the surface dipole due to the other termination, as further discussed in the supplementary information. As a result of the screening that takes place through both dissociation and structural orientation, the band bending at the two surfaces results in more positive VBEs, placing them both eV below the water oxidation potential.
These results indicate that water dissociation, which induces a negative dipole moment (i.e. pointing into the surface) helps with the favorable level alignment for the overall water oxidation reaction at SrTiO3 surfaces. However, the computed energy alignment upon solvation, which places the VBE of the solvated 50 termination slab 2.3 eV below that of the pure SrO unsolvated slab cannot be explained by the induced water screening dipole alone. It was previously observed in Kharche et al. 2014 that this screening could account for an energy lowering of at most 0.5-1.0 eV. In order to achieve an energy alignment sufficient to drive the oxidation reaction it is also necessary for both terminations to be present at the surface. This is because the surface dipole of SrO terminated surfaces is coupled to the corresponding dipole of TiO2 terminations. The overall VBE lowering will depend on the ratio of one termination to another. Our simulation results are obtained for a 50 ratio, but for different ratios, some bowing should be expected Li et al. 2011. This is why pure SrO surfaces cannot drive the oxidation reaction and hence no Ag deposition is observed in the experiments. However, these results are still not adequate to explain why pure TiO2 surfaces are not photocatalytically active, nor do they explain why Ag is deposited at or near SrO terminations. Therefore we augment our theoretical study with additional insights about the water oxidation reaction.
V Photocatalytic water oxidation reactions
Water oxidation on semiconducting surfaces can occur via a sequential four-step proton-coupled electron transfer (PCET) mechanism Shen et al. 2010; Hammes-Schiffer and Galli 2021. Here we compute the free energy changes of four PCET reactions both at the SrO/water and TiO2/water interfaces. The proposed cycle intermediates match the homogeneous reactions for water oxidation in aqueous solutions. At each of these steps, an incident UV photon generates an electron-hole pair. The resulting hole participates in the oxidation of water at an active surface site. These reactions are coupled to the reduction of four Ag+ ions at the surface by the corresponding electrons.

Our proposed four-step PCET cycle for water oxidation at SrTiO3/water interface is shown in Fig. 6(a), where (i)-(v) represent relaxed structures obtained after removing a proton coupled with an electron. The reaction intermediates in the proposed PCET mechanism are identified as: (i) OH- (adsorbed at a surface Sr/Ti), (ii) O∙- (oxygen anion radical), (iii) OOH- (hydroperoxyl radical), (iv) O (superoxide ion), and (v) OH-. Upon removing a proton and an electron from OH-, an oxygen anion radical is formed in the first step, see Fig. 6(a, (i)(ii)). Since there is no longer a proton available at the active species, a neighboring hydrogen-bonded water molecule is chosen and its proton and electron are removed in the second step, (ii)(iii). A geometric relaxation leads to a spontaneous O–O bond formation resulting in a OOH- species at the site. In the third step (iii)(iv), an electron and proton are removed from the intermediate OOH-, which gives rise to a superoxide ion (O) with a shorter O–O bond distance. As shown in Fig. 6(a,iv), the superoxide ion does not immediately dissociate from the surface. Thus in the final step (iv)(v), a concerted electron-proton transfer from yet another neighboring water molecule results in an OH-. This newly formed OH- attacks the active site and replaces the superoxide ion which now leaves its surface position as O2.
| Step | Reaction on | SrO-plane | TiO2-plane | ||||
| SrTiO3 termination | (eV) | dOO (Å) | (eV) | dOO (Å) | |||
| (ii) ∗O∙- + H+ + e- (i) ∗OH- | (ii) | (ii) | |||||
| (iii) ∗OOH- + H+ + e- (ii) ∗O∙- H2O | (iii) | (iii) | |||||
| (iv) ∗O + H+ + e- (iii) ∗OOH- | (iv) | ||||||
| (v) ∗OH- O2 + H+ + e- (iv) ∗O H2O | (v) | ||||||
| ∗OOH- + H+ + e- (i) ∗OH- + H2O | |||||||
| O2 + ∗OH- + H+ + e- ∗OOH- + H2O | |||||||
We have computed the standard Gibbs free energy changes and the standard one-electron reduction potentials () for two active sites on SrO- and three on TiO2-terminations, see Supplementary Information Tables S1 and S2. Table 1 shows a comparison of the mean for the water oxidation pathway on the two surfaces. The mean distance between the interacting oxygens () in any given reaction intermediate is also reported. On the SrO-terminated surface, the first step which entails the conversion of OH- to O∙- is rate-limiting and requires the maximum reduction potential ( 2.1 eV). In photocatalytic oxidation, the overpotential is the excess energy carried by the hole. This energy is supplied by the photogenerated holes that carry excess energy supplied from the absorbed photon. This is often taken as the energy of the valence band edge vs the normal hydrogen electrode (NHE) water oxidation potential at pH . As previously shown, our calculations report this energy to be 0.85 eV for a solvated SrTiO3 slab with 50 TiO2/SrO terminations. This is not sufficient for the reaction to proceed. However, the expected overpotential increases with the proportion of TiO2 at the surface. This explains why in our experiments, all the photocatallytically active samples have a majority of TiO2 composition at the surface. The second step on the SrO-surface follows an energetically downhill path, so the formation of OOH- does not require any energy from the hole. This also suggests that the two-electron process that takes OH OOH- directly, could be more favorable than the sequential one-electron processes. Interestingly, the presence of the intermediate species here proposed has been experimentally observed in these surfaces, albeit without enough information to identify the two different possible terminations Domingo et al. 2019. Table 1 shows that the net potential for a simultaneous two-electron process is 1 eV which makes it energetically accessible for an SrO surface to drive the catalytic cycle with a lower photohole potential.
If we consider the same PCET-based water oxidation mechanism on the TiO2 surface, the results are rather different. The first step requires a lower potential than the corresponding step on the SrO side. However, the consequent step, that is the conversion of O∙- to OOH- is not supported on the TiO2 surface. As seen in Table 1 and in the Supplementary Information, this second PCET reaction does not result in a O-O bond (the relaxed O-O distance is 2.3 Å).
The reasons for the inadequacy of this surface to catalyze the oxidation of the oxygen anion radical are not obvious. Figures 6(b) and (c) show the spin density of the radical O∙- state (Fig. 6(a,ii)) on the SrO (b) and TiO2 (c) surfaces. While this -like orbital is highly localized and perpendicular to the SrO surface, on TiO2 the orbital is parallel to the surface and much more delocalized within the surface oxygens. Hence this is a far less reactive species, given that the nearest H2O molecule, needed for the following PCET reaction is oriented along the nodal plane of the O∙- radical electron.
The lack of formation of a crucial intermediate in the PCET mechanism points to an inability of the TiO2 termination to catalyze the oxidation process. This also explains the lack of reactivity observed on a pure TiO2 termination by AFM experiments, and further supports the observation that an SrO surface is necessary in conjunction with TiO2 for the photocatalytic oxidation of water.
Our theoretical results clearly indicate that the oxidation reaction proceeds only in SrO terminated surfaces. Our experiments also show that Ag+ is reduced at or in the vicinity of these surfaces. Taken together, these results provide indirect information about the nature and localization of the photoexcited carriers. They indicate that both the reduction and oxidation reactions happen in close spatial proximity, and hence the exciton does not break before reaching the surface. This would be consistent with a previously computed exciton radius of 5 Bohr radii and a binding energy of 330 eV Reyes-Lillo et al. 2016.
VI Conclusions
In conclusion, we have presented a combined experimental and computational study of photocatalytical water splitting activity at SrTiO3 [001] surfaces. Using the proxy reaction of Ag+ to Ag reduction we have shown that pure SrO or TiO2 terminations are not photo-active. Ag is only deposited when mixed terminations are present at the surface and deposition occurs near SrO terminations. Our first principles simulations explain these findings and unambiguously show that water oxidation can only occur at SrO surfaces, which efficiently catalyze a four-hole oxidation cycle. TiO2 terminations are needed to provide the correct band energy alignment, but they are unfit to catalyze the necessary surface reactions. These results have important implications for understanding the interplay between surface chemistry and band alignment in semiconductor materials for photocatalytic water splitting. They highlight the importance of achieving a particular surface nanostructure, ideally through bulk synthesis routes or simple chemical/thermal treatments such as those presented in this work. We plan to investigate whether this result can be generalized to other perovskite oxide materials, for which ferroelectricity might provide an additional surface alignment and control handle.
VII Methods
VII.1 Experiments
VII.1.1 Water etching procedure
The etching process takes place within a Parr Microwave Acid Digestion Vessel 4782, a machined PTFE cup sealed within a high-strength, microwave-transparent polymer. The vessel is filled with 20 mL distilled water and the substrate and placed in a Panasonic NN-SN651B inverter microwave oven at power level 3 of 10, for 4 minutes. Etching is followed by annealing in air inside an insulating box on top a MeiVac 2.0” High Temperature Resistive Substrate Heater. As explained in the main text of the manuscript the temperature and duration of the anneals used results in different surfaces.
VII.1.2 Ag deposition
In our photocatalytic silver deposition experiments, each sample was placed in 0.002 mol AgNO3 solution and illuminated with a 100 W Mercury Vapor lamp at a distance of 60cm for 5 minutes. A UV fused silica ground glass diffuser was placed in front of the sample (Edmund Optics NT49-159).
VII.1.3 Sputtering details
SrTiO3 thin films were grown using off-axis RF Magnetron Sputtering. A 35W power was applied to the 1.3” sputter gun. During the growth an atmosphere of 0.24 mbar with an oxygen to argon ratio of 7/16 was maintained and the sample was kept at an elevated temperature of 560∘C.
VII.2 Computational Methodology
VII.2.1 DFT simulations and Molecular dynamics
The DFT-based ab initio molecular dynamics simulations were performed using the SIESTA code with a Generalized Gradient approximate (GGA) exchange-correlation functional. Specifically, the vdW-BH functional was used which includes dispersive corrections for the van der Waals interactions in the system. The SrTiO3 slabs have a cross-sectional area of where the (bulk) lattice constant is Å.
A double-zeta polarized (DZP) basis set was used for the electronic wavefunctions of Sr and Ti, while the O orbitals were described using a long-range quadruple-zeta basis set (QZP). The size of the oxygen basis set was found to have a significant effect on the band-edge positions as the valence band edge mostly consists of O bands. All calculations were spin-polarized, and the GGA+U computations included a Hubbard U correction term of eV for the Ti states Ricca et al. 2020. The SrTiO3 surface calculations were performed with 13-layer surface slabs for both the vacuum-interfacing symmetric SrO- and TiO2- terminated structures, as shown in supplemental figure, Fig. S5. A vacuum region of 15 Å (along the axis) was found to be sufficient to separate the two nonpolar surfaces of a symmetric SrTiO3 slab. The structures used for determining the band edge positions in Fig. 5 were geometrically relaxed until the remnant forces in the system were less than eV/Å. While a large set of simulations in this work were performed with a computationally-efficient GGA-type exchange-correlation functional, the sensitivity of band-related properties to the hierarchy of functional Car 2016 used is widely recognized Ma et al. 2020; Kharche et al. 2014. Hence, we estimate the band-edge positions using a range-separated hybrid functional, HSE06 Heyd et al. 2003; Heyd et al. 2006, as implemented in VASP Kresse and Furthmüller 1996. A plane-wave cutoff of 500 eV was used with the projector augmented-wave (PAW) method of potentials Blöchl 1994 in VASP and the reciprocal space was sampled with a single point at .
The interfacial properties and structure of aqueous SrTiO3 surfaces were analyzed with the help of DFT-based molecular dynamics (MD) simulations. The system consisted of a nonpolar SrTiO3 slab with a box of 64 H2O molecules adjacently placed along the axis. Unlike the case of SrTiO3/vacuum symmetric interfaces, in the fully solvated SrTiO3/H2O system, water makes contact with two different chemical terminations (SrO/H2O and TiO2/H2O) at once, see Fig. 4(a). In our MD simulations of solvated SrTiO3 system, the SrTiO3 slab comprised 3-layers each of SrO and TiO2. The SrO- and TiO2- terminations were separated by Å region of water. Based on the (planar-averaged) macroscopic electrostatic potential of the solvated system, it was confirmed that the water region screens the two asymmetric-terminated surfaces and that there is no net charge transfer from one surface to the other, see supplemental figure Fig. S3.
At the beginning of MD simulation, the surfaces were non-hydroxylated (no water dissociation). A GGA-type vdW-BH functional was used in SIESTA to perform a 20 picoseconds (ps) long MD simulation with a time-step of 0.5 femtoseconds (fs). During this MD, the hydrated slab is annealed to a temperature of K using a velocity rescaling thermostat, and water interacts with TiO2 surface on one side and SrO on the other giving different amounts of dissociation on both sides.
VII.2.2 Band Alignment
Our current work focuses on a qualitative understanding of the energy level alignment for different (001) SrTiO3 surface terminations in conjunction with vacuum and water. Hence, several components of this study employ the GGA and GGA+U levels of theory, where we choose eV following the work of refRicca et al. 2020. In order to further refine the results of our GGA-based simulations, we obtain the band edges of the SrTiO3 slab systems with HSE06 in Fig. 5. This allows for a more accurate quantitative comparison of the energy levels. Extended results obtained with DFT+U are presented in the Supplementary information, see Fig. S4. These results also include level alignments for slabs solvated with a single monolayer of water.
The band edges for SrTiO3/vac. slabs are determined using a surface-vacuum alignment technique in which the VBE is given by the difference between the vacuum level derived from the electrostatic potential of the slab model and the highest occupied level (HOMO) in the system. Similarly, the conduction band edge is given by the difference between the vacuum level and the lowest unoccupied energy level (LUMO) of the slab. The band alignments for the symmetric terminations of SrO/vac and TiO2/vac are given in Supplemental section S2.
For the fully solvated SrTiO3/H2O interfaces, we obtain the position of the peak, which marks the highest occupied state in the bulk-region of water and reference it to the vacuum obtained from a pure water-slab calculation. This amounts to an energy-shift of the kind: . The band edge energy (HOMO and LUMO) levels of the full SrTiO3/H2O system are then aligned with respect to the level of water. In the absence of an exact ‘vacuum level’ in the case of solvated SrTiO3 surfaces, the level serves as a natural datum against which the band energies can be compared. A detailed account of the band alignment in SrTiO3/water surfaces is given in the Supplemental section S4.
VII.2.3 Modelling of photocatalytic water oxidation
We consider several SrO- and TiO2-terminated water-oxidation sites and the associated redox potentials are reported in Supplemental Tables S1, S2. In our ab initio simulations, we do not explicitly model a photon adsorption event or the photogenerated charge carrier separation. We assume that the hole while being generated in the bulk of the catalyst (SrTiO3) becomes available at the top of the valence band to oxidize water and release oxygen. At each step of our proposed water oxidation mechanism, one is given to understand that an electron is removed from the active site region (in our case, the SrTiO3 slab) filling a photohole generated in the aqueous reservoir. While the charge transfer phenomenon at the intersection of SrTiO3 slab and physisorbed water is of primary interest, we find that the interaction between surface-dissociated water species and the remainder bulk solvent plays a crucial mechanistic role too. Hence in this study we go beyond the implicit-solvent model of Shen et al. Shen et al. 2010 and explicitly consider all of the water molecules in the solvated SrTiO3 system. The presence of bulk water beyond the first adsorbed monolayer at the catalyst surface acts as a reservoir for coupling the loss of a proton with an oxidation event. From a single equilibrated MD trajectory, we select a snapshot such as Fig. 6(i), and evaluate the completion of the proposed cycle. Following this, at each PCET step, a proton and an electron (that is, a hydrogen atom) are removed from either a hydroxide ion dissociated on the SrTiO3 surface or a water molecule that is hydrogen-bonded to the target surface intermediate. As the geometric optimization of each intermediate structure is carried out at K, the temperature effects are not considered explicitly, however, the initial structure of a PCET cycle is always derived from a thermostated parent trajectory. Apart from considering a fully solvated periodic system, our calculations of free energy changes and standard reduction potentials follow a similar procedure as outlined in our previous work by Shen et al. Shen et al. 2010. In addition, we allow for a complete relaxation of the solvent in the system, and after each proton removal we observe that the water molecules near the active site rearrange to initiate the following reaction in the cycle. We also note that, despite using a semi-local exchange and correlation (XC) potential, namely vdW-BH Berland and Hyldgaard 2014, the localization of the photohole on the initial reaction species is rather independent of the XC potential Sharma and Fernández-Serra 2020. We also confirmed that systems (i) and (iii) in Fig. 6 are singlets and systems (ii) and (iv) are electronic doublets.
Gibbs free energy and Standard reduction potentials.
The standard redox potentials were computed with respect to the normal hydrogen electrode (NHE). As a photocatalyst, SrTiO3 supplies an overpotential defined in this case as the difference between VBE and NHE Takanabe 2017; Li and Wu 2015. The standard free energy for the one-electron hydrogen oxidation reaction at NHE is given by,
| (3) | ||||
where eV, is the standard free energy of a gas-phase H2 molecule computed using methods consistent with the other calculations in this work. also contains the contribution of vibrational zero-point energies (ZPEs) III 2020. The standard free energy of a gas-phase electron, eV, was obtained using the Fermi-Dirac statistics Bartmess 1994. The standard free energy of a solvated proton, eV, was computed using the free energy of a gas-phase proton , and the experimental solvation energy of the proton McQuarrie 1975; Tissandier et al. 1998. Thus, using Eq. (3) we obtain the standard oxidation potential of the NHE, eV. The Gibbs free energy change computed at each step of the PCET cycle () include the ZPEs of the respective reaction intermediates. On the absolute scale,
| (4) | ||||
where the successive PCET steps differ in one proton and electron () pair, and the second and fourth steps borrown a H2O molecule from the interacting bulk water reservoir. On the physical (NHE) scale, the Gibbs free energy changes and the standard one-electron reduction potentials translate to . A detailed description of the water-oxidation PCET mechanism and the band alignment at the interface of SrTiO3/water can be found in the Supplementary Information and in Sharma 2021.
Input files and Jupyter notebooks outlines various calculations are provided in a data repository associated with this manuscript dat.
Acknowledgements.
M.D, A.L and B.B were supported by NSF DMR-1055413 and DMR-1334867. M. F-S and V.S were funded by the U.S. Department of Energy, Office of Science, Basic Energy Sciences, under Awards DE-SC0001137 and DE-SC0019394, as part of the CCS and CTC Programs. The authors thank Stony Brook Research Computing and Cyberinfrastructure, and the Institute for Advanced Computational Science at Stony Brook University for access to the high-performance SeaWulf computing system, which was made possible by a $1.4M National Science Foundation grant (#1531492). B.P. acknowledges National Science Foundation (Platform for the Accelerated Realization, Analysis, and Discovery of Interface Materials (PARADIM)) under Cooperative Agreement No. DMR-2039380. CED acknowledges support from the National Science Foundation under Grant No. DMR-1918455. The Flatiron Institute is a division of the Simons Foundation.References
- Kudo and Miseki (2009) A. Kudo and Y. Miseki, Chem. Soc. Rev. 38, 253 (2009).
- Maeda and Domen (2007) K. Maeda and K. Domen, The Journal of Physical Chemistry C 111, 7851 (2007).
- Rousseau et al. (2020) R. Rousseau, V.-A. Glezakou, and A. Selloni, Nature Reviews Materials 5, 460 (2020).
- Linsebigler et al. (1995) A. L. Linsebigler, G. Lu, and J. T. Yates, Chemical Reviews 95, 735 (1995).
- Eidsvåg et al. (2021) H. Eidsvåg, S. Bentouba, P. Vajeeston, S. Yohi, and D. Velauthapillai, Molecules 26, 10.3390/molecules26061687 (2021).
- Miyoshi et al. (2018) A. Miyoshi, S. Nishioka, and K. Maeda, Chemistry – A European Journal 24, 18204 (2018).
- Rajeshwar (2007) K. Rajeshwar, Journal of Applied Electrochemistry 37, 765 (2007).
- Lee et al. (2021) D. Lee, W. Wang, C. Zhou, X. Tong, M. Liu, G. Galli, and K.-S. Choi, Nature Energy 6, 287 (2021).
- Kanhere and Chen (2014) P. Kanhere and Z. Chen, Molecules 19, 19995 (2014).
- Li et al. (2013) R. Li, F. Zhang, D. Wang, J. Yang, M. Li, J. Zhu, X. Zhou, H. Han, and C. Li, Nature Communications 4, 1432 (2013).
- Wrighton et al. (1976) M. S. Wrighton, A. B. Ellis, P. T. Wolczanski, D. L. Morse, H. B. Abrahamson, and D. S. Ginley, Journal of the American Chemical Society 98, 2774 (1976).
- van Benthem et al. (2001) K. van Benthem, C. Elsässer, and R. H. French, Journal of Applied Physics 90, 6156 (2001).
- Giocondi and Rohrer (2003) J. L. Giocondi and G. S. Rohrer, Journal of the American Ceramic Society 86, 1182 (2003).
- Kato et al. (2013) H. Kato, M. Kobayashi, M. Hara, and M. Kakihana, Catal. Sci. Technol. 3, 1733 (2013).
- Kato and Kudo (2002) H. Kato and A. Kudo, The Journal of Physical Chemistry B 106, 5029 (2002).
- Wang et al. (2006) D. Wang, J. Ye, T. Kako, and T. Kimura, The Journal of Physical Chemistry B 110, 15824 (2006).
- Wei et al. (2009) W. Wei, Y. Dai, H. Jin, and B. Huang, Journal of Physics D: Applied Physics 42, 055401 (2009).
- Niishiro et al. (2005) R. Niishiro, H. Kato, and A. Kudo, Phys. Chem. Chem. Phys. 7, 2241 (2005).
- Konta et al. (2004) R. Konta, T. Ishii, H. Kato, and A. Kudo, The Journal of Physical Chemistry B 108, 8992 (2004).
- Ohsawa et al. (2006) T. Ohsawa, K. Nakajima, Y. Matsumoto, and H. Koinuma, Applied Surface Science 252, 2603 (2006), proceedings of the Third Japan-US Workshop on Combinatorial Material Science and Technology.
- Tanaka et al. (2010) R. Tanaka, S. Takata, M. Katayama, R. Takahashi, J. K. Grepstad, T. Tybell, and Y. Matsumoto, Journal of The Electrochemical Society 157, E181 (2010).
- Wang et al. (2009) D. Wang, T. Kako, and J. Ye, The Journal of Physical Chemistry C 113, 3785 (2009).
- Subramanian et al. (2006) V. Subramanian, R. K. Roeder, and E. E. Wolf, Industrial & Engineering Chemistry Research 45, 2187 (2006).
- Asai et al. (2014) R. Asai, H. Nemoto, Q. Jia, K. Saito, A. Iwase, and A. Kudo, Chem. Commun. 50, 2543 (2014).
- Furuhashi et al. (2013) K. Furuhashi, Q. Jia, A. Kudo, and H. Onishi, The Journal of Physical Chemistry C 117, 19101 (2013).
- Jiang et al. (2020) J. Jiang, K. Kato, H. Fujimori, A. Yamakata, and Y. Sakata, Journal of Catalysis 390, https://doi.org/10.1016/j.jcat.2020.07.025 (2020).
- Zhu et al. (2016) Y. Zhu, P. A. Salvador, and G. S. Rohrer, Chemistry of Materials 28, 5155 (2016).
- Zhang et al. (2020) M. Zhang, P. A. Salvador, and G. S. Rohrer, ACS Applied Materials & Interfaces 12, 23617 (2020).
- Schultz et al. (2011) A. M. Schultz, Y. Zhang, P. A. Salvador, and G. S. Rohrer, ACS Applied Materials & Interfaces 3, 1562 (2011).
- Ham et al. (2016) Y. Ham, T. Hisatomi, Y. Goto, Y. Moriya, Y. Sakata, A. Yamakata, J. Kubota, and K. Domen, Journal of Materials Chemistry A 4, 3027 (2016).
- Shen et al. (2010) X. Shen, Y. A. Small, J. Wang, P. B. Allen, M. V. Fernández-Serra, M. S. Hybertsen, and J. T. Muckerman, The Journal of Physical Chemistry C 114, 13695 (2010).
- Selcuk and Selloni (2016) S. Selcuk and A. Selloni, Nature Materials 15, 1107 (2016).
- Crespillo et al. (2019) M. Crespillo, J. Graham, F. Agulló-López, Y. Zhang, and W. Weber, Crystals 9, 95 (2019).
- Kawasaki et al. (1994) M. Kawasaki, K. Takahashi, T. Maeda, R. Tsuchiya, M. Shinohara, O. Ishiyama, T. Yonezawa, M. Yoshimoto, and H. Koinuma, Science 266, 1540 (1994).
- Koster et al. (1998) G. Koster, B. L. Kropman, G. J. Rijnders, D. H. Blank, and H. Rogalla, Applied Physics Letters 73, 2920 (1998).
- Ohnishi et al. (2004) T. Ohnishi, K. Shibuya, M. Lippmaa, D. Kobayashi, H. Kumigashira, M. Oshima, and H. Koinuma, Applied physics letters 85, 272 (2004).
- Velasco-Davalos et al. (2013) I. Velasco-Davalos, R. Thomas, and A. Ruediger, Applied Physics Letters 103, 202905 (2013).
- Chambers et al. (2012) S. Chambers, T. Droubay, C. Capan, and G. Sun, Surface Science 606, 554 (2012).
- Bachelet et al. (2009a) R. Bachelet, F. Sánchez, F. J. Palomares, C. Ocal, and J. Fontcuberta, Applied Physics Letters 95, 141915 (2009a).
- Tiwari and Dunn (2009) D. Tiwari and S. Dunn, Journal of Materials Science 44, 5063 (2009).
- Szot and Speier (1999) K. Szot and W. Speier, Physical Review B 60, 5909 (1999).
- Bachelet et al. (2009b) R. Bachelet, F. Sánchez, J. Santiso, C. Munuera, C. Ocal, and J. Fontcuberta, Chemistry of materials 21, 2494 (2009b).
- Domingo et al. (2019) N. Domingo, E. Pach, K. Cordero-Edwards, V. Pérez-Dieste, C. Escudero, and A. Verdaguer, Physical Chemistry Chemical Physics 21, 4920 (2019).
- Wang et al. (2012) J. Wang, L. S. Pedroza, A. Poissier, and M. V. Fernández-Serra, The Journal of Physical Chemistry C 116, 14382 (2012).
- Kharche et al. (2014) N. Kharche, J. T. Muckerman, and M. S. Hybertsen, Physical review letters 113, 176802 (2014).
- Zhong and Hansmann (2016) Z. Zhong and P. Hansmann, Phys. Rev. B 93, 235116 (2016).
- Sung et al. (2020) H.-J. Sung, Y. Mochizuki, and F. Oba, Phys. Rev. Materials 4, 044606 (2020).
- Ma et al. (2020) T. Ma, R. Jacobs, J. Booske, and D. Morgan, APL Materials 8, 071110 (2020).
- Ricca et al. (2020) C. Ricca, I. Timrov, M. Cococcioni, N. Marzari, and U. Aschauer, Phys. Rev. Research 2, 023313 (2020).
- Kim et al. (2015) T. W. Kim, Y. Ping, G. A. Galli, and K.-S. Choi, Nature Communications 6, 8769 (2015).
- Heyd et al. (2003) J. Heyd, G. E. Scuseria, and M. Ernzerhof, The Journal of Chemical Physics 118, 8207 (2003).
- Heyd et al. (2006) J. Heyd, G. E. Scuseria, and M. Ernzerhof, The Journal of Chemical Physics 124, 219906 (2006).
- Li et al. (2011) L. Li, J. T. Muckerman, M. S. Hybertsen, and P. B. Allen, Phys. Rev. B 83, 134202 (2011).
- Hammes-Schiffer and Galli (2021) S. Hammes-Schiffer and G. Galli, Nature Energy 6, 700 (2021).
- Reyes-Lillo et al. (2016) S. E. Reyes-Lillo, T. Rangel, F. Bruneval, and J. B. Neaton, Phys. Rev. B 94, 041107 (2016).
- Car (2016) R. Car, Nature Chemistry 8, 820 (2016).
- Kresse and Furthmüller (1996) G. Kresse and J. Furthmüller, Phys. Rev. B 54, 11169 (1996).
- Blöchl (1994) P. E. Blöchl, Phys. Rev. B 50, 17953 (1994).
- Berland and Hyldgaard (2014) K. Berland and P. Hyldgaard, Phys. Rev. B 89, 035412 (2014).
- Sharma and Fernández-Serra (2020) V. Sharma and M. Fernández-Serra, Phys. Rev. Research 2, 043082 (2020).
- Takanabe (2017) K. Takanabe, ACS Catalysis 7, 8006 (2017).
- Li and Wu (2015) J. Li and N. Wu, Catal. Sci. Technol. 5, 1360 (2015).
- III (2020) R. D. J. III, NIST Computational Chemistry Comparison and Benchmark Database (2020).
- Bartmess (1994) J. E. Bartmess, The Journal of Physical Chemistry 98, 6420 (1994).
- McQuarrie (1975) D. A. D. A. McQuarrie, Statistical mechanics / Donald A. McQuarrie, Harper’s chemistry series (Harper & Row, New York, 1975) “Portions of this work were originally published under the title: Statistical thermodynamics.”.
- Tissandier et al. (1998) M. D. Tissandier, K. A. Cowen, W. Y. Feng, E. Gundlach, M. H. Cohen, A. D. Earhart, J. V. Coe, and T. R. Tuttle, The Journal of Physical Chemistry A 102, 7787 (1998).
- Sharma (2021) V. Sharma, Density Functional Theory Studies of Water Structure and Photo-Reactivity in Oxide Materials, Ph.D. Thesis (2021).
- (68) Zenodo data repository.
Supplementary Information for
Photocatalytic water oxidation in SrTiO3 [001] surfaces
Vidushi Sharma1,2,3,4, Benjamin Bein1, Amanda Lai1, Betül Pamuk5, Cyrus E. Dreyer1,6, Marivi Fernández-Serra1,2 and Matthew Dawber1
1Department of Physics and Astronomy, Stony Brook University, Stony Brook, NY 11794-3800, USA
2Institute for Advanced Computational Science, Stony Brook University, Stony Brook, NY 11794-3800, USA
3Theoretical Division, Los Alamos National Laboratory, Los Alamos, NM 87545, USA
4Center for Nonlinear Studies (CNLS), Los Alamos National Laboratory, Los Alamos, NM 87545, USA
5School of Applied and Engineering Physics, Cornell University, Ithaca, NY 14853, USA
6Center for Computational Quantum Physics, Flatiron Institute, 162 5th Avenue, New York, NY 10010, USA
(Dated: August 11, 2026)
S1 Water dissociation at [001] surfaces

S2 [001] symmetric-termination slabs
The structures are geometrically relaxed within the DFT ( eV) formulation in SIESTA until the atomic forces are less than 0.01 eV/Å. In the following sections, electrostatic potential () is defined as the sum of the Hartree potential and the local pseudopotential at the grid used for DFT simulations. It differs from the total potential by the exchange-correlation potential term. is averaged within the plane for each atomic layer to give the ‘microscopic’ potential () along the direction. is then averaged out of the plane to yield the macroscopic potential . The valence band maximum (HOMO) and conduction band minimum (LUMO) are derived from the eigenvalues given by DFT.

S2.1 [001] SrO-terminated slab
The eigenvalues from DFT are aligned to the vacuum level using the ‘zero’ of the electrostatic potential. The vacuum-aligned projected density of states are shown in Fig. S3. The valence and conduction band edges referenced to the vacuum are eV and eV respectively.

S2.2 [001] TiO2-terminated slab
The zero of the projected density of states is shifted to match the vacuum level of the electrostatic potential, see Fig. S4. The band edges are hence located at eV and eV.

S3 Water energy level alignment
The water slab comprising 96 H2O is approximately 20 Å thick and alternates with 30 Å region of vacuum. A Born-Oppenheimer molecular dynamics thermostatted to K is performed in order to simulate the dynamic properties of water. From a 5 ps long equilibrated trajectory, 20 snapshots are selected and for each of these 20 geometries, the electrostatic potential and electronic density of states are computed using a GGA-type functional (vdW-BH). The electrostatic potential and density of states are aligned to the vacuum level similar to the case of semiconductor band alignments discussed previously.
Figure S5 shows the planar-averaged electrostatic potential () along the direction and the density of states of Oxygen- orbitals, averaged over 20 snapshots. The macroscopic potential is determined for the bulk-like region of the water slab spanning an 8 Å region (shown in blue) and the projected density of states are used to determine the position of the peak in bulk water (pink dashed line).

S4 Electrochemical energy level alignment at H2O surfaces
The electrostatic potentials are computed for 20 snapshots of SrTiO3/H2O system over a 5 ps time window of an equilibrated MD simulation. These are first averaged over the plane to obtain the microscopic potential along the direction for each individual snapshot, and then an average over all the snapshots is obtained to generate shown in red in Fig. S6. appears mostly flat in the bulk-like region of water ( Å and Å, in Fig. S6) implying that water screens the charge due to the asymmetric terminations of SrTiO3. From the density of states projected on the orbitals belonging to Oxygen-water, we obtain the peak at eV (green dashed line). The highest occupied and lowest unoccupied energy levels are located at eV and eV respectively. In order to align the energy levels across the semiconductor-water interfaces, we shift the peak to the level from the water-slab calculation shown in Fig. S5. Thus, applying a rigid eV shift to match the levels of water, the valence and conduction band edges are found at eV and eV respectively. The band alignment of the semiconductor band edges and the water redox potentials is shown in Fig. S7. This was obtained at the GGA+U level using a quadruple-zeta basis set for Oxygens.


S5 Proton-coupled electron transfer (PCET) at SrO- and -terminated surfaces
| Step | Reaction on | Site | Site | ||||
| SrO-termination | (eV) | dOO (Å) | (eV) | dOO (Å) | |||
| (ii) ∗O∙- + H+ + e- (i) ∗OH- | (ii) | (ii) | |||||
| (iii) ∗OOH- + H+ + e- (ii) ∗O∙- H2O | (iii) | (iii) | |||||
| (iv) ∗O + H+ + e- (iii) ∗OOH- | (iv) | (iv) | |||||
| (v) ∗OH- O2 + H+ + e- (iv) ∗O H2O | (v) | (v) | |||||
| ∗OOH- + H+ + e- (i) ∗OH- + H2O | |||||||
| O2 + ∗OH- + H+ + e- ∗OOH- + H2O | |||||||
| Step | Reaction on | Site | Site | Site | |||||
|---|---|---|---|---|---|---|---|---|---|
| TiO2-termination | (eV) | dOO (Å) | (eV) | dOO (Å) | (eV) | dOO (Å) | |||
| (ii) ∗O∙- + H+ + e- (i) ∗OH- | (ii) | (ii) | (ii) | ||||||
| (iii) ∗OOH- + H+ + e- (ii) ∗O∙- H2O | (iii) | (iii) | (iii) | ||||||
| [NO ∗OOH- formation] | |||||||||

