Accreting on the edge: a luminosity-dependent cyclotron line in the Be/X-ray Binary 2S 1553-542 accompanied by accretion regimes transition
Abstract
Accreting X-ray pulsars (XRPs) undergo luminous X-ray outbursts during which the luminosity-dependent spectral and timing features of the neutron star’s emission can be analyzed in detail, thus shedding light on the accretion regime at work. We took advantage of a monitoring campaign performed with NuSTAR, Swift/XRT, AstroSat and NICER, to follow the Be/X-ray Binary 2S 1553-542 along one of its rare outbursts and trace its spectral and timing evolution. We report the discovery of a luminosity-dependent cyclotron line energy for the first time in this source. The pulse profiles and pulsed fraction also show variability along the outburst, consistently with the interpretation that the source transitions from the sub-critical to the super-critical accretion regime, separated by a critical luminosity of erg/s.
Keywords:
X-ray binary stars – stars: neutron – pulsars: individual: 2S 1553-542 – accretion, accretion disks – magnetic fieldsI Introduction
Accreting X-ray pulsars (XRPs) are binary systems where a neutron star (NS) accretes matter supplied by a donor companion star via stellar wind or Roche-lobe overflow. Most of them pertain to the subclass of Be/X-ray Binaries (BeXRBs), in which the donor companion is a B star whose circumstellar decretion disk shows H Balmer emission lines.
2S 1553-542 is a BeXRB discovered with the SAS-3 observatory (Walter 1976), which also detected pulsations at about 9.3 s several years later (Kelley et al. 1982). Only a few X-ray outbursts have been observed from this source (see Tsygankov et al. 2016, and references therein). The optical companion has been identified as a B1-2V type star (Lutovinov et al. 2016), and the system lies at a distance of kpc (Tsygankov et al. 2016). No Gaia counterpart is found in the Early Data Release 3 (Fabricius et al. 2021) within from the SIMBAD astronomical database (Wenger et al. 2000) source position, nor from the Chandra source position determined by Lutovinov et al. 2016.

As observed by Chandra and Swift/XRT (Lutovinov et al. 2012) and RXTE/PCA (Pahari & Pal 2012), the source average spectrum can be fit with a highly absorbed (Ncm-2) cutoff power-law modified by a blackbody component (kTkeV) plus an Iron K emission line at 6.4 keV. Moreover, during the previous outburst observed with NuSTAR in 2015, a Cyclotron Resonant Scattering Feature (CRSF, or cyclotron line) was identified in the spectrum around 25 keV (Tsygankov et al. 2016). A cyclotron line is an important diagnostic of the physics in the X-ray emission region. The energy of the fundamental line, , probes the magnetic field strength at the site of spectral emission, keV, where is the magnetic field in units of G, and is the gravitational redshift (see Staubert et al. 2019 for a recent review). Moreover, has been observed to be luminosity-dependent in some sources (Staubert et al. 2019). Such luminosity-dependence appears to be either positive or negative, according to the NS accretion regime. In fact, the dominant physical mechanisms that drive the accretion flow on the NS surface are distinguished according to the so-called critical luminosity, above which a radiation-dominated radiative shock occurs within the accreting structure at the magnetic poles (Davidson & Ostriker 1973; Basko & Sunyaev 1976; Becker et al. 2012; Mushtukov et al. 2015a).
Recently, 2S 1553-542 has undergone a new outburst episode (Nakajima et al. 2019), and we initiated a comprehensive observational campaign with NuSTAR, AstroSat and NICER, during which the source was also observed with Swift/XRT. Thanks to this, the source was observed at two different outburst stages – one near the peak of the outburst, at a luminosity that is about brighter than that observed during the previous outburst, and the other towards the end of the outburst – thus bracketing the luminosity previously covered by the NuSTAR observation in 2015. Here we present the results of our study in terms of the spectral and timing characteristics of 2S 1553-542 and argue that the source has been observed undergoing an accretion regime transition.
II Data reduction
| ObsID | MJD | Exposure | |
|---|---|---|---|
| (Start) | [ks] | ||
| Swift/XRT | 000310960[08-10] | 59233.8 | 4.3 |
| NuSTAR | 90701302002 | 59236.9 | 28.3 |
| SXT | 9000004204 | 59268.2 | 18.8 |
| LAXPC | 9000004204 | – | 37.0 |
| NICER | 3202030101 | 59268.1 | 1.4 |
A log of all used observations is shown in Table 1, while a light curve of the outburst is shown in Fig. 1. Hereafter we refer to Obs. I as that including Swift/XRT and NuSTAR data, and to Obs. II as that including NICER and AstroSat data, which were taken almost simultaneously, respectively. Spectra were rebinned to have at least counts per bin. As advised by the instruments teams, a systematic error of 1% has been applied for all spectra from Obs. II. Spectral data were analyzed using XSPEC v12.11.1c (Arnaud 1996).
II.1 NuSTAR
NuSTAR (Harrison et al. 2013) was launched in 2012. It is currently the only X-ray mission with a telescope able to focus hard X-rays up to 79 keV. NuSTAR consists of two identical co-aligned telescopes that focus X-ray photons onto two independent Focal Plane Modules, FPMA and FPMB. At the focus of each telescope module are four () solid-state cadmium zinc telluride (CdZnTe) imaging detectors. These provide wide-band (3–79 keV) energy coverage with a FWHM of and a spectral resolution of 400 eV at 10 keV.
NuSTAR observed 2S 1553-542 on 2021 January 22 (ObsID 90701302002, MJD 59236, Malacaria et al. 2021). The total exposure time was about 28 ks. NuSTAR data were reduced with NUSTARDAS v2.0.0 provided by the HEASOFT v6.28 and using the CALDB 20210202 (Madsen et al. 2020). Cleaned events were obtained following the standard NuSTAR guidelines. Source spectra were extracted through the NUPRODUCTS routine. The source extraction region was a radius circular region centered on the source, while the background was extracted from a source-free region of comparable radius on the same detector (Det ) for FPMA and on the adjacent detector (Det ) for FPMB. NuSTAR spectral data were used in the range keV (background counts dominate the spectrum above 60 keV).

II.2 Swift
The Neil Gehrels Swift Observatory (Gehrels et al. 2004) carries three scientific instruments covering a broad energy range of keV: the Burst Alert Telescope (BAT, keV), the X-ray Telescope (XRT, keV), and the UV/Optical Telescope (UVOT, not considered in this work). Swift/BAT performs daily scans of the X-ray sky (Krimm et al. 2013) and the daily light curve of 2S 1553-542 is here adopted from the public BAT transients monitor11 1 https://swift.gsfc.nasa.gov/results/transients/weak/H1553-542/ (see Fig. 1). On the other hand, Swift/XRT performed pointed observations of 2S 1553-542 during the entire outburst episode with variable cadence, starting on 2020 January 7 (MJD 59221) through 2021 March 31 (MJD 59304). However, to ensure similar physical conditions as those sampled by the NuSTAR observation, we only analyzed adjacent Swift/XRT ObsIDs, that is 00031096008 through 00031096010. We verified that the best-fit spectrum of each ObsID was in agreement with each other, and then merged the data to improve statistics.
Swift/XRT data were reduced with XRTDAS v3.6.0, provided by the HEASOFT v6.28 and using the CALDB 20200724. Given the relatively high count rate of the source as detected by XRT (c/s) we excised the source core using a extraction region in order to avoid pile-up effects. The background was selected from an annular region centered on the source. All Swift/XRT observations were carried out in Photon Counting mode, whose timing resolution is insufficient for a timing analysis of the pulse profile for 2S 1553-542.

II.3 AstroSat
AstroSat is the first Indian multi-wavelength space observatory. It was launched on September 28, 2015, and carries five scientific instruments on board (Singh et al. 2014). In this work we will use data only from the Soft X-ray focusing Telescope (SXT), and the Large Area X-ray Proportional Counter 2 (LAXPC20). Following our Discretionary Director’s Time request (PI: Malacaria), AstroSat observed 2S 1553-542 on Feb. 23, 2021 (ObsID T03_272T01_9000004204).
II.3.1 SXT
The SXT instrument on-board AstroSat is a grazing incidence X-ray telescope capable to focus X-rays in the keV nominal energy band, with a thermo-electrically cooled CCD detector in the focal plane. SXT observed 2S 1553-542 in Photon Counting (PC) mode with an exposure of ks. SXT data were processed following the official SXT walkthrough webpage22 2 http://astrosat-ssc.iucaa.in/uploads/sxt/SXT_walkthrough.pdf and using the sxtpipeline v1.4b software with the newest available CALDB (20160505). Merged cleaned events were obtained with the SXT Event Merger Tool33 3 https://www.tifr.res.in/~astrosat_sxt/dataanalysis.html.. In a fashion similar to Chaudhury et al. 2018, we verified the optimal extraction region for the source events and selected a circular region with arcmin radius centered at the source position corrected for the SXT misalignment44 4 http://astrosat-ssc.iucaa.in/uploads/APPS/NoteOnRelativeAngleBetwwenPayloads_Astrosat_15072016.pdf. As suggested by the official SXT instrument team55 5 https://www.tifr.res.in/~astrosat_sxt/dataanalysis.html, the employed background spectrum is the one distributed by the Tata Institute of Fundamental Research payload operation centres (TIFR-POC). The employed Redistribution Matrix File (RMF) is made available from the SXT official team (sxt_pc_mat_g0to12.rmf, version June 13, 2020), and includes the full grade range. Using the sxtARFModule software, the standard SXT Ancillary Response File (ARF) was corrected to account for the observation-specific parameters like the area of the source extraction region and vignetting effects. Given the relatively low source count rate (cnt s-1) no pile-up correction was necessary. Finally, since the SXT data reduction pipeline does not correct for unaccounted gain drifts in the RMF, the gain fit tool in XSPEC was used to calculate the best-fit energy gain offset, while freezing the gain slope at (Antia et al. 2021). This resulted in a positive gain offset of keV (similar to Chaudhury et al. 2018; Chakraborty et al. 2020), which was subsequently applied to the SXT RMF for optimal fitting. Similarly to Bhargava et al. 2019, SXT spectral data are here only considered in the energy band keV.
II.3.2 LAXPC
There are in total three identical LAXPC units on-board AstroSat, namely LAXPC10, LAXPC20, and LAXPC30. They are all Xenon+Methane, high-pressure (2 atm) proportional counters, and together cover an effective area of about cm2 in the keV energy band. Each LAXPC detects X-ray photons in the energy range keV with an energy resolution of at 30 keV (Antia et al. 2021). However, LAXPC30 has been switched off in 2018 due to abnormal gain changes, while LAXPC10 is currently working at gain lower than nominal. Therefore, in this work only LAXPC20 data have been used. LAXPC data have been reduced with LAXPCSoftware66 6 http://astrosat-ssc.iucaa.in/laxpcData (Format A, version 20200804). For optimal S/N ratio, only events from the top layer have been considered. The official AstroSat tools released with the data reduction software were used to obtain source and background spectra in the keV, as well as source and background light curves, following the method outlined in Misra et al. 2021. Similarly to SXT (see Sect. II.3.1), the best-fit energy gain offset has been calculated through the gain fit tool in XSPEC and resulted in an offset of keV (in agreement with Antia et al. 2021). The background spectrum was also rescaled for the deadtime effect. We also verified that the LAXPC Field of View () was free from significantly contaminating X-ray sources.
II.4 NICER
NICER (Gendreau & Arzoumanian 2017) is an X-ray telescope deployed on the International Space Station (ISS) in 2017 June. NICER X-ray Timing Instrument (XTI) has 56 aligned Focal Plane Modules (FPMs, 52 currently operational), each made up of an X-ray concentrator optic associated with a silicon drift detector. Together, all FPMs result in a peak collecting area of cm2 at 1.5 keV. NICER is capable of fast-timing observations in the keV band, with timing accuracy of time-tagged photons to better than 100 ns. (Prigozhin et al. 2016; LaMarr et al. 2016; Gendreau & Arzoumanian 2017; Okajima et al. 2016)
Following our Discretionary Director’s Time proposal, NICER observed 2S 1553-542 in coordination with AstroSat observations on Feb. 23, 2021 for a total exposure time of 1.4 ks (ObsID 3202030101), and successively on Feb. 26 (ObsID 3202030102), but only data from the former observation have been considered in this work (given its contemporaneity with AstroSat observations). NICER data were processed with HEASoft version 6.28 and the NICER Data Analysis Software (nicerdas) version 7.0 (2020-04-23V007a) with Calibration Database (CALDB) version xti20200722, adopting standard calibration and screening criteria implied in the nicerl2 tool. The background spectrum was obtained using the space-weather method implemented in the version v0p6 of the nicer_bkg_estimator77 7 https://heasarc.gsfc.nasa.gov/docs/nicer/tools/nicer_bkg_est_tools.html tool (Gendreau et al., in prep.). The energy band of NICER spectrum was limited to keV below which the spectrum was background dominated and to avoid potential noise at the high-energy end of the bandpass.
III Results
III.1 Spectral analysis
In order to compare our results with those available from Tsygankov et al. 2016, we adopted a similar spectral model, that is an absorbed cutoff power-law model (cutoffpl in XSPEC) modified with a soft blackbody (bbodyrad), a Fe K emission line (gauss) at 6.4 keV, and an absorption line with Gaussian optical depth profile (gabs) to take into account the CRSF. Different continuum components (Highecut, CompTT) were tested in place of the cutoff power-law component and they all require a cyclotron line to fit the data. The photoelectric absorption component tbabs from XSPEC was used assuming model-relative (wilm) elemental aundances (Wilms et al. 2000). Moreover, since the Obs. II is carried out at a luminosity level that is lower than that analyzed in Tsygankov et al. 2016, a few additional measures need to be taken. In particular, the spectrum obtained from Obs. II does not require a Fe K emission line, while it requires a second, colder blackbody component.
| Obs I | Obs II | |
| CFPMA | 1 (fixed) | – |
|---|---|---|
| CFPMB | – | |
| CXRT | – | |
| CLAXPC | – | 1 (fixed) |
| CNICER | – | |
| CSXT | – | |
| N [cm-2] | ||
| kT[keV] | – | |
| normColdBB | – | |
| kT[keV] | ||
| norm | ||
| E[keV] | – | |
| [keV] | – | |
| normKα [ph/cm2/s] | ( | – |
| HighECut [keV] | ||
| norm | ||
| E[keV] | ||
| [keV] | ||
| Strengthcyc [keV] | ||
| Flux† (3-30 keV) | ||
| Flux† (3-20 keV) | ||
| /d.o.f. |
A cross-normalization constant was applied to take into account uncertainties in calibration among the various instruments. The seemingly large cross-normalization value between Swift/XRT and NuSTAR, , is in fact consistent with the expected range from Madsen et al. 2015 and others (see, e.g., Molina et al. 2019), and also reflects the intrinsic source variability between observations (see Fig. 1).
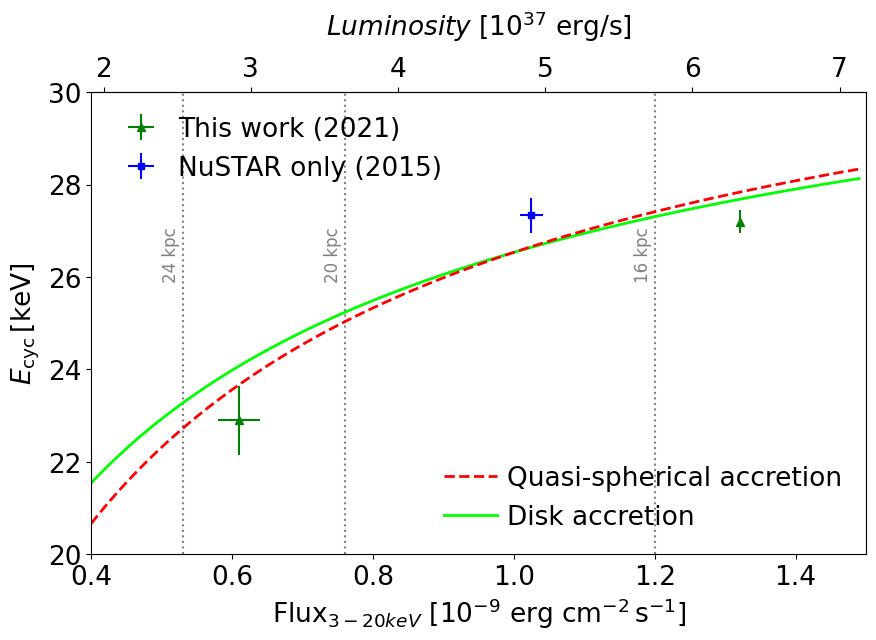
Our spectral analysis from two different outburst stages is presented in Table 2 and shows a variation of the cyclotron line energy with luminosity (see Fig 4). A comparison of our results with those obtained from the NuSTAR observation of 2S 1553-542 in 2015 (Tsygankov et al. 2016, Model II solution in their work) is also shown in Fig 4. For reference, the best-fit Model II in Tsygankov et al. 2016 shows a spectral photon index , a cutoff energy E keV, a blackbody component with kT and norm, an Iron K line at keV and keV, and a cyclotron line with EkeV, keV, keV. We also notice that, similarly to Tsygankov et al. 2016, an uncommonly hard photon index was obtained for the Obs. I spectrum (see Table 2), in opposition with the Obs. II spectral photon index. We therefore verified that the best-fit solution was not resulting from the lack of a cold blackbody component in Obs. I which, given the large emitting radius, may represent the emerging radiation from the accretion disk becoming relevant as the main source continuum becomes fainter. Restricting the photon index to positive values only and adding a cold blackbody component (best-fit values kT, norm) results in a slightly worse . In this case, other model parameters remain roughly consistent with those reported in Table 2, with the largest difference, i.e. , shown by the normalization of the hot blackbody component, norm, while the best-fit value of the photon index, , gets pegged at its lower limit. Even in the case where the photon index and a cold blackbody component is included, the Obs. I best-fit model returns a value of the cyclotron line energy that remains almost unchanged, EkeV.
To rule out possible artificial (model-driven) dependencies of the cyclotron line energy Ecyc and other model parameters, we analyzed the correspondent -contour plots. No significant dependence of the Ecyc on any continuum parameters was found, but the CRSF Gaussian parameters were found to be correlated one another. However, confidence level contour plots clearly show separated intervals, thus supporting the physical interpretation of the cyclotron line energy luminosity-dependence. This is shown, for example, in Fig. 5 for Ecyc versus (with a similar behaviour for Ecyc versus Strengthcyc contour plots).
III.2 Timing analysis
To more thoroughly investigate possible changes in the accretion regime during our observations, we extracted energy-dependent pulse profiles from the source at different luminosities. To do so, we applied the following corrections.

For NuSTAR, source and background light curves were extracted with a 0.1 s bin size using the nuproducts tool. NuSTAR light curves were barycentered using the barycorr tool and the NuSTAR clock correction file nuCclock20100101v118. LAXPC20 light curves also were extracted with a 0.05 s bin size and barycentered using the online orbit file generator88 8 http://astrosat-ssc.iucaa.in:8080/orbitgen/. and the official AstroSat tools for Header keywords correction prepbary_laxpc and for Barycentric correction as1bary99 9 http://astrosat-ssc.iucaa.in/data_and_analysis.. The same corrections (except the background subtraction) were applied to the NICER light curve. Orbital demodulation was also applied to all datasets, based on the recently updated orbital solution from Malacaria et al. 2020. Pulse periods were obtained from the NuSTAR FPMA and FPMB combined, background-corrected light curves for Obs. I, and from AstroSat/LAXPC20 background-corrected light curves for Obs. II. Pulse periods were determined using the epoch folding technique (Leahy et al. 1983) through the efsearch HEASARC tool. The process results in a pulse period value of 9.282155(3) s for Obs. I and 9.279490(8) for Obs. II. The spin period derivative is therefore s s-1 (Hz s-1). Pulse periods uncertainties were estimated by simulating light curves from the previously determined pulse profiles, following the method outlined in Lutovinov et al. 2012; Boldin et al. 2013. light curves were simulated, with count rates generated randomly within the error of the original data. Epoch folding was then applied to each simulated light curve to obtain a pulse periods distribution. The standard deviation of such distribution was taken as the pulse period uncertainty of the data.
To allow a comparison with the pulse-profiles obtained by Tsygankov et al. 2016, we extracted pulse profiles in the same energy bands, i.e., 3-7, 7–18, 18–30 keV for our NuSTAR and AstroSat/LAXPC observations. The NICER pulse profile in the 1-3 keV energy band was also extracted. Energy- and luminosity-resolved pulse profiles are shown in Fig. 6. Due to the non-monotonic variation of the pulse period throughout the outburst and to the residual wave-like behavior of the spin frequency evolution around the best orbital solution seen in Fermi/GBM1010 10 https://gammaray.nsstc.nasa.gov/gbm/science/pulsars/lightcurves/2s1553.html, pulse profiles at different times are not phase connected. Therefore, in Fig. 6 they have been manually aligned with respect to the peak of the NuSTAR pulse profile in the 7-18 keV energy band.
IV Discussion
IV.1 Spectral analysis
A luminosity-dependence of the parameters characterizing the XRPs spectral model is observed in many sources and expected from theoretical arguments (see, e.g., Staubert et al. 2019, and references therein). According to theoretical models (Basko & Sunyaev 1976; Becker et al. 2012; Poutanen et al. 2013; Mushtukov et al. 2015a; Mushtukov et al. 2015b), two different accretion regimes are at work in the accretion structure, depending on the accretion rate, and therefore luminosity. These two different accretion regimes are separated by a critical luminosity, , characterized by a radiation pressure so intense that prevents the accreting matter to free-fall on the NS surface, giving rise to a radiative shock and forming an accretion column. For a value of the cyclotron line energy of EkeV, the critical luminosity obtained by Becker et al. 2012 is:
| (1) |
and it is equal to erg s-1 for the accretion flow geometry constant for disk accretion, M the mass of the NS, Rkm the radius of the NS. On the other hand, for the same cyclotron line energy Mushtukov et al. 2015a predicts a critical luminosity value erg/s (see, e.g., their Fig. 7 for the case of pure X-mode polarization). has been shown in Fig. 4 for the upper, nominal and lower values of the source distance, kpc.

From an observational perspective (see, e.g., Klochkov et al. 2011, and references therein), some accreting XRPs exhibit a positive correlation between the Ecyc and luminosity when the source is accreting in the sub-critical () regime, while a few accreting XRPs show the opposite correlation in the super-critical () regime. On the other hand, some sources do not show any correlation (e.g., 4U 1538-522, Hemphill et al. 2016), while a few sources show either both correlations (V 0332+53, Doroshenko et al. 2017, and GRO J1008-57, Chen et al. 2021), or a flattening of the parameters dependence (Rothschild et al. 2017; Vybornov et al. 2017). For V 0332+53, the reported inversion of the cyclotron line energy luminosity-dependence has been interpreted as evidence for accretion regime transition. An analogous interpretation was suggested for GRO J1008-57 based on the continuum spectral evolution solely, yet not supported by the pulse profile behaviour (Kühnel et al. 2013).
Despite only a handful of data points being available in Fig. 4, the trend suggests a positive correlation of with luminosity and perhaps following flattening, similar to what has been observed in GX 304-1 (Rothschild et al. 2017) and Cep X-4 (Vybornov et al. 2017). However, the flattening in those two sources was observed at a sub-critical accretion regime, where the accretion flow possibly decelerates in a collisionless shock (Langer & Rappaport 1982) that only exists when the accretion rate is low (i.e., a few percent of the Eddington luminosity, Braun & Yahel 1984; Bykov & Krasil’Shchikov 2004). For a typical NS mass , the Eddington luminosity is erg s-1, that is about larger than the highest observed luminosity value for 2S 1553-542 in this work. Therefore, the collisionless shock should not play a dominant role at the accretion rates probed in this work, and the cyclotron line energy dependence on luminosity is not expected to flatten similarly to GX 304-1 and Cep X-4. Nonetheless, given the trend observed in Fig. 4 we tested the collisionless shock model by fitting the following function (see Eq. 6 from Rothschild et al. 2017):
| (2) |
where is the cyclotron line energy resulting from the NS surface, (with being the height within the accretion structure where the cyclotron line is formed) is assumed constant, is the observed X-ray flux, and for disk accretion. The fit returns keV and ( erg cm-2 s-1)α. A similar fit and best-fit values are obtained if for quasi-spherical settling accretion is assumed. These values are comparable to those obtained for GX 304-1 and Cep X-4 (Rothschild et al. 2017; Vybornov et al. 2017).
On the other hand, the trend in Fig. 4 may also be interpreted as indicative of an accretion regime transition around the . The critical luminosity values shown in Fig. 4 are derived from the observed flux assuming isotropic emission and their maximum uncertainty is estimated as (see Martínez-Núñez et al. 2017). In this interpretation, correlates with luminosity until is reached, and then either flattens or decreases with luminosity. In this scenario, the distance value plays a key role. In fact, this scenario favors distance values kpc, with the accretion regime transition occurring at erg s-1 obtained from Eq. 1, corresponding to about kpc in Fig. 4. Further analysis of the pulse profiles and of the pulsed fraction support this interpretation (see Sect. IV.2).
IV.2 Timing analysis
Comparing the luminosity-dependence of the pulse profiles at different energy bands can provide insights on the accretion regime at work on the NS. Tsygankov et al. 2016 showed that the pulse profile of 2S 1553-542 is only moderately energy-dependent, with a main broad peak spanning roughly half pulse cycle, plus a trailing hard-energy wing that contributes to the main peak and that only shows up in the keV energy band (i.e., the energy band sampling cyclotron line). A similar trailing wing was observed in other sources as well (Tsygankov et al. 2006; Iyer et al. 2015). Its interpretation is that of a phase-lagging feature around the cyclotron line energy due to the energy-dependent beaming of the radiation at the site of emission, with the emission around the cyclotron line energy escaping through a pencil beam while the remaining spectrum is emitted mostly in a fan beam fashion (Ferrigno et al. 2011; Schönherr et al. 2014).

The pulse profiles from our monitoring campaign (see Fig. 6) show a similarly moderate energy-dependence as Tsygankov et al. 2016, with the exception that the hard-energy wing is present at all energy bands probed with our NuSTAR observation (carried out at a source luminosity about higher). The hard-energy wing only shows energy-dependence at the lower luminosity level of the AstroSat observation (Obs. II). Moreover, the AstroSat pulse profiles morphology resembles that of the pulse profiles obtained with NuSTAR by Tsygankov et al. 2016 so strongly that they can be considered as representative of the same accretion regime. In addition, a comparison of the luminosity-dependent profiles obtained in this work suggests a narrow beaming component emerging at higher luminosity (the main NuSTAR peak at pulse phase in Fig. 6). The NuSTAR profiles also show a secondary peak located around the main minimum of the AstroSat/LAXPC profiles (). Finally, NICER pulse profile resembles those from AstroSat/LAXPC, coherently with the finding that pulse profiles from this source show only moderate energy-dependence but, at the same time, a rather marked luminosity dependence, consistent with an accretion regime transition once the critical luminosity erg/s is crossed.
To study the pulsed fraction (PF), we define it as ()/(), where , are the maximum and minimum pulse profile count rate, respectively. The PF is high () and shows a marked luminosity- and energy-dependence (see Fig. 7). At higher luminosity (i.e., that covered by the NuSTAR observation) the pulsed fraction keeps increasing with energy. However, at lower luminosity (i.e., that covered by the AstroSat observation) the pulsed fraction shows a reversal trend around the cyclotron line energy, almost identical to that observed by Tsygankov et al. 2016, thus strengthening the interpretation that both observations are representative of the same, sub-critical accretion regime. Local features around the cyclotron line energy in the energy-dependent pulsed fractions have been observed in other sources as well (see, e.g., Ferrigno et al. 2009), and are usually ascribed to the resonant scattering that causes beamed emission to become isotropic. Moreover, the stark difference in trend and value of the pulsed fraction in the 18-30 keV energy band seems to reflect the luminosity-dependence of the hard-energy wing observed in the pulse profiles.
Both the pulse profile and the pulsed fraction luminosity-dependence are generally attributed to the switch of the accretion column dominant beaming pattern, with the pencil beam dominating at lower luminosity and a fan beam growing contribution as the luminosity increases, with some hybrid configurations in between (see, e.g., Basko & Sunyaev 1975; Basko & Sunyaev 1976; Blum & Kraus 2000; Becker et al. 2012 and, e.g., Wilson-Hodge et al. 2018; Epili et al. 2017; Malacaria et al. 2015). In this scenario, the pulsed fraction switch in the 18-30 keV energy band proves additional evidence that the accretion regime has drastically changed as the luminosity increased and eventually crossed the critical luminosity value derived in Sect. IV.1, erg/s.
V Summary and conclusions
We have analyzed the most recent outburst from the accreting XRP 2S 1553-542 at the beginning of 2021, taking advantage of a multi-observatory campaign. We performed spectral and timing analysis, and focused on the spectral and pulse profiles luminosity-dependence.
The spectral analysis reveals a positive correlation between the cyclotron line energy and the observed luminosity (Fig.s 4, 5), observed for the first time in this source. The correlation ceases above a certain luminosity, which can be interpreted either in terms of a collisionless shock, or as an inversion of the correlation above the critical luminosity . The latter scenario is favored by additional evidence and supports a distance value for 2S 1553-542 of about 16 kpc, which is skewed towards the lower limit of the nominal distance value for this source.
The pulse profiles analysis also reveals a drastic change in the pulse profile shape once the source crosses the critical luminosity (Fig. 6). This result is supported by a trend inversion of the pulsed fraction corresponding to those profiles, in an energy band that samples the cyclotron line (Fig. 7).
Based on the above indications we conclude that we have witnessed an accretion regime transition, happening at a erg/s. Given the elusive nature of such phenomenon, the accretion regime transition has been rarely observed, making therefore 2S 1553-542 a key addition to the short list of XRPs whose accretion regime transition is supported by the luminosity-dependence of the cyclotron line energy, the pulse profiles and the pulsed fraction altogether.
References
- Antia et al. (2021) Antia, H. M., Agrawal, P. C., Dedhia, D., et al. 2021, Journal of Astrophysics and Astronomy, 42, 32
- Arnaud (1996) Arnaud, K. A. 1996, in Astronomical Society of the Pacific Conference Series, Vol. 101, Astronomical Data Analysis Software and Systems V, ed. G. H. Jacoby & J. Barnes, 17
- Basko & Sunyaev (1975) Basko, M. M., & Sunyaev, R. A. 1975, A&A, 42, 311
- Basko & Sunyaev (1976) —. 1976, MNRAS, 175, 395
- Becker et al. (2012) Becker, P. A., Klochkov, D., Schönherr, G., et al. 2012, A&A, 544, A123
- Bhargava et al. (2019) Bhargava, Y., Belloni, T., Bhattacharya, D., & Misra, R. 2019, MNRAS, 488, 720
- Blum & Kraus (2000) Blum, S., & Kraus, U. 2000, ApJ, 529, 968
- Boldin et al. (2013) Boldin, P. A., Tsygankov, S. S., & Lutovinov, A. A. 2013, Astronomy Letters, 39, 375
- Braun & Yahel (1984) Braun, A., & Yahel, R. Z. 1984, ApJ, 278, 349
- Bykov & Krasil’Shchikov (2004) Bykov, A. M., & Krasil’Shchikov, A. M. 2004, Astronomy Letters, 30, 309
- Chakraborty et al. (2020) Chakraborty, S., Navale, N., Ratheesh, A., & Bhattacharyya, S. 2020, MNRAS, 498, 5873
- Chaudhury et al. (2018) Chaudhury, K., Chitnis, V. R., Rao, A. R., et al. 2018, MNRAS, 478, 4830
- Chen et al. (2021) Chen, X., Wang, W., Tang, Y. M., et al. 2021, ApJ, 919, 33
- Davidson & Ostriker (1973) Davidson, K., & Ostriker, J. P. 1973, ApJ, 179, 585
- Doroshenko et al. (2017) Doroshenko, V., Tsygankov, S. S., Mushtukov, A. A., et al. 2017, MNRAS, 466, 2143
- Epili et al. (2017) Epili, P., Naik, S., Jaisawal, G. K., & Gupta, S. 2017, MNRAS, 472, 3455
- Fabricius et al. (2021) Fabricius, C., Luri, X., Arenou, F., et al. 2021, A&A, 649, A5
- Ferrigno et al. (2009) Ferrigno, C., Becker, P. A., Segreto, A., Mineo, T., & Santangelo, A. 2009, A&A, 498, 825
- Ferrigno et al. (2011) Ferrigno, C., Falanga, M., Bozzo, E., et al. 2011, A&A, 532, A76
- Gehrels et al. (2004) Gehrels, N., Chincarini, G., Giommi, P., et al. 2004, The Astrophysical Journal, 611, 1005
- Gendreau & Arzoumanian (2017) Gendreau, K., & Arzoumanian, Z. 2017, Nature Astronomy, 1, 895
- Harrison et al. (2013) Harrison, F. A., Craig, W. W., Christensen, F. E., et al. 2013, ApJ, 770, 103
- Hemphill et al. (2016) Hemphill, P. B., Rothschild, R. E., Fürst, F., et al. 2016, MNRAS, 458, 2745
- Iyer et al. (2015) Iyer, N., Mukherjee, D., Dewangan, G. C., Bhattacharya, D., & Seetha, S. 2015, Monthly Notices of the Royal Astronomical Society, 454, 741
- Kelley et al. (1982) Kelley, R. L., Ayasli, S., & Rappaport, S. 1982, IAU Circ., 3667, 0
- Klochkov et al. (2011) Klochkov, D., Staubert, R., Santangelo, A., Rothschild, R. E., & Ferrigno, C. 2011, A&A, 532, A126
- Krimm et al. (2013) Krimm, H. A., Holland, S. T., Corbet, R. H. D., et al. 2013, ApJS, 209, 14
- Kühnel et al. (2013) Kühnel, M., Müller, S., Kreykenbohm, I., et al. 2013, A&A, 555, A95
- LaMarr et al. (2016) LaMarr, B., Prigozhin, G., Remillard, R., et al. 2016, in Society of Photo-Optical Instrumentation Engineers (SPIE) Conference Series, Vol. 9905, Space Telescopes and Instrumentation 2016: Ultraviolet to Gamma Ray, ed. J.-W. A. den Herder, T. Takahashi, & M. Bautz, 99054W
- Langer & Rappaport (1982) Langer, S. H., & Rappaport, S. 1982, ApJ, 257, 733
- Leahy et al. (1983) Leahy, D. A., Darbro, W., Elsner, R. F., et al. 1983, ApJ, 266, 160
- Lutovinov et al. (2012) Lutovinov, A., Tsygankov, S., & Chernyakova, M. 2012, MNRAS, 423, 1978
- Lutovinov et al. (2016) Lutovinov, A. A., Buckley, D. A. H., Townsend, L. J., Tsygankov, S. S., & Kennea, J. 2016, MNRAS, 462, 3823
- Madsen et al. (2020) Madsen, K. K., Grefenstette, B. W., Pike, S., et al. 2020, arXiv e-prints, arXiv:2005.00569
- Madsen et al. (2015) Madsen, K. K., Harrison, F. A., Markwardt, C. B., et al. 2015, ApJS, 220, 8
- Malacaria et al. (2020) Malacaria, C., Jenke, P., Roberts, O. J., et al. 2020, ApJ, 896, 90
- Malacaria et al. (2015) Malacaria, C., Klochkov, D., Santangelo, A., & Staubert, R. 2015, A&A, 581, A121
- Malacaria et al. (2021) Malacaria, C., Pottschmidt, K., Fuerst, F., et al. 2021, The Astronomer’s Telegram, 14348, 1
- Martínez-Núñez et al. (2017) Martínez-Núñez, S., Kretschmar, P., Bozzo, E., et al. 2017, Space Sci. Rev., 212, 59
- Misra et al. (2021) Misra, R., Roy, J., & Yadav, J. S. 2021, Journal of Astrophysics and Astronomy, 42, 55
- Molina et al. (2019) Molina, M., Malizia, A., Bassani, L., et al. 2019, MNRAS, 484, 2735
- Mushtukov et al. (2015a) Mushtukov, A. A., Suleimanov, V. F., Tsygankov, S. S., & Poutanen, J. 2015a, MNRAS, 447, 1847
- Mushtukov et al. (2015b) Mushtukov, A. A., Tsygankov, S. S., Serber, A. V., Suleimanov, V. F., & Poutanen, J. 2015b, MNRAS, 454, 2714
- Nakajima et al. (2019) Nakajima, M., Negoro, H., Kurogi, K., et al. 2019, The Astronomer’s Telegram, 13217, 1
- Okajima et al. (2016) Okajima, T., Soong, Y., Balsamo, E. R., et al. 2016, in Space Telescopes and Instrumentation 2016: Ultraviolet to Gamma Ray, ed. J.-W. A. den Herder, T. Takahashi, & M. Bautz, Vol. 9905, International Society for Optics and Photonics (SPIE), 1495
- Pahari & Pal (2012) Pahari, M., & Pal, S. 2012, MNRAS, 423, 3352
- Poutanen et al. (2013) Poutanen, J., Mushtukov, A. A., Suleimanov, V. F., et al. 2013, ApJ, 777, 115
- Prigozhin et al. (2016) Prigozhin, G., Gendreau, K., Doty, J. P., et al. 2016, in Space Telescopes and Instrumentation 2016: Ultraviolet to Gamma Ray, ed. J.-W. A. den Herder, T. Takahashi, & M. Bautz, Vol. 9905, International Society for Optics and Photonics (SPIE), 436
- Rothschild et al. (2017) Rothschild, R. E., Kühnel, M., Pottschmidt, K., et al. 2017, MNRAS, 466, 2752
- Schönherr et al. (2014) Schönherr, G., Schwarm, F. W., Falkner, S., et al. 2014, A&A, 564, L8
- Singh et al. (2014) Singh, K. P., Tandon, S. N., Agrawal, P. C., et al. 2014, in Space Telescopes and Instrumentation 2014: Ultraviolet to Gamma Ray, ed. T. Takahashi, J.-W. A. den Herder, & M. Bautz, Vol. 9144, International Society for Optics and Photonics (SPIE), 517
- Staubert et al. (2019) Staubert, R., Trümper, J., Kendziorra, E., et al. 2019, A&A, 622, A61
- Tsygankov et al. (2006) Tsygankov, S. S., Lutovinov, A. A., Churazov, E. M., & Sunyaev, R. A. 2006, MNRAS, 371, 19
- Tsygankov et al. (2016) Tsygankov, S. S., Lutovinov, A. A., Krivonos, R. A., et al. 2016, MNRAS, 457, 258
- Vybornov et al. (2017) Vybornov, V., Klochkov, D., Gornostaev, M., et al. 2017, A&A, 601, A126
- Walter (1976) Walter, F. 1976, IAU Circ., 2959, 2
- Wenger et al. (2000) Wenger, M., Ochsenbein, F., Egret, D., et al. 2000, A&AS, 143, 9
- Wilms et al. (2000) Wilms, J., Allen, A., & McCray, R. 2000, ApJ, 542, 914
- Wilson-Hodge et al. (2018) Wilson-Hodge, C. A., Malacaria, C., Jenke, P. A., et al. 2018, ApJ, 863, 9