Gravitational lensing effects of supermassive black holes in cluster environments2022Gravitational lensing effects of supermassive black holes in cluster environments–12
Abstract
This study explores the gravitational lensing effects of supermassive black holes (SMBHs) in galaxy clusters. While the presence of central SMBHs in galaxies is firmly established, recent work from high-resolution simulations predict the existence of an additional population of wandering SMBHs. Though the masses of these SMBHs are a minor perturbation on the larger scale and individual galaxy scale dark matter components in the cluster, they can impact statistical lensing properties and individual lensed image configurations. Probing for these potentially observable signatures, we find that SMBHs imprint detectable signatures in rare, higher-order strong lensing image configurations although they do not manifest any statistically significant detectable evidence in either the magnification distribution or the integrated shear profile. Investigating specific lensed image geometries, we report that a massive, near point-like, potential of an SMBH causes the following detectable effects: (i) image splitting leading to the generation of extra images; (ii) positional and magnification asymmetries in multiply imaged systems; and (iii) the apparent disappearance of a lensed counter-image. Of these, image splitting inside the cluster tangential critical curve, is the most prevalent notable observational signature. We demonstrate these possibilities in two cases of observed giant arcs in SGAS J003341.5+024217 and RX J1347.5-1145, wherein specific image configurations seen can be reproduced with SMBHs. Future observations with high-resolution instrumentation (e.g. MAVIS-Very Large Telescope, MICADO-Extremely Large Telescope, and the upgraded ngVLA, along with data from the Euclid & Nancy Grace Roman Space Telescopes and the Rubin LSST Observatory are likely to allow us to probe these unique yet rare SMBHs lensing signatures.
Keywords:
Gravitational lensing – Galaxy clusters – supermassive black holes1 Introduction
Gravitational lensing has emerged as a powerful method to probe the detailed mass distribution on multiple cosmic scales in the Universe, from individual galaxies, groups of galaxies to clusters of galaxies, which all serve as effective lenses for the distant background galaxies and quasars (see review by Kneib &
Natarajan 2011 for details). We now know that most, if not all, galaxies in the Universe likely harbor a central supermassive black hole (SMBH). SMBHs are ubiquitous at the centers of galaxies, and the most massive ones are expected in the brightest cluster galaxies (BCGs) that anchor the center of the gravitational potential well in galaxy clusters. Observations suggest that properties of central SMBHs are correlated to properties of their host galaxy (Magorrian
et al. 1998; Gebhardt
et al. 2000; Tremaine
et al. 2002; Ferrarese &
Merritt 2000). Even though the mass of the central SMBH is negligible compared to the mass of the stellar component of its host galaxy, in just the bulge , coupling scales the SMBH nevertheless appears to play an important role in modulating star formation in the galactic nucleus.
Gravitational lensing, predicted by General Relativity results in the deflection of light paths by strong gravitational potentials encountered en-route. Light from distant background galaxies is deflected by the foreground potential of a galaxy cluster and its member galaxies producing a multiplicity of detectable effects. Gravitational lensing observations provide strong constraints on the inner density profiles of galaxies and clusters due to the production of multiple images and highly magnified distorted arcs. In this paper, we explore the gravitational lensing effects produced by SMBHs in cluster environments.
Lensing theory predicts that for simple isolated galaxy lenses every strong lensing system should produce a faint, demagnified image at the very inner center of the lens
However, these central images have only been hinted (Winn
et al. 2004) in lensed radio galaxies and multiple studies have focused on them as there is scarce contamination by the lens itself (e.g. Winn
et al. 2004; Rusin
et al. 2005; Wong
et al. 2015; Tamura et al. 2015; Quinn
et al. 2016; Wong et al. 2017).
Realistic models of galaxies with a dominant central stellar component predict a wide range of properties for these core images spanning a range of magnification factors. Despite systematic searches for these central de-magnified images, they have not been found. While tweaking properties of the stellar component can account for the absence of these images, Mao
et al. 2001 showed that the presence of a central SMBH introduces new qualitative features in the resulting critical and caustic curves that could easily destroy the presence of these central images.
Traditionally, the detection of active SMBHs has been through X-ray studies of the accretion process that has permitted mass measurements. For nearby, dormant SMBHs, their masses have been successfully constrained mapping the gravitational potential using stars and gas when available as tracers. However, the kind of data needed for dynamical modeling to determine SMBH masses is unavailable for sources beyond 50-100 Mpc. Since lensing is achromatic, mapping the shadow of gas accretion including lensing effects close to the horizon, recently permitted the Event Horizon Telescope (EHT) Collaboration to garner a mass measurement for the SMBH at the center of M 87. The central SMBH in M 87 is reported to have a mass of Event Horizon Telescope Collaboration et al. 2019. While such measurements are infeasible for SMBHs, lensing effects resolvable with the next generation of interferometric radio arrays like the ngVLA might provide an entirely new method to measure SMBH masses. It is this, in part, that motivates our current study. In particular, if any unique detectable SMBH lensing signatures exist, they would offer a novel way to find dormant SMBHs at inter-mediate redshifts, , and serve as invaluable addition to our understanding of the growth and evolution black hole populations over cosmic time.
Previous theoretical work has focused on including the presence of a central SMBH in the galactic nucleus of an individual galaxy lens. The gravitational potential of an SMBH was added to various assumed galaxy mass profiles, ranging from a cored isothermal sphere (Mao
et al. 2001) and a Plummer model (Werner &
Evans 2006) to explore their combined lensing effects. Recently, Karamazov et al. 2021 include the central SMBH as a point mass embedded in an NFW profile to model the BCG in a fiducial galaxy cluster.
Given the clear cut prediction of the absence of the central image in the case of isolated galaxies, various groups including Keeton 2003, Chen et al. 2018, and Inada et al. 2008 have looked at optical and radio data of distant galaxies (z0.2-1) to search for the central image. Multiple studies have been focused on lensed radio galaxies as there is no contamination by the lens itself (e.g. Winn
et al. 2004; Rusin
et al. 2005; Wong
et al. 2015; Tamura et al. 2015; Quinn
et al. 2016; Wong et al. 2017). While these de-magnified images remain undetected, this absence of detection in itself is not a clear cut signal telegraphing the presence of a central SMBH. In fact, (Smith
et al. 2017) showed that a change in the stellar IMF can also alter the central density of the stellar component in the inner regions of galaxies sufficiently to remove central images. Therefore, the absence of a central image cannot be assumed to provide smoking gun evidence for an SMBH. Central images could appear more clearly in lensing potential embedded in more complex environment as it could shift demagnification region outside the inner core of the galaxy (e.g. Dahle
et al. 2013; Sharon
et al. 2017; Ostrovski
et al. 2018; Muller et al. 2020; Martinez
et al. 2022)
Additionally, the presence of dark substructures (whose lensing effects would be degenerate with that of SMBHs) have also been inferred from galaxy-galaxy lensing studies, as reported in Minor et al. 2021a and Minor et al. 2021b where they argue for evidence of the existence of massive compact sub-halos perturbing the observed lensing signal. In the latter case, an associated, luminous counterpart is seen but that could also be related to additional sources lensed behind (Collett & Smith 2020; Smith & Collett 2021).
In the work presented in this paper, we extend and expand previous studies to examine in detail the lensing signatures SMBHs in a range of cluster environments: the case of a central SMBH in a cluster BCG; a central SMBH in a cluster member galaxy, and the more general case of a wandering SMBH in the cluster environment. We are motivated to study the effect of this additional wandering SMBH population due to recent work by Ricarte et al. 2021a; Ricarte et al. 2021b. Analyzing a high-resolution simulated cluster, Romulus-C, (Ricarte et al. 2021a) reported the existence of a large population of wandering SMBHs in cluster environments originating from the tidal stripping and disruption of in-falling dwarf galaxies. In addition, microlensing in clusters is very sensitive to the mass but remains a very rare event, though recently Dai &
Miralda-Escudé 2020 argue that significant monitoring of subtle changes in the magnification would be able to yield accurate mass measurements leading to the potential implication of IMBHs or SMBHs. Previous reports using microlensing events by stars in clusters (e.g. Icarus and Iapix in MACS J1149 – Kelly
et al. 2018; Diego
et al. 2018) have been searched for.
The plan of our paper is as follows: in Section 2, we present the methods used to model and study the lensing effects of SMBHs in clusters; the lensing effects of the central BCG SMBHs, the central SMBHs in cluster galaxies and wandering SMBHs are explored in Sections 3, 4 and 5 respectively. The impact of SMBHs on specific lensing image configurations is studied in detail and presented in Section 6, and the observational case studies in current data wherein SMBHs may be implicated are discussed in Section 7. We conclude in Section 8 with the prospects for future detection and delineation of SMBH lensing with the upcoming data deluge from new facilities.
2 Modeling the lensing effects of SMBHs
Here we look more exhaustively at the range of lensing phenomena that could be revealed with the explicit inclusion of a central SMBH in a cluster galaxy or wandering SMBHs in clusters. We model the gravitational potential of the entire system holistically following (Natarajan & Kneib 1997) as a superposition of the following components: larger scale smooth components (that model the distribution of the smoothly distributed dark matter); a sum over galaxy-scale perturbers (that model the contribution of the dark matter subhalos associated with individual cluster galaxies) and now explicitly include the associated SMBH population (those hosted at the centers of cluster galaxies or as wanderers) as:
| (1) |
As detailed below, we use mass profiles whose lensing properties are well understood to model mass components above.
2.1 Modeling the composite profile
To allow flexibility in our computation, we derive lensing properties adopting a dual Pseudo Isothermal Elliptical profile (dPIE; Kassiola & Kovner 1993; Natarajan & Kneib 1997; Elíasdóttir et al. 2007) often used in lensing analysis. We use this profile to model cluster halos, galaxy halos and SMBHs. This profile has the advantage that the first and second partial derivatives of the lensing potential can both be written out analytically. In addition, this profile offers a critical free parameter, the core radius, that can be tuned to flatten the central density distribution flexibly, that is of great utility while modeling the effect of SMBHs.
The 3D density distribution of the dPIE is given by:
| (2) |
Following the details presented in Appendix A of Elíasdóttir et al. 2007, we adopt a fiducial central velocity dispersion to relate to the central density as follows:
| (3) |
The convergence, , and the shear, , of a single dPIE are given by:
| (4) |
and
| (5) |
with
| (6) |
| (7) |
where , , and are the angular diameter distances from the observer to the lens, the observer to the source, and between the lens and source respectively.
2.2 Explicit inclusion of the SMBH component
We define the black hole mass hosted in a cluster galaxy by adopting the fiducial velocity dispersion of a dPIE profile as the central velocity of the bulge of the host galaxy. We can therefore, use the well known empirically derived local black hole mass - bulge mass relation (Gültekin et al. 2009):
| (8) |
where = 8.12, = 4.24 and is the bulge velocity dispersion defined here as the dPIE velocity dispersion shown in equation 3.
We then correlate the mass of a central SMBH to the dPIE profile to compute the lensing effect of the SMBH. Using a circularly symmetric profile, we adopt a cut radius of pc, and a core radius of pc. These values are taken to account for an small accretion disks around the SMBH but its size is negligible for the current observations considered later in this analysis The top panel of Figure 1 shows the integrated mass profile of such a potential normalized by its total mass. This corresponds to roughly 99.8% of the mass within the 330 pc corresponding to 0.1″ at , which adequately captures the gravitational potential of an SMBH. The bottom panel shows the deflection angle computed for our profile and a point mass, we can see that after 0.01 pc (1″ at ) the deflection angle is identical to a point mass.
We compute the shear and convergence profile from this compact dPIE to demonstrate that it is an appropriate representation of the point mass. We find that the kappa profile, following the density profile presented in Figure 1, reaches 0.1 after 0.02″- extremely similar to the lensing behavior produced by the analytic point mass profile used by Karamazov et al. 2021; Karamazov & Heyrovsky 2021. We remind the reader that the convergence for a point mass is zero everywhere except at its location. The shear profile for a point mass and our dPIE are nearly identical to < 1% after 20 pc (or 0.001″for a lens at ). Therefore, we argue that our choice of dPIE profile offers a reasonable and robust representation to model both a central and a wandering SMBH with an associated residual stellar component resulting from the tidal stripping/merging of an infalling galaxy into the cluster environment.
Within this setting, the mass of the dPIE profile is set entirely by the velocity dispersion, . Following the formula derived from Elíasdóttir et al. 2007 equations A11 and A25, we have:
| (9) |
3 Lensing by the central BCG SMBH
We first examine the lensing effects produced by the massive SMBH hosted at the center of the cluster BCG. As noted by Karamazov & Heyrovsky 2021, the inclusion of a point like mass at the center of the cluster BCG potential can strongly affect the resulting lensing configurations. Karamazov et al. 2021 distinguish two regimes where formally the ratio of the convergence produced by the BCG to that of the SMBH exceeds , when a single NFW profile is used to model the BCG and a point-like source the SMBH.
Our empirical, observationally-based approach does not make such distinctions of regimes based on the convergence, and instead we focus on the ratio of measured quantities - the mass ratio between different contributors to the overall mass budget. Highlighted in Figure 2 we show how significantly a point-like mass can affects the lensing configuration that is produced. For a host galaxy with a total total mass of (as computed following Elíasdóttir et al. 2007) with an increasing value of central black-hole mass, we show the effect in the left column, for the case of an isolated galaxy (not embedded in the cluster environment); in the middle panel for a galaxy in a smoothed dPIE potential mimicking a central SMBH in a cluster BCG with a total mass of () and in the rightmost panel, the same galaxy now embedded instead in an NFW halo with a total mass of about . Increasing the mass of the central SMBH in the galaxy produces the remarkable effect of boosting the radial caustic curve (blue diamond) outside the tangential caustic curve in the case of a dPIE profile (two left columns). In the case of the SMBH at the center of a cluster scale potential (middle column) the area occupied by the radial caustic goes from 0.4 arcsec2 for an SMBH mass of to 5 arcsec2 for an ultra-massive SMBH. The outer critical curve is only slightly boosted. A similar boosting effect is not observed for the case of the NFW profile cluster halo (right column). In this case the most noticeable effect that appears is the splitting of the radial critical curves for a massive enough cluster. For the case shown in Figure 2 such rare and exotic catastrophic configurations appear only when the SMBH mass is tuned up to reach M⊙(see Schneider et al. 1992; Orban de Xivry & Marshall 2009 for more details on rare lensing geometries). The ellipticity of the cluster scale halo can influence the mass of when the splitting of the radial critical curve occurs, as higher elliptical profile increase the density in one direction, we documented two cases for which we vary the ellipticity in Appendix A

4 Lensing signals of central SMBHs in cluster galaxies
In this section we study the lensing effect of a SMBH hosted at the center of a cluster member galaxy. Due to the lensing boost from the underlying larger scale cluster components, stronger effects can be produced as explained below. For exploring these effects, we start with modeling the underlying environment with a mock cluster. We add a single cluster scale halo and sub-halos to mimic the contribution of cluster member galaxies. Due to the sensitivity of the lensing signal to the parameters of the mass models, we used a realistic lens model of an observed cluster lens and re-arrange the cluster member locations keeping their radial distances unchanged in multiple realizations. The main dark matter central velocity dispersion and cut radius have been slightly reduced to match a total mass of . The final model used here is available online11 1 https://sites.google.com/view/guillaume-mahler-astronomer/lens-model. We now include a SMBH with mass as expected from the empirical scaling relations at the center of cluster member galaxies.
4.1 Effects of central SMBHs on the lensing configurations
The combined lensing power of the cluster, the host galaxy and its central SMBH are now studied in detail. We identify two main cases and the resulting lensed image geometries. The first case is when the host galaxy lies outside the main cluster critical curve, as illustrated in Figure 3. In this scenario, the cluster member galaxy produces its own critical curve. The principal effect for such a configuration appears to be the disappearance of the radial critical curve of the galaxy, similar to the effect studied in the case of isolated individual galaxy lenses (e.g. Mao et al. 2001). However, due to the lensing boost from the cluster, even less massive galaxies can produce large enough critical curves to potentially produce detectable image configurations. Secondly, a more spectacular effect appears when the host galaxy is situated inside the main cluster critical curve. In this case, the cluster member galaxy’s critical curve serves in practice as the radial critical curve for the overall cluster. Increasing the mass of the SMBH for such configurations, we find, first creates a cassinoid shape (peanut-like) before splitting the curve into two separate rounded critical curves as seen in the left column of Figure 3. This unique configuration would offer a compelling case to look for a central SMBH in a cluster member galaxy in the inner core region of a cluster-lens. However, upon varying the SMBH mass, we note that the mass needed for such an event to occur is high and in the case displayed Figure 3 this appears for a SMBH at about . Such a high mass corresponds to the existence of an over-massive SMBH in a host galaxy (an outlier away from the typical relation (Gültekin et al. 2009), however such cases have been reported (van den Bosch et al. 2012).

4.2 Statistical effects of central SMBHs on the shear profile of sub-halos
Masses of sub-halos in clusters have been detected from statistically combining detected strong and weak lensing signals (Natarajan et al. 2017; Pastor Mira et al. 2011; Sifón et al. 2018; Niemiec et al. 2018). Future surveys from the LSST Vera Rubin observatory, or the Nancy Grace Roman Telescope are expected to overcome statistical limitations by detecting a large population of hitherto undetected massive cluster lenses. We investigate the potential statistical signature of the central SMBHs in stacked shear profiles of cluster member galaxies. We use our mock cluster presented in section 4 associating every cluster member galaxy with a central SMBH following equation 8. We produce a shear profile at the location of every cluster member and stack the signal for bright galaxies, corresponding to the luminosity range MmM. We then compare the profiles for the same selected galaxies for the realization without a central SMBH. In addition, we compare the stacks with the signal derived for the known degenerate case altering the internal structure for the cluster galaxies with a modified core core radius, from rkpc with the signal using a smaller core rkpc and a larger core with rkpc. In our simulation, we use the same scaling relations with luminosity for the core radius r r, as adopted in several previous works by (Jullo et al. 2007; Richard et al. 2010; Mahler et al. 2018; Mahler et al. 2019). Figure 4 shows the stacked shear profiles, where it is clearly seen that the effect on the shear profile arising from changing the core radius of the galaxy far exceeds the effect of adding in a SMBH. Therefore, we conclude that the statistical lensing signature of a central SMBH in the shear profile is degenerate with that of the properties of the stellar component in the inner regions of cluster member galaxies and hence not discernible.
5 Lensing signals of wandering SMBHs
In addition to the wandering population of SMBHs detected in the high-resolution simulated cluster Romulus-C that includes the dark matter and the baryon component (Tremmel et al. 2019), dark matter only simulations also reveal the existence of massive structures within the cluster-scale halos, that could also be interpreted as free-floating black holes Banik et al. 2019. Two mechanisms could originate the wandering SMBH population. First, infalling galaxies is the main mechanism of clusters growth and only a fraction of the galaxy survive. While being completely stripped out of their stars in their infall from tidal friction (Wu et al. 2013; Haggar et al. 2022), the remaining central black hole can survive and stay within the halos without enough stars around it to be directly detected. A second mechanism is the the ejection of a SMBH due to recoil as described in Paynter & Thrane 2022. To implement our solution we radially distribute wanderers following a log-normal distribution as a function of projected cluster-centric radius as reported in Ricarte et al. 2021a (see Figure 6 in their analysis) with a mean at 0.1 R200 (radius at 200 times the critical density of the Universe) of the host halos. In this work, we use a cluster host halo of and a RMpc. In the high-resolution simulated cluster Romulus-C studied by Ricarte et al. 2021a, they report finding over 1600 wanderers distributed within the virial radius. In accordance with this demographic, we randomly draw 1000 locations for our wanderers.
We repeat this mock cluster simulation a 1000 times following the mass and positions described above. To mimic realistic scenarios, we choose to limit ourselves to a mass range of to for the SMBH masses. Following these constraints, we numerically computed the probability for the presence of massive SMBH. There is 3.7 % probability that at least one SMBH wanderer with a mass above M⊙ acts as a lens and this probability drops to 0.07% to have at least two SMBHs above M⊙. The probability for at least 1 SMBH to be more massive than M⊙ is about 0.02% (or 1 per 5000 clusters).
6 SMBH lensing signatures in specific multiple image configurations
Observationally detectable lensing signatures of a SMBH or for a compact dark matter halo without a sufficiently luminous counterpart exhibit a large variety of image configurations. The most obvious cases emerge when a SMBH is near a critical curve or when its impact is boosted by significant amplification from the larger-scale cluster host halo. In the following section we summarise the five distinct categories of potential observational signatures of lensing by a SMBH:
- 1.
Image splitting due to alignment of the SMBH inside the cluster critical curve.
- 2.
Change in the observed flux of one of the lensed images.
- 3.
Apparent skewing in the light profile (or velocity field) and an apparent break in symmetry.
- 4.
Apparent increase in the size of a single lensed image
- 5.
Apparent disappearance of an internal image
We detail each of these categories further in the following subsections.
6.1 Image splitting due to alignment of the SMBH inside the cluster critical curve.
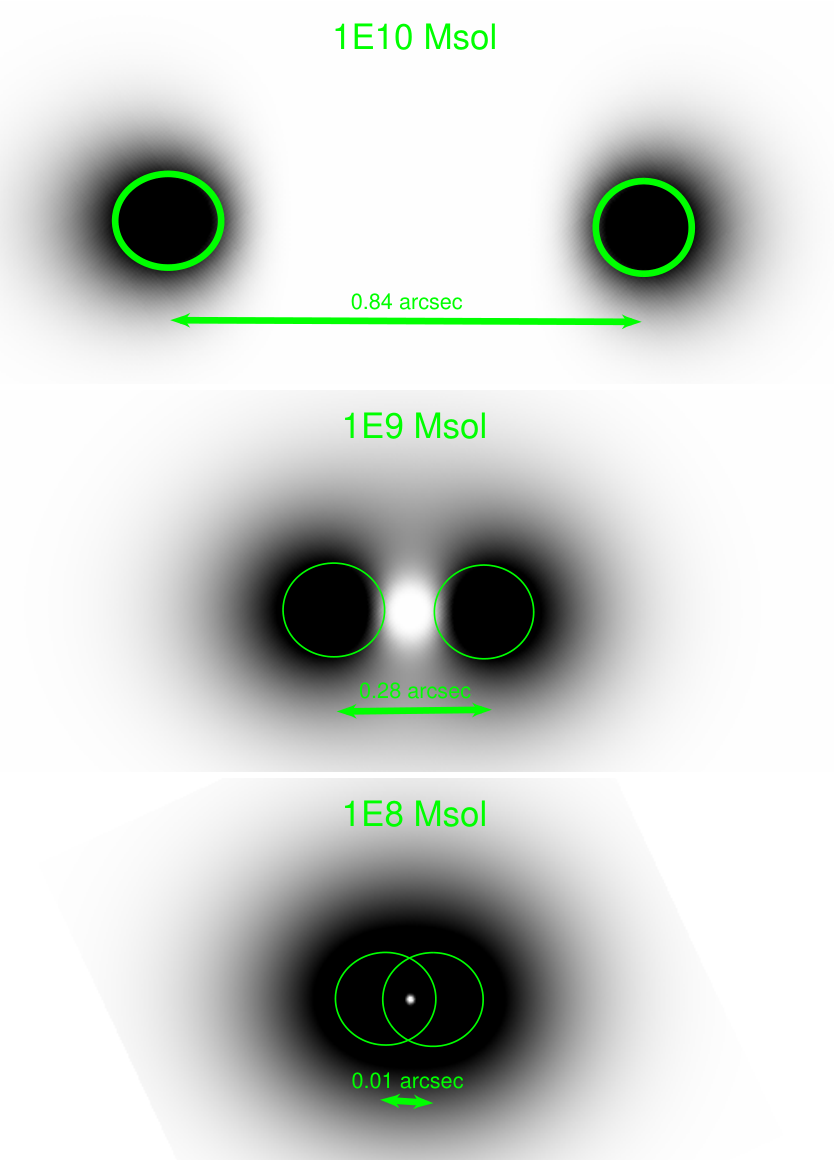
The presence of an SMBH introduces a perturbation in the lensing configurations as noted. If the image of the lensed source is exactly aligned with the SMBH the resulting image is split. The perfect alignment represents the maximum splitting that SMBH can generate, that we refer to that later as the splitting power. Figure 5 illustrates the splitting power of SMBHs as a function of their mass. This splitting power is mainly driven by the actual mass of the SMBH, other contributing factors are redshift, a smaller variation appears with increasing redshift of the source (up to 25% for redshift 10); the underlying magnification (up to 10% for an order of magnitude change in magnification) and the cluster induced shear(up to 25%). From Figure 5, we clearly see that an SMBH of more than has a large enough splitting power to be detected by HST. However, we note here that the size of the caustic curve in the source plane is small. For example, at , a source in alignment with a SMBH, needs to have distinct feature emitting light smaller than 100 pc. If the light source is homogeneous and covers a larger area, an observer cannot identify the two separate components. This would result in observations similar to the one detailed in 6.4.
6.2 Change in the observed flux of one of the lensed images
In the case of perfect alignment between the SMBH and the lensed sources, the produced image can be split. Using the same mock simulation, we measure the flux within a 1.0 arcsecond radius aperture around the image of the source. We find that the apparent change in flux depends greatly on the mass of the SMBH and the underlying magnification of the host cluster. We attempt to quantify the de-magnifying effect and derive the decrements in the flux ratio. Figure 6 shows the de-magnification as a function of magnification boost from the cluster ranging from 1.7 to 30, when the SMBH and image remains well within the cluster’s internal critical curve.
We note that the underlying magnification is more important for a massive SMBH for low magnifications. We interpret this as a consequence of the regime where the underlying properties of the SMBH dominates. For underlying magnifications 9 the detected flux variation converges to only 1% for all masses and magnifications. We note in our simulation that for masses below M⊙, the effect on the flux is the nearly indistinguishable from the case with no SMBH. Only at much higher resolutions, in a situation where the source is smaller than the caustic curve of the SMBH, does the effect of such a configuration become noticeable. We don’t anticipate current and near future facilities to be able to have such resolving capabilities but the main challenge to measure this effect might well be the accuracy of our mass modelling techniques.

6.3 Induced asymmetry with the skewing of the light profile and velocity field
The presence of SMBH wanderers aligned with sources will influence observed lensing configurations, detectable in the case of a source with enough resolution elements or a sharp gradient in color, such as would be seen in a composite image of the velocity field. The presence and proximity of an SMBH can be detected by looking at the light distribution as shown in Figure 7. Less massive SMBHs have a smaller area of influence and therefore need to be closer to the image to produce detectable effects. The detection of the presence of a SMBH is optimal for the configuration showed in Figure 7 where the lensed image has a merging pair configuration and the SMBH is close to the critical curve. This warping of the image is also very similar to the effect induced by sub-halos seen in galaxy-galaxy lensing events (e.g. Hezaveh et al. 2016). This effect might be the most common effect the SMBHs produce viz-a-viz lensing. At a constant underlying magnification, the strength of the warping is mainly affected by the distance between the lensed image and the SMBH. For instance, a SMBH would have a significant effect up to 0.5″away from the arc, a SMBH up to 0.3″, and a SMBH up to 0.1″.

6.4 Apparent increase in the size of one of the lensed images of a multiple
As discussed before, the more massive a SMBH the stronger impact it generates on the overall lensing configuration. In addition, for real observational facilities, taking into account additional effects such as the impact of the point-spread function, and pixel size or noise level also serve decrease our ability to precisely identify SMBH induced lensing configurations. However, even after instrumental effects are taken into account, the light distribution might reveal information to hint the presence of a SMBH. The primary effect would be to increase the apparent size of the image and this too preferentially in the lensing configuration where the SMBH influences an image outside the main cluster critical curve. Figure 8 shows an example of the larger flux distribution induced by an SMBH (M). The source is modeled here as a double Gaussian to simulate the compact and broad emission components. The SMBH is placed outside the critical curve in this case. We note that in this example the area of the principal compact emission knot almost doubles. With a good prior understanding of the source light distribution such a measurement can lower the detectability threshold of SMBHs down to M with HSTspecifications.

6.5 Apparent disappearance of the internal image
As discussed previously, the splitting power of an SMBH can separate images and therefore redistribute the light. When an SMBH is aligned almost exactly with the image of a lensed system inside the cluster critical curve the resulting effect is to separate the image into two ( or into four if it happens to be outside the cluster critical curve). If the image is only split into two, instrumental and observational effects can affect their detectability resulting in the actual disappearance of one of the images. Figure 9 highlights such situation. The PSF convolution and noise induced by the instruments, smooth the signal and make it harder to detect, giving an impression of the disappearance of the image and hence a break in the ”typical” image symmetry.

The apparent disappearance of the inner counter-images is the easiest case to detect in the upcoming large image survey data but this requires as noted a very tight alignment between the image and the SMBH and is therefore, expected to rare. In addition, it is degenerate with the large scale cluster model and detailed source morphology.
7 Observational tests
In this section, we explore for evidence of an SMBH in currently available lensing observations. While we did not find any clear-cut evidence of SMBH lensing in our current fairly exhaustive search of peculiar lensing configurations, we found two cases where a wandering SMBH might provide a potentially plausible explanation to account for what is seen. As mentioned clearly at the start of our investigation, it is extremely challenging to pinpoint the role of an SMBH in any observed configuration as it is degenerate with the effect produced by a dark sub-halo. We want to stress here that tweaking other models not including SMBHs are also able to account for the observed data. However, the parameter space available to interpret the data is still open and it is in this context that we explore the possible role for SMBHs as lenses.
7.1 Asymmetrical lensing configuration in SGAS J003341.5024217
The observational configuration of the arc shown in Figure 10 is akin to the case referred in sub-section 6.4, though SMBH is required to be located on top of the critical curve. Fischer et al. 2019 report the asymmetrical lensing configuration for an arc at merging on the critical curve. To model this case, here we include a wandering SMBH as a perturbation to account for the asymmetrical shape of this arc as shown in Figure 10. The addition of the lensing perturbation from a SMBH allows us to reduce the rms positional error in the current best-fit mass model of the system from 0.17″that does not include this additional degree of freedom of an SMBH, down to ″including the SMBH. This improvement including this additional degree of freedom is real, as it is reflected in the value of the reduced as well. Therefore, the inclusion of a wandering SMBH offers a plausible explanation for constructing a robust model for the observation.

7.2 Disappearance of lensing symmetry in RX J1347.5-1145
Richard et al. 2021 report a peculiar lensing configuration in a massive cluster observed with the combination of HST and MUSE. They identify unique compact continuum emission identified in HST and extended gas emission detected in MUSE that shows a large tail (see their Figure 12 or top panels of Figure 11). With the lensing configuration from the authors’ published model, we would expect similar size for the extended tail on both sides of the critical curve. Here, we propose a different interpretation of the observations resembling the configuration studied in section 6.5 where there is an apparent missing counter image. As reported earlier, a missing counter-image results when the source falls inside the cluster critical curve. Starting with the published models from Richard et al. 2021, we manually tweaked the main cluster model parameters to move the cluster critical curve to the middle of the lobe of the extended emission accomplished using an SMBH. We simulated the emission with two Gaussian distributions on top of each other, to represent the compact continuum emission with a circular gaussian with and the Lyman-alpha emission with a elliptical gaussian with and for the semi-major and semi-minor axis at a 90 degree angle from the horizontal direction. For a source at z4.0840 (Richard et al. 2021) this correspond to a 7 pc and 126 pc for the continuum and Lyman-alpha emission respectively. to mimic the Lyman alpha emission of the observed arc. The northern part of the extended emission is inside the cluster member critical curve and shows the compact continuum emission. We placed an SMBH on the southern part of the arc close enough such that cluster critical curves merge, effectively placing the SMBH inside the main cluster critical curve. This leads to the splitting of the compact emission component on the southern part of the arc. The inclusion of observational effects causes the extended light emission to be smeared into a more elongated shape, reproducing the observation. We, therefore, conclude that with the addition of a SMBH and a simple model for the source light distribution we can qualitatively reproduce the observations. The implication of lensing by a SMBH offers an alternative, viable interpretation. While this is by no means a claim for the detection of the lensing effect of a SMBH, it is simply a demonstration that inclusion of such a perturber offers a neat and natural explanation for the observed asymmetry seen in RX J1347.5-1145.


8 Conclusions
Our analysis explores the observational lensing signatures of SMBHs in galaxy clusters. We model the mass of SMBHs as compact dPIE profiles and study their effect both as centrals hosted by cluster member galaxies as well as free-floating wanderers in the larger cluster environment. The presence of a population of wandering SMBHs in clusters has been recently claimed by Ricarte et al. 2021a from the analysis of high-resolution cosmological simulations. Although the lensing effect of a SMBH is small, it imprints a discernible signature in unusual lensing image configurations, as summarised below:
- •
The presence of a central SMBH primarily affects the radial critical curve of its host, resulting either in its disappearance or by its splitting. Hint of a split critical curve would be a clear evidence for the presence of a central SMBH, but its detection remains challenging due to the overlap of the radial critical curve and the light of the lens itself. Large high-resolution radio surveys might be able to support a concerted search in the future due to the faintness of the emission from the lens at these wavelengths.
- •
The shear induced by central SMBHs is statistically impossible to disentangle from the effect of a change in the density profile at the core of their host galaxies.
- •
Wandering SMBHs can cause the disappearance of counter-images. This effect would be the most obvious signature, however, it is also degenerate with the lensing properties of the larger scale cluster mass model as well as complexities in the intrinsic morphology of background sources.
- •
Outside the cluster critical curve, the typical effect of a wandering compact SMBH would result in the asymmetric elongation of one of the images. This might be much a more common occurrence but to conclusively confirm the presence of the SMBH, a detailed lens model and careful source reconstruction is required to show this anomaly in the reconstructed image.
- •
The changes induced by wandering SMBHs in the light distribution of lensed sources can be tracked in the case of a obvious change in the symmetry of the field, ideally traced where clear gradients exist, such as in the velocity field of a lensed galaxy. Observing this feature requires robust mapping of the true velocity field of the source.
We attempt in this analysis to reconcile previously reported peculiar lensing configurations in SGASJ̇003341.5024217 and RX J1347.5-1145 by including perturbations induced by an SMBH into the mass models. With these new composite mass models, we do not claim detection or discovery of the presence of a SMBH, but rather demonstrate that a class of models with SMBHs (M) might be able to alleviate some of the previously noted tensions in modeling these unusual lensing configurations.
We report that the ideal configurations that would reveal the presence of an SMBH without doubt would be the appearance of a two-image split inside the cluster critical curves. We have not been able so far to identify such a split in observational data currently in hand. In the future, two complementary strategies can be pursued to discover wandering SMBHs. Future large surveys by the Rubin LSST Observatory, Euclid, or the Nancy Grace Roman Telescope will offer orders of magnitude more targets and will likely therefore uncover rare events of massive SMBH alignment. The second strategy would be to point extremely high resolution cameras on giant arcs and/or multiply-imaged systems of clumpy galaxies to push down on the granularity of the mass distributions and hence the mass threshold of detectable SMBHs.
Acknowledgements
GM acknowledges funding from the European Union’s Horizon 2020 research and innovation programme under the Marie Skłodowska-Curie grant agreement No MARACHAS - DLV-896778. PN acknowledges the Black Hole Initiative (BHI) at Harvard University, which is supported by grants from the Gordon and Betty Moore Foundation and the John Templeton Foundation. PN acknowledges useful conversations with Angelo Ricarte and Michael Tremmel. MJ is supported by the United Kingdom Research and Innovation (UKRI) Future Leaders Fellowship ‘Using Cosmic Beasts to uncover the Nature of Dark Matter’ (grant number MR/S017216/1).
Data Availability
The data underlying this article are available in the article and in its online supplementary material. https://sites.google.com/view/guillaume-mahler-astronomer/paper-animation
References
- Banik et al. (2019) Banik U., van den Bosch F. C., Tremmel M., More A., Despali G., More S., Vegetti S., McKean J. P., 2019, MNRAS, 483, 1558
- Chen et al. (2018) Chen M. C., Broadhurst T., Lim J., Diego J. M., Ohyama Y., Ford H., Benítez N., 2018, ApJ, 863, 135
- Collett & Smith (2020) Collett T. E., Smith R. J., 2020, MNRAS, 497, 1654
- Dahle et al. (2013) Dahle H., et al., 2013, ApJ, 773, 146
- Dai & Miralda-Escudé (2020) Dai L., Miralda-Escudé J., 2020, AJ, 159, 49
- Diego et al. (2018) Diego J. M., et al., 2018, ApJ, 857, 25
- Elíasdóttir et al. (2007) Elíasdóttir Á., et al., 2007, preprint, (arXiv:0710.5636)
- Event Horizon Telescope Collaboration et al. (2019) Event Horizon Telescope Collaboration et al., 2019, ApJ, 875, L1
- Ferrarese & Merritt (2000) Ferrarese L., Merritt D., 2000, ApJ, 539, L9
- Fischer et al. (2019) Fischer T. C., et al., 2019, ApJ, 875, 102
- Gebhardt et al. (2000) Gebhardt K., et al., 2000, ApJ, 539, L13
- Gültekin et al. (2009) Gültekin K., et al., 2009, ApJ, 698, 198
- Haggar et al. (2022) Haggar R., Kuchner U., Gray M. E., Pearce F. R., Knebe A., Yepes G., Cui W., 2022, arXiv e-prints, p. arXiv:2209.13604
- Hezaveh et al. (2016) Hezaveh Y. D., et al., 2016, ApJ, 823, 37
- Inada et al. (2008) Inada N., Oguri M., Falco E. E., Broadhurst T. J., Ofek E. O., Kochanek C. S., Sharon K., Smith G. P., 2008, PASJ, 60, 27
- Jullo et al. (2007) Jullo E., Kneib J. P., Limousin M., Elíasdóttir Á., Marshall P. J., Verdugo T., 2007, New Journal of Physics, 9, 447
- Karamazov & Heyrovsky (2021) Karamazov M., Heyrovsky D., 2021, arXiv e-prints, p. arXiv:2109.02495
- Karamazov et al. (2021) Karamazov M., Timko L., Heyrovsky D., 2021, arXiv e-prints, p. arXiv:2103.16965
- Kassiola & Kovner (1993) Kassiola A., Kovner I., 1993, ApJ, 417, 450
- Keeton (2003) Keeton C. R., 2003, ApJ, 582, 17
- Kelly et al. (2018) Kelly P. L., et al., 2018, Nature Astronomy, 2, 334
- Kneib & Natarajan (2011) Kneib J.-P., Natarajan P., 2011, A&ARv, 19, 47
- Magorrian et al. (1998) Magorrian J., et al., 1998, AJ, 115, 2285
- Mahler et al. (2018) Mahler G., et al., 2018, MNRAS, 473, 663
- Mahler et al. (2019) Mahler G., et al., 2019, ApJ, 873, 96
- Mao et al. (2001) Mao S., Witt H. J., Koopmans L. V. E., 2001, MNRAS, 323, 301
- Martinez et al. (2022) Martinez M. N., et al., 2022, arXiv e-prints, p. arXiv:2209.03972
- Minor et al. (2021a) Minor Q., Kaplinghat M., Chan T. H., Simon E., 2021a, MNRAS, 507, 1202
- Minor et al. (2021b) Minor Q., Gad-Nasr S., Kaplinghat M., Vegetti S., 2021b, MNRAS, 507, 1662
- Muller et al. (2020) Muller S., Jaswanth S., Horellou C., Martí-Vidal I., 2020, A&A, 641, L2
- Natarajan & Kneib (1997) Natarajan P., Kneib J.-P., 1997, MNRAS, 287, 833
- Natarajan et al. (2017) Natarajan P., et al., 2017, MNRAS, 468, 1962
- Niemiec et al. (2018) Niemiec A., et al., 2018, MNRAS, 477, L1
- Orban de Xivry & Marshall (2009) Orban de Xivry G., Marshall P., 2009, MNRAS, 399, 2
- Ostrovski et al. (2018) Ostrovski F., et al., 2018, MNRAS, 473, L116
- Pastor Mira et al. (2011) Pastor Mira E., Hilbert S., Hartlap J., Schneider P., 2011, A&A, 531, A169
- Paynter & Thrane (2022) Paynter J., Thrane E., 2022, arXiv e-prints, p. arXiv:2210.03267
- Quinn et al. (2016) Quinn J., et al., 2016, MNRAS, 459, 2394
- Ricarte et al. (2021a) Ricarte A., Tremmel M., Natarajan P., Zimmer C., Quinn T., 2021a, MNRAS, 503, 6098
- Ricarte et al. (2021b) Ricarte A., Tremmel M., Natarajan P., Quinn T., 2021b, ApJ, 916, L18
- Richard et al. (2010) Richard J., et al., 2010, MNRAS, 404, 325
- Richard et al. (2021) Richard J., et al., 2021, A&A, 646, A83
- Rusin et al. (2005) Rusin D., Keeton C. R., Winn J. N., 2005, ApJ, 627, L93
- Schneider et al. (1992) Schneider P., Ehlers J., Falco E. E., 1992, Gravitational Lenses, doi:10.1007/978-3-662-03758-4.
- Sharon et al. (2017) Sharon K., et al., 2017, ApJ, 835, 5
- Sifón et al. (2018) Sifón C., Herbonnet R., Hoekstra H., van der Burg R. F. J., Viola M., 2018, MNRAS, 478, 1244
- Smith & Collett (2021) Smith R. J., Collett T. E., 2021, MNRAS, 505, 2136
- Smith et al. (2017) Smith R. J., Lucey J. R., Edge A. C., 2017, MNRAS, 467, 836
- Tamura et al. (2015) Tamura Y., Oguri M., Iono D., Hatsukade B., Matsuda Y., Hayashi M., 2015, PASJ, 67, 72
- Tremaine et al. (2002) Tremaine S., et al., 2002, ApJ, 574, 740
- Tremmel et al. (2019) Tremmel M., et al., 2019, MNRAS, 483, 3336
- Werner & Evans (2006) Werner M. C., Evans N. W., 2006, MNRAS, 368, 1362
- Winn et al. (2004) Winn J. N., Rusin D., Kochanek C. S., 2004, Nature, 427, 613
- Wong et al. (2015) Wong K. C., Suyu S. H., Matsushita S., 2015, ApJ, 811, 115
- Wong et al. (2017) Wong K. C., Ishida T., Tamura Y., Suyu S. H., Oguri M., Matsushita S., 2017, ApJ, 843, L35
- Wu et al. (2013) Wu H.-Y., Hahn O., Wechsler R. H., Behroozi P. S., Mao Y.-Y., 2013, ApJ, 767, 23
- van den Bosch et al. (2012) van den Bosch R. C. E., Gebhardt K., Gültekin K., van de Ven G., van der Wel A., Walsh J. L., 2012, Nature, 491, 729
Appendix A Ellipticity of the cluster halo
Following our analysis on lensing configurations for different profil and masses of SMBH as described in 3 We quickly document here two cases of the influence of the cluster scale halo ellipticity on the lensing configurations for a combinations of three mass. A cluster halo simulated as an NFW, parameterised as , r kpc giving a total mass of M), a host galaxy parameterised with a dPIE (r kpc, r kpc, and SMBH with two masses MM⊙and MM⊙. We can notice that the critical at the center is able to split at an earlier mass than the cases report in 2, if the cluster scale halo show a high enough ellipticity.
