Multi-Graph Fusion Networks for Urban Region Embedding
Abstract
Learning the embeddings for urban regions from human mobility data can reveal the functionality of regions, and then enables the correlated but distinct tasks such as crime prediction. Human mobility data contains rich but abundant information, which yields to the comprehensive region embeddings for cross domain tasks. In this paper, we propose multi-graph fusion networks (MGFN) to enable the cross domain prediction tasks. First, we integrate the graphs with spatio-temporal similarity as mobility patterns through a mobility graph fusion module. Then, in the mobility pattern joint learning module, we design the multi-level cross-attention mechanism to learn the comprehensive embeddings from multiple mobility patterns based on intra-pattern and inter-pattern messages. Finally, we conduct extensive experiments on real-world urban datasets. Experimental results demonstrate that the proposed MGFN outperforms the state-of-the-art methods by up to 13.11 improvement. https://github.com/wushangbin/MGFN
1 Introduction
Revealing urban region embedding aims to learn quantitative representations of regions from multi-sourced data, such as Point-of-Interests (POI), check-in, and human mobility Wang and Li 2017. Human mobility data reflects the human interactions and cooperation, and thus can be used to conduct distinct tasks such as epidemic Wu et al. 2021, economics Xu et al. 2020, crime Xia et al. 2021 prediction, etc.
The cross-domain downstream tasks such as crime prediction and check-in prediction, are used to verify the effectiveness of region embeddings. Existing studies Du et al. 2019; Wang and Li 2017; Yao et al. 2018 taking all detailed time-series mobility records as input, could merely learn a specific representation (e.g., change of traffic flows), rather than generalized urban region embeddings.
Human mobility data contains both abundant information and complex patterns Dang et al. 2022, which yields to the comprehensive region embeddings for cross domain tasks. For example, Figure 1 (left) shows two repeated patterns, which can be integrated as Pattern 1 (morning peak) and Pattern 2 (weekend) respectively. Figure 1 (right) shows the complexity of mobility patterns that there are two distinct patterns (i.e., variation and similarity). Measuring a generalized region embeddings from abundant human mobility data is challenging:

Challenge 1: How to process the fine-grained mobility data to learn a generalized embedding? In our considered scenario, learning from abundant human mobility data may only attain the change of mobility flows, rather than a generalized embedding.
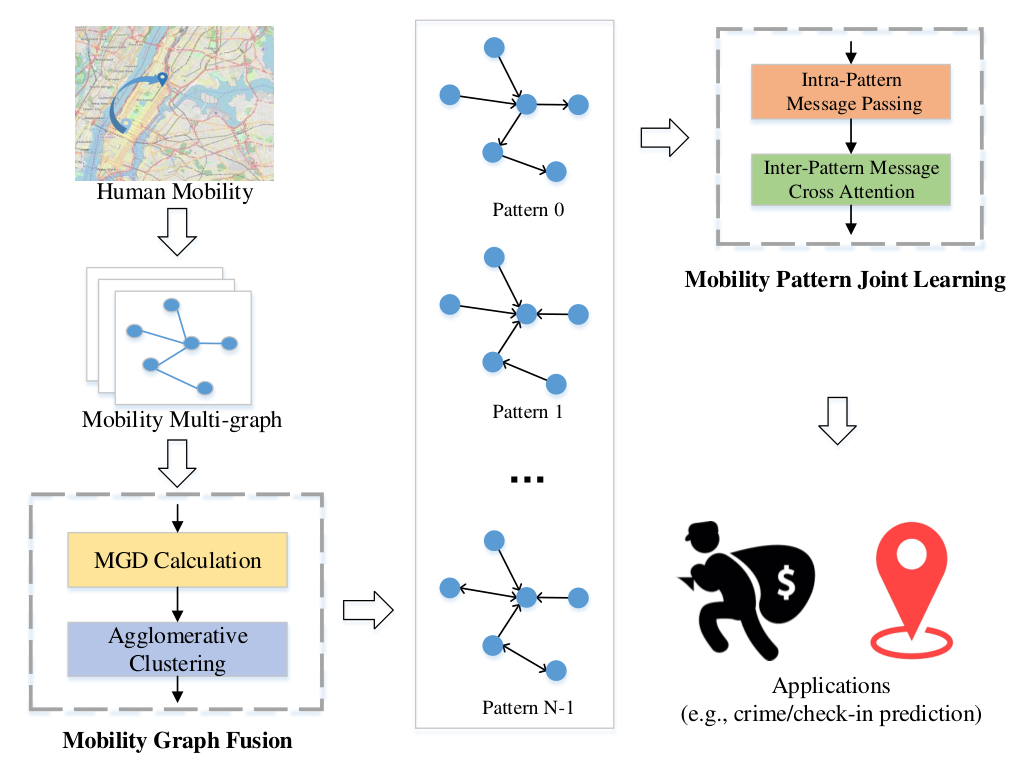
Solution 1: Mobility graph fusion. To attain an effective and generalized embedding from abundant human mobility data, we first approach regions as interactive and interdependent nodes by constructing the human mobility data as mobility multi-graph. Then, we aggregate mobility graphs as selected mobility patterns according to the spatio-temporal distance between any two mobility graphs.
Challenge 2: How to jointly learn from mobility patterns? Training a separate pattern mining model on each of them may not capture comprehensive representation of regional characteristics.
Solution 2: Mobility Pattern Joint Learning. The constructed mobility graphs possess regularized characteristics, which are fully connected, directed, and weighted with multiple edges (i.e., multi-graph). Different from previous graph representation models Zhang et al. 2020, we take advantage of above characteristics by designing two modules: (1) Intra-pattern message passing, which utilizes structural information inside each graph to learn a local embedding; and (2) Inter-pattern message cross attention, which conducts attention mechanism among different graphs to jointly learn comprehensive region embeddings.
The major contributions of this paper are:
- •
We study the urban region representation problem on fine-grained human mobility data, and propose a mobility graph fusion module with spatio-temporal dependencies where redundant graphs are integrated as patterns.
- •
We propose a mobility pattern joint learning module, which learns the region embedding from intra-pattern message and inter-pattern message simultaneously in a new manner, with the hope that the cross-graph information can mutually enhance each other.
- •
Extensive experimental results show that our mobility graph fusion method can effectively uncover the complex mobility patterns. And our method outperforms state-of-the-art baselines up to 13.11 in crime and check-in prediction tasks in terms of various metrics.
2 Problem Statement
We provide necessary preliminary concepts in this work, and formalize the problem of urban region embedding.
Definition 1 (Mobility Graph).
The mobility graph at the time step is defined as a directed and weighted graph , where denotes the node set with node representing region , and denotes the edge set with edge representing the number of people move from urban region to at time .
Definition 2 (Mobility Multi-graph).
It is defined as a directed and weighted multi-graph , where is a mobility graph at time , and denotes the node set that corresponds to regions, and denotes the edge set that corresponds to mobility condition at time .
Definition 3 (Mobility Pattern).
The mobility patterns are the result of fusing similar mobility multi-graph. A pattern is also a directed and weighted graph with the same node set as mobility multi-graph.
Definition 4 (Urban Region Embedding).
Given mobility multi-graph , the goal of urban region embedding is to learn a mapping function to generate low dimensional embedding of each region , where represents the dimension of urban region embeddings.
3 Methodology
In this section, we first introduce the mobility graph fusion module, in which we propose a novel mobility graph distance to measure the similarity between different mobility graphs. Then, we present an effective mobility pattern joint learning module, which contains intra-pattern message passing and inter-pattern message cross attention to capture comprehensive regional characterise by mobility patterns. Figure 2 shows the overall architecture of our multi-graph fusion network.
3.1 Mobility Graph Fusion
Human mobility reveals the functions and properties of urban regions Wang and Li 2017. Our intuition is that mobility patterns are able to describe the urban region functionality thus in favour of learning the generalized representation. For example, estimate whether a region is work area or residential area according to the human mobility direction during the morning peak hours (i.e., 7-9 a.m.). Therefore, instead of learning how human mobility changes, we model the problem as time-series mobility multi-graph fusion (MGF) to extract the mobility patterns. First, we define mobility graph distance (MGD) to calculate the distance between mobility graphs, and apply clustering methods with MGD to cluster similar mobility graphs. Second, in each cluster, we aggregate edges in all mobility graphs to form a mobility pattern.
3.1.1 Spatial Structure Distance on Mobility Graph
Data with similar mean and variance may have higher similarity. Specifically, for a mobility graph , we assume that the weight of edge is sampled from a Gaussian distribution, and calculate its mean and variance :
| (1) |
Then, the mean distance and variance distance between the mobility graph and are expressed as:
| (2) | ||||
| (3) |
It is not sufficient to only compare the mean and variance. For example, The mean and variance of the morning and evening peak hours are similar, but their destinations are different (working and residential areas, respectively). Specifically, to pay attention to flow imbalance of two regions, we first propose the unidirectional flow distance:
| (4) |
where is the unidirectional flow index of the graph, and .
Then, to highlight the high-weight edges in mobility graph , we encode as a spatial structure label matrix , where each element represents whether the weight of edge in is large enough:
| (5) |
where represents the mean value of edge weight between node and over the time series.
Afterwards, the spatial structure encoding distance between mobility graphs and is defined as follows:
| (6) |
where is the xor operation.
3.1.2 Temporal Aggregation with Mobility Graph Distance
After calculating the distances between mobility graphs, considering mobility graphs with close temporal distance are similar, we take temporal similarity into account. We define mobility graph distance (MGD) between mobility graphs and as the sum of above distance weighted by the temporal similarity with non-linearity, given as follows:
| (7) |
where is the weight of -th distance, could be , denotes the normalization function such as MinMaxScaler, is an activation function. denotes the time interval between and .
Finally, we calculate the distance between mobility graphs through MGD, and use the clustering method (i.e., hierarchical cluster) to aggregate mobility graphs with different patterns thus to generate mobility patterns .
3.2 Mobility Pattern Joint Learning
In order to learn the underlying information of urban regions from mobility patterns, we present a mobility pattern joint learning module as shown in Figure 3. The framework mainly consists of two parts: intra-pattern message passing and inter-pattern message cross attention. In the first part, the region hidden representations are updated by intra-pattern message propagating and aggregating in each mobility pattern thus extracting the spatial correlations between regions. In the second part, the cross-attention mechanism is used to integrate the inter-pattern message between the different mobility patterns for each region. Comprehensive embeddings output by two parts with residual connections He et al. 2016 are integrated by a fully connected layer to generate the final region embeddings.

3.2.1 Intra-Pattern Message Passing
The property of an urban region is affected by other regions with different impacts due to the spatial correlations. We assume that such impact is highly correlated to the human mobility condition of a region. To capture the spatial correlations, inspired by Gilmer et al. 2017, we design a intra-pattern message passing layer to propagate the inner flow messages between different regions in each mobility pattern.
This part takes mobility patterns as input. We initialize the -layer hidden representations of regions in mobility pattern as input region features , i.e.: . Considering the mobility flow from region to region , inspired by Veličković et al. 2017, we compute the message sent along the mobility flow edge by self-attention mechanism. The message function is defined as follows:
| (8) |
where is inner product, and are two trainable projection matrices, and is neighbor region set of . Here, the message from region to is also attention score.
Afterwards, region aggregates the messages sent by its neighbor regions , and updates its hidden representation by a weighed sum from , given as follows.
| (9) |
where is a learnable projection matrix in layer. Here, as the mobility pattern is a directed complete graph, the neighbors of each region are all the regions.
To stabilize the learning process and learn information at different conceptual levels, we extend the self-attention mechanism to be multi-head ones Vaswani et al. 2017. Specifically, we concatenate parallel attention message functions with different learnable projections:
| (10) |
where represents concatenation operation, and represents the attention score calculated by the message function in the head attention.
Taking the importance of mobility directions and the difference between in-flow and out-flow mobility for a region into account, we divide each mobility pattern into two parts: source mobility pattern and target mobility pattern . Here, we regard the out-flow and in-flow mobility as node features of source intra-pattern and target intra-pattern , and apply intra-message passing layer in these two type of patterns, respectively, where . To fuse these two region representations, we project the concatenation of them to generate hidden representation of :
| (11) |
where represents a linear projection. The region hidden representations extracting spatial dependency of mobility patterns are generated by stacking intra-pattern message passing layers.
3.2.2 Inter-Pattern Message Cross Attention
Intra-pattern message passing provides a robust mechanism for capturing the spatial correlations between regions in each mobility pattern. For learning the cross interactions between different mobility patterns for a region, we allow region to interact across mobility patterns via a self-attention mechanism Vaswani et al. 2017.
Considering the region in mobility pattern and , let the node features in and are and , respectively. Then, for every such pair, we compute the correlation between and using attention as follows:
| (12) |
where and are two trainable projection matrices, and the attention score reveals how attends to the features of region of . Afterwards, we compute an inter-pattern message for the region of mobility pattern by a weighed sum, where the multi-head attention is applied again:
| (13) |
where is a learnable projection matrix.
Finally, the fused region embedding of is updated by aggregating the inter-pattern message with mean aggregator:
| (14) |
3.2.3 Objective Function
With the residual connection of intra-pattern message passing, we use a fully connected layer as an output layer to obtain the final region embeddings :
| (15) |
Following Wang and Li 2017, we use region embeddings to estimate the distribution of mobility, and learn the embedding by minimizing the difference between the true distribution and the estimated distribution. Given the source , we calculate the transition probability of destination :
| (16) |
Then, given the region embedding , for region , , we estimate the transition probability:
| (17) |
Finally, the objective function can expressed as:
| (18) |
4 Evaluation
This section aims to answer the following research questions:
RQ1
How is the performance of out MGFN as compared to various state-of-the-art methods?
RQ2
How do different components (e.g., mobility graph fusion, mobility pattern joint learning) affect the results?
RQ3
Can the proposed mobility graph fusion module really discover mobility patterns? What are its advantages compared with other methods?
RQ4
Why did other models perform worse than ours? Is it true that the other methods learned how traffic flow changes? (as we assume in Section 1)
4.1 Experiment Settings
Data Description
We evaluate the performance of our method on New York City (NYC) datasets from NYC open data website 11 1 opendata.cityofnewyork.us. Census blocks gives the boundaries of 180 regions split by streets in Manhattan, NYC. Taxi trips describes around 10 million taxi trip records during one month in the studied area. Crime count consists of around 40 thousand crime records during one year in the studied area. Check-in count contains over 100 thousand check-in locations of over 200 fine-grained categories. Land usage type divides the borough of Manhattan into 12 districts by the community boards. We follow the settings in Zhang et al. 2020 and apply taxi trip data as human mobility data and take the crime count, check-in count, land usage type as prediction tasks, respectively.
Baselines
We compare MGFN with the following baseline methods: (1) node2vec Grover and Leskovec 2016 uses biased random walks to learn node latent representations by skip-gram models; (2) LINE Tang et al. 2015 optimizes the objective function that preserves both the local and global network structures. (3) HDGE Wang and Li 2017 jointly embeds a spatial graph and a flow graph with temporal dynamics. (4) ZE-Mob Yao et al. 2018 captures massive human mobility patterns, and models spatio-temporal co-occurrence of zones in the embedding learning; (5) MV-PN Fu et al. 2019 learns region embeddings with multi-view PoI network within the region; (6) MVURE Zhang et al. 2020 enable cross-view information sharing and weighted multi-view fusion with human mobility and inherent region attributes data (e.g. POI, check-in).
Parameter Settings
Following Zhang et al. 2020, the dimension of region embeddings is 96. In mobility graph fusion module, the weight in MGD is set as 1, and the number of mobility patterns is set as 7. In mobility pattern joint learning module, the number of layers is set as 1.
4.2 Performance Comparison (RQ1)
| Crime Prediction | Land Usage Classification | Check-in Prediction | ||||||
|---|---|---|---|---|---|---|---|---|
| MAE | RMSE | R2 | NMI | ARI | MAE | RMSE | R2 | |
| LINE | 117.53 | 152.43 | 0.06 | 0.17 | 0.01 | 564.59 | 853.82 | 0.08 |
| node2vec | 75.09 | 104.97 | 0.49 | 0.58 | 0.35 | 372.83 | 609.47 | 0.44 |
| HDGE | 72.65 | 96.36 | 0.58 | 0.59 | 0.29 | 399.28 | 536.27 | 0.57 |
| ZE-Mob | 101.98 | 132.16 | 0.20 | 0.61 | 0.39 | 360.71 | 592.92 | 0.47 |
| MV-PN | 92.30 | 123.96 | 0.30 | 0.38 | 0.16 | 476.14 | 784.25 | 0.08 |
| MVURE | 69.28 3.13 | 96.51 4.73 | 0.57 0.04 | 0.78 0.02 | 0.62 0.06 | 312.63 9.61 | 513.02 16.64 | 0.61 0.03 |
| MGFN | 70.21 2.31 | 89.60 2.50 | 0.63 0.02 | 0.75 0.01 | 0.57 0.01 | 292.60 17.05 | 451.76 28.12 | 0.69 0.04 |
For regression tasks (i.e., crime, check-in), we apply the Lasso regression Tibshirani 1996 with metrics of Mean Absolute Error (MAE), Root Mean Square Error (RMSE) and coefficient of determination (R2). For the clustering task (i.e., land usage classification), we use K-means to cluster region embeddings with Normalized Mutual Information (NMI) and Adjusted Rand Index (ARI) with settings in Yao et al. 2018. Table 1 shows the results of crime prediction, land usage classification and check-in count prediction. We observe that: (1) urban region embedding approaches outperform traditional graph embedding methods, and graph modeling methods (i.e., MG-FN, MVURE) generally perform better than HDGE, ZE-Mob and MV-PN, indicating the spatial dependency between regions is a necessity for urban region embedding; and (2) our MGFN with only human mobility data outperforms the second best model MVURE with multi-sourced data (POI, check-in, mobility, etc.) and achieves up to 13.11% improvement in terms of in the check-in prediction task. It is noted that multi-sourced data used in MVURE is always unreachable or accompanied by many noise data in real urban application.
4.3 Model Ablation Study (RQ2)
To further investigate the effect of each component in our model, we compare MGFN with its three variants by removing multi graph fusion module, intra-pattern message passing and inter-pattern message cross attention in mobility pattern joint learning module from our method, which are named as MGFN-NF, MGFN-NP and MGFN-NC, respectively. Figure 4 shows the MAE, ARI and RMSE results of MGFN and its variants in crime prediction, land usage classification and check-in prediction tasks respectively. We observe that MGFN performs better than MGFN-NF, demonstrating that the MGF module effectively eases the redundant temporal information for learning more general representations of urban regions. Moreover, MGFN consistently outperforms MGFN-NP and MGFN-NC, which indicates the effectiveness of intra message passing and aggregating between nodes in each mobility pattern and inter messages fusion between mobility patterns in modeling the complex spatial correlations.
4.4 Graph Similarity Measurement (RQ3)
To intuitively evaluate the performance of the proposed Mobility Graph Fusion module (Section 3.1), we visualize the mobility patterns extracted by our multi-graph distance (MGD) measurement compared with three measures in Section 3.1 including Mean, Std, and Uniflow using hierarchical clustering. Specifically, in Figure 5, a certain color represents a specific pattern corresponding to the law of human mobility. We observe that different from other measures, our MGD (Figure 5.d) is able to distinguish patterns of both morning/evening peaks and working days/weekends effectively, due to our integrated considerations with spatio-temporal information. We argue that this improvement is beneficial to enabling the cross-domain prediction (i.e., from traffic prediction to crime prediction) by uncovering the dynamic correlations contained in urban regional functionality.
4.5 Generalization Ability of MGFN (RQ4)
To show the generalization ability of our method, we compare our MGFN with other three methods on both supervised task (i.e., mobility prediction) and cross-domain task (i.e., crime prediction) in Figure 6. Other methods perform poorly on cross-domain tasks because they learn how traffic changes rather than a generalized region representation. Moreover, after removed MGF, the generalization performance is reduced by about 20, which shows the importance of MGF.
5 Related Works
Graph Representation Learning
Graph embedding aims to learn a low-dimensional vector by mapping the characteristics of nodes to a low-dimensional vector space so that the proximities of nodes can be well preserved Cui et al. 2018. Early works devote to learn the shallow representations by graph factorization approaches Belkin and Niyogi 2001 relying on spectral embedding from graph Laplacian and skip-gram based methods Perozzi et al. 2014; Grover and Leskovec 2016; Tang et al. 2015 learned by random walk objectives. More recently, graph neural networks (GNNs) have become a widely used tool for graph embedding Veličković et al. 2017; Gilmer et al. 2017.
Region Representation Learning
Several strategies have been studied to learn the representation of regions. The first strategy learns embeddings from time-series human mobility data. HDGE Wang and Li 2017 uses fine-grained human mobility to construct flow graph, and learn the region embedding at different times. ZE-mob Yao et al. 2018 regards the region as a word and the mobility event as context, and learn the embedding via a word embedding method. The second strategy learns embeddings from multi-view cross-geo-type(region and other spatio-temporal items) correlations. Fu et al. Fu et al. 2019 take into account both intra-region structural information and inter-region spatial auto-correlations. Zhang et al. Zhang et al. 2020 use a cross-view information sharing method to learn comprehensive region embeddings.
6 Conclusion
In this paper, we focus on learning generalized embeddings to enable cross domain urban computing tasks. We proposed: (1) a novel mobility graph fusion method where redundant graphs are integrated as patterns; and (2) a novel mobility pattern joint learning method to enable the cross graph embeddings that mutually enhance each other and provide more effective representation for downstream tasks. Extensive experiments on real-world mobility data show the proposed MGFN outperforms all baseline methods. Besides, in-depth analysis reveals insightful observations, e.g., Late nights and evenings on weekends show a different pattern from workdays. In future, we will extend our framework to other downstream tasks (e.g., house price prediction).
Acknowledgments
The research is supported by Natural Science Foundation of China (61872306), and Fundamental Research Funds for the Central Universities (20720200031).
References
- Belkin and Niyogi [2001] Mikhail Belkin and Partha Niyogi. Laplacian eigenmaps and spectral techniques for embedding and clustering. In Nips, volume 14, pages 585–591, 2001.
- Cui et al. [2018] Peng Cui, Xiao Wang, Jian Pei, and Wenwu Zhu. A survey on network embedding. IEEE Transactions on Knowledge and Data Engineering, 31(5):833–852, 2018.
- Dang et al. [2022] Weizhen Dang, Haibo Wang, Shirui Pan, Pei Zhang, Chuan Zhou, Xin Chen, and Jilong Wang. Predicting human mobility via graph convolutional dual-attentive networks. In Proceedings of the Fifteenth ACM International Conference on Web Search and Data Mining, WSDM ’22, page 192–200, New York, NY, USA, 2022. Association for Computing Machinery.
- Du et al. [2019] J. Du, Y. Zhang, P. Wang, J. Leopold, and Y. Fu. Beyond geo-first law: Learning spatial representations via integrated autocorrelations and complementarity. In 2019 IEEE International Conference on Data Mining (ICDM), pages 160–169, Los Alamitos, CA, USA, nov 2019. IEEE Computer Society.
- Fu et al. [2019] Yanjie Fu, Pengyang Wang, Jiadi Du, Le Wu, and Xiaolin Li. Efficient region embedding with multi-view spatial networks: A perspective of locality-constrained spatial autocorrelations. In Proceedings of the AAAI Conference on Artificial Intelligence, volume 33, pages 906–913, 2019.
- Gilmer et al. [2017] Justin Gilmer, Samuel S Schoenholz, Patrick F Riley, Oriol Vinyals, and George E Dahl. Neural message passing for quantum chemistry. In International conference on machine learning, pages 1263–1272. PMLR, 2017.
- Grover and Leskovec [2016] Aditya Grover and Jure Leskovec. node2vec: Scalable feature learning for networks. In Proceedings of the 22nd ACM SIGKDD international conference on Knowledge discovery and data mining, pages 855–864, 2016.
- He et al. [2016] Kaiming He, Xiangyu Zhang, Shaoqing Ren, and Jian Sun. Deep residual learning for image recognition. In Proceedings of the IEEE conference on computer vision and pattern recognition, pages 770–778, 2016.
- Perozzi et al. [2014] Bryan Perozzi, Rami Al-Rfou, and Steven Skiena. Deepwalk: Online learning of social representations. In Proceedings of the 20th ACM SIGKDD international conference on Knowledge discovery and data mining, pages 701–710, 2014.
- Tang et al. [2015] Jian Tang, Meng Qu, Mingzhe Wang, Ming Zhang, Jun Yan, and Qiaozhu Mei. Line: Large-scale information network embedding. In Proceedings of the 24th International Conference on World Wide Web, WWW ’15, page 1067–1077, Republic and Canton of Geneva, CHE, 2015. International World Wide Web Conferences Steering Committee.
- Tibshirani [1996] Robert Tibshirani. Regression shrinkage and selection via the lasso. Journal of the Royal Statistical Society: Series B (Methodological), 58(1):267–288, 1996.
- Vaswani et al. [2017] Ashish Vaswani, Noam Shazeer, Niki Parmar, Jakob Uszkoreit, Llion Jones, Aidan N Gomez, Łukasz Kaiser, and Illia Polosukhin. Attention is all you need. In Advances in neural information processing systems, pages 5998–6008, 2017.
- Veličković et al. [2017] Petar Veličković, Guillem Cucurull, Arantxa Casanova, Adriana Romero, Pietro Lio, and Yoshua Bengio. Graph attention networks. arXiv preprint arXiv:1710.10903, 2017.
- Wang and Li [2017] Hongjian Wang and Zhenhui Li. Region representation learning via mobility flow. International Conference on Information and Knowledge Management, Proceedings, Part F1318:237–246, 2017.
- Wu et al. [2021] Shangbin Wu, Xiaoliang Fan, Longbiao Chen, Ming Cheng, and Cheng Wang. Predicting the spread of covid-19 in china with human mobility data. In Proceedings of the 29th International Conference on Advances in Geographic Information Systems, SIGSPATIAL ’21, page 240–243, New York, NY, USA, 2021. Association for Computing Machinery.
- Xia et al. [2021] Lianghao Xia, Chao Huang, Yong Xu, Peng Dai, Liefeng Bo, Xiyue Zhang, and Tianyi Chen. Spatial-temporal sequential hypergraph network for crime prediction with dynamic multiplex relation learning. In Zhi-Hua Zhou, editor, Proceedings of the Thirtieth International Joint Conference on Artificial Intelligence, IJCAI-21, pages 1631–1637. International Joint Conferences on Artificial Intelligence Organization, 8 2021. Main Track.
- Xu et al. [2020] Fengli Xu, Yong Li, and Shusheng Xu. Attentional Multi-Graph Convolutional Network for Regional Economy Prediction with Open Migration Data, page 2225–2233. Association for Computing Machinery, New York, NY, USA, 2020.
- Yao et al. [2018] Zijun Yao, Yanjie Fu, Bin Liu, Wangsu Hu, and Hui Xiong. Representing urban functions through zone embedding with human mobility patterns. IJCAI International Joint Conference on Artificial Intelligence, 2018-July:3919–3925, 2018.
- Zhang et al. [2020] Mingyang Zhang, Tong Li, Yong Li, and Pan Hui. Multi-view joint graph representation learning for urban region embedding. In Christian Bessiere, editor, Proceedings of the Twenty-Ninth International Joint Conference on Artificial Intelligence, IJCAI-20, pages 4431–4437. International Joint Conferences on Artificial Intelligence Organization, 7 2020. Special track on AI for CompSust and Human well-being.