DrugOOD: Out-of-Distribution (OOD) Dataset Curator and Benchmark for AI-aided Drug Discovery
– A Focus on Affinity Prediction Problems with Noise Annotations
Abstract
AI-aided drug discovery (AIDD) is gaining increasing popularity due to its promise of making the search for new pharmaceuticals quicker, cheaper and more efficient. In spite of its extensive use in many fields, such as ADMET prediction, virtual screening, protein folding and generative chemistry, little has been explored in terms of the out-of-distribution (OOD) learning problem with noise, which is inevitable in real world AIDD applications.
In this work, we present DrugOOD 11 1 Project Page: https://drugood.github.io, a systematic OOD dataset curator and benchmark for AI-aided drug discovery, which comes with an open-source Python package that fully automates the data curation and OOD benchmarking processes. We focus on one of the most crucial problems in AIDD: drug target binding affinity prediction, which involves both macromolecule (protein target) and small-molecule (drug compound). In contrast to only providing fixed datasets, DrugOOD offers automated dataset curator with user-friendly customization scripts, rich domain annotations aligned with biochemistry knowledge, realistic noise annotations and rigorous benchmarking of state-of-the-art OOD algorithms. Since the molecular data is often modeled as irregular graphs using graph neural network (GNN) backbones, DrugOOD also serves as a valuable testbed for graph OOD learning problems. Extensive empirical studies have shown a significant performance gap between in-distribution and out-of-distribution experiments, which highlights the need to develop better schemes that can allow for OOD generalization under noise for AIDD.
Keywords: AI-aided drug discovery (AIDD), graph OOD learning, OOD generalization, learning under noise, binding affinity prediction, drug-target interaction, virtual screening
1 Introduction
The traditional drug discovery process is extremely time-consuming and expensive. Typically, the development of a new drug takes nearly a decade and costs about $3 billion (Pushpakom et al. 2019), whereas about 90% of experimental drugs fail during lab, animal or human testing. Meanwhile, the number of drugs approved every year per dollar spent on development has plateaued or decreased for most of the past decade (Nosengo 2016). To accelerate the development for new drugs, drugmakers and investors turn their attention to artificial intelligence (Muratov et al. 2020) techniques for drug discovery, which aims at rapidly identifying new compounds and modeling complex mechanisms in the body to automate previously manual processes (Schneider 2018).
The applications of AI aided drug discovery is being continuously extended in the pharmaceutical field, ranging from ADMET prediction (Wu et al. 2018; Rong et al. 2020), target identification (Zeng et al. 2020; Mamoshina et al. 2018), protein structure prediction and protein design (Jumper et al. 2021; Baek et al. 2021; Gao et al. 2020), retrosynthetic analysis (Coley et al. 2017; Segler et al. 2018; Yan et al. 2020a), search of antibiotics (Stokes et al. 2020), generative chemistry (Sanchez-Lengeling et al. 2017; Simonovsky & Komodakis 2018), drug repurposing for emerging diseases (Gysi et al. 2021) to virtual screening (Hu et al. 2016; Karimi et al. 2019; Lim et al. 2019). Among them, virtual screening is one of the most important yet challenging applications. The aim of virtual screening is to pinpoint a small set of compounds with high binding affinity for a given target protein in the presence of a large number of candidate compounds. A crucial task in solving the virtual screening problem is to develop computational approaches to predict the binding affinity of a given drug-target pair, which is the main task studied in this paper.
In the field of AI-aided drug discovery, the problem of distribution shift, where the training distribution differs from the test distribution, is ubiquitous. For instance, when performing virtual screening for hit finding, the prediction model is typically trained on known target proteins. However, a “black swan” event like COVID-19 can occur, resulting in a new target with unseen data distribution. The performance on the new target will significantly degrades. To handle the performance degradation (Koh et al. 2021) caused by distribution shift, it is essential to develop robust and generalizable algorithms for this challenging setting in AIDD. Despite its importance in the real-world problem, curated OOD datasets and benchmarks are currently lacking in addressing generalization in AI-aided drug discovery.
Another essential issue in the field of AI-aided drug discovery is the label noise. The AI model are typical trained on public datasets, such as ChEMBL, whereas the bioassay data in the dataset are often noisy (Kramer et al. 2012; Cortés-Ciriano & Bender 2016). For example, the activity data provided in ChEMBL is extracted manually from full text articles in seven Medicinal Chemistry journals (Mendez et al. 2019). Various factors can cause noise in the data provided in ChEMBL, including but not limited to different confidence levels for activities measured through experiments, unit-transcription errors, repeated citations of single measurements and different ‘‘cut-off’’ noise22 2 E.g., measurements could be recorded with , , , ¿, etc, which would introduce the “cut-off” noise when translated into supervision labels.. fig. 1 shows examples with different noisy levels. Meanwhile, real world data with noise annotations is lacking for learning tasks under noise labels (Angluin & Laird 1988; Han et al. 2020).
To help accelerate research by focusing community attention and simplifying systematic comparisons between data collection and implementation method, we present DrugOOD, a systematic OOD dataset curator and benchmark for AI-aided drug discovery which comes with an open-source Python package that fully automates the data curation process and OOD benchmarking process. We focus on the most challenging OOD setting: domain generalization (Zhou et al. 2021b) problem in AI-aided drug discovery, though DrugOOD can be easily adapted to other OOD settings, such as subpopulation shift (Koh et al. 2021) and domain adaptation (Zhuang et al. 2020). Our dataset is also the first AIDD dataset curator with realistic noise annotations, that can serve as an important testbed for the setting of learning under noise.

Notably, we present an automated dataset curator based on the large-scale bioassay deposition website ChEMBL (Mendez et al. 2019), in contrast to just providing a set of curated datasets. fig. 2 gives an overview of the automated dataset curator. Using this dataset curator, potential researchers/practitioners can generate new OOD datasets based on their specific needs by simply re-configuring the curation process, i.e., modifying the YAML files in the python package. Specifically, we also realize this dataset curator by generating 96 OOD datasets spanning various domains, noise annotations and measurement types. This mechanism comes with two advantages: i) It ensures that our released datasets and benchmarks are fully reproducible. ii) It allows great flexibility for future usage since it is often difficult, even for domain experts, to agree on one specific configuration. As an example, using EC50 as a measure of affinity, agreeing on a threshold for partitioning to find active/inactive pairs may be challenging.
As OOD learning subsumes or is closed related to other learning settings with distribution shift, such as domain adaption (Zhuang et al. 2020), transfer learning (Pan & Yang 2009), and zero-shot learning (Romera-Paredes & Torr 2015; Wang et al. 2019b), DrugOOD can also serve as a benchmark dataset or be used to generate datasets to study affinity prediction problems in AIDD under these learning settings. The following components summarize our major contributions:
- 1.
Automated Dataset Curator: We provide a fully customizable pipeline for curating OOD datasets for AI-aided drug discovery from the large-scale bioassay deposition website ChEMBL.
- 2.
Rich domain annotations: We present various approaches to generate specific domains that are aligned with the domain knowledge of biochemistry.
- 3.
Realistic noise annotations: We annotate real-world noise according to the measurement confidence score, “cut-off” noise etc, offering a valuable testbed for learning under real-world noise.
- 4.
Rigorous OOD benchmarking: We benchmark six SOTA OOD algorithms with various backbones for the 96 realized dataset instances and gain insight into OOD learning under noise for AIDD.
Paper Organizations.
section 2 presents background and related work on AI-aided drug discovery, existing OOD algorithms, datasets, benchmarks and affinity prediction-related materials. In section 3 we provide details on the automated dataset curator with real-world domain and noise annotations. We present specifics on benchmarking SOTA OOD algorithms in section 4. section 5 gives implementation details and package usage guidelines. We present experimental results and corresponding discussions in section 6. Lastly, section 7 discusses and concludes the paper.
2 Background and Related Work
In this section, we review the current progress in binding affinity prediction problems, one of highly active research areas in AIDD. The performance of affinity prediction is often limited by OOD issues and noisy labels, which motivates us to propose the DrugOOD database to explicitly tackle such problems. Lastly, we summarize general methods for OOD and noisy labels, together with representation learning for affinity prediction for virtual screening, which are later used for benchmark tests on the DrugOOD datasets.
2.1 Binding Affinity Prediction in AI-aided Drug Discovery
The ability of AI techniques has been dramatically boosted in various domains, mainly due to wide-spread applications of deep neural networks. We have witnessed a growing number of researches attempting to solve traditional problems in the drug discovery with more advanced AI models. There have been several surveys (Sliwoski et al. 2013; Jing et al. 2018; Yang et al. 2019b; Paul et al. 2021; Deng et al. 2021; Bender & Cortés-Ciriano 2021) summarizing recent advances and problems in this area, covering key aspects including major applications, representative techniques, and critical assessment benchmarks.
As pointed out in (Yang et al. 2019b; Paul et al. 2021), most of AI-driven applications can be roughly categorized into two domains, i.e., molecule generation and molecule screening. Molecule generation aims at adopting generative models to produce a large pool of candidate drug molecules with certain restraints satisfied (Simonovsky & Komodakis 2018; Sanchez-Lengeling et al. 2017; Satorras et al. 2021). On the other hand, molecule screening attempts to identify the most promising molecule(s) based on a wide range of predicted properties (Yang et al. 2019a; Feinberg et al. 2020; Jiménez et al. 2018). Other typical applications of AI techniques in drug discovery include target identification (Zeng et al. 2020; Mamoshina et al. 2018), target structure prediction (Jumper et al. 2021; Baek et al. 2021), drug re-purposing (Aliper et al. 2016; Issa et al. 2021; Pham et al. 2021), and molecule retrosynthesis (Coley et al. 2017; Zheng et al. 2019; Chen et al. 2020).
For conducting virtual screening on candidate molecules, both target-independent (e.g. ADMET) and target-dependent (e.g. binding affinity) properties are critical. The former ones measure how likely the molecule itself is qualified as a candidate drug, for instance, it should not induce severe liver toxicity to human (Zhang et al. 2016; Asilar et al. 2020). On the other hand, target-dependent properties consider the tendency of its potential interaction with the target (and other unrelated proteins), which often heavily depends on the joint formulation of candidate molecule and target (Hu et al. 2016; Karimi et al. 2019; Lim et al. 2019). In this paper, we mainly concentrate on the binding affinity between molecule and protein target, which falls into the domain of predicting target-dependent properties. In this circumstance, the out-of-distribution issue may result in severe performance degradation (e.g., when the target distribution dramatically differs between model training and inference), which leads to the major motivation of this paper.
2.1.1 Databases
ChEMBL (Davies et al. 2015; Mendez et al. 2019) is a large-scale open-access database consists of small molecules and their biological activity data. Such information is mainly extracted from medicinal chemistry journal articles, supplemented with data collected from approved drugs and clinical development candidates. It now contains over 2.1 million distinct compounds and 18.6 million records of their activities, which involve over 14,500 targets.
BindingDB (Gilson et al. 2016) collects experimental interaction data between proteins and small molecules, primarily from scientific articles and US patents. BindingDB also gathers selected data entries from other related databases, including PubChem (Wang et al. 2009), ChEMBL (Mendez et al. 2019), PDSP Ki (Roth et al. 2000), and CSAR (Carlson & Dunbar Jr 2011). Advanced search tools, hypothesis generation schemes (from targets to compounds and vice versa), and virtual compound screening methods are also integrated in the database.
PDBbind (Liu et al. 2014) is created to collect biomolecular complexes from the PDB database (Burley et al. 2020), with experimental binding affinity data curated from original reference papers. The latest release of PDBbind (version 2020) consists of over 23,000 biomolecular complexes, whose majority are protein-ligand complexes (19,443) and protein-protein complexes (2,852), and the remaining part are mainly protein-nucleic acid and nucleic acid-ligand complexes.
2.1.2 Methods
It is often critical to access the target structure before estimating the affinity of candidate molecules, since the affinity is jointly determined by the interaction between molecule and target. Depending on the availability of known target structures, affinity prediction methods can be roughly divided into two categories: ligand-based and structure-based.
Ligand-based affinity prediction (LBAP).
Based on the hypothesis that structurally analogous compounds tend to have similar biological activities (Johnson & Maggiora 1990), ligand-based affinity prediction methods are developed. The ultimate goal is to identify promising compounds from a large candidate library, based on their similarities to known active compounds for an interested target. Several approaches are proposed to filter compounds based on chemical similarity measurements, e.g., Tanimoto coefficients (Kim & Skolnick 2008) and similarity ensemble approach (SEA) (Keiser et al. 2007). Such methods heavily rely on hand-crafted or learnt compound representations, describing various properties including molecule weight, geometry, volume, surface areas, ring content, etc. On the other hand, quantitative structure-activity relationship (QSAR) based approaches attempt to explicitly formulate the relationship between structural properties of chemical compounds and their biological activities (Kwon et al. 2019). Various machine learning techniques have been cooperated with QSAR-based affinity prediction, including linear regression (Luco & Ferretti 1997), random forest (Svetnik et al. 2003), support vector machine (Zakharov et al. 2016), and neural networks (Burden & Winkler 1999; Pradeep et al. 2016). Particularly, multi-task neural networks (Dahl et al. 2014) alleviate the over-fitting issue by optimizing over multiple bioassasys simultaneously, and was adopted to achieve the best performance in the Merck Molecular Activity Challenge33 3 Merck Molecular Activity Challenge: https://www.kaggle.com/c/MerckActivity.
Despite the satisfying performance of ligand-based affinity prediction approaches in certain scenarios, they do not take target structures in consideration. However, the interaction between target and molecule is indeed essential in accurately predicting the binding affinity, which leads more and more researches to focus on structure-based affinity prediction.
Structure-based affinity prediction (SBAP).
In contrast to ligand-based approaches, structure-based methods (Lim et al. 2021) usually take structures of protein targets and/or protein-ligand complexes as inputs for affinity prediction. Some work (Wallach et al. 2015; Li et al. 2021b) predicts the binding affinity from experimentally determined protein-ligand co-crystal structures, but such data is highly expensive and time-consuming to obtain in practice. Others turn to computation-based docking routines (Trott & Olson 2010; Koes et al. 2013; McNutt et al. 2021; Bao et al. 2021) to estimate protein-ligand complex structures through sampling and ranking, and then formulate the structure-affinity relationship via various models.
Ballester & Mitchell 2010 propose the RF-Score approach to use random forest to implicitly capture binding effects based on a series of carefully designed hand-crafted features. 3D convolutional neural networks are adopted in (Stepniewska-Dziubinska et al. 2018; Jiménez et al. 2018), where protein-ligand complex structures are discretized into 3D voxels and then fed into the model for affinity prediction. However, such discretization fails to capture the 3D rotational and translational invariance of 3D structures, and thus relies on heavy data augmentation to overcome such limitations. Graph neural networks are adopted in Jiang et al. 2021 to simultaneously formulate the intra-molecular and inter-molecular interactions, where nodes correspond to ligand/protein atoms, and edges are defined by both covalent and non-covalent linkages.
2.1.3 Discussions
For most machine learning based approaches, it is usually desirable that the data distribution of training and evaluation subsets are as close as possible. However, this often does not hold true for affinity prediction tasks, e.g., the scaffold of small molecules and/or family of protein targets encountered during inference may be unseen throughout the model training process. Simply dividing the database into training and evaluation subsets on a per target-molecule basis may lead to over-optimistic performance, which is unrealistic for real-world applications.
Nonetheless, most databases for experimental binding affinities do not provide an official data split or its generation pipeline for model training and evaluation. To make things even more complicated, binding affinity annotations could be highly noisy, due to different experimental settings, affinity measurements, and confidence scores. Researchers need to manually pre-process raw data entries and re-organize them into the standard format, which is not only laborious and burdensome, but also unfavorable for a fair comparison against existing baselines. Therefore, we propose DrugOOD as a highly customizable curator for OOD datasets with noisy labels explicitly considered, so as to promote more efficient development of affinity prediction approaches in AIDD.
2.2 General OOD Databases
The out-of-distribution issue has attracted an ever-growing research interest in recent years, due to its importance in improving the generalization ability in real-world applications. Several databases have been constructed with great emphasis placed on the out-of-distribution generalization performance, mainly consist of computer vision and natural language processing tasks.
In Koh et al. 2021, the WILDS benchmark is proposed to reflect various levels of distribution shifts that may occur in real-world scenarios. It considers two common types of distribution shifts: domain generalization and sub-population shift. A total of 10 datasets are included, covering shifts across cameras for wildlife monitoring, hospitals for tumor identification, users for product rating estimation, andf scaffolds for biochemical property prediction, etc. Sagawa et al. 2021 further extend this database to include unlabeled data for unsupervised domain adaptation.
DomainBed (Gulrajani & Lopez-Paz 2020) consists of 7 multi-domain image classification datasets, including Colored MNIST (Arjovsky et al. 2019), Rotated MNIST (Ghifary et al. 2015), PACS (Li et al. 2017), VLCS (Fang et al. 2013), Office-Home (Venkateswara et al. 2017), Terra Incognita (Beery et al. 2018), and DomainNet (Peng et al. 2019). Furthermore, authors point out the importance of model selection strategy in the domain generalization task, and conduct thorough benchmark tests over 9 baseline algorithms and 3 model selection criteria. As it turns out, empirical risk minimization (ERM) (Vapnik 1999) with a careful implementation achieves state-of-the-art performance across all datasets, even when compared against various domain generalization algorithms.
Ye et al. 2021 analyze the performance comparison between ERM and domain generalization algorithms on DomainBed, and point out that the distribution shift is composed of diversity shift and correlation shift, and existing domain generalization algorithms are only optimized towards one of them. They further propose additional datasets, of which WILDS-Camelyon17 (Koh et al. 2021) is dominated by diversity shift, and NICO (He et al. 2021) and CelebA (Liu et al. 2015) are dominated by correlation shift.
As described above, general OOD databases are mostly built with image and text data, with one exception being the ODGB-MolPCBA dataset from WILDS (Koh et al. 2021), which aims at predicting biochemical properties from molecular graphs. The distribution shift is mainly caused by disjoint molecular scaffolds between training and test subsets. This is indeed critical for accurate prediction of target-independent properties, but is still insufficient for affinity prediction where the target information should be explicitly exploited. TDC (Huang et al. 2021) as another concurrent AIDD benchmark, offers SBAP datasets collated from BindingDB with a temporal split by patent year between 2013-2021, which is still limited in scope for drug OOD problems. In contrast, DrugOOD covers comprehensive sources of out-of-distribution in affinity prediction, and provides a dataset curator for highly customizable generation of OOD datasets. Additionally, noisy annotations are taken into consideration, so that algorithms can be evaluated in a more realistic setting, which further bridges the gap between researches and pharmaceutical applications.
2.3 Benchmark Scheme
In additional to an automated dataset curator in DrugOOD, we also provide rigorous benchmark tests over state-of-the-art OOD algorithms, with graph neural networks and BERT-like models used for representation learning from structural and sequential data. Next, we briefly review these OOD and representation learning algorithms, while more detailed descriptions can be found in section 4.
2.3.1 General Methods for OOD and Noisy Labels
The out-of-distribution and noisy label issues have been extensively studied in the machine learning community, due to their importance in improving the generalization ability and robustness. Here, we summarize recent progress in these two areas respectively, with a few overlaps since some approaches are proposed to jointly tackle these two issues in one shot.
Methods for OOD.
To improve the model generalization ability over out-of-distribution test samples, some work focuses on aligning feature representations across different domains. The minimization of feature discrepancy can be conducted over various distance metrics, including second-order statistics (Sun & Saenko 2016), maximum mean discrepancy (Tzeng et al. 2014) and Wasserstein distance (Zhou et al. 2021b), or measured by adversarial networks (Ganin et al. 2016). Others apply data augmentation to generate new samples or domains to promote the consistency of feature representations, such as Mixup across existing domains (Xu et al. 2020; Yan et al. 2020b), or in an adversarial manner (Zhao et al. 2020; Qiao et al. 2020).
With the label distribution further taken into consideration, recent work aims at enhancing the correlation between domain-invariant representations and labels. For instance, invariant risk minimization (Arjovsky et al. 2019) seeks for a data representation, so that the optimal classifier trained on top of this representation matches for all domains. Additional regularization terms are proposed to align gradients across domains (Koyama & Yamaguchi 2021), reduce the variance of risks of all domains (Krueger et al. 2021b), or smooth inter-domain interpolation paths (Chuang & Mroueh 2021).
Methods for noisy labels.
There is a rich body of literature trying to combat with the label-noise issue, starting from the seminal work (Angluin & Laird 1988) for traditional statistical learning to recent work for deep learning (Han et al. 2018b; Han et al. 2019; Song et al. 2020a). Generally speaking, previous methods attempt to handle noisy labels mainly from three aspects (Han et al. 2020): training data correction (van Rooyen et al. 2015; van Rooyen & Williamson 2017), objective function design (Azadi et al. 2016; Wang et al. 2017), and optimization algorithm design (Jiang et al. 2018; Han et al. 2018b).
From the training data perspective, prior work (van Rooyen & Williamson 2017) firstly estimates the noise transition matrix, which characterizes the relationship between clean and noisy labels, and then employs the estimated matrix to correct noisy training labels. Typical work in this line includes using an adaptation layer to model the noise transition matrix (Sukhbaatar et al. 2015), label smoothing (Lukasik et al. 2020), and human-in-the-loop estimation (Han et al. 2018a).
Other work turns to the design of objective functions, which aims at introducing specific regularization into the original empirical loss function to mitigate the label noise effect. In Azadi et al. 2016, authors propose a group sparse regularizer on the response of image classifier to force weights of irrelevant or noisy groups towards zero. Zhang et al. 2017 introduce Mixup as an implicit regularizer, which constructs virtual training samples by linear interpolation between pairs of samples and their labels. Such approach not only regularizes the model to factor simple linear behavior, but also alleviates the memorization of corrupted labels. Similar work following this idea includes label ensemble (Laine & Aila 2017) and importance re-weighting (Liu & Tao 2015).
From the view of optimization algorithm design, some work (Han et al. 2018b; Li et al. 2020) introduces novel optimization algorithms or schedule strategies to solve the label noise issue. One common approach in this line is to train a single neural network via small loss tricks (Ren et al. 2018; Jiang et al. 2018). Besides, other work proposes to co-train two neural networks via small-loss tricks, including co-teaching (Han et al. 2018b) and co-teaching+ (Yu et al. 2019).
2.3.2 Representation Learning for Affinity Prediction
As a fundamental building block of ligand- and structure-based affinity prediction, machine learning models for encoding molecules and proteins have attracted a lot of attention in the research community. Based on the input data and model type, existing studies can be divided into following three categories.
Hand-crafted feature based backbones.
Many early studies enlist domain experts to design features from molecules and proteins which contain rich biological and chemical knowledge, such as Morgan fingerprints (Morgan 1965), circular fingerprints (Glen et al. 2006), and extended-connectivity fingerprint (Rogers & Hahn 2010). Then, these hand-crafted features are fed to machine learning models to produce meaningful embeddings for downstream tasks. Typical models include logistic regression (Kleinbaum et al. 2002), random forest (Breiman 2001), influence relevance voting (Swamidass et al. 2009), and neural networks (Ramsundar et al. 2015).
Sequence-based backbones.
Since both molecules and proteins have their own sequential formats, SMILES (Weininger 1988) and amino-acid sequence (Sanger 1952), it is reasonable to utilize models which can naively deal with the sequential data, including 1D-CNN (Hirohara et al. 2018), RNN (Goh et al. 2017), and BERT (Wang et al. 2019a; Brandes et al. 2021). Specifically, some studies (Xu et al. 2017; Min et al. 2021) introduce self-supervised techniques from natural language processing to generate high-quality embeddings. However, 1D linearization of molecular structure highly depends on the traverse order of molecular graphs, which means that two atoms that are close in the sequence may be far apart and thus uncorrelated in the actual 2D/3D structures (e.g., the two oxygen atoms in "CC(CCCCCCO)O"), therefore hinders language models to learn effective representations that rely heavily on the relative position of tokens (Wang et al. 2021).
Graph-based backbones.
To eliminate the information loss in the sequence-based models, recently, some studies start to explore the more complex graph-based representation of molecules and proteins and utilize graph neural networks (GNNs) to produce embeddings which encode the information of chemical structures, such as GIN (Xu et al. 2018), GCN (Kipf & Welling 2016), and GAT (Velickovic et al. 2018). Other than directly applying the vanilla GNN model as the backbone, several studies try to incorporate the domain knowledge in the model design, such as ATi-FPGNN (Xiong et al. 2019), NF (Duvenaud et al. 2015), Weave (Kearnes et al. 2016), MGCN (Lu et al. 2019), MV-GNN (Ma et al. 2020), CMPNN (Song et al. 2020b), MPNN (Gilmer et al. 2017), and DMPNN (Yang et al. 2019a). Other than standard GNN models, several studies exploit Transformer-like GNN models to enhance the expressive power for training with a large number of molecules and proteins, such as GTransformer (Rong et al. 2020) and Graphormer (Ying et al. 2021).
3 Automated Dataset Curator with Real-world Domain and Noise Annotations
We construct all the datasets based on ChEMBL (Mendez et al. 2019), which is a large-scale, open-access drug discovery database that aims to capture medicinal chemistry data and knowledge across the pharmaceutical research and development process. We use the latest release in the SQLite format: ChEMBL 2944 4 Download link: http://ftp.ebi.ac.uk/pub/databases/chembl/ChEMBLdb/releases/chembl_29/chembl_29_sqlite.tar.gz. Moreover, we consider the setting of OOD and different noise levels, which is an inevitable problem when the machine learning model is applied to the drug development process. For example, when predicting SBAP bioactivity in practice, the target protein used in the model inference could be very different from that in the training set and even does not belong to the same protein family. The real-world domain gap will invoke challenges to the accuracy of the model. On the other hand, the data used in the wild often have various kinds of noise, e.g. activities measured through experiments often have different confidence levels and different “cut-off” noise. Therefore, it is necessary to construct data sets with varying levels of noise in order to better align with the real scenarios.
In the process of drug development, many predictive tasks are involved. Here, we consider two crucial tasks from computer aided drug discovery (Sliwoski et al. 2013): ligand based affinity prediction (LBAP) and structure based affinity prediction (SBAP). In LBAP, we follow the common practice and do not involve any protein target information, which is usually used in the activity prediction for one specific protein target. In SBAP, we consider both the target and drug information to predict the binding activity of ligands, aiming to develop models that can generalize across different protein targets.

3.1 Filtering Data with Different Noise Levels
ChEMBL contains the experimental results reported in previously published papers, sorted by “assays”. However, the activity values for different assays and even different molecules in the same assay may have different accuracy and confidence levels. For example, assays that record the results of high-throughput screens (HTS) usually have less accurate activity values. The data with different accuracy constitute different noise annotations. Therefore, we set up filters with different stringency to screen for datasets with varying noise levels.
Our filters consist assay filters and sample filters, which aim to screen for the required assays and samples. Specifically, we have built-in 5 assay filters and 3 sample filters in advance. The details are shown as follows.
-
Assay Filter
-
Measurement Type: Filtering out the assays with required measurement types, e.g. IC50, EC50. Due to the big difference in meaning between measurement types, and its difficulty to merge them, we generate different datasets for each measurement types.
-
Number of Molecules: Assay noise is strongly related to the number of molecules in an assay. For example, large assays are often derived from high-throughput screens that are very noisy. Hence we set different molecules number limits for different noise levels.
-
Units of Values: The units of activity values recorded in ChEMBL are chaotic, e.g. nM, %, None. The conversion between some units is easy, such as nM and M. But most of them cannot be converted between each other.
-
Confidence Score: Due to the complex settings of different experimental assays, sometimes it is not certain that the target that interacts with the compound is our designated target. Confidence score of an assay indicating how accurately the assigned target(s) represent(s) the actually assay target.
-
Target Type: There are dozens of target types in ChEMBL, from ’single protein’ to ’organism’. Different target types have different confidence levels. For SBAP tasks, the target type of a ’single protein’ is more reliable than others.
-
-
Sample Filter
-
Value Relation: In many cases, the precise activity values of certain molecules could not be obtained, but given a rough range. ChEMBL records qualitative values with different relationships, e.g. ’=’, ’>’, ’<’, ’>>’. Obviously, ’=’ means the value is accurate, and the others means the value is not accurate.
-
Missing Value: Filtering samples with any missing value.
-
Legal SMILES: Filtering samples with illegal molecules.
-
The configurations of each filter for three different noise levels are shown in the table 1. One can see that the three noise levels are now annotated jointly by “Confidence Score”, “Value Relation”, “Number of Molecules” and “Target Type”, which are shown in blue color. In fig. 1, we display some examples of the SBAP dataset, demonstrating different kinds of noise levels.
| Name | Core | Refined | General | |
| Assay Filter | Measurement Type | |||
| Number of Molecules | ||||
| Units of Values | ||||
| Confidence Score | — | |||
| Target Type | — | |||
| Sample Filter | Value Relation | |||
| Missing Value | ✓ | ✓ | ✓ | |
| Legal SMILES | ✓ | ✓ | ✓ |
3.2 Processing Uncertainty and Multiple Measurements
As mentioned above, ChEMBL records many activity values in an uncertainty way, and they were reported as above or below the highest or lowest concentration tested. Here, we follow the practice in pQSAR 2.0 (Martin et al. 2017) and offset them by 10-fold. Meanwhile, since the same molecule may be reported in different sources, the same molecule may also appear in multiple assays in ChEMBL. We call this phenomenon “multiple measurements”. Following the common practice (Hu et al. 2020), we average all the multiple measurements. For LBAP task, we average all the activity values for the same molecule before domain split. While for SBAP task, when the molecule and target pair is the same, we average their activity values.
3.3 Binary Classification Task with Adaptive Threshold
While ChEMBL record activity values as floating numbers, benchmarking OOD tasks as regression tasks is known to be extremely hard because various noises such as uncertainty measurements. Additionally, in the process of drug development, practitioners habitually consider whether a compound is active/inactive. Therefore, using a binary classification task is more robust and good enough to make decisions in the drug development. However, in practice the threshold for binary classification depends on the specific circumstances of the drug development project. Here, we choose to use an adaptive threshold method that can adapt to a wider range of situations. In particular, the median value of all compounds in the generated dataset defines the threshold, but the range of allowed thresholds are fixed to be , where . If the median is outside this range, a fixed threshold is applied, which follows the common practice (Mayr et al. 2018; Stanley et al. 2021) in drug discovery. In this way, we can try our best to keep the dataset balanced while making the generated tasks meaningful.
3.4 Domain Definition and Split
3.4.1 Domain Definition
As mentioned before, distributional shift is a common phenomenon in the drug development process. In order to make our benchmark more in line with the needs of drug discovery and development, we consider the OOD setting in the benchmark. In the process of drug research and development, when predicting the bioactivities of small molecules, we may encounter very different molecular scaffolds, sizes and so on from the model training set. These differences may also be reflected in the target in the SBAP task. Hence, for LBAP task, we consider the following three domains: assay, scaffold and molecule size. For SBAP tasks, in addition to the three domains mentioned above, we also consider two additional target-specific domains: protein and protein family. The user can also easily customize the domain through the configuration file and generate the corresponding dataset. The details of the five domains are as follows.
-
Assay: Samples in the same assay are put into the same domain. Due to the great differences in different assay environments, the activity values measured by different assays will have a large shift. At the same time, different assays have very different types of experiments and test targets.
-
Scaffold: Samples with the same molecular scaffold belong to the same domain. The molecular properties of different scaffolds are often quite different.
-
Size: A domain consists of samples with the same number of atoms. As a result, we can test the model’s performance on molecules that are quite different.
-
Protein: In SBAP task, samples with the same target protein are in the same domain, in order to test the model performance when meeting a never-seen-before protein target.
-
Protein Family: In SBAP tasks, samples with targets from the same family of proteins are in the same domain. Compared with protein domains, there are much less protein family domains albeit with greater differences among each other.
3.4.2 Domain Split
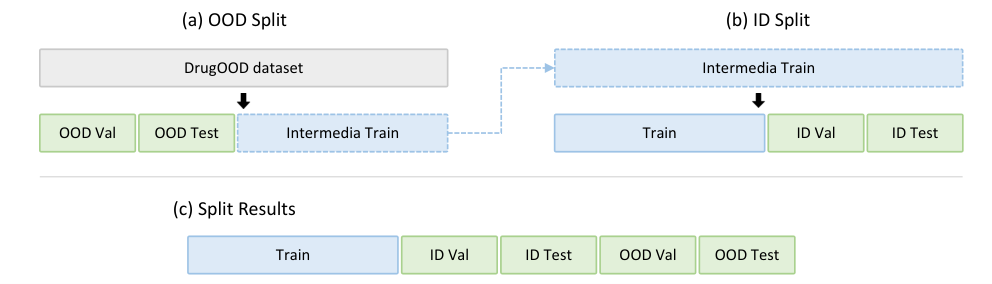
Based on the generated domains, we need to split them into training, OOD validation and OOD testing set. Our goal is to make the domain shifts between the training set and the OOD validation/testing set as significant as possible. This leads to the question of how to measure the differences between different domains and how to sort them into the training set and validation/testing set. Here, we design a general pipeline, that is, firstly generate domain descriptor for each domain, and then sort the domains with descriptors. Then the sorted domains are sequentially divided into training set, OOD validation and testing set (fig. 3 (a)). Meanwhile, the number of domains in different splits are controlled by the number of total samples in each splits, and the proportion of sample numbers is trying to be kept at 6:2:2 for training, validation and testing set.
In the DrugOOD framework, we have built-in two domain descriptor generation methods as follows.
-
Domain Capacity: The domain descriptor is the number of samples in this domain. In practice, we found that the number of samples in a domain can well represent the characteristics of a domain. For example, an assay with 5000 molecules is usually different from an assay with 10 molecules in assay type. For SBAP, a protein family that contains 1000 different proteins is very likely to be different from the protein family that contains only 10 proteins. The descriptor is applied to the domains of assay, protein and protein family.
-
Molecular Size: For the size domain, the size itself is already a good domain descriptor and can be applied to sort the domains, which we found to effectively increase the generalization gap in practice. The descriptor is applied to the domain of size and scaffold.
Generating in-distribution data subsets.
After splitting the training, OOD validation and OOD test sets, we split the ID validation and ID testing sets from the resultant training set (fig. 3 (b)). We follow similar settings as of WILDS (Koh et al. 2021), the ID validation and testing sets are merged from the randomly selected samples of each domain in the training set. The ratio of the number of samples in the OOD and ID validation/test sets can be easily modified through the configuration files. After this process, we get the final training, ID validation, ID test, OOD validation, OOD test sets (fig. 3 (c)).
| Data subset | ||
| DrugOOD-lbap-core-ic50-assay | 1,324 | 95,236 |
| DrugOOD-lbap-refined-ic50-assay | 5,612 | 266,522 |
| DrugOOD-lbap-general-ic50-assay | 29,938 | 568,556 |
| DrugOOD-lbap-core-ic50-scaffold | 34,807 | 95,236 |
| DrugOOD-lbap-refined-ic50-scaffold | 90,888 | 266,522 |
| DrugOOD-lbap-general-ic50-scaffold | 186,875 | 568,556 |
| DrugOOD-lbap-core-ic50-size | 251 | 95,236 |
| DrugOOD-lbap-refined-ic50-size | 288 | 266,522 |
| DrugOOD-lbap-general-ic50-size | 337 | 568,556 |
3.5 Overview of the Dataset Curation Pipeline
The overview of the datasets curation pipeline is shown in fig. 2. It mainly includes four major steps: filtering data with different noise levels, processing uncertainty and multi-measurements, binary classification task with adaptive threshold and domain split. We have built-in 96 configuration files to generate different datasets with the configuration of 2 tasks, 3 noise levels, 4 measurement types, and 5 domains. With our DrugOOD dataset curation, the user can easily obtain the required datasets through customizing the configuration files.
Here, we show some statistics of datasets generated by our built-in configuration files. table 2 and table 3 show the statistics of domains and samples in LBAP task and SBAP task under IC50 measurement type, respectively. We can see that as the number of samples increases, the noise level also increases. Meanwhile, for the same noise level, there are huge differences in the number of domains generated by different domain split methods, which will challenge the applicability of OOD algorithm in different domain numbers. In order to show the comparison of data volume under different measurement types, we count the samples of different measurement types under different noise levels, as shown in fig. 4. As we can see, the number of samples varies greatly under different measurement types in ChEMBL. Meanwhile, different measurement types may also bring different noise levels. Our curation can generate specific measurement types of datasets according to the needs of specific drug development scenarios. More statistical information of the DrugOOD datasets under different setting are summarized in table 10 and table 11.
| Data subset | ||
| DrugOOD-sbap-core-ic50-assay | 1,455 | 120,498 |
| DrugOOD-sbap-refined-ic50-assay | 6,409 | 339,930 |
| DrugOOD-sbap-general-ic50-assay | 23,868 | 583,401 |
| DrugOOD-sbap-core-ic50-scaffold | 34,807 | 120,498 |
| DrugOOD-sbap-refined-ic50-scaffold | 89,627 | 339,930 |
| DrugOOD-sbap-general-ic50-scaffold | 145,768 | 583,401 |
| DrugOOD-sbap-core-ic50-size | 251 | 120,498 |
| DrugOOD-sbap-refined-ic50-size | 288 | 339,930 |
| DrugOOD-sbap-general-ic50-size | 327 | 583,401 |
| DrugOOD-sbap-core-ic50-protein | 677 | 120,498 |
| DrugOOD-sbap-refined-ic50-protein | 1,483 | 339,930 |
| DrugOOD-sbap-general-ic50-protein | 2,671 | 583,401 |
| DrugOOD-sbap-core-ic50-protein-family | 13 | 120,498 |
| DrugOOD-sbap-refined-ic50-protein-family | 15 | 339,930 |
| DrugOOD-sbap-general-ic50-protein-family | 15 | 583,401 |
4 Benchmarking State-of-the-art OOD Algorithms
Our benchmark implements and evaluates algorithms from various perspectives, including architecture design and domain generalization methods, to cover a wide range of approaches to addressing the distribution shift problem. We believe this is the first paper to comprehensively evaluate a large set of approaches under various settings for the DrugOOD problem.
4.1 Architecture Design
It’s known that the expressive power of the model is largely depend on the network architecture. How to design the network architecture for the better ability to fit the target function and robustness to the noise is a popular area of out-of-distribution data problem. Based on the DGL-LifeSci package (Li et al. 2021a), we benchmark and evaluate following graph-based backbones: GIN (Xu et al. 2018), GCN (Kipf & Welling 2016), GAT (Velickovic et al. 2018), SchNet (Schütt et al. 2017), Weave (Kearnes et al. 2016), MGCN (Lu et al. 2019), ATi-FPGNN (Xiong et al. 2019), NF (Duvenaud et al. 2015) and GTransformer (Rong et al. 2020). For the Sequence based input, we adopt the BERT (Devlin et al. 2018) and Protein-BERT (Brandes et al. 2021) as feature extractors. The backbones are extended to regression and classification tasks by a readout function and an MLP layer.
We use a standard model structure for each type of data: GIN (Kipf & Welling 2016) for molecular graphs and BERT (Devlin et al. 2018) for protein amino acid sequences. In addition, the other models mentioned above were also used for some of the datasets in measuring the effect of model structure on generalization ability. Following the model selection strategy in (Koh et al. 2021), we use a distinct OOD validation set for model early stopping and hyper-parameter tuning. The OOD validation set is drawn from a similar distribution of the training set, which distant from the OOD test set. For example, in the assay-based datasets, the training, validation, testing each consists of molecules from distinct sets of the assay environment. We detail the experimental protocol in section 6.
| Dataset | In-dist | Out-of-Dist | Gap |
| DrugOOD-lbap-core-ic50-assay | 89.62 (2.04) | 71.98 (0.29) | 17.64 |
| DrugOOD-lbap-core-ic50-scaffold | 87.15 (0.48) | 69.54 (0.52) | 17.60 |
| DrugOOD-lbap-core-ic50-size | 92.35 (0.15) | 67.48 (0.47) | 24.87 |
| DrugOOD-lbap-refined-ic50-assay | 89.25 (0.64) | 72.70 (0.00) | 16.55 |
| DrugOOD-lbap-refined-ic50-scaffold | 86.23 (0.08) | 70.45 (0.54) | 15.78 |
| DrugOOD-lbap-refined-ic50-size | 91.31 (0.07) | 68.74 (0.37) | 22.58 |
| DrugOOD-lbap-general-ic50-assay | 85.19 (1.15) | 69.88 (0.13) | 15.32 |
| DrugOOD-lbap-general-ic50-scaffold | 85.15 (0.24) | 67.55 (0.09) | 17.60 |
| DrugOOD-lbap-general-ic50-size | 89.77 (0.08) | 66.05 (0.32) | 23.72 |
| DrugOOD-sbap-core-ic50-protein | 90.71 (0.29) | 68.87 (0.53) | 21.84 |
| DrugOOD-sbap-core-ic50-protein-family | 89.88 (1.44) | 72.20 (0.14) | 17.68 |
| DrugOOD-sbap-refined-ic50-protein | 86.87 (1.41) | 69.51 (0.30) | 17.36 |
| DrugOOD-sbap-refined-ic50-protein-family | 86.44 (3.07) | 70.61 (0.42) | 15.82 |
| DrugOOD-sbap-general-ic50-protein | 85.34 (1.67) | 68.48 (0.27) | 16.86 |
| DrugOOD-sbap-general-ic50-protein-family | 79.18 (2.69) | 68.60 (0.68) | 10.58 |
table 4 shows that for each dataset with the measurement type of IC50, the OOD performance is always significantly lower than the performance of the corresponding ID setting.
4.2 Domain Generalization Algorithms
In machine learning, models are commonly optimized by the empirical risk minimization (ERM), which trains the model to minimize the average training loss. To improve the model robustness under the distribution shift, current methods tend to learn invariant representations that can generalize across domains. There are two main directions: domain alignment and invariant predictors. Common approaches to domain alignment is to minimize the divergence of feature distributions from different domains across distance metrics, such as maximum mean discrepancy (Tzeng et al. 2014; Long et al. 2015) and adversarial loss (Ganin et al. 2016; Li et al. 2018), Wasserstein distance (Zhou et al. 2020a). In addition, other conventional methods along this line of research are adopting data augmentation. For example, Mixup (Zhang et al. 2017) augmentation proposes to construct additional virtual training data by convex combination of both samples and labels from the original datasets. Follow-up works applied a similar idea to generate more domain and enhance consistency of features during training (Yue et al. 2019; Zhou et al. 2020b; Xu et al. 2020; Yan et al. 2020b; Shu et al. 2021; Wang et al. 2020; Yao et al. 2022), or synthesize unseen domain in an adversarial way to imitate the challenging test domains (Zhao et al. 2020; Qiao et al. 2020; Volpi et al. 2018).
| Algorithms | Assay | Scaffold | Size | ||||||
| core | refined | general | core | refined | general | core | refined | general | |
| ERM | 71.98 (0.29) | 69.54 (0.52) | 67.48 (0.47) | 69.88 (0.13) | 67.55 (0.09) | 66.05 (0.32) | 72.70 (0.00) | 70.45 (0.54) | 68.74 (0.37) |
| IRM | 69.22 (0.51) | 64.94 (0.30) | 57.00 (0.39) | 69.21 (0.16) | 63.78 (0.53) | 60.52 (0.35) | 71.68 (0.53) | 67.97 (0.66) | 59.99 (0.48) |
| DeepCoral | 71.76 (0.60) | 68.54 (0.01) | 57.31 (0.44) | 69.47 (0.13) | 64.84 (0.53) | 61.09 (0.23) | 71.45 (0.09) | 69.35 (0.73) | 62.01 (0.38) |
| DANN | 70.08 (0.65) | 66.37 (0.20) | 63.45 (0.18) | 65.12 (0.94) | 62.90 (1.02) | 64.74 (0.27) | 67.20 (0.68) | 67.26 (0.95) | 66.83 (0.08) |
| Mixup | 71.34 (0.41) | 69.29 (0.24) | 67.73 (0.27) | 69.87 (0.17) | 67.64 (0.16) | 66.01 (0.14) | 72.13 (0.21) | 70.68 (0.16) | 68.69 (0.13) |
| GroupDro | 71.54 (0.46) | 66.67 (0.67) | 60.90 (1.23) | 69.36 (0.09) | 64.91 (0.25) | 61.41 (0.10) | 71.40 (0.52) | 69.08 (0.38) | 62.15 (0.54) |
For learning invariant predictors, the core idea is to enhance the correlations between the invariant representation and the labels. Representatively, invariant risk minimization (IRM) (Arjovsky et al. 2019) penalizes the feature representation of each domain that has a different optimal linear classifier, intending to find a predictor that performs well in all domains. Following up IRM, subsequent approaches propose powerful regularizers by penalizing variance of risk across domains (Krueger et al. 2021a), by adjusting gradients across domains (Koyama & Yamaguchi 2020), by smoothing interpolation paths across domains (Chuang & Mroueh 2021). An alternative to IRM is to combat spurious domain correlation, a core challenge for the sub-population shift problem (Koh et al. 2021), by directly optimizing the worst-group performance with Distributionally Robust Optimization (Sagawa et al. 2019; Zhang et al. 2020; Zhou et al. 2021a), generating additional samples around the minority groups (Goel et al. 2020), and re-weighting among groups with various size (Sagawa et al. 2020), or additional regulations (Chang et al. 2020).
We implement and evaluate the following representative OOD methods:
-
ERM: ERM optimizes the model by minimizing the average empirical loss on observed training data.
-
IRM: IRM penalizes feature distributions for domains that have different optimum predictors.
-
DeepCoral: DeepCoral penalizes differences in the means and covariances of the feature distributions (i.e., the distribution of last layer activations in a neural network) for each domain. Conceptually, DeepCoral is similar to other methods that encourage feature representations to have the same distribution across domains.
-
DANN: Like IRM and DeepCoral, DANN encourages feature representations to be consistent across domains.
-
Mixup: Mixup constructs additional virtual training examples from two examples drawn at random from the training data, which alleviates the effects of domain-related spurious information through data interpolation.
-
GroupDro: GroupDro uses distributionally robust optimization methods to minimize worst-case losses, aiming to combat spurious correlations explicitly.
table 5 summarizes the experimental results on the datasets with IC50 measurement type, showing that latest OOD algorithms exhibit no clear improvement over the simple ERM algorithm. There may be several reasons for this: 1). the molecular graph data are different from visual and textual input by nature, thus making it challenging to use conventional strategies directly; 2). these algorithms are usually designed for datasets that contain enough data per domain, so it is difficult to apply directly to datasets that have a large number of domains but few samples per domain. There is a need for improved approaches to realistic DrugOOD problems, based on the results. Additionally, current OOD research focus almost exclusively on the single-instance prediction tasks while overlook multi-instance prediction tasks, and how to better handle the distribution shift in multiple instance domains (e.g., molecule and protein inputs in the SBAP task) remains an open problem. Lastly, while not explored in this paper, the large-scale realistic datasets always come with non-negligible inherent noise, both aleatoric and epistemic (Lazic & Williams 2021). And how to incorporate noise learning with OOD generalization to boost model’s robustness and generalization in the meantime is an important research direction.
5 Implementations and Package Usage
DrugOOD develops a comprehensive benchmark for developing and evaluating OOD generalization algorithms. Different with other codebases, DrugOOD builds on the OpenMMLab project (Chen et al. 2019), owning the following features:

Customizable dataset.
DrugOOD supports various formats of data, providing related processing and converting tools. We provide 96 realized sub-datasets in advance. In addition to this, users can additionally specify additional conditions to easily customize new datasets from the original source dataset.
Modular design.
Building on the design of OpenMMLab projects, we decompose the framework into different components and one can easily construct new OOD algorithms by combing these modules.
Support for multiple frameworks out of the box.
DrugOOD codebase directly supports various popular and contemporary OOD generalization algorithms, e.g. DeepCoral, IRM, DANN, Mixup etc.
With the above abstraction, our benchmark framework is illustrated in fig. 5. By simply creating some new components and assembling existing ones, the researchers can develop their approach efficiently.
5.1 Dataset Curation
The DrugOOD package provides a simple, standardized dataset curator based on the large-scale bioassay deposition website ChEMBL (Mendez et al. 2019), by proving a modified curation files, the researcher can easily re-configure the curation process. Specifically, we have provided 96 built-in configuration files for generating OOD dataset spanning various domains, noise annotations and measurement types. The Listing provides a simple example, which covers all of the steps of generating an OOD dataset from ChEMBL.
5.2 Dataset Loading
As shown in Listing , DrugOOD provides a flexible and uniform interface for building data pipelines, allowing users to easily and quickly adjust the experimental data flow. Meanwhile, Standardized and automated evaluation of specified dataset partitions can be easily implemented by a few lines of code.
5.3 Algorithm Configuration
DrugOOD also supports popular and contemporary OOD generalization algorithm out of box. Users can easily configure different modules to construct and develop new OOD generalization algorithms effectively. We provide an example of building algorithm in few lines code, as shown in Listing .
6 Empirical Studies
We present typical experimental results and corresponding analysis in this section. More results and details are deferred to the Appendix.
6.1 Ligand Based Affinity Prediction (LBAP)
Precisely predicting the affinity score of small molecules will greatly boost the process of drug discovery by reducing the needs of costly laboratory experiments. However, the experimental data available for training such models is limited compared to the extremely diverse and combinatorially large universe of candidate molecules that we would want to make predictions on. In this paper, we study the domain variation in experimental assay, molecules sizes, molecule sizes between training and test molecules.
6.1.1 Setup
Problem Definition.
For the task of LBAP, we study a domain generalization problem where model needs to be generalized to the molecules from different domain splits. Aligned with the knowledge of biochemistry, we define the following three domains: assay, scaffold and molecular size. As an illustration, we treat the LBAP problem as a binary classification problem, where the input is the graph data of a small molecule, label is the ground truth (active or inactive) of binary affinity classification, and the represents domain identifier for one specific domain splits.
Data Info.
As mentioned before, we preprocess the ChEMBL dataset and generate in total 36 exemplar datasets with varying noise levels, measurements types, and domain definitions. Each small molecule in each dataset is represented as a graph, where the nodes are atoms and edges are chemical bonds. Following the pre-processing strategy in (Xiong et al. 2019), we preprocess the molecules via the RDKit package (Landrum 2013). Input node features are 39-dimensional vectors including atomic symbol, hybridization, hydrogens and so on. Input edge features are 10-dimensional vectors including bond type, conjugation, ring and bond stereo chemistry. Following the detailed splitting strategy in fig. 3 of section 3.4, we split the dataset via three types of domain annotations:
-
Assay: Samples in the same assay are divided into the same domain. Due to the big differences of experimental environments and protein targets in various assays, the bioactivity values measured by those assays will have a large shift. In this setting, we split the dataset along assays. This split provides a realistic estimate of model performance in prospective experimental settings by separating different molecules into different experimental environments. We assign the assays that contain large number of samples to the training set, and the assays with small number of samples to the test set. After such an assignment, the domain shifts between the training set and the OOD validation/testing set become sufficiently large. The proportion of samples is kept at around 6:2:2 in training, validation, test set.
Here takes the DrugOOD-lbap-core-ic50-assay dataset as an illustration here.
-
Train: Contain total 34,179 molecules from the largest 311 assays with an average of 110 molecules per assay.
-
Validation (ID): Contain total 11314 molecules from the same 311 assays as in the training sets.
-
Test (ID): Contain total 11,683 molecules from the same 311 assay environments as in the training sets.
-
Validation (OOD): Contain total 19,028 molecules from the next largest 314 assays with an average of 60.6 molecules per assay.
-
Test (OOD): Contain total 19,302 molecules from the smallest 314 assays with an average of 27.6 molecules per assay.
fig. 6 illustrates the analysis of the assay domain in the realized DrugOOD dataset. As shown in fig. 6 (a), the statistics of the assays in terms of the numbers of molecules in each assay, which implies that the scale of the experiments is highly skewed, with the test set containing the assay with the fewest molecules. However, the difference in assay environments does not significantly change the statistics of the learning target in each split. In fig. 6, the label statistics still remain very similar in the training/validation/test splits, indicating that the main distribution variation comes from differences in the detection environment.
Figure 7: Analysis of the scaffold domain in the DrugOOD dataset. (a) shows the distribution of number of molecules wrt the scaffold id and (b) shows the positive ratio of molecules of four measurement types in the train/validation/test splits. Note that here the train, val, test refer to the Intermediate Train, OOD val and OOD test datasets in fig. 3. -
-
Scaffold: Scaffold split has been widely used in previous benchmarks (Koh et al. 2021; Hu et al. 2020), which splits datasets based on scaffold structure. Similarily, we assign the largest scaffolds to training set and smallest scaffolds to the test set to ensure its maximal diversity in scaffold structure. Take the DrugOOD-lbap-core-ic50-scaffold dataset as examples, the detailed information of splits are:
-
Train: Contain in total 21,519 molecules from the largest 6,881 scaffolds with an average of 3.12 molecules per scaffold.
-
Validation (ID): Contain in total 4,920 molecules from the 1,912 scaffolds with an average of 2.57 molecules per scaffold.
-
Test (ID): Have 24,112 scaffolds, with in total 30,708 molecules.
-
Validation (OOD): The next largest 6,345 scaffolds, with in total 11,683 molecules, and an average of 1.84 molecules per scaffold.
-
Test (OOD): The smallest 4,350 scaffolds, with in total 19,048 molecules, and an average of 4.42 molecules per scaffold.
In the same way, we plot the statics of the scaffolds in terms of the size of each scaffold. As shown in fig. 7, we again observe that the distribution is highly skewed and the test partition contains the smallest scaffolds.
-
-
Size: We put samples with the same atomic number into a domain, and separate molecules with different atomic sizes into different subsets for simulating the realistic distribution shift. We organize the molecules with the largest atomic sizes into the training set and those with smaller atomic sizes are assigned to the test set to ensure sufficient variability of atomic sizes between the training and test data. Taking the DrugOOD-lbap-core-ic50-size dataset dataset as an example, the details of the split are as follows:
-
Train: The largest 190 size groups, with overall 36,597 molecules, and an average of 192.61 molecules per group.
-
Validation (ID): The 140 size groups with in total 12,153 molecules, and an average of 86.80 molecules per group.
-
Test (ID): The other 229 groups in the intermediate training data, with total 12411 molecules.
-
Validation (OOD): The next largest 4 size groups in addition to id data, with in total 17,660 molecules, and an average of 4,415 molecules per group.
-
Test (OOD): The smallest 18 size groups, with in total 19,048 molecules, and an average of 1,058.22 molecules per group.
-
Evaluation.
We evaluate models’ performance by the area under the receiver operating characteristic (AUROC), which indicates the ability of a classifier to distinguish between classes (e.g., inactive or active). The higher the AUC, the better the performance of the model at distinguishing between the positive and negative classes. Meanwhile, we also provide the results of accuracy metric.
| Domain | Val (ID) | Val (OOD) | Test (ID) | Test (OOD) | ||||
| ACC | AUC | ACC | AUC | ACC | AUC | ACC | AUC | |
| Assay | 89.05(0.35) | 89.91(1.78) | 88.79(2.23) | 70.32(0.8) | 89.34(0.38) | 89.62(2.04) | 82.14(0.86) | 71.98(0.29) |
| Scaffold | 97.04(0.13) | 94.84(0.6) | 85.11(0.4) | 78.96(0.67) | 90.51(0.14) | 87.15(0.48) | 76.33(0.64) | 69.54(0.52) |
| Size | 93.99(0.04) | 92.91(0.16) | 84.22(0.22) | 81.5(0.19) | 93.75(0.06) | 92.35(0.15) | 71.46(0.67) | 67.48(0.47) |
6.1.2 Baseline Results
Model.
We train the GIN model as the baseline model on each dataset from scratch with a learning rate at 1e-4, a batch size at 256 samples and without L2-regularization. Each small molecules are pre-processed by the RDKit package to generate 39-dimensional node features and 9-dimensional edge features as input. To avoid performance degradation caused by inappropriate hyper-parameters, following the strategy in WILDS (Koh et al. 2021), we did a grid search strategy over learning rates , batch size . We report averaged results aggregated over 3 random seeds.
ERM results and performance drops.
As shown in table 4 and table 6, model performance dropped significantly going from the train-to-train in-distribution (ID) setting to the official out-of-distribution (OOD) setting. For the assay domain, ERM achieves an average AUC score of 89.91% on the ID validation set and 89.62% on the ID test set, but only 70.32% on the OOD val set, 71.98% on the OOD test set. Similarly, for the scaffold and size domain, ERM obtains 87.15%, 92.35% AUC score on ID test set but 69.54%, 67.48% on OOD test set, respectively. The test performance of ERM drops by 17.64%, 17.60%, 24.97% points AUC score when the assay, scaffold, size split is used, respectively, suggesting that these splits are indeed harder than conventional random split, and can be used to estimate the realistic ID-OOD gap in the task of ligand based affinity prediction. More experimental results on different DrugOOD lbap datasets are shown in table 12 of the Appendix.
Results of other baselines.
table 7 shows the performance of other conventional generalization algorithms. For a fair comparison, all algorithms adopt the same backbone network. Besides, we also make additional grid searches on algorithms’ specific hyper-parameters separately, IRM’s penalty weight in and penalty anneal iteration in . DeepCoral’s penalty weight in , GroupDro’s step size in , DANN’s inverse factor between and Mixup’s probability and interpolate strength between .
As shown in table 7, ERM almost performs better than DeepCoral, IRM, and Group DRO, all of which use assay, scaffolds, size as the domains, indicating these existing methods can not solve the DrugOOD problem. Moreover, similar to the findings in the WILDS benchmark, current existing methods make model hard to fit the training data, For instance, under the scaffold domain split, DeepCoral, IRM achieves 81.6%, 77.66% AUC score in the In-Distribution validation set, respectively, while the AUC score pf ERM baseline is 94.84%. Also, these methods are primarily designed for the case when each group contains a decent number of examples, which is not the common case for the drug development scenario. Finally, the SOTA OOD algorithm does not work well in the DrugOOD setting, suggesting that robust methods need to be developed to solve the OOD problem for graph data.
| Domain | Algos | Val (ID) | Val (OOD) | Test (ID) | Test (OOD) | ||||
| ACC | AUC | ACC | AUC | ACC | AUC | ACC | AUC | ||
| Assay | ERM | 89.05 (0.35) | 89.91 (1.78) | 88.79 (2.23) | 70.32 (0.80) | 89.34 (0.38) | 89.62 (2.04 | 82.14 (0.86) | 71.98 (0.29) |
| IRM | 88.14 (0.17) | 82.82 (0.87) | 90.67 (0.07) | 68.23 (0.31) | 88.39 (0.25) | 83.10 (0.46 | 82.41 (0.20) | 69.22 (0.51) | |
| DeepCoral | 88.59 (0.10) | 88.10 (1.42) | 91.09 (0.15) | 70.26 (1.04) | 88.88 (0.15) | 88.23 (1.42 | 83.04 (0.08) | 71.76 (0.60) | |
| DANN | 88.47 (0.20) | 83.39 (1.15) | 91.32 (0.38) | 68.30 (0.22) | 88.72 (0.16) | 83.20 (1.28 | 83.22 (0.10) | 70.08 (0.65) | |
| Mixup | 88.80 (0.52) | 89.01 (2.06) | 88.76 (1.92) | 69.14 (0.56) | 89.01 (0.43) | 88.95 (2.17 | 81.65 (1.06) | 71.34 (0.41) | |
| GroupDro | 88.80 (0.15) | 89.42 (0.43) | 89.81 (0.41) | 70.34 (0.91) | 88.96 (0.15) | 89.24 (0.82 | 82.62 (0.23) | 71.54 (0.46) | |
| Scaffold | ERM | 97.04 (0.13) | 94.84 (0.60) | 85.11 (0.40) | 78.96 (0.67) | 90.51 (0.14) | 87.15 (0.48 | 76.33 (0.64) | 69.54 (0.52) |
| IRM | 92.51 (4.34) | 77.66 (0.79) | 81.52 (4.25) | 72.77 (0.66) | 86.99 (3.93) | 77.22 (0.32 | 72.96 (4.32) | 64.94 (0.30) | |
| DeepCoral | 95.76 (0.29) | 81.60 (1.45) | 85.37 (0.47) | 77.09 (0.26) | 89.96 (0.08) | 81.13 (0.49 | 76.90 (0.37) | 68.54 (0.01) | |
| DANN | 95.89 (0.09) | 77.09 (0.64) | 85.13 (0.81) | 75.04 (0.65) | 89.86 (0.10) | 77.30 (0.65 | 77.11 (0.66) | 66.37 (0.20) | |
| Mixup | 97.19 (0.08) | 95.51 (0.44) | 85.55 (0.08) | 79.42 (0.62) | 90.74 (0.11) | 87.35 (0.33 | 77.18 (0.19) | 69.29 (0.24) | |
| GroupDro | 96.02 (0.12) | 78.67 (2.75) | 85.01 (0.64) | 74.57 (0.60) | 89.87 (0.18) | 78.32 (1.09 | 76.18 (0.86) | 66.67 (0.67) | |
| Size | ERM | 93.99 (0.04) | 92.91 (0.16) | 84.22 (0.22) | 81.50 (0.19) | 93.75 (0.06) | 92.35 (0.15 | 71.46 (0.67) | 67.48 (0.47) |
| IRM | 86.77 (4.05) | 66.41 (1.79) | 76.49 (4.36) | 60.59 (0.29) | 87.08 (3.72) | 69.80 (1.74 | 66.39 (3.92) | 57.00 (0.39) | |
| DeepCoral | 92.40 (0.06) | 70.70 (1.68) | 83.34 (0.27) | 61.90 (0.39) | 92.28 (0.20) | 73.08 (0.98 | 72.36 (0.32) | 57.31 (0.44) | |
| DANN | 91.31 (2.12) | 80.13 (3.59) | 81.99 (2.46) | 73.73 (0.49) | 91.12 (2.12) | 78.53 (3.71 | 70.08 (3.50) | 63.45 (0.18) | |
| Mixup | 94.23 (0.21) | 92.89 (0.30) | 84.64 (0.26) | 81.79 (0.20) | 93.88 (0.17) | 92.48 (0.55 | 72.73 (0.68) | 67.73 (0.27) | |
| GroupDro | 92.73 (0.17) | 78.46 (0.91) | 83.54 (0.52) | 67.68 (0.42) | 92.67 (0.27) | 80.02 (0.44 | 72.64 (0.33) | 60.90 (1.23) | |
6.1.3 Performance Drops of Different Domains
For the LBAP task, three types of domains are defined, and we study the performance of the model under these different domain splits. fig. 8 shows the performance degradation for different domain partitions, the gap values are computed on the test set and averaged over all measurement types. From the figure, we can conclude the following. 1) Among several divisions, the size domain brings the largest performance degradation, which is consistent with daily experimental findings, where molecules of different sizes often have very different properties. 2) As the noise level of the data set increases, the performance degradation of different domains is somewhat mitigated, and the increased data to some extent increase the generalization ability of the model. In addition, the degradation of the model performance is not further mitigated as the data continues to increase, indicating that the increase in the amount of data brings limited improvement and that a truly effective method needs to be developed to address the DrugOOD problem.
6.1.4 Performance Drops of Different Noise Levels
We also investigated the ID and OOD performance at different noise levels. As shown in table 8, we summarize different algorithms’ ID and OD performance under three noise levels. From the table, one can observe that: 1) In the presence of more noise, the introduced noise produces pollution, which progressively affects the network’s performance. 2) The increasing noise level brings more data, which provides more information about the dataset. From the core to refined level, we can see a narrowing of the gap between ID and OOD, however, the improvement from the refined level to general level reaches a bottleneck without significant improvement. 3) By combining the above two points, we can see that the introduction of large amounts of data with noise affects the learning of the model to a certain degree and affects its performance, but these noisy data, in turn, provide additional information so that the model is able to improve a small amount of generalization ability.
| Noise | Algos | Val (ID) | Val (OOD) | Test (ID) | Test (OOD) | ||||
| ACC | AUC | ACC | AUC | ACC | AUC | ACC | AUC | ||
| Core | ERM | 89.05 (0.35) | 89.91 (1.78) | 88.79 (2.23) | 70.32 (0.80) | 89.34 (0.38) | 89.62 (2.04 | 82.14 (0.86) | 71.98 (0.29) |
| IRM | 88.14 (0.17) | 82.82 (0.87) | 90.67 (0.07) | 68.23 (0.31) | 88.39 (0.25) | 83.10 (0.46 | 82.41 (0.20) | 69.22 (0.51) | |
| DeepCoral | 88.59 (0.10) | 88.10 (1.42) | 91.09 (0.15) | 70.26 (1.04) | 88.88 (0.15) | 88.23 (1.42 | 83.04 (0.08) | 71.76 (0.60) | |
| DANN | 88.47 (0.20) | 83.39 (1.15) | 91.32 (0.38) | 68.30 (0.22) | 88.72 (0.16) | 83.20 (1.28 | 83.22 (0.10) | 70.08 (0.65) | |
| Mixup | 88.80 (0.52) | 89.01 (2.06) | 88.76 (1.92) | 69.14 (0.56) | 89.01 (0.43) | 88.95 (2.17 | 81.65 (1.06) | 71.34 (0.41) | |
| GroupDro | 88.80 (0.15) | 89.42 (0.43) | 89.81 (0.41) | 70.34 (0.91) | 88.96 (0.15) | 89.24 (0.82 | 82.62 (0.23) | 71.54 (0.46) | |
| Refined | ERM | 91.66 (0.11) | 89.06 (0.63) | 91.61 (0.52) | 75.57 (0.16) | 91.68 (0.08) | 89.25 (0.64 | 84.85 (0.33) | 72.70 (0.00) |
| IRM | 91.36 (0.08) | 84.67 (0.91) | 92.24 (0.13) | 75.39 (0.32) | 91.47 (0.08) | 84.80 (0.95 | 85.17 (0.23) | 71.68 (0.53) | |
| DeepCoral | 91.40 (0.05) | 84.63 (0.85) | 92.21 (0.23) | 75.72 (0.47) | 91.43 (0.04) | 84.55 (0.84 | 85.23 (0.13) | 71.45 (0.09) | |
| DANN | 91.21 (0.12) | 78.34 (0.20) | 92.27 (0.31) | 72.12 (0.39) | 91.33 (0.16) | 78.40 (0.24 | 85.09 (0.34) | 67.20 (0.68) | |
| Mixup | 91.47 (0.03) | 87.30 (0.63) | 92.25 (0.02) | 75.67 (0.22) | 91.57 (0.03) | 87.36 (0.61 | 85.16 (0.11) | 72.13 (0.21) | |
| GroupDro | 91.33 (0.10) | 84.39 (1.72) | 92.15 (0.28) | 75.28 (0.23) | 91.46 (0.15) | 84.55 (2.20 | 85.20 (0.32) | 71.40 (0.52) | |
| General | ERM | 88.91 (0.14) | 85.17 (1.19) | 82.48 (0.07) | 74.04 (0.01) | 89.21 (0.13) | 85.19 (1.15 | 71.85 (0.08) | 69.88 (0.13) |
| IRM | 88.37 (0.05) | 80.77 (0.11) | 82.37 (0.08) | 73.11 (0.10) | 88.67 (0.04) | 80.75 (0.03 | 71.51 (0.07) | 69.21 (0.16) | |
| DeepCoral | 88.41 (0.10) | 81.01 (0.75) | 82.43 (0.12) | 73.57 (0.25) | 88.71 (0.13) | 81.00 (0.83 | 71.65 (0.08) | 69.47 (0.13) | |
| DANN | 87.77 (0.40) | 76.47 (0.71) | 81.87 (0.53) | 70.40 (0.57) | 88.08 (0.38) | 75.82 (0.57 | 70.73 (0.54) | 65.12 (0.94) | |
| Mixup | 89.11 (0.31) | 86.00 (1.15) | 82.22 (0.28) | 74.17 (0.02) | 89.47 (0.23) | 85.95 (1.19 | 71.74 (0.07) | 69.87 (0.17) | |
| GroupDro | 88.35 (0.17) | 81.06 (0.39) | 82.39 (0.17) | 73.45 (0.33) | 88.68 (0.17) | 81.31 (0.34 | 71.55 (0.06) | 69.36 (0.09) | |
6.2 Structure Based Affinity Prediction (SBAP)
6.2.1 Setup
Compared with the LBAP task, the SBAP task considers target protein information. In our benchmark, we represent proteins as protein sequences cause the ChEMBL database only provide protein sequence information. However, DrugOOD can be easily extended by incorporating 3D structure information of targets by refering to protein sturcute depositing database, such as PDB and uniprot (Consortium 2014). This will be left as important future work.
| Noise | Algos | ID_VAL | OOD_VAL | ID_TEST | OOD_TEST | ||||
| ACC | AUC | ACC | AUC | ACC | AUC | ACC | AUC | ||
| Core | ERM | 89.28 (0.28) | 90.83 (0.48) | 84.22 (1.13) | 74.12 (0.41) | 89.32 (0.19) | 90.71 (0.29 | 80.37 (1.32) | 68.87 (0.53) |
| IRM | 88.94 (0.67) | 88.93 (4.03) | 82.61 (2.21) | 74.10 (0.39) | 89.04 (0.60) | 88.81 (4.03 | 77.92 (4.25) | 66.31 (0.45) | |
| DeepCoral | 89.03 (0.62) | 90.86 (0.95) | 82.11 (1.97) | 74.12 (0.46) | 89.17 (0.76) | 90.65 (0.97 | 78.29 (2.39) | 67.56 (1.01) | |
| DANN | 88.23 (0.01) | 84.58 (0.34) | 84.93 (0.26) | 71.47 (0.47) | 88.54 (0.10) | 84.49 (0.25 | 81.93 (0.51) | 67.76 (0.41) | |
| Mixup | 89.11 (0.15) | 90.83 (0.38) | 83.52 (2.61) | 73.41 (0.73) | 89.52 (0.20) | 90.94 (0.32 | 80.37 (2.76) | 67.97 (0.15) | |
| GroupDro | 89.05 (0.52) | 89.49 (2.92) | 83.26 (1.57) | 74.10 (0.14) | 89.22 (0.35) | 89.26 (2.79 | 79.63 (2.41) | 68.07 (0.98) | |
| Refined | ERM | 91.99 (0.26) | 87.11 (1.50) | 85.02 (0.31) | 74.41 (0.09) | 92.11 (0.20) | 86.87 (1.41 | 83.17 (0.66) | 69.51 (0.30) |
| IRM | 92.40 (0.12) | 89.66 (0.63) | 84.12 (0.14) | 74.47 (0.15) | 92.46 (0.13) | 89.49 (0.74 | 81.73 (0.21) | 69.30 (0.48) | |
| DeepCoral | 92.00 (0.03) | 86.24 (0.15) | 85.16 (0.33) | 74.56 (0.25) | 92.16 (0.09) | 85.74 (0.24 | 83.41 (0.40) | 69.27 (0.52) | |
| DANN | 91.61 (0.13) | 78.02 (0.54) | 85.23 (0.17) | 71.29 (0.17) | 91.88 (0.15) | 77.14 (0.64 | 83.42 (0.41) | 66.58 (0.29) | |
| Mixup | 92.01 (0.29) | 86.58 (1.84) | 85.39 (0.08) | 74.25 (0.16) | 92.18 (0.15) | 86.02 (1.95 | 83.76 (0.13) | 69.29 (0.19) | |
| GroupDro | 92.06 (0.17) | 87.14 (0.47) | 85.03 (0.16) | 74.30 (0.22) | 92.26 (0.09) | 86.73 (0.33 | 83.22 (0.42) | 69.40 (0.40) | |
| General | ERM | 91.16 (0.18) | 85.62 (1.66) | 85.61 (0.74) | 73.67 (0.08) | 90.95 (0.13) | 85.34 (1.67 | 80.69 (0.95) | 68.48 (0.27) |
| IRM | 90.87 (0.19) | 82.78 (2.30) | 85.81 (0.11) | 73.61 (0.18) | 90.70 (0.12) | 82.68 (2.40 | 80.90 (0.34) | 68.43 (0.33) | |
| DeepCoral | 90.82 (0.10) | 82.22 (1.96) | 86.00 (0.13) | 73.34 (0.06) | 90.63 (0.07) | 81.98 (1.94 | 81.04 (0.60) | 68.13 (0.73) | |
| DANN | 90.84 (0.03) | 80.96 (1.18) | 85.90 (0.54) | 71.52 (0.24) | 90.70 (0.03) | 80.20 (1.03 | 81.08 (0.82) | 66.38 (0.29) | |
| Mixup | 90.98 (0.18) | 83.05 (1.63) | 86.11 (0.20) | 73.49 (0.28) | 90.81 (0.19) | 82.88 (1.70 | 81.32 (0.39) | 68.45 (0.14) | |
| GroupDro | 90.77 (0.09) | 82.53 (1.30) | 85.69 (0.54) | 73.36 (0.40) | 90.59 (0.10) | 82.43 (1.30 | 80.49 (1.07) | 68.11 (0.38) | |
6.2.2 Model
We use a general SBAP prediction network that extracts molecular and protein features separately, which are then concatenated together and fed into a fully connected layer to predict interaction probabilities. For the feature extraction of small molecules, we follow the setting of LBAP task and use the same network and hyperparameters. For protein sequence, we use the pre-train BERT (Devlin et al. 2018): ’bert-base-uncase’ to extract a 768 dimensional protein feature. Then, the features of molecules and protein are concatenated and fed into a one-layer fully connected layer to predict the interaction probabilities.
6.2.3 Baseline Results
The results of different algorithms on sub-datasets with IC50 as measurement type and protein as domain are shown in table 9. From the table, we can see that: 1) The performance of OOD is degraded relative to that of ID. On the validation set of core noise level, the OOD performance of ERM degrades by 16.71% in AUC relative to the ID performance, while the performance drop expanded to 21.84% on test set. 2) OOD algorithms designed for computer vision tasks hardly work in SBAP scenarios. The performance of algorithms designed for OOD scenarios are difficult to match the performance of ERM, which means in order to promote the development of AI aided drug discovery, it is necessary to design OOD algorithms with the consideration of characteristics of drug development scenarios. Next, we will further analyze the experimental results from different aspects.
6.2.4 Performance Gap of Different Domains
Different domain split methods may result in different distribution shifts, and therefore will also bring different challenges to the algorithms. Here, we analyze 5 built-in domain splits for the SBAP task. fig. 9 shows the performance gap of different domain splits. We conduct analysis under different noise levels and algorithms. The values of gap are calculated on the testing set and averaged over all measurements types. From fig. 9, we can see that: 1) The noise level of the dataset has a great impact on the performance gap of ID and OOD. On one hand, each noise level has a different domain split method that can bring the biggest performance gap across all algorithms. For example, in core noise level, the domain ’protein family’ brings the largest performance gap across all algorithms, while it changes to be ’size’ in refined noise level. On the other hand, as the noise level increases, the performance gap gradually narrows. Combining with table 9, we observe that this is caused by the degradation of ID performance. 2) Among all domain split methods, the gap brought by scaffold is relatively small. We speculate that this may be due to the fact that scaffold split induces more domain than other split methods, which makes the training set cover a wider portion of the underlying distribution.
6.2.5 Study for Different Noise Levels
Here, we study the effect of different noise levels on ID and OOD performance. fig. 10 shows the ID and OOD performance of 4 algorithms with different noises. The values are averaged over all measurement types. It can be seen that the performance of ID generally decreases with the increase of noise level. The introduction of noise hurts the performance of the model despite the larger amount of data, which suggests that we need to pay more attention to the noise of the data source in the realistic scenario. How to design an algorithm that is robust to both noise and distribution shift is a worthy research direction. As for OOD performance, we can see that different domain split shows different changing trend while the noise level increases. However, we notice that the OOD performance of different algorithms under a particular domain exhibits similar behavior for ERM, which means that existing OOD algorithms do not incorporate the noise of the real scene, nor are they designed to mitigate its impact.
6.2.6 Study for Different Measurement Types
The automated dataset curator supports variant measurement types, e.g., EC50, IC50. As different measurement types will generate datasets with different distributions and noise, we analyze the performance of different measurement types by varying the noise levels and algorithms. The results are shown in fig. 11. One can see that: 1) As a result of different measurement types, ID and OOD performance can differ, for example, the Potency measurement is generally low in both ID and OOD, possibly due to the high noise level in the Potency measurement. 2) Our benchmark algorithms are robust to measurement types since they have acceptable accuracy for almost all types of measurement.
7 Discussions and Future Work
In this work we have presented an automated dataset curator and benchmark based on the large-scale bioassay deposition website ChEMBL, in order to facilitate OOD research for AI-aided drug discovery. It is very worthwhile to explore more in the following respects.
As observed in current benchmark results, existing general OOD methods do not significantly outperform the baseline ERM method. Most of these OOD methods are designed and validated with visual and/or textual data, which may fail in capturing critical information for the affinity prediction problem. This implies that to further improve the performance under various out-of-distribution scenarios, it is essential to develop more advanced OOD methods, particularly with drug-related domain knowledge integrated.
Another key characteristic of DrugOOD database is that the majority of data falls into the highest noise level (“general”). Simply discarding such noisy labels and only referring to high-quality ones may severely limit the model performance due to insufficient training data. It could be worth investigating that whether large-scale unsupervised pre-training can be utilized to construct better representations for molecules and target proteins, which are critical to accurate affinity predictions.
Additionally, learning with noisy labels has been extensively studied in the general context, but it may be crucial to take the generation process of noisy affinity annotations into consideration. This includes different experimental precision, measurement types, activity relation annotation types, etc. It is possible that the data quality can be further improved with carefully-designed denoising techniques, so that more accurate affinity prediction models can be trained.
References
- Aliper et al. (2016) Aliper, Alexander, Plis, Sergey, Artemov, Artem, Ulloa, Alvaro, Mamoshina, Polina, and Zhavoronkov, Alex. Deep learning applications for predicting pharmacological properties of drugs and drug repurposing using transcriptomic data. Molecular pharmaceutics, 13(7):2524–2530, 2016.
- Angluin & Laird (1988) Angluin, Dana and Laird, Philip. Learning from noisy examples. Machine Learning, 2(4):343–370, 1988.
- Arjovsky et al. (2019) Arjovsky, Martin, Bottou, Léon, Gulrajani, Ishaan, and Lopez-Paz, David. Invariant risk minimization. arXiv preprint arXiv:1907.02893, 2019.
- Asilar et al. (2020) Asilar, Ece, Hemmerich, Jennifer, and Ecker, Gerhard F. Image based liver toxicity prediction. Journal of chemical information and modeling, 60(3):1111–1121, 2020.
- Azadi et al. (2016) Azadi, Samaneh, Feng, Jiashi, Jegelka, Stefanie, and Darrell, Trevor. Auxiliary image regularization for deep cnns with noisy labels. In ICLR, 2016.
- Baek et al. (2021) Baek, Minkyung, DiMaio, Frank, Anishchenko, Ivan, Dauparas, Justas, Ovchinnikov, Sergey, Lee, Gyu Rie, Wang, Jue, Cong, Qian, Kinch, Lisa N, Schaeffer, R Dustin, et al. Accurate prediction of protein structures and interactions using a 3-track network. bioRxiv, 2021.
- Ballester & Mitchell (2010) Ballester, Pedro J. and Mitchell, John B. O. A machine learning approach to predicting protein–ligand binding affinity with applications to molecular docking. Bioinformatics, 26(9):1169–1175, March 2010. doi: 10.1093/bioinformatics/btq112. URL https://doi.org/10.1093/bioinformatics/btq112.
- Bao et al. (2021) Bao, Jingxiao, He, Xiao, and Zhang, John ZH. Deepbsp—a machine learning method for accurate prediction of protein–ligand docking structures. Journal of Chemical Information and Modeling, 2021.
- Beery et al. (2018) Beery, Sara, Van Horn, Grant, and Perona, Pietro. Recognition in terra incognita. In Proceedings of the European conference on computer vision (ECCV), pp. 456–473, 2018.
- Bender & Cortés-Ciriano (2021) Bender, Andreas and Cortés-Ciriano, Isidro. Artificial intelligence in drug discovery: what is realistic, what are illusions? part 1: ways to make an impact, and why we are not there yet. Drug discovery today, 26(2):511–524, 2021.
- Brandes et al. (2021) Brandes, Nadav, Ofer, Dan, Peleg, Yam, Rappoport, Nadav, and Linial, Michal. Proteinbert: A universal deep-learning model of protein sequence and function. bioRxiv, 2021.
- Breiman (2001) Breiman, Leo. Random forests. Machine learning, 45(1):5–32, 2001.
- Burden & Winkler (1999) Burden, Frank R. and Winkler, David A. Robust qsar models using bayesian regularized neural networks. Journal of Medicinal Chemistry, 42(16):3183–3187, 1999.
- Burley et al. (2020) Burley, Stephen K, Bhikadiya, Charmi, Bi, Chunxiao, Bittrich, Sebastian, Chen, Li, Crichlow, Gregg V, Christie, Cole H, Dalenberg, Kenneth, Di Costanzo, Luigi, Duarte, Jose M, Dutta, Shuchismita, Feng, Zukang, Ganesan, Sai, Goodsell, David S, Ghosh, Sutapa, Green, Rachel Kramer, Guranović, Vladimir, Guzenko, Dmytro, Hudson, Brian P, Lawson, Catherine L, Liang, Yuhe, Lowe, Robert, Namkoong, Harry, Peisach, Ezra, Persikova, Irina, Randle, Chris, Rose, Alexander, Rose, Yana, Sali, Andrej, Segura, Joan, Sekharan, Monica, Shao, Chenghua, Tao, Yi-Ping, Voigt, Maria, Westbrook, John D, Young, Jasmine Y, Zardecki, Christine, and Zhuravleva, Marina. Rcsb protein data bank: powerful new tools for exploring 3d structures of biological macromolecules for basic and applied research and education in fundamental biology, biomedicine, biotechnology, bioengineering and energy sciences. Nucleic Acids Research, 49(D1):D437–D451, 11 2020. ISSN 0305-1048.
- Carlson & Dunbar Jr (2011) Carlson, Heather A and Dunbar Jr, James B. A call to arms: what you can do for computational drug discovery, 2011.
- Chang et al. (2020) Chang, Shiyu, Zhang, Yang, Yu, Mo, and Jaakkola, Tommi. Invariant rationalization. In International Conference on Machine Learning, pp. 1448–1458. PMLR, 2020.
- Chen et al. (2020) Chen, Binghong, Li, Chengtao, Dai, Hanjun, and Song, Le. Retro*: learning retrosynthetic planning with neural guided a* search. In International Conference on Machine Learning, pp. 1608–1616. PMLR, 2020.
- Chen et al. (2019) Chen, Kai, Wang, Jiaqi, Pang, Jiangmiao, Cao, Yuhang, Xiong, Yu, Li, Xiaoxiao, Sun, Shuyang, Feng, Wansen, Liu, Ziwei, Xu, Jiarui, Zhang, Zheng, Cheng, Dazhi, Zhu, Chenchen, Cheng, Tianheng, Zhao, Qijie, Li, Buyu, Lu, Xin, Zhu, Rui, Wu, Yue, Dai, Jifeng, Wang, Jingdong, Shi, Jianping, Ouyang, Wanli, Change Loy, Chen, and Lin, Dahua. MMDetection: Open MMLab Detection Toolbox and Benchmark. arXiv e-prints, art. arXiv:1906.07155, June 2019.
- Chuang & Mroueh (2021) Chuang, Ching-Yao and Mroueh, Youssef. Fair mixup: Fairness via interpolation. In International Conference on Learning Representations, 2021.
- Coley et al. (2017) Coley, Connor W, Rogers, Luke, Green, William H, and Jensen, Klavs F. Computer-assisted retrosynthesis based on molecular similarity. ACS central science, 3(12):1237–1245, 2017.
- Consortium (2014) Consortium, The UniProt. UniProt: a hub for protein information. Nucleic Acids Research, 43(D1):D204–D212, 10 2014. ISSN 0305-1048. doi: 10.1093/nar/gku989. URL https://doi.org/10.1093/nar/gku989.
- Cortés-Ciriano & Bender (2016) Cortés-Ciriano, Isidro and Bender, Andreas. How consistent are publicly reported cytotoxicity data? large-scale statistical analysis of the concordance of public independent cytotoxicity measurements. ChemMedChem, 11(1):57–71, 2016.
- Dahl et al. (2014) Dahl, George E., Jaitly, Navdeep, and Salakhutdinov, Ruslan. Multi-task neural networks for qsar predictions, 2014.
- Davies et al. (2015) Davies, Mark, Nowotka, Michał, Papadatos, George, Dedman, Nathan, Gaulton, Anna, Atkinson, Francis, Bellis, Louisa, and Overington, John P. Chembl web services: streamlining access to drug discovery data and utilities. Nucleic acids research, 43(W1):W612–W620, Jul 2015. ISSN 1362-4962.
- Deng et al. (2021) Deng, Jianyuan, Yang, Zhibo, Ojima, Iwao, Samaras, Dimitris, and Wang, Fusheng. Artificial intelligence in drug discovery: applications and techniques. arXiv preprint arXiv:2106.05386, 2021.
- Devlin et al. (2018) Devlin, Jacob, Chang, Ming-Wei, Lee, Kenton, and Toutanova, Kristina. Bert: Pre-training of deep bidirectional transformers for language understanding. arXiv preprint arXiv:1810.04805, 2018.
- Duvenaud et al. (2015) Duvenaud, David, Maclaurin, Dougal, Aguilera-Iparraguirre, Jorge, Gómez-Bombarelli, Rafael, Hirzel, Timothy, Aspuru-Guzik, Alán, and Adams, Ryan P. Convolutional networks on graphs for learning molecular fingerprints. In Cortes, Corinna, Lawrence, Neil D., Lee, Daniel D., Sugiyama, Masashi, and Garnett, Roman (eds.), Advances in Neural Information Processing Systems 28: Annual Conference on Neural Information Processing Systems 2015, December 7-12, 2015, Montreal, Quebec, Canada, pp. 2224–2232, 2015. URL https://proceedings.neurips.cc/paper/2015/hash/f9be311e65d81a9ad8150a60844bb94c-Abstract.html.
- Fang et al. (2013) Fang, Chen, Xu, Ye, and Rockmore, Daniel N. Unbiased metric learning: On the utilization of multiple datasets and web images for softening bias. In Proceedings of the IEEE International Conference on Computer Vision, pp. 1657–1664, 2013.
- Feinberg et al. (2020) Feinberg, Evan N, Joshi, Elizabeth, Pande, Vijay S, and Cheng, Alan C. Improvement in admet prediction with multitask deep featurization. Journal of medicinal chemistry, 63(16):8835–8848, 2020.
- Ganin et al. (2016) Ganin, Yaroslav, Ustinova, Evgeniya, Ajakan, Hana, Germain, Pascal, Larochelle, Hugo, Laviolette, Francois, Marchand, Mario, and Lempitsky, Victor. Domain-adversarial training of neural networks. The journal of machine learning research, 17(1):2096–2030, 2016.
- Gao et al. (2020) Gao, Wenhao, Mahajan, Sai Pooja, Sulam, Jeremias, and Gray, Jeffrey J. Deep learning in protein structural modeling and design. Patterns, pp. 100142, 2020.
- Ghifary et al. (2015) Ghifary, Muhammad, Kleijn, W Bastiaan, Zhang, Mengjie, and Balduzzi, David. Domain generalization for object recognition with multi-task autoencoders. In Proceedings of the IEEE International Conference on Computer Vision, pp. 2551–2559, 2015.
- Gilmer et al. (2017) Gilmer, Justin, Schoenholz, Samuel S, Riley, Patrick F, Vinyals, Oriol, and Dahl, George E. Neural message passing for quantum chemistry. In International Conference on Machine Learning, pp. 1263–1272. PMLR, 2017.
- Gilson et al. (2016) Gilson, Michael K, Liu, Tiqing, Baitaluk, Michael, Nicola, George, Hwang, Linda, and Chong, Jenny. Bindingdb in 2015: a public database for medicinal chemistry, computational chemistry and systems pharmacology. Nucleic acids research, 44(D1):D1045–D1053, 2016.
- Glen et al. (2006) Glen, Robert C, Bender, Andreas, Arnby, Catrin H, Carlsson, Lars, Boyer, Scott, and Smith, James. Circular fingerprints: flexible molecular descriptors with applications from physical chemistry to adme. IDrugs, 9(3):199, 2006.
- Goel et al. (2020) Goel, Karan, Gu, Albert, Li, Yixuan, and Ré, Christopher. Model patching: Closing the subgroup performance gap with data augmentation. arXiv preprint arXiv:2008.06775, 2020.
- Goh et al. (2017) Goh, Garrett B, Hodas, Nathan O, Siegel, Charles, and Vishnu, Abhinav. Smiles2vec: An interpretable general-purpose deep neural network for predicting chemical properties. arXiv preprint arXiv:1712.02034, 2017.
- Gulrajani & Lopez-Paz (2020) Gulrajani, Ishaan and Lopez-Paz, David. In search of lost domain generalization. arXiv preprint arXiv:2007.01434, 2020.
- Gysi et al. (2021) Gysi, Deisy Morselli, Do Valle, Ítalo, Zitnik, Marinka, Ameli, Asher, Gan, Xiao, Varol, Onur, Ghiassian, Susan Dina, Patten, JJ, Davey, Robert A, Loscalzo, Joseph, et al. Network medicine framework for identifying drug-repurposing opportunities for covid-19. Proceedings of the National Academy of Sciences, 118(19), 2021.
- Han et al. (2018a) Han, Bo, Yao, Jiangchao, Niu, Gang, Zhou, Mingyuan, Tsang, Ivor, Zhang, Ya, and Sugiyama, Masashi. Masking: A new perspective of noisy supervision. In NeurIPS, pp. 5836–5846, 2018a.
- Han et al. (2018b) Han, Bo, Yao, Quanming, Yu, Xingrui, Niu, Gang, Xu, Miao, Hu, Weihua, Tsang, Ivor, and Sugiyama, Masashi. Co-teaching: Robust training of deep neural networks with extremely noisy labels. In NeurIPS, pp. 8527–8537, 2018b.
- Han et al. (2020) Han, Bo, Yao, Quanming, Liu, Tongliang, Niu, Gang, Tsang, Ivor W, Kwok, James T, and Sugiyama, Masashi. A survey of label-noise representation learning: Past, present and future. arXiv preprint arXiv:2011.04406, 2020.
- Han et al. (2019) Han, Jiangfan, Luo, Ping, and Wang, Xiaogang. Deep self-learning from noisy labels. In ICCV, 2019.
- He et al. (2021) He, Yue, Shen, Zheyan, and Cui, Peng. Towards non-iid image classification: A dataset and baselines. Pattern Recognition, 110:107383, 2021.
- Hirohara et al. (2018) Hirohara, Maya, Saito, Yutaka, Koda, Yuki, Sato, Kengo, and Sakakibara, Yasubumi. Convolutional neural network based on smiles representation of compounds for detecting chemical motif. BMC bioinformatics, 19(19):83–94, 2018.
- Hu et al. (2016) Hu, Peng-Wei, Chan, Keith CC, and You, Zhu-Hong. Large-scale prediction of drug-target interactions from deep representations. In 2016 international joint conference on neural networks (IJCNN), pp. 1236–1243. IEEE, 2016.
- Hu et al. (2020) Hu, Ruifeng, Xu, Haodong, Jia, Peilin, and Zhao, Zhongming. KinaseMD: kinase mutations and drug response database. Nucleic Acids Research, 49(D1):D552–D561, 11 2020. ISSN 0305-1048. doi: 10.1093/nar/gkaa945. URL https://doi.org/10.1093/nar/gkaa945.
- Hu et al. (2020) Hu, Weihua, Fey, Matthias, Zitnik, Marinka, Dong, Yuxiao, Ren, Hongyu, Liu, Bowen, Catasta, Michele, and Leskovec, Jure. Open Graph Benchmark: Datasets for Machine Learning on Graphs. arXiv e-prints, art. arXiv:2005.00687, May 2020.
- Huang et al. (2021) Huang, Kexin, Fu, Tianfan, Gao, Wenhao, Zhao, Yue, Roohani, Yusuf, Leskovec, Jure, Coley, Connor W, Xiao, Cao, Sun, Jimeng, and Zitnik, Marinka. Therapeutics data commons: machine learning datasets and tasks for therapeutics. arXiv preprint arXiv:2102.09548, 2021.
- Issa et al. (2021) Issa, Naiem T, Stathias, Vasileios, Schürer, Stephan, and Dakshanamurthy, Sivanesan. Machine and deep learning approaches for cancer drug repurposing. In Seminars in cancer biology, volume 68, pp. 132–142. Elsevier, 2021.
- Jiang et al. (2021) Jiang, Dejun, Hsieh, Chang-Yu, Wu, Zhenxing, Kang, Yu, Wang, Jike, Wang, Ercheng, Liao, Ben, Shen, Chao, Xu, Lei, Wu, Jian, Cao, Dongsheng, and Hou, Tingjun. InteractionGraphNet: A novel and efficient deep graph representation learning framework for accurate protein–ligand interaction predictions. Journal of Medicinal Chemistry, 64(24):18209–18232, December 2021. doi: 10.1021/acs.jmedchem.1c01830. URL https://doi.org/10.1021/acs.jmedchem.1c01830.
- Jiang et al. (2018) Jiang, Lu, Zhou, Zhengyuan, Leung, Thomas, Li, Li-Jia, and Fei-Fei, Li. Mentornet: Learning data-driven curriculum for very deep neural networks on corrupted labels. In ICML, pp. 2304–2313, 2018.
- Jiménez et al. (2018) Jiménez, José, Skalic, Miha, Martinez-Rosell, Gerard, and De Fabritiis, Gianni. K deep: protein–ligand absolute binding affinity prediction via 3d-convolutional neural networks. Journal of chemical information and modeling, 58(2):287–296, 2018.
- Jing et al. (2018) Jing, Yankang, Bian, Yuemin, Hu, Ziheng, Wang, Lirong, and Xie, Xiang-Qun Sean. Deep learning for drug design: an artificial intelligence paradigm for drug discovery in the big data era. The AAPS journal, 20(3):1–10, 2018.
- Johnson & Maggiora (1990) Johnson, M. A. and Maggiora, G. M. Concepts and applications of molecular similarity. Wiley, 1990.
- Jumper et al. (2021) Jumper, John, Evans, Richard, Pritzel, Alexander, Green, Tim, Figurnov, Michael, Ronneberger, Olaf, Tunyasuvunakool, Kathryn, Bates, Russ, Zidek, Augustin, Potapenko, Anna, et al. Highly accurate protein structure prediction with alphafold. Nature, 596(7873):583–589, 2021.
- Karimi et al. (2019) Karimi, Mostafa, Wu, Di, Wang, Zhangyang, and Shen, Yang. Deepaffinity: interpretable deep learning of compound–protein affinity through unified recurrent and convolutional neural networks. Bioinformatics, 35(18):3329–3338, 2019.
- Kearnes et al. (2016) Kearnes, Steven, McCloskey, Kevin, Berndl, Marc, Pande, Vijay, and Riley, Patrick. Molecular graph convolutions: moving beyond fingerprints. Journal of computer-aided molecular design, 30(8):595–608, 2016.
- Keiser et al. (2007) Keiser, Michael J., Roth, Bryan L., Armbruster, Blaine N., Ernsberger, Paul, Irwin, John J., and Shoichet, Brian K. Relating protein pharmacology by ligand chemistry. Nature Biotechnology, 25(2):197–206, Feb 2007. ISSN 1546-1696. doi: 10.1038/nbt1284. URL https://doi.org/10.1038/nbt1284.
- Kim & Skolnick (2008) Kim, Ryangguk and Skolnick, Jeffrey. Assessment of programs for ligand binding affinity prediction. Journal of Computational Chemistry, 29(8):1316–1331, 2008.
- Kipf & Welling (2016) Kipf, Thomas N and Welling, Max. Semi-supervised classification with graph convolutional networks. arXiv preprint arXiv:1609.02907, 2016.
- Kleinbaum et al. (2002) Kleinbaum, David G, Dietz, K, Gail, M, Klein, Mitchel, and Klein, Mitchell. Logistic regression. Springer, 2002.
- Koes et al. (2013) Koes, David Ryan, Baumgartner, Matthew P, and Camacho, Carlos J. Lessons learned in empirical scoring with smina from the csar 2011 benchmarking exercise. Journal of chemical information and modeling, 53(8):1893–1904, 2013.
- Koh et al. (2021) Koh, Pang Wei, Sagawa, Shiori, Marklund, Henrik, Xie, Sang Michael, Zhang, Marvin, Balsubramani, Akshay, Hu, Weihua, Yasunaga, Michihiro, Phillips, Richard Lanas, Gao, Irena, Lee, Tony, David, Etienne, Stavness, Ian, Guo, Wei, Earnshaw, Berton, Haque, Imran, Beery, Sara M, Leskovec, Jure, Kundaje, Anshul, Pierson, Emma, Levine, Sergey, Finn, Chelsea, and Liang, Percy. Wilds: A benchmark of in-the-wild distribution shifts. In Meila, Marina and Zhang, Tong (eds.), Proceedings of the 38th International Conference on Machine Learning, volume 139 of Proceedings of Machine Learning Research, pp. 5637–5664. PMLR, 18–24 Jul 2021. URL https://proceedings.mlr.press/v139/koh21a.html.
- Koyama & Yamaguchi (2020) Koyama, Masanori and Yamaguchi, Shoichiro. Out-of-distribution generalization with maximal invariant predictor. arXiv preprint arXiv:2008.01883, 2020.
- Koyama & Yamaguchi (2021) Koyama, Masanori and Yamaguchi, Shoichiro. When is invariance useful in an out-of-distribution generalization problem ?, 2021.
- Kramer et al. (2012) Kramer, Christian, Kalliokoski, Tuomo, Gedeck, Peter, and Vulpetti, Anna. The experimental uncertainty of heterogeneous public k i data. Journal of medicinal chemistry, 55(11):5165–5173, 2012.
- Krueger et al. (2021a) Krueger, David, Caballero, Ethan, Jacobsen, Joern-Henrik, Zhang, Amy, Binas, Jonathan, Zhang, Dinghuai, Le Priol, Remi, and Courville, Aaron. Out-of-distribution generalization via risk extrapolation (rex). In International Conference on Machine Learning, pp. 5815–5826. PMLR, 2021a.
- Krueger et al. (2021b) Krueger, David, Caballero, Ethan, Jacobsen, Joern-Henrik, Zhang, Amy, Binas, Jonathan, Zhang, Dinghuai, Priol, Remi Le, and Courville, Aaron. Out-of-distribution generalization via risk extrapolation (rex). In Proceedings of the 38th International Conference on Machine Learning, volume 139, pp. 5815–5826. PMLR, Jul 2021b.
- Kwon et al. (2019) Kwon, Sunyoung, Bae, Ho, Jo, Jeonghee, and Yoon, Sungroh. Comprehensive ensemble in qsar prediction for drug discovery. BMC Bioinformatics, 20(1):521, Oct 2019. ISSN 1471-2105. doi: 10.1186/s12859-019-3135-4. URL https://doi.org/10.1186/s12859-019-3135-4.
- Laine & Aila (2017) Laine, Samuli and Aila, Timo. Temporal ensembling for semi-supervised learning. In ICLR, 2017.
- Landrum (2013) Landrum, Greg. Rdkit: A software suite for cheminformatics, computational chemistry, and predictive modeling, 2013.
- Lazic & Williams (2021) Lazic, Stanley E and Williams, Dominic P. Quantifying sources of uncertainty in drug discovery predictions with probabilistic models. Artificial Intelligence in the Life Sciences, pp. 100004, 2021.
- Li et al. (2017) Li, Da, Yang, Yongxin, Song, Yi-Zhe, and Hospedales, Timothy M. Deeper, broader and artier domain generalization. In Proceedings of the IEEE international conference on computer vision, pp. 5542–5550, 2017.
- Li et al. (2018) Li, Haoliang, Pan, Sinno Jialin, Wang, Shiqi, and Kot, Alex C. Domain generalization with adversarial feature learning. In Proceedings of the IEEE Conference on Computer Vision and Pattern Recognition, pp. 5400–5409, 2018.
- Li et al. (2020) Li, Junnan, Socher, Richard, and Hoi, Steven CH. Dividemix: Learning with noisy labels as semi-supervised learning. In ICLR, 2020.
- Li et al. (2021a) Li, Mufei, Zhou, Jinjing, Hu, Jiajing, Fan, Wenxuan, Zhang, Yangkang, Gu, Yaxin, and Karypis, George. Dgl-lifesci: An open-source toolkit for deep learning on graphs in life science. ACS omega, 6(41):27233–27238, 2021a.
- Li et al. (2021b) Li, Shuangli, Zhou, Jingbo, Xu, Tong, Huang, Liang, Wang, Fan, Xiong, Haoyi, Huang, Weili, Dou, Dejing, and Xiong, Hui. Structure-aware interactive graph neural networks for the prediction of protein-ligand binding affinity. In Proceedings of the 27th ACM SIGKDD Conference on Knowledge Discovery & Data Mining, pp. 975–985, 2021b.
- Lim et al. (2019) Lim, Jaechang, Ryu, Seongok, Park, Kyubyong, Choe, Yo Joong, Ham, Jiyeon, and Kim, Woo Youn. Predicting drug–target interaction using a novel graph neural network with 3d structure-embedded graph representation. Journal of chemical information and modeling, 59(9):3981–3988, 2019.
- Lim et al. (2021) Lim, Sangsoo, Lu, Yijingxiu, Cho, Chang Yun, Sung, Inyoung, Kim, Jungwoo, Kim, Youngkuk, Park, Sungjoon, and Kim, Sun. A review on compound-protein interaction prediction methods: Data, format, representation and model. Computational and Structural Biotechnology Journal, 19:1541, 2021.
- Liu & Tao (2015) Liu, Tongliang and Tao, Dacheng. Classification with noisy labels by importance reweighting. TPAMI, 38(3):447–461, 2015.
- Liu et al. (2014) Liu, Zhihai, Li, Yan, Han, Li, Li, Jie, Liu, Jie, Zhao, Zhixiong, Nie, Wei, Liu, Yuchen, and Wang, Renxiao. Pdb-wide collection of binding data: current status of the pdbbind database. Bioinformatics, 31(3):405–412, 10 2014. ISSN 1367-4803.
- Liu et al. (2015) Liu, Ziwei, Luo, Ping, Wang, Xiaogang, and Tang, Xiaoou. Deep learning face attributes in the wild. In Proceedings of the IEEE international conference on computer vision, pp. 3730–3738, 2015.
- Long et al. (2015) Long, Mingsheng, Cao, Yue, Wang, Jianmin, and Jordan, Michael. Learning transferable features with deep adaptation networks. In International conference on machine learning, pp. 97–105. PMLR, 2015.
- Lu et al. (2019) Lu, Chengqiang, Liu, Qi, Wang, Chao, Huang, Zhenya, Lin, Peize, and He, Lixin. Molecular property prediction: A multilevel quantum interactions modeling perspective. In Proceedings of the AAAI Conference on Artificial Intelligence, volume 33, pp. 1052–1060, 2019.
- Luco & Ferretti (1997) Luco, Juan M. and Ferretti, Ferdinando H. Qsar based on multiple linear regression and pls methods for the anti-hiv activity of a large group of hept derivatives. Journal of Chemical Information and Computer Sciences, 37(2):392–401, 1997.
- Lukasik et al. (2020) Lukasik, Michal, Bhojanapalli, Srinadh, Menon, Aditya Krishna, and Kumar, Sanjiv. Does label smoothing mitigate label noise? In ICML, 2020.
- Ma et al. (2020) Ma, Hehuan, Bian, Yatao, Rong, Yu, Huang, Wenbing, Xu, Tingyang, Xie, Weiyang, Ye, Geyan, and Huang, Junzhou. Multi-view graph neural networks for molecular property prediction. arXiv preprint arXiv:2005.13607, 2020.
- Mamoshina et al. (2018) Mamoshina, Polina, Volosnikova, Marina, Ozerov, Ivan V, Putin, Evgeny, Skibina, Ekaterina, Cortese, Franco, and Zhavoronkov, Alex. Machine learning on human muscle transcriptomic data for biomarker discovery and tissue-specific drug target identification. Frontiers in genetics, 9:242, 2018.
- Martin et al. (2017) Martin, Eric J., Polyakov, Valery R., Tian, Li, and Perez, Rolando C. Profile-qsar 2.0: Kinase virtual screening accuracy comparable to four-concentration ic50s for realistically novel compounds. Journal of Chemical Information and Modeling, 57(8):2077–2088, 2017. doi: 10.1021/acs.jcim.7b00166. URL https://doi.org/10.1021/acs.jcim.7b00166. PMID: 28651433.
- Mayr et al. (2018) Mayr, Andreas, Klambauer, Günter, Unterthiner, Thomas, Steijaert, Marvin, Wegner, Jörg K, Ceulemans, Hugo, Clevert, Djork-Arné, and Hochreiter, Sepp. Large-scale comparison of machine learning methods for drug target prediction on chembl. Chemical science, 9(24):5441–5451, 2018.
- McNutt et al. (2021) McNutt, Andrew T, Francoeur, Paul, Aggarwal, Rishal, Masuda, Tomohide, Meli, Rocco, Ragoza, Matthew, Sunseri, Jocelyn, and Koes, David Ryan. Gnina 1.0: molecular docking with deep learning. Journal of cheminformatics, 13(1):1–20, 2021.
- Mendez et al. (2019) Mendez, David, Gaulton, Anna, Bento, A Patrícia, Chambers, Jon, De Veij, Marleen, Félix, Eloy, Magariños, María Paula, Mosquera, Juan F, Mutowo, Prudence, Nowotka, Michał, et al. Chembl: towards direct deposition of bioassay data. Nucleic acids research, 47(D1):D930–D940, 2019.
- Min et al. (2021) Min, Seonwoo, Park, Seunghyun, Kim, Siwon, Choi, Hyun-Soo, Lee, Byunghan, and Yoon, Sungroh. Pre-training of deep bidirectional protein sequence representations with structural information. IEEE Access, 9:123912–123926, 2021.
- Morgan (1965) Morgan, HL. The generation of a unique machine description for chemical structures-a technique developed at chemical abstracts service. J. Chemical Documentation, 5:107–113, 1965.
- Muratov et al. (2020) Muratov, Eugene N, Bajorath, Jürgen, Sheridan, Robert P, Tetko, Igor V, Filimonov, Dmitry, Poroikov, Vladimir, Oprea, Tudor I, Baskin, Igor I, Varnek, Alexandre, Roitberg, Adrian, et al. Qsar without borders. Chemical Society Reviews, 49(11):3525–3564, 2020.
- Nosengo (2016) Nosengo, Nicola. Can you teach old drugs new tricks? Nature News, 534(7607):314, 2016.
- Pan & Yang (2009) Pan, Sinno Jialin and Yang, Qiang. A survey on transfer learning. IEEE Transactions on knowledge and data engineering, 22(10):1345–1359, 2009.
- Paul et al. (2021) Paul, Debleena, Sanap, Gaurav, Shenoy, Snehal, Kalyane, Dnyaneshwar, Kalia, Kiran, and Tekade, Rakesh K. Artificial intelligence in drug discovery and development. Drug Discovery Today, 26(1):80, 2021.
- Peng et al. (2019) Peng, Xingchao, Bai, Qinxun, Xia, Xide, Huang, Zijun, Saenko, Kate, and Wang, Bo. Moment matching for multi-source domain adaptation. In Proceedings of the IEEE/CVF International Conference on Computer Vision, pp. 1406–1415, 2019.
- Pham et al. (2021) Pham, Thai-Hoang, Qiu, Yue, Zeng, Jucheng, Xie, Lei, and Zhang, Ping. A deep learning framework for high-throughput mechanism-driven phenotype compound screening and its application to covid-19 drug repurposing. Nature Machine Intelligence, 3(3):247–257, 2021.
- Pradeep et al. (2016) Pradeep, Prachi, Povinelli, Richard J, White, Shannon, and Merrill, Stephen J. An ensemble model of qsar tools for regulatory risk assessment. Journal of Cheminformatics, 8(1):1–9, 2016.
- Pushpakom et al. (2019) Pushpakom, Sudeep, Iorio, Francesco, Eyers, Patrick A, Escott, K Jane, Hopper, Shirley, Wells, Andrew, Doig, Andrew, Guilliams, Tim, Latimer, Joanna, McNamee, Christine, et al. Drug repurposing: progress, challenges and recommendations. Nature reviews Drug discovery, 18(1):41–58, 2019.
- Qiao et al. (2020) Qiao, Fengchun, Zhao, Long, and Peng, Xi. Learning to learn single domain generalization. In Proceedings of the IEEE/CVF Conference on Computer Vision and Pattern Recognition (CVPR), June 2020.
- Ramsundar et al. (2015) Ramsundar, Bharath, Kearnes, Steven, Riley, Patrick, Webster, Dale, Konerding, David, and Pande, Vijay. Massively multitask networks for drug discovery. arXiv preprint arXiv:1502.02072, 2015.
- Ren et al. (2018) Ren, Mengye, Zeng, Wenyuan, Yang, Bin, and Urtasun, Raquel. Learning to reweight examples for robust deep learning. In ICML, 2018.
- Rogers & Hahn (2010) Rogers, David and Hahn, Mathew. Extended-connectivity fingerprints. Journal of chemical information and modeling, 50(5):742–754, 2010.
- Romera-Paredes & Torr (2015) Romera-Paredes, Bernardino and Torr, Philip. An embarrassingly simple approach to zero-shot learning. In International conference on machine learning, pp. 2152–2161. PMLR, 2015.
- Rong et al. (2020) Rong, Yu, Bian, Yatao, Xu, Tingyang, Xie, Weiyang, Wei, Ying, Huang, Wenbing, and Huang, Junzhou. Self-supervised graph transformer on large-scale molecular data. In NeurIPS, 2020.
- Roth et al. (2000) Roth, Bryan L, Lopez, Estelle, Patel, Shamil, and Kroeze, Wesley K. The multiplicity of serotonin receptors: uselessly diverse molecules or an embarrassment of riches? The Neuroscientist, 6(4):252–262, 2000.
- Sagawa et al. (2019) Sagawa, Shiori, Koh, Pang Wei, Hashimoto, Tatsunori B, and Liang, Percy. Distributionally robust neural networks for group shifts: On the importance of regularization for worst-case generalization. arXiv preprint arXiv:1911.08731, 2019.
- Sagawa et al. (2020) Sagawa, Shiori, Raghunathan, Aditi, Koh, Pang Wei, and Liang, Percy. An investigation of why overparameterization exacerbates spurious correlations. In International Conference on Machine Learning, pp. 8346–8356. PMLR, 2020.
- Sagawa et al. (2021) Sagawa, Shiori, Koh, Pang Wei, Lee, Tony, Gao, Irena, Xie, Sang Michael, Shen, Kendrick, Kumar, Ananya, Hu, Weihua, Yasunaga, Michihiro, Marklund, Henrik, et al. Extending the wilds benchmark for unsupervised adaptation. arXiv preprint arXiv:2112.05090, 2021.
- Sanchez-Lengeling et al. (2017) Sanchez-Lengeling, Benjamin, Outeiral, Carlos, Guimaraes, Gabriel L, and Aspuru-Guzik, Alán. Optimizing distributions over molecular space. an objective-reinforced generative adversarial network for inverse-design chemistry (organic). 2017.
- Sanger (1952) Sanger, Frederick. The arrangement of amino acids in proteins. Advances in protein chemistry, 7:1–67, 1952.
- Satorras et al. (2021) Satorras, Victor Garcia, Hoogeboom, Emiel, Fuchs, Fabian B, Posner, Ingmar, and Welling, Max. E(n) equivariant normalizing flows for molecule generation in 3d. arXiv preprint arXiv:2105.09016, 2021.
- Schneider (2018) Schneider, Gisbert. Automating drug discovery. Nature reviews drug discovery, 17(2):97–113, 2018.
- Schütt et al. (2017) Schütt, Kristof T, Kindermans, Pieter-Jan, Sauceda, Huziel E, Chmiela, Stefan, Tkatchenko, Alexandre, and Müller, Klaus-Robert. Schnet: A continuous-filter convolutional neural network for modeling quantum interactions. arXiv preprint arXiv:1706.08566, 2017.
- Segler et al. (2018) Segler, Marwin HS, Preuss, Mike, and Waller, Mark P. Planning chemical syntheses with deep neural networks and symbolic ai. Nature, 555(7698):604–610, 2018.
- Shu et al. (2021) Shu, Yang, Cao, Zhangjie, Wang, Chenyu, Wang, Jianmin, and Long, Mingsheng. Open domain generalization with domain-augmented meta-learning. In Proceedings of the IEEE/CVF Conference on Computer Vision and Pattern Recognition, pp. 9624–9633, 2021.
- Simonovsky & Komodakis (2018) Simonovsky, Martin and Komodakis, Nikos. GraphVAE: Towards generation of small graphs using variational autoencoders. In International conference on artificial neural networks, pp. 412–422. Springer, 2018.
- Sliwoski et al. (2013) Sliwoski, Gregory, Kothiwale, Sandeepkumar, Meiler, Jens, and Lowe Jr., Edward W. Computational methods in drug discovery. Pharmacological reviews, 66(1):334–395, Dec 2013. ISSN 1521-0081. doi: 10.1124/pr.112.007336. URL https://pubmed.ncbi.nlm.nih.gov/24381236. 24381236[pmid].
- Song et al. (2020a) Song, Hwanjun, Kim, Minseok, Park, Dongmin, and Lee, Jae-Gil. Learning from noisy labels with deep neural networks: A survey. arXiv preprint arXiv:2007.08199, 2020a.
- Song et al. (2020b) Song, Ying, Zheng, Shuangjia, Niu, Zhangming, Fu, Zhang-Hua, Lu, Yutong, and Yang, Yuedong. Communicative representation learning on attributed molecular graphs. In IJCAI, pp. 2831–2838, 2020b.
- Stanley et al. (2021) Stanley, Megan, Bronskill, John F, Maziarz, Krzysztof, Misztela, Hubert, Lanini, Jessica, Segler, Marwin, Schneider, Nadine, and Brockschmidt, Marc. FS-mol: A few-shot learning dataset of molecules. In Thirty-fifth Conference on Neural Information Processing Systems Datasets and Benchmarks Track (Round 2), 2021. URL https://openreview.net/forum?id=701FtuyLlAd.
- Stepniewska-Dziubinska et al. (2018) Stepniewska-Dziubinska, Marta M, Zielenkiewicz, Piotr, and Siedlecki, Pawel. Development and evaluation of a deep learning model for protein–ligand binding affinity prediction. Bioinformatics, 34(21):3666–3674, 2018.
- Stokes et al. (2020) Stokes, Jonathan M, Yang, Kevin, Swanson, Kyle, Jin, Wengong, Cubillos-Ruiz, Andres, Donghia, Nina M, MacNair, Craig R, French, Shawn, Carfrae, Lindsey A, Bloom-Ackermann, Zohar, et al. A deep learning approach to antibiotic discovery. Cell, 180(4):688–702, 2020.
- Sukhbaatar et al. (2015) Sukhbaatar, Sainbayar, Bruna, Joan, Paluri, Manohar, Bourdev, Lubomir, and Fergus, Rob. Training convolutional networks with noisy labels. In ICLR Workshop, 2015.
- Sun & Saenko (2016) Sun, Baochen and Saenko, Kate. Deep coral: Correlation alignment for deep domain adaptation. In European conference on computer vision, pp. 443–450. Springer, 2016.
- Svetnik et al. (2003) Svetnik, Vladimir, Liaw, Andy, Tong, Christopher, Culberson, J. Christopher, Sheridan, Robert P., and Feuston, Bradley P. Random forest: A classification and regression tool for compound classification and qsar modeling. Journal of Chemical Information and Computer Sciences, 43(6):1947–1958, 2003.
- Swamidass et al. (2009) Swamidass, S Joshua, Azencott, Chloé-Agathe, Lin, Ting-Wan, Gramajo, Hugo, Tsai, Shiou-Chuan, and Baldi, Pierre. Influence relevance voting: an accurate and interpretable virtual high throughput screening method. Journal of chemical information and modeling, 49(4):756–766, 2009.
- Trott & Olson (2010) Trott, Oleg and Olson, Arthur J. Autodock vina: improving the speed and accuracy of docking with a new scoring function, efficient optimization, and multithreading. Journal of computational chemistry, 31(2):455–461, 2010.
- Tzeng et al. (2014) Tzeng, Eric, Hoffman, Judy, Zhang, Ning, Saenko, Kate, and Darrell, Trevor. Deep domain confusion: Maximizing for domain invariance, 2014.
- van Rooyen & Williamson (2017) van Rooyen, Brendan and Williamson, Robert C. A theory of learning with corrupted labels. JMLR, 18(1):8501–8550, 2017.
- van Rooyen et al. (2015) van Rooyen, Brendan, Menon, Aditya, and Williamson, Robert. Learning with symmetric label noise: The importance of being unhinged. In NeurIPS, pp. 10–18, 2015.
- Vapnik (1999) Vapnik, Vladimir. The nature of statistical learning theory. Springer science & business media, 1999.
- Velickovic et al. (2018) Velickovic, Petar, Cucurull, Guillem, Casanova, Arantxa, Romero, Adriana, Liò, Pietro, and Bengio, Yoshua. Graph attention networks. 2018. URL https://openreview.net/forum?id=rJXMpikCZ.
- Venkateswara et al. (2017) Venkateswara, Hemanth, Eusebio, Jose, Chakraborty, Shayok, and Panchanathan, Sethuraman. Deep hashing network for unsupervised domain adaptation. In Proceedings of the IEEE conference on computer vision and pattern recognition, pp. 5018–5027, 2017.
- Volpi et al. (2018) Volpi, Riccardo, Namkoong, Hongseok, Sener, Ozan, Duchi, John, Murino, Vittorio, and Savarese, Silvio. Generalizing to unseen domains via adversarial data augmentation. arXiv preprint arXiv:1805.12018, 2018.
- Wallach et al. (2015) Wallach, Izhar, Dzamba, Michael, and Heifets, Abraham. Atomnet: a deep convolutional neural network for bioactivity prediction in structure-based drug discovery. arXiv preprint arXiv:1510.02855, 2015.
- Wang et al. (2021) Wang, Hongwei, Li, Weijiang, Jin, Xiaomeng, Cho, Kyunghyun, Ji, Heng, Han, Jiawei, and Burke, Martin D. Chemical-reaction-aware molecule representation learning. arXiv preprint arXiv:2109.09888, 2021.
- Wang et al. (2019a) Wang, Sheng, Guo, Yuzhi, Wang, Yuhong, Sun, Hongmao, and Huang, Junzhou. Smiles-bert: large scale unsupervised pre-training for molecular property prediction. In Proceedings of the 10th ACM international conference on bioinformatics, computational biology and health informatics, pp. 429–436, 2019a.
- Wang et al. (2019b) Wang, Wei, Zheng, Vincent W, Yu, Han, and Miao, Chunyan. A survey of zero-shot learning: Settings, methods, and applications. ACM Transactions on Intelligent Systems and Technology (TIST), 10(2):1–37, 2019b.
- Wang et al. (2009) Wang, Yanli, Xiao, Jewen, Suzek, Tugba O, Zhang, Jian, Wang, Jiyao, and Bryant, Stephen H. Pubchem: a public information system for analyzing bioactivities of small molecules. Nucleic acids research, 37(suppl_2):W623–W633, 2009.
- Wang et al. (2017) Wang, Yixin, Kucukelbir, Alp, and Blei, David M. Robust probabilistic modeling with bayesian data reweighting. In ICML, pp. 3646–3655, 2017.
- Wang et al. (2020) Wang, Yufei, Li, Haoliang, and Kot, Alex C. Heterogeneous domain generalization via domain mixup. In ICASSP 2020-2020 IEEE International Conference on Acoustics, Speech and Signal Processing (ICASSP), pp. 3622–3626. IEEE, 2020.
- Weininger (1988) Weininger, David. Smiles, a chemical language and information system. 1. introduction to methodology and encoding rules. Journal of chemical information and computer sciences, 28(1):31–36, 1988.
- Wu et al. (2018) Wu, Zhenqin, Ramsundar, Bharath, Feinberg, Evan N, Gomes, Joseph, Geniesse, Caleb, Pappu, Aneesh S, Leswing, Karl, and Pande, Vijay. Moleculenet: a benchmark for molecular machine learning. Chemical science, 9(2):513–530, 2018.
- Xiong et al. (2019) Xiong, Zhaoping, Wang, Dingyan, Liu, Xiaohong, Zhong, Feisheng, Wan, Xiaozhe, Li, Xutong, Li, Zhaojun, Luo, Xiaomin, Chen, Kaixian, Jiang, Hualiang, et al. Pushing the boundaries of molecular representation for drug discovery with the graph attention mechanism. Journal of medicinal chemistry, 63(16):8749–8760, 2019.
- Xu et al. (2018) Xu, Keyulu, Hu, Weihua, Leskovec, Jure, and Jegelka, Stefanie. How powerful are graph neural networks? In International Conference on Learning Representations, 2018.
- Xu et al. (2020) Xu, Minghao, Zhang, Jian, Ni, Bingbing, Li, Teng, Wang, Chengjie, Tian, Qi, and Zhang, Wenjun. Adversarial domain adaptation with domain mixup. In The Thirty-Fourth AAAI Conference on Artificial Intelligence, pp. 6502–6509. AAAI Press, 2020.
- Xu et al. (2017) Xu, Zheng, Wang, Sheng, Zhu, Feiyun, and Huang, Junzhou. Seq2seq fingerprint: An unsupervised deep molecular embedding for drug discovery. In BCB, 2017.
- Yan et al. (2020a) Yan, Chaochao, Ding, Qianggang, Zhao, Peilin, Zheng, Shuangjia, Yang, Jinyu, Yu, Yang, and Huang, Junzhou. Retroxpert: Decompose retrosynthesis prediction like a chemist. arXiv preprint arXiv:2011.02893, 2020a.
- Yan et al. (2020b) Yan, Shen, Song, Huan, Li, Nanxiang, Zou, Lincan, and Ren, Liu. Improve unsupervised domain adaptation with mixup training, 2020b.
- Yang et al. (2019a) Yang, Kevin, Swanson, Kyle, Jin, Wengong, Coley, Connor, Eiden, Philipp, Gao, Hua, Guzman-Perez, Angel, Hopper, Timothy, Kelley, Brian, Mathea, Miriam, et al. Analyzing learned molecular representations for property prediction. Journal of chemical information and modeling, 59(8):3370–3388, 2019a.
- Yang et al. (2019b) Yang, Xin, Wang, Yifei, Byrne, Ryan, Schneider, Gisbert, and Yang, Shengyong. Concepts of artificial intelligence for computer-assisted drug discovery. Chemical reviews, 119(18):10520–10594, 2019b.
- Yao et al. (2022) Yao, Huaxiu, Wang, Yu, Li, Sai, Zhang, Linjun, Liang, Weixin, Zou, James, and Finn, Chelsea. Improving out-of-distribution robustness via selective augmentation, 2022.
- Ye et al. (2021) Ye, Nanyang, Li, Kaican, Hong, Lanqing, Bai, Haoyue, Chen, Yiting, Zhou, Fengwei, and Li, Zhenguo. Ood-bench: Benchmarking and understanding out-of-distribution generalization datasets and algorithms. arXiv preprint arXiv:2106.03721, 2021.
- Ying et al. (2021) Ying, Chengxuan, Cai, Tianle, Luo, Shengjie, Zheng, Shuxin, Ke, Guolin, He, Di, Shen, Yanming, and Liu, Tie-Yan. Do transformers really perform bad for graph representation? arXiv preprint arXiv:2106.05234, 2021.
- Yu et al. (2019) Yu, Xingrui, Han, Bo, Yao, Jiangchao, Niu, Gang, Tsang, Ivor W, and Sugiyama, Masashi. How does disagreement help generalization against label corruption? In ICML, 2019.
- Yue et al. (2019) Yue, Xiangyu, Zhang, Yang, Zhao, Sicheng, Sangiovanni-Vincentelli, Alberto, Keutzer, Kurt, and Gong, Boqing. Domain randomization and pyramid consistency: Simulation-to-real generalization without accessing target domain data. In Proceedings of the IEEE/CVF International Conference on Computer Vision, pp. 2100–2110, 2019.
- Zakharov et al. (2016) Zakharov, Alexey V, Varlamova, Ekaterina V, Lagunin, Alexey A, Dmitriev, Alexander V, Muratov, Eugene N, Fourches, Denis, Kuz’min, Victor E, Poroikov, Vladimir V, Tropsha, Alexander, and Nicklaus, Marc C. Qsar modeling and prediction of drug-drug interactions. Molecular pharmaceutics, 13(2):545–556, 2016.
- Zeng et al. (2020) Zeng, Xiangxiang, Zhu, Siyi, Lu, Weiqiang, Liu, Zehui, Huang, Jin, Zhou, Yadi, Fang, Jiansong, Huang, Yin, Guo, Huimin, Li, Lang, et al. Target identification among known drugs by deep learning from heterogeneous networks. Chemical Science, 11(7):1775–1797, 2020.
- Zhang et al. (2016) Zhang, Chen, Cheng, Feixiong, Li, Weihua, Liu, Guixia, Lee, Philip W, and Tang, Yun. In silico prediction of drug induced liver toxicity using substructure pattern recognition method. Molecular informatics, 35(3-4):136–144, 2016.
- Zhang et al. (2017) Zhang, Hongyi, Cisse, Moustapha, Dauphin, Yann N, and Lopez-Paz, David. mixup: Beyond empirical risk minimization. arXiv preprint arXiv:1710.09412, 2017.
- Zhang et al. (2020) Zhang, Jingzhao, Menon, Aditya, Veit, Andreas, Bhojanapalli, Srinadh, Kumar, Sanjiv, and Sra, Suvrit. Coping with label shift via distributionally robust optimisation. arXiv preprint arXiv:2010.12230, 2020.
- Zhao et al. (2020) Zhao, Long, Liu, Ting, Peng, Xi, and Metaxas, Dimitris. Maximum-entropy adversarial data augmentation for improved generalization and robustness. In Larochelle, H., Ranzato, M., Hadsell, R., Balcan, M. F., and Lin, H. (eds.), Advances in Neural Information Processing Systems, volume 33, pp. 14435–14447. Curran Associates, Inc., 2020.
- Zheng et al. (2019) Zheng, Shuangjia, Rao, Jiahua, Zhang, Zhongyue, Xu, Jun, and Yang, Yuedong. Predicting retrosynthetic reactions using self-corrected transformer neural networks. Journal of Chemical Information and Modeling, 60(1):47–55, 2019.
- Zhou et al. (2021a) Zhou, Chunting, Ma, Xuezhe, Michel, Paul, and Neubig, Graham. Examining and combating spurious features under distribution shift. arXiv preprint arXiv:2106.07171, 2021a.
- Zhou et al. (2020a) Zhou, Fan, Jiang, Zhuqing, Shui, Changjian, Wang, Boyu, and Chaib-draa, Brahim. Domain generalization with optimal transport and metric learning. arXiv preprint arXiv:2007.10573, 2020a.
- Zhou et al. (2021b) Zhou, Fan, Jiang, Zhuqing, Shui, Changjian, Wang, Boyu, and Chaib-draa, Brahim. Domain generalization via optimal transport with metric similarity learning. Neurocomputing, 456(C):469–480, oct 2021b.
- Zhou et al. (2020b) Zhou, Kaiyang, Yang, Yongxin, Hospedales, Timothy, and Xiang, Tao. Deep domain-adversarial image generation for domain generalisation. In Proceedings of the AAAI Conference on Artificial Intelligence, volume 34, pp. 13025–13032, 2020b.
- Zhuang et al. (2020) Zhuang, Fuzhen, Qi, Zhiyuan, Duan, Keyu, Xi, Dongbo, Zhu, Yongchun, Zhu, Hengshu, Xiong, Hui, and He, Qing. A comprehensive survey on transfer learning. Proceedings of the IEEE, 109(1):43–76, 2020.
Appendix of DrugOOD
Appendix A Statistics of the Realized Datasets
| Data subset | Train | ID Val | ID Test | OOD Val | OOD Test | |||||||
| DrugOOD-lbap-core-ic50-assay | 83802 | 11434 | 311 | 34179 | 311 | 11314 | 311 | 11683 | 314 | 19028 | 699 | 19032 |
| DrugOOD-lbap-core-ic50-scaffold | 83802 | 11434 | 6881 | 21519 | 1912 | 4920 | 24112 | 30708 | 6345 | 19041 | 4350 | 19048 |
| DrugOOD-lbap-core-ic50-size | 83802 | 11434 | 190 | 36597 | 140 | 12153 | 229 | 12411 | 4 | 17660 | 18 | 16415 |
| DrugOOD-lbap-core-ec50-assay | 10199 | 2462 | 47 | 4540 | 47 | 1502 | 47 | 1557 | 46 | 2572 | 101 | 2490 |
| DrugOOD-lbap-core-ec50-scaffold | 10200 | 2462 | 850 | 2570 | 224 | 580 | 3668 | 4447 | 1193 | 2532 | 953 | 2533 |
| DrugOOD-lbap-core-ec50-size | 10200 | 2462 | 167 | 4684 | 103 | 1513 | 205 | 1753 | 4 | 2313 | 17 | 2399 |
| DrugOOD-lbap-core-ki-assay | 22851 | 488 | 112 | 8393 | 112 | 2769 | 112 | 2900 | 83 | 4631 | 169 | 4646 |
| DrugOOD-lbap-core-ki-scaffold | 22851 | 488 | 1820 | 5323 | 521 | 1192 | 5826 | 7490 | 1366 | 4665 | 779 | 4669 |
| DrugOOD-lbap-core-ki-size | 22851 | 488 | 89 | 8481 | 62 | 2799 | 118 | 2941 | 4 | 4644 | 24 | 4474 |
| DrugOOD-lbap-core-potency-assay | 12265 | 10554 | 9 | 8549 | 9 | 2848 | 9 | 2856 | 7 | 4008 | 65 | 4558 |
| DrugOOD-lbap-core-potency-scaffold | 12032 | 10787 | 2003 | 3361 | 284 | 433 | 8910 | 9898 | 2125 | 4563 | 1509 | 4564 |
| DrugOOD-lbap-core-potency-size | 11994 | 10825 | 48 | 8629 | 38 | 2859 | 60 | 2938 | 3 | 4182 | 18 | 4211 |
| DrugOOD-lbap-refined-ic50-assay | 240996 | 25526 | 1446 | 95373 | 1446 | 31401 | 1446 | 33164 | 1361 | 53293 | 2805 | 53291 |
| DrugOOD-lbap-refined-ic50-scaffold | 240996 | 25526 | 19285 | 60908 | 5804 | 14068 | 66187 | 84942 | 15368 | 53300 | 9333 | 53304 |
| DrugOOD-lbap-refined-ic50-size | 240996 | 25526 | 225 | 97779 | 176 | 32531 | 264 | 32847 | 4 | 51443 | 20 | 51922 |
| DrugOOD-lbap-refined-ec50-assay | 32454 | 5457 | 141 | 13600 | 141 | 4504 | 141 | 4655 | 186 | 7586 | 372 | 7566 |
| DrugOOD-lbap-refined-ec50-scaffold | 32454 | 5457 | 2834 | 7775 | 745 | 1647 | 10945 | 13324 | 3082 | 7587 | 2187 | 7578 |
| DrugOOD-lbap-refined-ec50-size | 32454 | 5457 | 220 | 13762 | 140 | 4524 | 262 | 4843 | 5 | 8558 | 17 | 6224 |
| DrugOOD-lbap-refined-ki-assay | 72484 | 2472 | 578 | 26752 | 578 | 8765 | 578 | 9462 | 414 | 14988 | 905 | 14989 |
| DrugOOD-lbap-refined-ki-scaffold | 72484 | 2472 | 5643 | 17172 | 1692 | 3899 | 18612 | 23914 | 4436 | 15013 | 2386 | 14958 |
| DrugOOD-lbap-refined-ki-size | 72484 | 2472 | 148 | 28230 | 102 | 9366 | 189 | 9591 | 4 | 13060 | 23 | 14709 |
| DrugOOD-lbap-refined-potency-assay | 25382 | 22611 | 10 | 17894 | 10 | 5962 | 10 | 5974 | 7 | 8899 | 105 | 9264 |
| DrugOOD-lbap-refined-potency-scaffold | 25120 | 22873 | 4928 | 8380 | 850 | 1145 | 16819 | 19270 | 4344 | 9598 | 2927 | 9600 |
| DrugOOD-lbap-refined-potency-size | 25239 | 22754 | 51 | 17951 | 43 | 5969 | 65 | 6042 | 4 | 10731 | 18 | 7300 |
| DrugOOD-lbap-general-ic50-assay | 476865 | 91691 | 6917 | 201951 | 6917 | 65424 | 6917 | 73777 | 6207 | 113704 | 16814 | 113700 |
| DrugOOD-lbap-general-ic50-scaffold | 476865 | 91691 | 43552 | 129740 | 13516 | 29174 | 142173 | 182220 | 29513 | 113723 | 15189 | 113699 |
| DrugOOD-lbap-general-ic50-size | 476865 | 91691 | 290 | 217294 | 243 | 72349 | 311 | 72742 | 4 | 102544 | 22 | 103627 |
| DrugOOD-lbap-general-ec50-assay | 92445 | 18000 | 1079 | 39333 | 1079 | 12849 | 1079 | 14086 | 1137 | 22095 | 2883 | 22082 |
| DrugOOD-lbap-general-ec50-scaffold | 92445 | 18000 | 8677 | 23481 | 2450 | 4977 | 30611 | 37811 | 7659 | 22095 | 4844 | 22081 |
| DrugOOD-lbap-general-ec50-size | 92445 | 18000 | 294 | 42697 | 238 | 14151 | 312 | 14531 | 4 | 19301 | 20 | 19765 |
| DrugOOD-lbap-general-ki-assay | 146212 | 6533 | 2251 | 54062 | 2251 | 17399 | 2251 | 20187 | 1753 | 30555 | 4281 | 30542 |
| DrugOOD-lbap-general-ki-scaffold | 146212 | 6533 | 12334 | 34395 | 3625 | 7472 | 39232 | 49784 | 8780 | 30559 | 4280 | 30535 |
| DrugOOD-lbap-general-ki-size | 146212 | 6533 | 190 | 55386 | 140 | 18407 | 235 | 18687 | 5 | 32508 | 22 | 27757 |
| DrugOOD-lbap-general-potency-assay | 26784 | 22389 | 10 | 17746 | 10 | 5912 | 10 | 5926 | 9 | 10146 | 184 | 9443 |
| DrugOOD-lbap-general-potency-scaffold | 25617 | 23556 | 5052 | 8647 | 887 | 1196 | 17122 | 19660 | 4565 | 9834 | 2674 | 9836 |
| DrugOOD-lbap-general-potency-size | 25674 | 23499 | 51 | 18224 | 44 | 6060 | 66 | 6138 | 4 | 10916 | 18 | 7835 |
| Data subset | Train | ID Val | ID Test | OOD Val | OOD Test | |||||||
| DrugOOD-sbap-core-ic50-assay | 104907 | 15591 | 351 | 43250 | 351 | 14327 | 351 | 14737 | 381 | 24135 | 723 | 24049 |
| DrugOOD-sbap-core-ic50-protein | 104907 | 15591 | 127 | 43439 | 127 | 14449 | 127 | 14593 | 134 | 24006 | 416 | 24011 |
| DrugOOD-sbap-core-ic50-protein-family | 104907 | 15591 | 1 | 46890 | 1 | 15630 | 1 | 15631 | 2 | 21112 | 10 | 21235 |
| DrugOOD-sbap-core-ic50-scaffold | 104907 | 15591 | 9911 | 31201 | 2560 | 7149 | 24334 | 33948 | 6151 | 24138 | 4322 | 24062 |
| DrugOOD-sbap-core-ic50-size | 104907 | 15591 | 192 | 46390 | 154 | 15413 | 229 | 15685 | 4 | 21422 | 18 | 21588 |
| DrugOOD-sbap-core-ec50-assay | 12053 | 3287 | 55 | 5541 | 55 | 1831 | 55 | 1898 | 53 | 3023 | 111 | 3047 |
| DrugOOD-sbap-core-ec50-protein | 12053 | 3287 | 29 | 5524 | 29 | 1834 | 29 | 1867 | 28 | 3109 | 66 | 3006 |
| DrugOOD-sbap-core-ec50-protein-family | 12053 | 3287 | 2 | 5684 | 2 | 1894 | 2 | 1897 | 2 | 3124 | 5 | 2741 |
| DrugOOD-sbap-core-ec50-scaffold | 12053 | 3287 | 1381 | 3676 | 292 | 761 | 3680 | 4768 | 1154 | 3068 | 980 | 3067 |
| DrugOOD-sbap-core-ec50-size | 12053 | 3287 | 170 | 5772 | 109 | 1874 | 205 | 2130 | 4 | 2740 | 17 | 2824 |
| DrugOOD-sbap-core-ki-assay | 31292 | 852 | 164 | 11540 | 164 | 3801 | 164 | 3994 | 116 | 6427 | 180 | 6382 |
| DrugOOD-sbap-core-ki-protein | 31292 | 852 | 37 | 11604 | 37 | 3858 | 37 | 3904 | 48 | 6409 | 125 | 6369 |
| DrugOOD-sbap-core-ki-protein-family | 31292 | 852 | 2 | 16504 | 2 | 5501 | 2 | 5503 | 9 | 4636 | ||
| DrugOOD-sbap-core-ki-scaffold | 31292 | 852 | 2712 | 8640 | 786 | 1983 | 5799 | 8670 | 1386 | 6456 | 786 | 6395 |
| DrugOOD-sbap-core-ki-size | 31292 | 852 | 99 | 11934 | 67 | 3946 | 118 | 4094 | 4 | 5951 | 24 | 6219 |
| DrugOOD-sbap-core-potency-assay | 18665 | 15997 | 10 | 12892 | 10 | 4295 | 10 | 4305 | 9 | 6296 | 63 | 6874 |
| DrugOOD-sbap-core-potency-protein | 19369 | 15293 | 9 | 12699 | 9 | 4230 | 9 | 4241 | 7 | 6568 | 30 | 6924 |
| DrugOOD-sbap-core-potency-protein-family | 18846 | 15816 | 1 | 15701 | 1 | 5233 | 1 | 5235 | 1 | 4379 | 6 | 4114 |
| DrugOOD-sbap-core-potency-scaffold | 18665 | 15997 | 3460 | 7891 | 847 | 1487 | 9034 | 11430 | 2099 | 6921 | 1411 | 6933 |
| DrugOOD-sbap-core-potency-size | 18665 | 15997 | 52 | 13093 | 46 | 4352 | 60 | 4414 | 3 | 6243 | 18 | 6560 |
| DrugOOD-sbap-refined-ic50-assay | 302752 | 37178 | 1760 | 121655 | 1760 | 40060 | 1760 | 42245 | 1712 | 68003 | 2937 | 67967 |
| DrugOOD-sbap-refined-ic50-protein | 302752 | 37178 | 219 | 122326 | 219 | 40715 | 219 | 40992 | 239 | 68065 | 1025 | 67832 |
| DrugOOD-sbap-refined-ic50-protein-family | 302752 | 37178 | 1 | 130685 | 1 | 43561 | 1 | 43563 | 2 | 70150 | 12 | 51971 |
| DrugOOD-sbap-refined-ic50-scaffold | 302752 | 37178 | 28561 | 89798 | 7690 | 20509 | 65773 | 93651 | 14954 | 67993 | 8900 | 67979 |
| DrugOOD-sbap-refined-ic50-size | 302752 | 37178 | 225 | 123320 | 182 | 41046 | 264 | 41357 | 5 | 77829 | 19 | 56378 |
| DrugOOD-sbap-refined-ec50-assay | 35977 | 6428 | 177 | 15205 | 177 | 5016 | 177 | 5239 | 212 | 8484 | 384 | 8461 |
| DrugOOD-sbap-refined-ec50-protein | 35977 | 6428 | 47 | 15372 | 47 | 5112 | 47 | 5168 | 59 | 8351 | 195 | 8402 |
| DrugOOD-sbap-refined-ec50-protein-family | 35977 | 6428 | 2 | 18027 | 2 | 6008 | 2 | 6011 | 1 | 4791 | 8 | 7568 |
| DrugOOD-sbap-refined-ec50-scaffold | 35977 | 6428 | 3774 | 9950 | 890 | 2051 | 10441 | 13442 | 2854 | 8482 | 1957 | 8480 |
| DrugOOD-sbap-refined-ec50-size | 35977 | 6428 | 228 | 15809 | 150 | 5202 | 262 | 5527 | 4 | 7763 | 18 | 8104 |
| DrugOOD-sbap-refined-ki-assay | 136133 | 6050 | 688 | 50921 | 688 | 16783 | 688 | 17628 | 702 | 28440 | 1131 | 28411 |
| DrugOOD-sbap-refined-ki-protein | 136133 | 6050 | 125 | 51209 | 125 | 17033 | 125 | 17193 | 121 | 28364 | 427 | 28384 |
| DrugOOD-sbap-refined-ki-protein-family | 136133 | 6050 | 2 | 76074 | 2 | 25358 | 2 | 25359 | 11 | 15392 | ||
| DrugOOD-sbap-refined-ki-scaffold | 136133 | 6050 | 9870 | 41972 | 2878 | 10685 | 19006 | 32687 | 4194 | 28531 | 2009 | 28308 |
| DrugOOD-sbap-refined-ki-size | 136128 | 6047 | 164 | 54637 | 117 | 18164 | 190 | 18401 | 4 | 24120 | 21 | 26853 |
| DrugOOD-sbap-refined-potency-assay | 39841 | 32727 | 13 | 26983 | 13 | 8991 | 13 | 9010 | 7 | 13315 | 99 | 14269 |
| DrugOOD-sbap-refined-potency-protein | 39841 | 32727 | 12 | 26411 | 12 | 8800 | 12 | 8818 | 7 | 15531 | 41 | 13008 |
| DrugOOD-sbap-refined-potency-protein-family | 41827 | 30741 | 1 | 31027 | 1 | 10342 | 1 | 10344 | 1 | 11239 | 6 | 9616 |
| DrugOOD-sbap-refined-potency-scaffold | 39841 | 32727 | 7645 | 17457 | 1872 | 3292 | 17214 | 22791 | 4216 | 14549 | 2545 | 14479 |
| DrugOOD-sbap-refined-potency-size | 39840 | 32726 | 53 | 26233 | 49 | 8729 | 65 | 8810 | 4 | 16635 | 18 | 12159 |
| DrugOOD-sbap-general-ic50-assay | 514296 | 69105 | 6171 | 207522 | 6171 | 67554 | 6171 | 74982 | 5678 | 116671 | 12019 | 116672 |
| DrugOOD-sbap-general-ic50-protein | 514296 | 69105 | 252 | 209978 | 252 | 69923 | 252 | 70236 | 307 | 116773 | 2112 | 116491 |
| DrugOOD-sbap-general-ic50-protein-family | 514296 | 69105 | 1 | 224277 | 1 | 74759 | 1 | 74759 | 2 | 122574 | 12 | 87032 |
| DrugOOD-sbap-general-ic50-scaffold | 514296 | 69105 | 50852 | 156612 | 14093 | 35397 | 109140 | 158031 | 24515 | 116698 | 12113 | 116663 |
| DrugOOD-sbap-general-ic50-size | 514296 | 69105 | 281 | 226190 | 233 | 75318 | 301 | 75688 | 4 | 102468 | 22 | 103737 |
| DrugOOD-sbap-general-ec50-assay | 66827 | 8867 | 728 | 26966 | 728 | 8805 | 728 | 9667 | 769 | 15127 | 1605 | 15129 |
| DrugOOD-sbap-general-ec50-protein | 66827 | 8867 | 68 | 27256 | 68 | 9068 | 68 | 9158 | 95 | 15134 | 468 | 15078 |
| DrugOOD-sbap-general-ec50-protein-family | 66827 | 8867 | 2 | 31076 | 2 | 10358 | 2 | 10361 | 1 | 12651 | 10 | 11248 |
| DrugOOD-sbap-general-ec50-scaffold | 66827 | 8867 | 6777 | 18581 | 1779 | 3923 | 17150 | 22913 | 4503 | 15168 | 2962 | 15109 |
| DrugOOD-sbap-general-ec50-size | 66827 | 8867 | 286 | 27814 | 228 | 9195 | 301 | 9538 | 5 | 16147 | 20 | 13000 |
| DrugOOD-sbap-general-ki-assay | 264464 | 14083 | 3368 | 98880 | 3368 | 32029 | 3368 | 36227 | 2995 | 55701 | 5795 | 55710 |
| DrugOOD-sbap-general-ki-protein | 264464 | 14083 | 124 | 100249 | 124 | 33386 | 124 | 33528 | 164 | 55743 | 948 | 55641 |
| DrugOOD-sbap-general-ki-protein-family | 264464 | 14083 | 2 | 145756 | 2 | 48585 | 2 | 48588 | 12 | 35618 | ||
| DrugOOD-sbap-general-ki-scaffold | 264464 | 14083 | 21901 | 81854 | 6745 | 20026 | 38438 | 65253 | 8186 | 55786 | 3797 | 55628 |
| DrugOOD-sbap-general-ki-size | 264464 | 14083 | 206 | 104541 | 159 | 34782 | 233 | 35078 | 4 | 48850 | 22 | 55296 |
| DrugOOD-sbap-general-potency-assay | 40174 | 33094 | 13 | 26972 | 13 | 8987 | 13 | 9005 | 8 | 14494 | 138 | 13810 |
| DrugOOD-sbap-general-potency-protein | 40174 | 33094 | 12 | 26423 | 12 | 8804 | 12 | 8820 | 7 | 15582 | 52 | 13639 |
| DrugOOD-sbap-general-potency-protein-family | 42339 | 30929 | 1 | 31218 | 1 | 10406 | 1 | 10407 | 1 | 11240 | 7 | 9997 |
| DrugOOD-sbap-general-potency-scaffold | 40174 | 33094 | 7724 | 17648 | 1894 | 3333 | 17338 | 22980 | 4236 | 14728 | 2551 | 14579 |
| DrugOOD-sbap-general-potency-size | 40174 | 33094 | 53 | 26482 | 49 | 8813 | 65 | 8889 | 4 | 16820 | 18 | 12264 |
| Dataset | In-dist | Out-of-Dist | Gap |
| DrugOOD-lbap-core-ic50-assay | 89.62 (2.04) | 71.98 (0.29) | 17.64 |
| DrugOOD-lbap-core-ic50-scaffold | 87.15 (0.48) | 69.54 (0.52) | 17.60 |
| DrugOOD-lbap-core-ic50-size | 92.35 (0.15) | 67.48 (0.47) | 24.87 |
| DrugOOD-lbap-core-ec50-assay | 85.23 (0.41) | 70.30 (1.45) | 14.93 |
| DrugOOD-lbap-core-ec50-scaffold | 84.86 (0.27) | 68.07 (0.68) | 16.80 |
| DrugOOD-lbap-core-ec50-size | 91.47 (0.20) | 64.73 (0.55) | 26.74 |
| DrugOOD-lbap-core-ki-assay | 89.10 (3.28) | 76.63 (1.64) | 12.46 |
| DrugOOD-lbap-core-ki-scaffold | 83.53 (2.15) | 74.11 (2.37) | 9.42 |
| DrugOOD-lbap-core-ki-size | 94.73 (0.74) | 71.56 (2.07) | 23.17 |
| DrugOOD-lbap-core-potency-assay | 66.23 (0.50) | 53.26 (0.95) | 12.97 |
| DrugOOD-lbap-core-potency-scaffold | 61.83 (0.31) | 55.30 (0.72) | 6.53 |
| DrugOOD-lbap-core-potency-size | 67.30 (0.36) | 56.84 (1.35) | 10.46 |
| DrugOOD-lbap-refined-ic50-assay | 89.25 (0.64) | 72.70 (0.00) | 16.55 |
| DrugOOD-lbap-refined-ic50-scaffold | 86.23 (0.08) | 70.45 (0.54) | 15.78 |
| DrugOOD-lbap-refined-ic50-size | 91.31 (0.07) | 68.74 (0.37) | 22.58 |
| DrugOOD-lbap-refined-ec50-assay | 76.74 (0.50) | 71.05 (1.91) | 5.69 |
| DrugOOD-lbap-refined-ec50-scaffold | 81.10 (0.50) | 66.22 (0.34) | 14.89 |
| DrugOOD-lbap-refined-ec50-size | 87.67 (0.29) | 62.39 (0.70) | 25.28 |
| DrugOOD-lbap-refined-ki-assay | 90.52 (0.26) | 72.48 (1.39) | 18.04 |
| DrugOOD-lbap-refined-ki-scaffold | 82.89 (0.66) | 70.11 (2.10) | 12.79 |
| DrugOOD-lbap-refined-ki-size | 89.23 (1.23) | 72.44 (0.85) | 16.78 |
| DrugOOD-lbap-refined-potency-assay | 62.99 (0.23) | 58.88 (0.51) | 4.11 |
| DrugOOD-lbap-refined-potency-scaffold | 60.54 (0.14) | 56.00 (1.29) | 4.54 |
| DrugOOD-lbap-refined-potency-size | 64.94 (0.71) | 58.13 (0.49) | 6.81 |
| DrugOOD-lbap-general-ic50-assay | 85.19 (1.15) | 69.88 (0.13) | 15.32 |
| DrugOOD-lbap-general-ic50-scaffold | 85.15 (0.24) | 67.55 (0.09) | 17.60 |
| DrugOOD-lbap-general-ic50-size | 89.77 (0.08) | 66.05 (0.32) | 23.72 |
| DrugOOD-lbap-general-ec50-assay | 83.32 (0.60) | 69.55 (0.44) | 13.77 |
| DrugOOD-lbap-general-ec50-scaffold | 80.12 (0.44) | 63.66 (0.37) | 16.46 |
| DrugOOD-lbap-general-ec50-size | 86.22 (0.23) | 62.67 (0.47) | 23.55 |
| DrugOOD-lbap-general-ki-assay | 87.98 (1.34) | 74.54 (0.46) | 13.44 |
| DrugOOD-lbap-general-ki-scaffold | 81.05 (3.11) | 70.35 (0.83) | 10.69 |
| DrugOOD-lbap-general-ki-size | 89.51 (0.88) | 71.29 (0.94) | 18.22 |
| DrugOOD-lbap-general-potency-assay | 63.40 (0.39) | 56.38 (0.72) | 7.03 |
| DrugOOD-lbap-general-potency-scaffold | 61.56 (0.29) | 56.57 (0.42) | 4.99 |
| DrugOOD-lbap-general-potency-size | 65.15 (0.30) | 57.32 (0.54) | 7.83 |
| Dataset | In-dist | Out-of-Dist | Gap |
| DrugOOD-sbap-core-ic50-assay | 91.32 (0.40) | 71.04 (0.51) | 20.28 |
| DrugOOD-sbap-core-ic50-protein | 90.71 (0.29) | 68.87 (0.53) | 21.84 |
| DrugOOD-sbap-core-ic50-protein-family | 89.88 (1.44) | 72.20 (0.14) | 17.68 |
| DrugOOD-sbap-core-ic50-scaffold | 88.97 (0.13) | 70.73 (0.34) | 18.24 |
| DrugOOD-sbap-core-ic50-size | 92.83 (0.07) | 67.17 (0.16) | 25.66 |
| DrugOOD-sbap-core-ec50-assay | 87.57 (0.80) | 75.67 (1.34) | 11.89 |
| DrugOOD-sbap-core-ec50-protein | 87.21 (0.78) | 69.62 (4.45) | 17.59 |
| DrugOOD-sbap-core-ec50-protein-family | 92.67 (0.94) | 56.01 (3.03) | 36.66 |
| DrugOOD-sbap-core-ec50-scaffold | 87.60 (0.32) | 69.26 (1.20) | 18.34 |
| DrugOOD-sbap-core-ec50-size | 92.98 (0.30) | 63.99 (1.36) | 28.98 |
| DrugOOD-sbap-core-ki-assay | 88.34 (4.18) | 63.17 (2.46) | 25.16 |
| DrugOOD-sbap-core-ki-protein | 85.05 (4.48) | 64.89 (1.95) | 20.16 |
| DrugOOD-sbap-core-ki-scaffold | 85.96 (1.10) | 70.03 (2.90) | 15.93 |
| DrugOOD-sbap-core-ki-size | 92.76 (0.18) | 69.68 (1.13) | 23.09 |
| DrugOOD-sbap-core-potency-assay | 70.22 (0.24) | 51.39 (0.45) | 18.83 |
| DrugOOD-sbap-core-potency-protein | 70.72 (0.48) | 54.62 (0.57) | 16.10 |
| DrugOOD-sbap-core-potency-protein-family | 62.60 (3.47) | 49.83 (1.99) | 12.77 |
| DrugOOD-sbap-core-potency-scaffold | 63.36 (0.55) | 56.87 (0.53) | 6.49 |
| DrugOOD-sbap-core-potency-size | 66.94 (0.37) | 58.36 (0.23) | 8.59 |
| DrugOOD-sbap-refined-ic50-assay | 88.07 (1.48) | 69.21 (0.29) | 18.86 |
| DrugOOD-sbap-refined-ic50-protein | 86.87 (1.41) | 69.51 (0.30) | 17.36 |
| DrugOOD-sbap-refined-ic50-protein-family | 86.44 (3.07) | 70.61 (0.42) | 15.82 |
| DrugOOD-sbap-refined-ic50-scaffold | 87.16 (0.08) | 70.10 (0.52) | 17.06 |
| DrugOOD-sbap-refined-ic50-size | 90.22 (0.11) | 65.23 (0.26) | 24.99 |
| DrugOOD-sbap-refined-ec50-assay | 80.60 (1.69) | 70.38 (1.38) | 10.22 |
| DrugOOD-sbap-refined-ec50-protein | 81.62 (1.16) | 73.45 (1.67) | 8.17 |
| DrugOOD-sbap-refined-ec50-protein-family | 83.09 (0.73) | 68.81 (1.62) | 14.27 |
| DrugOOD-sbap-refined-ec50-scaffold | 82.44 (0.19) | 68.45 (0.28) | 13.99 |
| DrugOOD-sbap-refined-ec50-size | 87.20 (0.04) | 64.56 (0.51) | 22.64 |
| DrugOOD-sbap-refined-ki-assay | 96.35 (0.56) | 68.00 (1.73) | 28.35 |
| DrugOOD-sbap-refined-ki-protein | 94.22 (0.48) | 77.77 (0.60) | 16.46 |
| DrugOOD-sbap-refined-ki-scaffold | 88.27 (0.88) | 59.81 (1.04) | 28.46 |
| DrugOOD-sbap-refined-ki-size | 91.56 (0.41) | 61.64 (2.41) | 29.92 |
| DrugOOD-sbap-refined-potency-assay | 64.65 (0.11) | 54.66 (0.79) | 9.99 |
| DrugOOD-sbap-refined-potency-protein | 65.46 (0.42) | 53.14 (0.35) | 12.32 |
| DrugOOD-sbap-refined-potency-protein-family | 64.76 (0.88) | 53.75 (0.82) | 11.01 |
| DrugOOD-sbap-refined-potency-scaffold | 61.90 (0.28) | 55.05 (0.40) | 6.85 |
| DrugOOD-sbap-refined-potency-size | 64.64 (0.65) | 55.79 (0.26) | 8.85 |
| DrugOOD-sbap-general-ic50-assay | 87.85 (1.47) | 68.61 (0.54) | 19.24 |
| DrugOOD-sbap-general-ic50-protein | 85.34 (1.67) | 68.48 (0.27) | 16.86 |
| DrugOOD-sbap-general-ic50-protein-family | 79.18 (2.69) | 68.60 (0.68) | 10.58 |
| DrugOOD-sbap-general-ic50-scaffold | 84.33 (0.67) | 67.49 (0.33) | 16.84 |
| DrugOOD-sbap-general-ic50-size | 87.81 (0.23) | 65.34 (0.38) | 22.47 |
| DrugOOD-sbap-general-ec50-assay | 84.66 (1.32) | 69.83 (0.54) | 14.82 |
| DrugOOD-sbap-general-ec50-protein | 82.10 (0.51) | 70.16 (0.29) | 11.94 |
| DrugOOD-sbap-general-ec50-protein-family | 83.69 (1.74) | 63.76 (1.05) | 19.93 |
| DrugOOD-sbap-general-ec50-scaffold | 82.97 (0.51) | 67.95 (0.27) | 15.01 |
| DrugOOD-sbap-general-ec50-size | 87.98 (0.42) | 65.64 (0.35) | 22.33 |
| DrugOOD-sbap-general-ki-assay | 94.15 (0.31) | 72.05 (0.49) | 22.10 |
| DrugOOD-sbap-general-ki-protein | 90.72 (0.14) | 74.41 (0.25) | 16.31 |
| DrugOOD-sbap-general-ki-scaffold | 87.09 (0.34) | 67.36 (1.52) | 19.73 |
| DrugOOD-sbap-general-ki-size | 91.10 (0.26) | 65.93 (1.13) | 25.17 |
| DrugOOD-sbap-general-potency-assay | 65.68 (0.17) | 53.31 (0.32) | 12.36 |
| DrugOOD-sbap-general-potency-protein | 64.83 (0.77) | 53.35 (0.33) | 11.48 |
| DrugOOD-sbap-general-potency-protein-family | 61.28 (0.87) | 55.46 (1.24) | 5.82 |
| DrugOOD-sbap-general-potency-scaffold | 61.91 (0.84) | 56.02 (0.27) | 5.89 |
| DrugOOD-sbap-general-potency-size | 65.80 (0.13) | 55.33 (0.38) | 10.47 |