Reputation analysis of news sources in Twitter: Particular case of Spanish presidential election in 2019
Abstract
Fake news are affecting a large proportion of the population even becoming a danger to the society. Mostly, this disinformation flow take place through Internet. Being aware of that problem, in this work we propose a synthetic indicator that measures the user reputation in Twitter in order to analyze the credibility of the content in this social network. In order to show the indicator utility, we have analyzed data from some political topics in Spain from 2019 to 2020 and we have checked that bots plays a decisive role into the spread of news and, as might be expected, the link among popularity and reputation reports about the event credibility.
Keywords Reputation Twitter Spain Graph Indicators
1 Introduction
Reputation is understood as the opinion that people in general have about someone or something, or how much respect or admiration someone or something receives, based on past behaviour or character. It is obvious that such term is subjective and it can vary depending on the concept, society or culture. In this paper, we want to focus on Online Social Networks (OSN) in which fake news can play a key role due to the duality of misinformation and trustworthiness. Possibly, the most evident case of propaganda in social networks and monetary interests, is the case of Cambridge Analytica founded in 2003 and forced to break up in 2018 due to the scandal of Brexit and the USA campaign both in 2016. Nowadays, with the raise of the technologies 4.0, false information is taking over every digital platform. Moreover, modern artificial intelligence techniques can be applied in relevant networks as Facebook and Twitter in order to mislead users and create hoaxes and spread them so fast. In regard of the accounts, we would like to highlight the role of bots, that is to say, accounts digitally created and monitored that create, disseminate and lend credibility to fake news.
2 Related work
The study of social media content has been faced from different approaches, in which we can distinguish: User reputation (Castillo et al. 2011; Alrubaian et al. 2017), Content credibility (Yang et al. 2019), Timeline rank (Bhowmick et al. 2019), and Fake news detection (Gao et al. 2018).
In this paper we have followed the user reputation framework based on our last work (López-García 2019). Now, our goal is to generate a set of indicators that, all together, can measure the reputation of a Twitter account. To this effect, we have tracked and analyzed Twitter content related with the Spanish presidential election conducted in November 2019, from 1/9/2019 to 1/2/2020.
3 Methodology
We have developed various tools from the different sources mentioned in section 2, hence we split this section in order to clarify the methods implemented. The novelty designed is focused on the subsection 3.3 and the other subsections have been detailed to understand not only the definition of our indicator but the perspective as well.
3.1 Graph analysis
Twitter’s structure allows us to relation the users with a graph , in which denotes the vertices (accounts) and the relationships (edges). We manage such links depending upon the problem, in any case the vertices are the accounts. For users approach, we represent the graph as in which describes the friends-follower relation. For tweets approach, we denote as the tree graph with the timeline of the event, so each vertex represent the tweet-retweet messages. In both cases, we can mathematically formulate definitions, metrics and functions to describe the behaviour in Twitter.
Definition 1
Let and be two accounts in a set of vertices , we name:
- •
Path: Each -tuple defined in that connects two vertices, i.e., where with and and .
- •
Adjacency matrix: Given a graph , the adjacency matrix associated is the binary matrix in which their values are if and otherwise.
- •
Cardinality: It is the total amount of elements in a set. Given a set , such application is denoted as .
Definition 2 (Node scores)
Let and be two accounts in a set of vertices , we assume that our graph is finite, so has a finite number of elements :
- i.
Distance: Minimal path that joins two nodes, .
- ii.
Diagonal: Maximal from one node to another, .
- iii.
Node degree: , being and the input and output degree respectively whose definition is:
- iv.
Closeness: .
- v.
Betweenness: , where is the number of shorter paths in from to according to the distance and is the same than but containing the vertex.
- vi.
PageRank: , being , the unit vector at positon, and defined as
(1)
3.2 Bot scores
In order to spot the fake accounts, it is essential to determine an indicator based on the probability to be a bot. Hence, we need to deploy a set of indicators that complement such idea. With the same approach as (Davis et al. 2016), we have considered five different indicators which are: User (), Sentiment (), Content (), Temporality (), and Bot (). Being more specific with the bot feature, Table 1 has the tag-scale of the accounts in regard of such variable.
| Tag | Scale |
|---|---|
| Bot | |
| Doubtful | |
| Medium | |
| Real |
3.3 Reputation scores
The aim of classifying the accounts as reputed is the filtered of Twitter content. The underlying idea of the proposed indicator rely on human behaviour in the network. Our proposal is based on the use of a synthetic indicator that measures and describes the reputation of each individual. Such indicator depends on both active and passive participation in the network. Let be a Twitter account with network divided as friends and followers users (Input/Output relationship) and its account features, we define:
- •
Active reputation
(2) - •
Passive reputation
(3) - •
Total reputation
(4)
The parameters and define a linear convex combination between the reputation of the different nets. The parameter works similarly between and . These parameters allow us to modelize Eq.4 by following the graph structure defined in 3.1 and describing the notion in 3.2. Since we will emphasize with the relation of user content and its reputation, Table 2 shows the scales that we have considered.
| Tag | Scale |
|---|---|
| Non-reputed | |
| Doubtful | |
| Trustworthy | |
| Reputed |
3.4 Data
The data has been obtained through the Twitter API since 1/9/2019 to 1/2/2020 because the political campaigns started on September. On the one hand, we have collected data via R with the use of the Rtweet package (Kearney 2019). On the other hand, the account features have been computed with the Botometer Python package (Davis 2019), in which it is necessary to have a RapidAPI key as interface. For a better understanding of the methods that has been mentioned, the reader can check our GitHub repository https://github.com/Aaron-AALG/Analisis-de-la-reputacion-en-Twitter.
4 Results
We want to study the Spanish presidential election that was conducted on October 10 of 2019. With this aim, we have selected five random accounts that can be labeled as bots according to our criteria (Table 1) and the five main parties in Spain in those days. For an in depth research, we have analyzed the account features, relationships graph and messages graph.
4.1 Features analysis
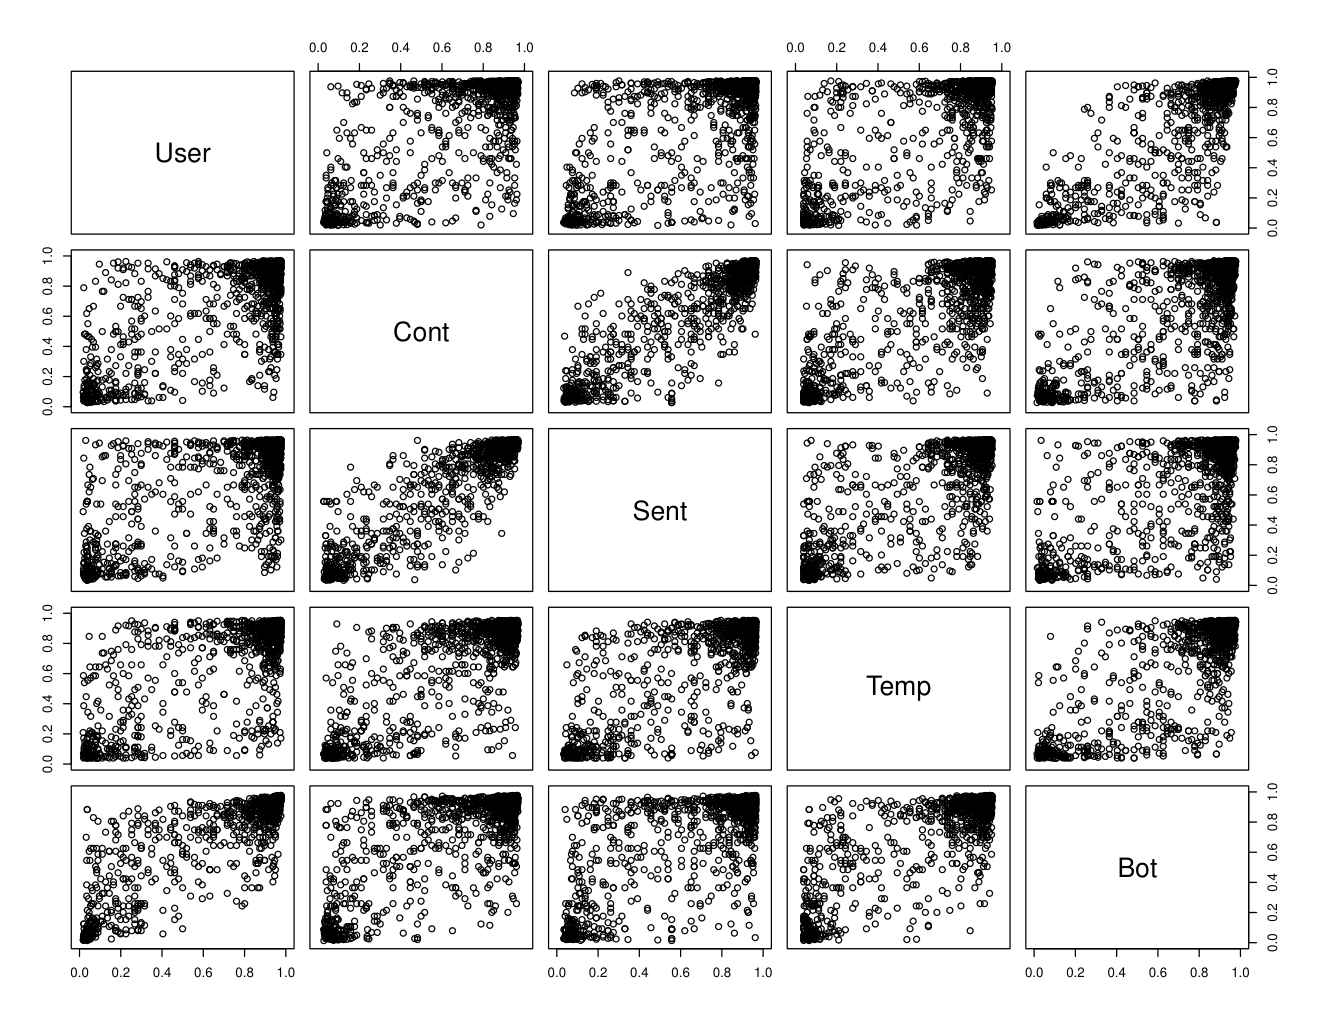
When studying the resemblance among the selected features, we can detect in subfigure 1(a) a pair wise direct relation in the neighborhoods of and . That is why subfigure 1(b) only has positive values. In any case, the figure 1 depicts the inner similarities.
4.2 Accounts graph
Since the flux of information goes through the net with clear input-output direction, we can study the difference between the friends and following users per each account. Figure 2 depicts both nets, showing an evident gap between and . Moreover, the sample selected has accounts very distinguished and so it is demonstrated in subfigures 2(a) and 2(b).
The proposed reputation indicators have been computed by fixing , , and as expert decision adequate to the Twitter data. Thus, it is easy to understand that we have given special attention to the account activity within the network because we consider that passive activity is harder to manage in terms of user maintenance. Regarding account connections, we have decided to add a higher weight to the friends net since the graph designed of Twitter sends the information from friends towards followers.
In order to check detailed information about each account, tables 3 and 4 contains the values returned per each category. For comparisons among two groups (Bots and Parties), figure 3 contains the reputation vectors as a bar plot. Then, we can illustrate the same distribution of values per each group.
| Account | User | Cont | Sent | Temp | Bot | |
|---|---|---|---|---|---|---|
| Bot_5 | 0.02 | 0.04 | 0.13 | 0.04 | 0.02 | 0.04 |
| Bot_4 | 0.04 | 0.13 | 0.06 | 0.09 | 0.02 | 0.05 |
| Bot_2 | 0.04 | 0.30 | 0.05 | 0.09 | 0.02 | 0.06 |
| Bot_3 | 0.03 | 0.10 | 0.15 | 0.07 | 0.04 | 0.06 |
| Bot_1 | 0.04 | 0.29 | 0.87 | 0.09 | 0.02 | 0.11 |
| CiudadanosCs | 0.93 | 0.96 | 0.95 | 0.87 | 0.86 | 0.91 |
| PODEMOS | 0.97 | 0.93 | 0.95 | 0.87 | 0.96 | 0.94 |
| PSOE | 0.94 | 0.97 | 0.96 | 0.91 | 0.92 | 0.94 |
| populares | 0.97 | 0.93 | 0.95 | 0.94 | 0.95 | 0.95 |
| vox_es | 0.98 | 0.95 | 0.95 | 0.93 | 0.97 | 0.96 |
| Account | |||||
|---|---|---|---|---|---|
| Bot_5 | 0.0384 | 0.4885 | 0.7702 | 0.6998 | 0.2368 |
| Bot_4 | 0.0542 | 0.5001 | 0.7961 | 0.7221 | 0.2545 |
| Bot_3 | 0.0639 | 0.2399 | 0.8656 | 0.7092 | 0.2575 |
| Bot_2 | 0.0606 | 0.2960 | 0.9067 | 0.7540 | 0.2686 |
| Bot_1 | 0.1118 | 0.3423 | 0.8862 | 0.7502 | 0.3033 |
| CiudadanosCs | 0.9130 | 0.2837 | 0.7775 | 0.6540 | 0.8353 |
| PSOE | 0.9381 | 0.3513 | 0.7108 | 0.6209 | 0.8429 |
| PODEMOS | 0.9362 | 0.3352 | 0.8189 | 0.6980 | 0.8648 |
| vox_es | 0.9561 | 0.3465 | 0.7673 | 0.6621 | 0.8679 |
| populares | 0.9481 | 0.3158 | 0.8446 | 0.7124 | 0.8774 |
4.3 Messages graph
The tree structure in a Twitter’s timeline define its directions and its temporal apparition. One of the most controversial trends during the Spanish campaign was the SanchezDimisión hashtag. Figure 4 shows a detailed explanation of the graph created at the time in which it is captured the temporal evolution together with the bot score and active reputation. Here the graph is based, where vertices represent the tweets posted by accounts. The definitions of the subsection 3.1 are used for in depth study of centrality and intermediation among users or tweets.

5 Conclusions
The main goal of this paper is to propose a synthetic indicator that measures the reputation of Twitter accounts in order to analyze the information flow and spot malicious spreaders. With the results extracted from the social media, we can make decisions in uncertain scenarios.
In respect of the apparition, tracking, and behaviour of bots; we have shown that there exists a large number of fake accounts in the studied net. The tactic of bots is clear, they follow each other in order to gain centrality within graphs (either user or tweet based). It is worth mention that the definition of bot is stated in table 1, hence such classification is biased in regard of our criteria.
Regarding the proposed indicators, our approach suitably reflects the concept of fake-real account. For the selected sample, the maximal active reputation () for bots is and for verified political parties the minimal is , exposing significant evidences of the precision of our concept of reputation. Another interesting point is that bots have higher values for the passive reputation (), especially for the friends net. We already expected that because their strategy is to be as close as possible to relevant accounts and events. Anyway, it is shown in figure 2 for the bot category box. For total reputation (), we can see that the maximal total reputation for bots is and for verified political parties the minimal is , giving a lower range than active reputation. That is crucial and it is well designed with our approach since we have followed the idea that every account must control both their activity and the net in which it is involved.
So far we have not encountered temporal disorders in our samples. For instance, the activity showed in figure 4, is regularly distributed over the time and there is not too much publications between 00:00 and 6:00. Sometimes it is studied when there exists evidences of external influence over a topic.
Finally, we can conclude by saying that the Spanish presidential election on November of 2019 was partially adulterated by the presence of fake accounts and non reputed users in Twitter. For the case before mentioned in subsection 4.3, the last row of the figure 4 indicates that the timeline of SanchezDimisión contains at least of bot accounts and of non-reputed users. Another evidence, slightly documented, is that bots are more likely to share content ( more) than create it. Therefore, their main role is to spread content.
References
- Castillo et al. [2011] Carlos Castillo, Marcelo Mendoza, and Barbara Poblete. Information credibility on twitter. WWW 2011 – Session: Information Credibility, pages 675–684, 6 2011.
- Alrubaian et al. [2017] Majed Alrubaian, Muhammad Al-Qurishi, Mabrook Al-Rakhami, Mohammad Mehedi Hassan, and Atif Alamri. Reputation-based credibility analysis of twitter social network users. Concurrency and Computation: Practice and Experience, 29, 4 2017. ISSN 15320634. doi:10.1002/cpe.3873.
- Yang et al. [2019] Jingchao Yang, Manzhu Yu, Han Qin, Mingyue Lu, and Chaowei Yang. A twitter data credibility framework—hurricane harvey as a use case. ISPRS International Journal of Geo-Information, 8, 3 2019. ISSN 22209964. doi:10.3390/ijgi8030111.
- Bhowmick et al. [2019] Ayan Kumar Bhowmick, Martin Gueuning, Jean Charles Delvenne, Renaud Lambiotte, and Bivas Mitra. Temporal sequence of retweets help to detect influential nodes in social networks. IEEE Transactions on Computational Social Systems, 6:441–455, 6 2019. ISSN 2329924X. doi:10.1109/TCSS.2019.2907553.
- Gao et al. [2018] Wei Gao, Kam-Fai Wong, Jing ; Ma, Wei ; Gao, and Jing Ma. Rumor detection on twitter with tree-structured recursive neural networks. Proceedings of the 56th Annual Meeting of the Association for Computational Linguistics (ACL 2018), pages 1980–1989, 2018. URL https://ink.library.smu.edu.sg/sis_research.
- López-García [2019] Aarón López-García. Análisis de la reputación en Twitter, 2019. URL https://github.com/Aaron-AALG/Analisis-de-la-reputacion-en-Twitter. Master’s Thesis.
- Davis et al. [2016] Clayton A. Davis, Onur Varol, Emilio Ferrara, Alessandro Flammini, and Filippo Menczer. Botornot: A system to evaluate social bots. CoRR, abs/1602.00975, 2016. URL http://arxiv.org/abs/1602.00975.
- Kearney [2019] Michael W. Kearney. rtweet: Collecting Twitter Data, 2019. R package version 0.6.9. https://cran.r-project.org/package=rtweet.
- Davis [2019] Clayton A. Davis. Botometer Python API, 2019. URL https://github.com/IUNetSci/botometer-python. A Python API for Botometer by OSoMe.