Development of slurry targets for high repetition-rate XFEL experimentsJournal: ArXiv.org
\vskip-12.0pt
Combining an x-ray free electron laser (XFEL) with high power laser drivers enables the study of phase transitions, equation-of-state, grain growth, strength, and transformation pathways as a function of pressure to 100’s GPa along different thermodynamic compression paths. Future high-repetition rate laser operation will enable data to be accumulated at 1 Hz which poses a number of experimental challenges including the need to rapidly replenish the target. Here, we present a combined shock-compression and X-ray diffraction study on vol% epoxy(50)-crystalline grains(50) (slurry) targets, which can be fashioned into extruded ribbons for high repetition-rate operation. For shock-loaded NaCl-slurry samples, we observe pressure, density and temperature states within the embedded NaCl grains consistent with observations for shock-compressed single-crystal NaCl.
I Introduction
The use of XFEL sources, which deliver high-flux X-ray pulses (1012-1013 photons at 6-25 keV over 50-fs) within a narrow photon-energy bandwidth (E/E 210-3), has been transformative for the study of dynamic material properties and high energy density (HED) science (47). Combined with high power laser drivers, this has allowed for measurements previously thought possible only when performed under static compression and integrated in time, including complex crystallography (13, 25, 26, 8, 60, 30), precise spectroscopy (61), and high-resolution imaging (55, 48, 10) in single-shot dynamic compression experiments.
Existing laser drivers at XFELs can shoot every five minutes (11). This implies a need for 100 targets per day, and target fabrication methods have been developed to meet target needs over a five day run. This large data collection capacity has revolutionized the way that high-quality dynamic experiments are done; instead of an experimental campaign spanning months or years at large laser facilities, XFEL HED science campaigns may collect sufficient data in a single day.
The commissioning of the DiPOLE laser at the High Energy Density instrument at the European XFEL (EuXFEL) (100 J in 15 ns, 10 Hz) (37, 63) will usher in a new era of experiments requiring the delivery of up to 9000 targets over a 15-minute run. High repetition-rate experiments which combine rapidly adjustable laser pulse shaping with replenishable targets, will allow for high-speed scanning of material properties over large regions of sample pressure-temperature space. These capabilities will also allow experimental data to be integrated over long periods of time (many thousands of shots), which will dramatically increase the signal-to-noise over standard single-shot experiments. This will be of particular importance to low signal phenomena such as liquid diffraction, extended x-ray absorption fine structure (EXAFS) measurements, and scattering off low-Z or low-symmetry materials.
There are three major challenges to overcome for rep-rate experiments: target construction and positioning, data collection and processing, and debris and heat load removal (52, 50). To address the requirement for rapid target replenishment it has been proposed to use simple tape targets mounted on a cassette and spooling at 3-5 cm/s (52). This equates to 30-50 m of tape per 15-minute run. However, the nature of this design requires initial target ductility and so precludes the study of a whole class of brittle ceramics materials. In addition, the production of extended ribbon targets will produce samples with a characteristic micro-structural texture and an x-ray texture pattern which may be challenging for Rietveld refinement analysis, and consequently for determination of phase fraction (58, 26).
Here we describe the manufacturing and testing of epoxy-sample mixtures or slurry targets for use in high-repetition rate experiments on XFEL facilities. Slurry target designs can produce x-ray diffraction powder patterns for brittle materials, and can be fashioned into extended ribbons for use in high-repetition rate cassette-spool target designs. A complete description of the sample preparation is given in Appendix A and is briefly described here. In our slurry targets the material of interest is ground in a mortar and pestle and the resultant powder is sieved through a mesh to ensure individual grain sizes are less than 1-m. This powder is then thoroughly mixed with Stycast 1266 epoxy in a ratio to obtain a 50% volume packing and a random distribution of grains. Large area sheets of slurry material are then formed between polyimide and teflon sheets at the uniform thickness needed for laser-shock experiments (30-m) by processing through rollers with precision separation.
I.1 Continuum studies of shock-compressed mixtures
There have been extensive studies spanning several decades aimed at determining the continuum response of mixtures (19, 45, 32, 31, 43, 5, 4, 62, 51, 42, 56) – and epoxy-sample slurry (43, 4, 56, 5, 62, 51, 42) in particular – under an applied shock, in terms of the aggregate stress-strain response (43, 4, 56, 51, 28, 42, 5), the influence of particulate size, packing and distribution (4, 42), direct imaging of particulate flow (5), and the partitioning of energy states within the constituent materials (31). A brief overview of these studies is presented here.
For a random distribution of grains suspended within a cohesive epoxy matrix, and subject to an applied instantaneous shock front, there are a number of physical processes which can modify the thermodynamic compression path (4). At low pressures the “shock" rise time can be broadened by the viscoelastic response of the epoxy (62). If the shock front thickness is comparable to the grain size, the compression of the grain will be isentropic in nature (31). At increasing stress levels, however, the rise-time of the shock wave decreases in a manner consistent with full-density metals (62, 57) and the shock front thickness becomes small relative to the grain size. Here, as the shock enters an individual grain there is an instantaneous state reached along the Hugoniot which is dependent on the epoxy-sample impedance difference. This is followed by multiple inter- and intra-grain wave reverberations until a steady compression state is reached (Fig. 1). Experimentally this has been observed in transmitted velocity profiles as a sharp rise (due to the shock), followed by a rounded push to a peak pressure state (due to reverberations), over a time period which is dependent on the epoxy-sample impedance-mismatch, the inter-grain compression-wave round trip time, and the granular packing fraction (5, 4, 62). Wave reverberations are accompanied by the relative motion of the sample grains and the epoxy matrix (5), where the shear strength of the components can affect the evolving grain distribution (average slurry density). For high packing fractions inter-grain interactions may also need to be considered in a comprehensive model description of the states generated. At cessation of the applied shock, the resulting pressure release wave has been observed to be unexpectedly fast compared to the release wave velocity from full density samples (62).

While the timescale for epoxy-sample pressure equilibrium is relatively fast and can be constrained by transmitted wave profile measurements, the timescale for temperature equilibrium is longer and difficult to constrain. Indeed, partitioning of energy between the individual phases is not well understood (31). The temperature states reached (epoxy vs sample) are initially dependent on the individual equations-of-state (EOS) but at later times are also dependent on the thermal conductivities of the constituent materials – i.e. the heat flow between the sample and epoxy. In full density samples, inertial confinement conditions and material strength may combine to increase sample temperature due to work heating (7). In slurry samples, lateral expansion of grains into the compressible epoxy is possible which may reduce the levels of work heating. We note that diamond-slurry samples were recently used in X-ray diffraction experiments on the National Ignition Facility for laser ramp-compression to 2 TPa, with the goal at reducing sample temperatures at these extreme levels of compression (33).
For many material-epoxy composites the material states generated by an applied shock has been determined through shock-velocity () – particle velocity () measurements (62, 42, 5), and models have been developed which give good qualitative agreement to measured data (62, 28, 51, 42). However, these data and models provide information only on the aggregate response. To qualify the use of slurry targets for future high-repetition rate XFEL target designs it is important obtain an understanding on the compression state within the embedded granular material in terms of density () and temperature () as a function of pressure ().
Here, we describe combined laser-shock and X-ray diffraction (XRD) measurements on the Matter in Extreme Conditions (MEC) endstation at the Stanford LCLS XFEL, which provide a direct measure of granular density and crystal structure as a function of increasing shock pressure (25, 26). Temperature in the sample is constrained by comparing crystal structure evolution as a function of sample density with recent similar data from full-density samples (53). Within the accuracy of our data, we find good agreement with the -- states generated within NaCl-slurry samples, with those from single crystal NaCl [100] samples.
II Experiments
In these experiments we combine laser-shock compression of a vol% epoxy(50):NaCl(50) sample with in situ XRD to measure the crystal structure evolution as a function of compression (measured density).
NaCl is an ionic solid of significant interest for high-pressure science, geoscience, and dynamic compression. It is widely used as a pressure standard and insulating material in diamond anvil cell experiments and there has been much effort devoted to studying it’s strength (39, 64, 40), equation of state (21, 17, 3, 9, 22) and phase transitions (23, 49, 34, 54, 6, 1, 35, 36). At room temperature NaCl undergoes a transition from the B1 rocksalt structure (space group = Fmm) to the B2 cesium chloride structure (space group = Pmm) at about 25 GPa. The B1-B2 transition is of fundamental interest in Earth science as it is exhibited by oxides such as CaO and MgO at much higher pressure (14, 29). In NaCl, the B1-B2 transition has been extensively studied by static (49, 54, 34, 6, 1, 35) and dynamic techniques (23, 36). Recent combined XRD-laser shock studies at MEC-LCLS on NaCl [100] single crystal samples (53) have observed transformation into the B2 phase at 28(2) GPa, B2-liquid coexistence between 54(4) – 66(6) GPa, with near full melt at 66(6) GPa. The states generated over nanosecond laser compression timescales where found to be in agreement with measurements under static compression at ten orders of magnitude lower compression rate, consistent with equilibrium conditions being achieved under laser shock conditions (53).
II.1 Experimental Setup
The target assembly, as illustrated in Fig. 2a, consists of a 50 m polyimide [C22H10N2O5] ablator layer adhered directly onto a 30 m-thick NaCl-slurry target and, for some shots, a LiF window for velocimetry measurements (Fig. 2b). A 0.1-m coating of Al was applied to the LiF to enhance target reflectivity.


The front surface of the polyimide was positioned within the focal plane of four laser beams which delivered a combined energy of up to 80 J at 527-nm in a 15-ns flat-top pulse within a 300 m diameter focal spot. Laser energy absorbed by the polyimide ablator causes it to ablate and expand rapidly. The momentum transfer from this process causes a shock wave, with an initial 15-ns pulse duration, to propagate through the target assembly. The pressure in the sample and the temporal steadiness of the compression wave are controlled by varying the total laser power and laser pulse shaping, respectively (11). An example laser pulse shape is shown in Fig. 2a. A line-imaging velocity interferometer (VISAR) was used to accurately determine the shock arrival time at the slurry free-surface or slurry/LiF interface velocity (12). In the experiments where a LiF window was used, the VISAR recorded the slurry/LiF particle velocity history (), which was used to constrain the sample pressure during the x-ray probe period.
The 50-fs output of the LCLS-XFEL at 14.5-keV was incident onto the target during shock transit within the slurry layer, at normal incidence, in a 50-m spot centered on the laser drive. The X-ray beam pointing and timing, relative to the laser-shock drive, is known to a few m’s and 100-ps by measuring localized changes in VISAR reflectivity and fringe position, due to the transient change in refractive index of the LiF window caused by charge carrier generation by the x-ray pulse (53). X-rays scattered from the compressed slurry sample were recorded in transmission geometry on several ePix detectors (18). The angular position of the detectors in 2– space was accurately determined by diffraction patterns from ambient pressure Lab6 and CeO2 standards, where 2 is the diffraction angle and is the azimuthal angle around the incident x-ray beam (60).
III Results
Raw X-ray diffraction data obtained under shock compression, and projected into linear 2– angular space, is shown, for a subset of the ePix detectors, in Fig. 3a. The location of diffraction peaks in 2 permits determination of atomic lattice d-spacing, through Bragg’s law, and the calculation of sample density. X-rays are timed to probe the sample during shock transit within the NaCl-slurry layer, and therefore, the recorded diffraction pattern, which is volume-integrated, represents contributions from the shocked, and unshocked regions of the slurry sample. Ahead of the shock front, diffraction from the uncompressed NaCl grains ( = 2.16 g/cm3) – embedded within the epoxy ( = 1.12 g/cm3) – produces a number of sharp ambient pressure peaks associated with the B1 structure (Fig. 3a). The extent of intensity uniformity in is function of the number of randomly orientated NaCl grains within the volume defined by the 50 m diameter X-ray beam and the thickness of the uncompressed slurry sample. Azimuthal intensity variations are due to a non-ideal distribution of grains within the X-ray probe volume. This has also been observed in our XRD measurements on shock-compressed Al2O3- and MgSiO3-slurry samples (see Supplementary Materials Fig. S1). We note that although our samples were thoroughly mixed, we did not carry out a statistical analysis of the grain distribution. This can be improved for future experiments. A larger X-ray spot, with a more even grain distribution, and/or smaller grains, would produce more powder-like peaks. We also note that while the starting slurry thickness was 30-m, the region of uncompressed slurry contributing to the diffraction peaks is 15-m-thick. For future high-repetition rate operation where the XRD data is integrated over many shots to enhance signal-to-noise, this azimuthal intensity variation is expected to smooth out to produce a powder pattern suitable for Rietveld refinement analysis (58, 26).
Shown in Fig. 3b are a series of -integrated intensity profiles (over all ePix detectors) for different shots taken as a function of increasing laser energy (increasing shock pressure). At low levels of compression ( = 2.81 g/cm3) we observe broad peaks of the compressed B1 structure. We observe similar peak broadening in Al2O3 and MgSiO3 slurry samples (Supplementary Materials Fig. S1). Peak broadening under shock compression is generally attributed to grain-size reduction due to plastic/brittle deformation (41, 27). An additional contributor to peak broadening is the distribution of pressure states within the sample (see Fig. 4). At higher compression (shot# r265, 3.123.32 g/cm3), we observe diffraction peaks consistent with a mixed B1+B2 phase assemblage.
For = 3.423.59 g/cm3 only compressed B2 is observed. While not shown in Fig. 3, we note that at late times, and along a pressure release path from an initially compressed state within the B2 phase, we observe the reverse B2B1 transition.
For = 3.593.90 g/cm3 a mixed B2+liquid assemblage is observed. Increased compression over this density range results in a diminished intensity of the B2 peaks, and an increased broad background intensity from liquid diffraction. This is consistent with the expected phase evolution as the Hugoniot crosses the melt line (24, 53).
IV Discussion
IV.1 Pressure Determination
Constraints of sample pressure in laser-shock experiments typically rely on measurements of the sample/LiF interface velocity, and standard impedance-matching techniques. This approach requires an knowledge of the - Hugoniot relations for both the sample and LIF window. While there have been extensive experimental and theoretical studies aimed at determining the continuum response of exoxy-sample mixtures under an applied shock load (62, 42, 5, 28, 51), the determined Hugoniots represent the average bulk response and therefore do not give direct information on local granular density states. However, due to the multiple wave reverberations in the slurry sample (Fig. 1), sample-epoxy pressure equilibrium is expected to be rapidly obtained, and impedance-matching can then be used to constrain the sample pressure.
A review of different theoretical models for determining the composite Hugoniot response for mixtures is given in Ref. (51). The models all assume that the internal energy and density of the mixture must be related to the weighted sum of the individual component properties. Here we consider the simplest of those models - which assumes that the mixture is under pressure equilibrium and that an equilibrium material velocity of the mixture can be determined by averaging the material velocities on the individual component Hugoniots according to a velocity based mixture rule (51). Applying this approach the vol% epoxy(50):NaCl(50) slurry used in our experiments, the mixture velocity is obtained for a given pressure from the following relation,
| (1) |
where NaCl and Epoxy are the particle velocities for the NaCl and epoxy components, respectively, at a given pressure on their respective individual Hugoniots. represents the mass fraction of individual components. For the vol% epoxy(50):NaCl(50) slurry, = 0.66. This expression is shown to give a good representation of slurry target Hugoniot relations in many composite materials materials (see Supplementary Materials Fig. S2 and Ref. (51)).
In Fig. 4 the - curves for LiF, NaCl and epoxy are shown along with the calculated composite response of the vol% epoxy(50):NaCl(50) slurry based on Eqn. 1. Using the measured slurry-LiF particle velocity (e.g. Fig. 2b and inset to Fig. 4), and standard impedance matching, the pressure in the NaCl grains may be determined.
In Fig. 5 previously reported pressure-density Hugoniot values for single crystal NaCl (open squares, colored open circles) are plotted alongside values obtained from the current NaCl-slurry study (colored filed circles). For the majority of the NaCl-slurry shots no LiF window was used, and therefore a pressure determination based on impedance matching (as in Fig. 4) was not possible. For these shots the measured density values were fixed to the pressures determined from the full-density NaCl Hugoniot measurements (36). For two slurry shots LiF windows were used and pressure was determined though impedance matching (white crossed symbols in Fig. 5). These pressure-density points are in in good agreement with previous XRD measurements on single crystal NaCl samples (53).
We note that in the model depicted in Fig. 1, the final steady-state crystalline-sample density – along the combined shock + reverberation path – is expected to be higher than the Hugoniot at an equivalent pressure. However, within the accuracy of our measurements this is effect is not apparent.
IV.2 Temperature Determination
While we don’t get any direct temperature measurement from our data, we can compare with previous data on NaCl single crystals (53) to constrain the temperature evolution of the NaCl slurry grains as a function of pressure. The inset to Fig. 5 shows the - diagram for NaCl with stability regions for B1, B2 and liquid, as defined by static compression data (gray circles (6, 49, 1, 34)). Also plotted is the model Hugoniot and estimated shock temperatures from a recent shock compression study from single crystal NaCl samples (colored open circles (53)). Along the Hugoniot NaCl transforms from B1B2 at 1200K and melt initiates at 3000K. The consistency of phase evolution with compression between the NaCl-slurry data and NaCl single crystal data (Fig. 5) indicates a comparable thermodynamic compression path.
V Conclusions
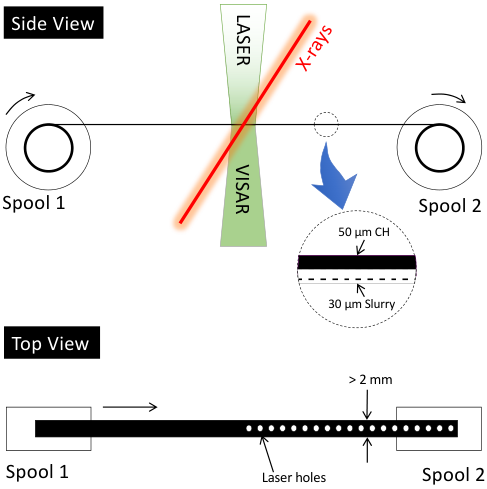
We have demonstrated the ability to produce powder diffraction patterns from crystalline brittle materials by suspending the sample within a ductile epoxy matrix. This opens up the possibility to study brittle samples in high-repetition rate laser operation on XFEL facilities using a cassette design as illustrated in Fig. 6. In addition, the transition to slurry targets will give closer analogues to real-world samples like meteorites or rocks that are porous and multi-component in nature.
High-repetition rate diffraction from slurry samples would produce high-quality powder diffraction which lends it self to Rietveld refinement analysis from which phase fraction information can be extracted (26). Our diffraction data on shock-compressed vol% epoxy(50):NaCl(50) slurry is consistent with the NaCl grains being compressed close to the full-density Hugoniot. We observe phase evolution from B1, B2 and liquid with increasing pressure. Future work is needed to accurately determine the thermodynamic compression path for different composite mixtures, through, for example, Debye-Waller analysis of XRD data (16, 46).
Appendix A Procedure for making slurry samples
For hard spheres there is a maximally random jammed (MRJ) packing fraction of about 0.64 (59). For slurry samples with this packing fraction the remaining 0.36 of the volume would be filled by epoxy. However we find that for granular volumes 50, viscosity increases strongly which makes it difficult to mix. A 50 epoxy:50 sample volume ratio is ideal for maximizing the packing fraction while keeping the viscosity low enough for thorough mixing. The procedure we employed to produce the slurry samples used in this study is described below.
- 1.
Crystalline samples are ground to a fine powder, with a mortar and pestle, and sieved through a mesh to ensure individual grains 1m.
- 2.
The powder is then fully baked in a vacuum oven to remove all moisture (otherwise, in the case of diamond powder (33), the final mixture is visibly heterogeneous).
- 3.
Stycast 1266 was chosen for the epoxy (0=1.12 g/cm3) due to it’s transparency, low viscosity, working time, and shelf life (clear, 650 cP, 30 min., days in a freezer) (2). The viscosity can be further lowered by increasing the temperature, but that shortens the working time.
- 4.
The epoxy must be vacuum de-aired to ensure a void-free embedment, as is necessary for this application. This is achieved by placing the epoxy in a bell jar while applying a vacuum. Initially the glue will foam up as the air bubbles escape. After a period of time visual inspection will confirm the epoxy is bubble free.
- 5.
The desired amount of epoxy is placed onto a small tray using a syringe. With a 0.01-mg accuracy scale the mass is then recorded and the epoxy volume calculated.
- 6.
The commensurate mass of the powdered sample – to achieve the desired epoxy-sample volume ratio – is then added to the epoxy. The epoxy+sample components are then thoroughly mixed to ensure a random distribution of grains.
- 7.
The epoxy mixture may then be fashioned into a planar film as illustrated in Fig. 7. Here the slurry is placed between a polyimide layer and a teflon layer and passed through rollers with a separation to produce the target thicknesses described in Fig. 2a. From the resultant sheet of polyimide + slurry, targets for laser-shock experiments may be punched out (2-mm diameters). Following this approach large areas of slurry samples may be produced as is needed for future high-repetition rate target designs (Fig. 6).

References
- Akella et al., (1969) Akella, J., Vaidya, S. N., and Kennedy, G. C. (1969). Melting of Sodium Chloride at Pressures to 65 kbar. Phys. Rev., 185:1135–1140.
- Barucci et al., (1999) Barucci, M., Bianchini, G., Gottardi, E., Peroni, I., and Ventura, G. (1999). Dielectric properties of Stycast 1266 over the 0.07–300 K temperature range. Cryogenics, 39(11):963–966.
- Birch, (1978) Birch, F. (1978). Finite strain isotherm and velocities for single-crystal and polycrystalline NaCl at high pressures and 300-K. Journal of Geophysical Research: Solid Earth, 83(B3):1257–1268.
- Bober et al., (2020) Bober, D. B., Herbold, E. B., Toyoda, Y., Maddox, B., and Kumar, M. (2020). A description of structured waves in shock compressed particulate composites. Journal of Applied Physics, 127(23):235108.
- Bober et al., (2019) Bober, D. B., Lind, J., and Kumar, M. (2019). In situ observation of material flow in composite media under shock compression. Physical Review Materials, 3(7):073603.
- Boehler et al., (1977) Boehler, R., Getting, I. C., and Kennedy, G. C. (1977). Gruneisen parameter of NaCl at high compressions. Journal of Physics and Chemistry of Solids, 38(3):233–236.
- Bradley et al., (2009) Bradley, D. K., Eggert, J. H., Smith, R. F., Prisbrey, S. T., Hicks, D. G., Braun, D. G., Biener, J., Hamza, A. V., Rudd, R. E., and Collins, G. W. (2009). Diamond at 800 GPa. Phys. Rev. Lett., 102(7):075503.
- Briggs et al., (2019) Briggs, R., Gorman, M., Zhang, S., McGonegle, D., Coleman, A., Coppari, F., Morales-Silva, M., Smith, R., Wicks, J., Bolme, C., et al. (2019). Coordination changes in liquid tin under shock compression determined using in situ femtosecond x-ray diffraction. Applied Physics Letters, 115(26):264101.
- Brown, (1999) Brown, J. M. (1999). The NaCl pressure standard. J. Appl. Phys., 86(10):5801.
- Brown et al., (2019) Brown, S. B., Gleason, A., Galtier, E., Higginbotham, A., Arnold, B., Fry, A., Granados, E., Hashim, A., Schroer, C. G., Schropp, A., et al. (2019). Direct imaging of ultrafast lattice dynamics. Science advances, 5(3):eaau8044.
- Brown et al., (2017) Brown, S. B., Hashim, A., Gleason, A., Galtier, E., Nam, I., Xing, Z., Fry, A., MacKinnon, A., Nagler, B., Granados, E., et al. (2017). Shock drive capabilities of a 30-Joule laser at the matter in extreme conditions hutch of the Linac Coherent Light Source. Review of Scientific Instruments, 88(10):105113.
- Celliers et al., (2004) Celliers, P. M., Bradley, D. K., Collins, G. W., Hicks, D. G., Boehly, T. R., and Armstrong, W. J. (2004). Line-imaging velocimeter for shock diagnostics at the OMEGA laser facility. Rev. Sci. Instrum., 75(11):4916.
- Coleman et al., (2019) Coleman, A., Gorman, M., Briggs, R., McWilliams, R., McGonegle, D., Bolme, C., Gleason, A., Fratanduono, D., Smith, R., Galtier, E., et al. (2019). Identification of phase transitions and metastability in dynamically compressed antimony using ultrafast x-ray diffraction. Physical review letters, 122(25):255704.
- Coppari et al., (2013) Coppari, F., Smith, R. F., Eggert, J. H., Wang, J., Rygg, J. R., Lazicki, A., Hawreliak, J. A., Collins, G. W., and Duffy, T. S. (2013). Experimental evidence for a phase transition in magnesium oxide at exoplanet pressures. Nat. Geosci., 6(11):926–929.
- Davis et al., (2016) Davis, J.-P., Knudson, M. D., Shulenburger, L., and Crockett, S. D. (2016). Mechanical and optical response of [100] lithium fluoride to multi-megabar dynamic pressures. Journal of Applied Physics, 120(16):165901.
- Debye, (1913) Debye, P. (1913). Interferenz von röntgenstrahlen und wärmebewegung. Annalen der Physik, 348(1):49–92.
- Decker, (1971) Decker, D. L. (1971). High-Pressure Equation of State for NaCl, KCl, and CsCl. J. Appl. Phys., 42(8):3239.
- Dragone et al., (2014) Dragone, A., Caragiulo, P., Markovic, B., Herbst, R., Reese, B., Herrmann, S., Hart, P., Segal, J., Carini, G., Kenney, C., et al. (2014). ePix: a class of architectures for second generation LCLS cameras. In Journal of Physics: Conference Series, volume 493, page 012012. IOP Publishing.
- Duvall and Taylor Jr, (1971) Duvall, G. and Taylor Jr, S. (1971). Shock parameters in a two component mixture. Journal of Composite Materials, 5(2):130–139.
- Erskine, (1994) Erskine, D. (1994). High pressure hugoniot of sapphire. In AIP Conference Proceedings, volume 309, pages 141–143. American Institute of Physics.
- Fei et al., (2007) Fei, Y., Ricolleau, A., Frank, M., Mibe, K., Shen, G., and Prakapenka, V. (2007). Toward an internally consistent pressure scale. Proc. Natl. Acad. Sci., 104(22):9182–9186.
- Flórez et al., (2002) Flórez, M., Recio, J. M., Francisco, E., Blanco, M. A., and Pendás, A. M. (2002). First-principles study of the rocksalt - cesium chloride relative phase stability in alkali halides. Phys. Rev. B, 66:144112.
- Fritz et al., (1971) Fritz, J. N., Marsh, S. P., Carter, W. J., and McQueen, R. G. (1971). The hugoniot equation of state of sodium chloride in the sodium chloride structure. Accurate Characterization of the High-pressure Environment: Proceedings, 13:201.
- Gorman et al., (2015) Gorman, M., Briggs, R., McBride, E., Higginbotham, A., Arnold, B., Eggert, J., Fratanduono, D., Galtier, E., Lazicki, A., Lee, H., et al. (2015). Direct observation of melting in shock-compressed bismuth with femtosecond x-ray diffraction. Physical review letters, 115(9):095701.
- Gorman et al., (2019) Gorman, M., Coleman, A., Briggs, R., McWilliams, R., Hermann, A., McGonegle, D., Bolme, C., Gleason, A., Galtier, E., Lee, H., et al. (2019). Recovery of metastable dense Bi synthesized by shock compression. Applied Physics Letters, 114(12):120601.
- Gorman et al., (2020) Gorman, M., McGonegle, D., Tracy, S., Clarke, S., Bolme, C., Gleason, A., Ali, S., Hok, S., Greeff, C., Heighway, P., et al. (2020). Recovery of a high-pressure phase formed under laser-driven compression. Physical Review B, 102(2):024101.
- Hawreliak et al., (2008) Hawreliak, J. A., Kalantar, D. H., Stölken, J. S., Remington, B. A., Lorenzana, H. E., and Wark, J. S. (2008). High-pressure nanocrystalline structure of a shock-compressed single crystal of iron. Physical Review B, 78(22):220101.
- Jordan and Baer, (2012) Jordan, J. L. and Baer, M. R. (2012). Mixture model for determination of shock equation of state. Journal of Applied Physics, 111(8):083516.
- Jung and Oganov, (2005) Jung, D. Y. and Oganov, A. R. (2005). Ab initio study of the high-pressure behavior of CaSiO3 perovskite. Physics and Chemistry of Minerals, 32:146–153.
- Kim et al., (2021) Kim, D., Tracy, S. J., Smith, R. F., Gleason, A. E., Bolme, C. A., Prakapenka, V. B., Appel, K., Speziale, S., Wicks, J. K., Berryman, E. J., et al. (2021). Femtosecond X-ray Diffraction of Laser-shocked Forsterite (Mg2SiO4) to 122 GPa. Journal of Geophysical Research: Solid Earth, 126(1):e2020JB020337.
- Kraus et al., (2010) Kraus, R., Stewart, S., Seifter, A., and Obst, A. (2010). Shock and post-shock temperatures in an ice–quartz mixture: implications for melting during planetary impact events. Earth and Planetary Science Letters, 289(1-2):162–170.
- Krueger and Vreeland Jr, (1991) Krueger, B. R. and Vreeland Jr, T. (1991). A Hugoniot theory for solid and powder mixtures. Journal of applied physics, 69(2):710–716.
- Lazicki et al., (2021) Lazicki, A., McGonegle, D., Rygg, J., Braun, D., Swift, D., Gorman, M., Smith, R., Heighway, P., Higginbotham, A., Suggit, M. J., et al. (2021). Metastability of diamond ramp-compressed to 2 terapascals. Nature, 589(7843):532–535.
- Li and Jeanloz, (1987) Li, X. and Jeanloz, R. (1987). Measurement of the - transition pressure in NaCl at high temperatures. Phys. Rev. B, 36(1):474–479.
- Li and Li, (2015) Li, Z. and Li, J. (2015). Melting curve of NaCl to 20 GPa from electrical measurements of capacitive current. American Mineralogist, 100(8):1892–1898.
- Marsh, (1980) Marsh, S. P. (1980). LASL Shock Hugoniot Data. Univ of California Press.
- Mason et al., (2018) Mason, P., Banerjee, S., Smith, J., Butcher, T., Phillips, J., Höppner, H., Möller, D., Ertel, K., De Vido, M., Hollingham, I., et al. (2018). Development of a 100 J, 10 Hz laser for compression experiments at the High Energy Density instrument at the European XFEL. High Power Laser Science and Engineering, 6.
- McQueen et al., (1970) McQueen, R., Marsh, S., Taylor, J., Fritz, J., and Carter, W. (1970). The equation of state of solids from shock wave studies. High velocity impact phenomena, 293:293–417.
- Meade and Jeanloz, (1988) Meade, C. and Jeanloz, R. (1988). The yield strength of B1 and B2 phases of NaCl. J. Geophys. Res, 93:3270–3274.
- Mi et al., (2018) Mi, Z., Shieh, S., Kavner, A., Kiefer, B., Wenk, H.-R., and Duffy, T. (2018). Strength and texture of sodium chloride to 56 GPa. Journal of Applied Physics, 123:135901.
- Milathianaki et al., (2013) Milathianaki, D., Boutet, S., Williams, G., Higginbotham, A., Ratner, D., Gleason, A., Messerschmidt, M., Seibert, M. M., Swift, D., Hering, P., et al. (2013). Femtosecond visualization of lattice dynamics in shock-compressed matter. Science, 342(6155):220–223.
- Montgomery, (2009) Montgomery, S. T. (2009). Effects of composition on the mechanical response of alumina-filled epoxy. SAND2009-6399 (Sandia National Laboratories, Albuquerque, NM, 2009).
- Munson et al., (1978) Munson, D., Boade, R., and Schuler, K. (1978). Stress-wave propagation in Al2O3-epoxy mixtures. Journal of Applied Physics, 49(9):4797–4807.
- Munson and May, (1972) Munson, D. and May, R. (1972). Dynamically determined high-pressure compressibilities of three epoxy resin systems. Journal of Applied Physics, 43(3):962–971.
- Munson and Schuler, (1971) Munson, D. and Schuler, K. (1971). Steady wave analysis of wave propagation in laminates and mechanical mixtures. Journal of Composite Materials, 5(3):286–304.
- Murphy et al., (2008) Murphy, W. J., Higginbotham, A., Wark, J. S., and Park, N. (2008). Molecular dynamics simulations of the Debye-Waller effect in shocked copper. Physical Review B, 78(1):014109.
- Nagler et al., (2013) Nagler, B., Arnold, B., Bouchard, G., Boyce, R. F., Boyce, R. M., Callen, A., Campell, M., Curiel, R., Galtier, E., Garofoli, J., Granados, E., Hasting, J., Hays, G., Heimann, P., Lee, R. W., Milathianaki, D., Plummer, L., Schropp, A., Wallace, A., Welch, M., White, W., Xing, Z., Yin, J., Young, J., Zastrau, U., and Lee, H. J. (2013). The Matter in Extreme Conditions instrument at the Linac Coherent Light Source. J. Synchrotron Radiat., page 22.
- Nagler et al., (2016) Nagler, B., Schropp, A., Galtier, E. C., Arnold, B., Brown, S. B., Fry, A., Gleason, A., Granados, E., Hashim, A., Hastings, J. B., et al. (2016). The phase-contrast imaging instrument at the matter in extreme conditions endstation at LCLS. Review of Scientific Instruments, 87(10):103701.
- Nishiyama et al., (2003) Nishiyama, N., Katsura, T., Funakoshi, K., Kubo, A., Kubo, T., Tange, Y., Sueda, Y., and Yokoshi, S. (2003). Determination of the phase boundary between the and phases in NaCl by in situ x-ray diffraction. Phys. Rev. B, 68:134109.
- Orban et al., (2020) Orban, D., Banesh, D., Tauxe, C., Biwer, C. M., Biswas, A., Saavedra, R., Sweeney, C., Sandberg, R. L., Bolme, C., Ahrens, J., et al. (2020). Cinema: Bandit: a visualization application for beamline science demonstrated on XFEL shock physics experiments. Journal of Synchrotron Radiation, 27(1).
- Petel and Jetté, (2010) Petel, O. E. and Jetté, F. X. (2010). Comparison of methods for calculating the shock Hugoniot of mixtures. Shock Waves, 20(1):73–83.
- Prencipe et al., (2017) Prencipe, I., Fuchs, J., Pascarelli, S., Schumacher, D., Stephens, R., Alexander, N., Briggs, R., Büscher, M., Cernaianu, M., Choukourov, A., et al. (2017). Targets for high repetition rate laser facilities: needs, challenges and perspectives. High Power Laser Science and Engineering, 5.
- Rastogi et al., (2021) Rastogi, V., Smith, R., and Wicks, J. (2021). Femtosecond diffraction studies of the sodium chloride phase diagram under laser-shock compression [in preparation]. J. Appl. Phys.
- Sata et al., (2002) Sata, N., Shen, G., Rivers, M. L., and Sutton, S. R. (2002). Pressure-volume equation of state of the high-pressure phase of NaCl. Phys. Rev. B, 65:104114.
- Schropp et al., (2015) Schropp, A., Hoppe, R., Meier, V., Patommel, J., Seiboth, F., Ping, Y., Hicks, D. G., Beckwith, M. A., Collins, G. W., Higginbotham, A., et al. (2015). Imaging shock waves in diamond with both high temporal and spatial resolution at an XFEL. Scientific reports, 5:11089.
- Setchell and Anderson, (2005) Setchell, R. and Anderson, M. (2005). Shock-compression response of an alumina-filled epoxy. Journal of Applied Physics, 97(8):083518.
- Swegle and Grady, (1985) Swegle, J. and Grady, D. (1985). Shock viscosity and the prediction of shock wave rise times. Journal of Applied Physics, 58(2):692–701.
- Thompson et al., (1987) Thompson, P., Cox, D., and Hastings, J. (1987). Rietveld refinement of debye–scherrer synchrotron x-ray data from al2o3. Journal of Applied Crystallography, 20(2):79–83.
- Torquato et al., (2000) Torquato, S., Truskett, T. M., and Debenedetti, P. G. (2000). Is random close packing of spheres well defined? Physical Review Letters, 84(10):2064.
- Tracy et al., (2019) Tracy, S., Smith, R., Wicks, J., Fratanduono, D., Gleason, A., Bolme, C., Prakapenka, V., Speziale, S., Appel, K., Fernandez-Pañella, A., et al. (2019). In situ observation of a phase transition in silicon carbide under shock compression using pulsed x-ray diffraction. Physical Review B, 99(21):214106.
- Vinko et al., (2015) Vinko, S., Ciricosta, O., Preston, T., Rackstraw, D., Brown, C., Burian, T., Chalupskỳ, J., Cho, B. I., Chung, H.-K., Engelhorn, K., et al. (2015). Investigation of femtosecond collisional ionization rates in a solid-density aluminium plasma. Nature communications, 6(1):1–7.
- Vogler et al., (2010) Vogler, T. J., Alexander, C., Wise, J., and Montgomery, S. (2010). Dynamic behavior of tungsten carbide and alumina filled epoxy composites. Journal of Applied Physics, 107(4):043520.
- Zastrau et al., (2017) Zastrau, U., McMahon, M., Appel, K., Baehtz, C., Brambrink, E., Briggs, R., Butcher, T., Cauble, B., Chen, B., Damker, H., et al. (2017). Conceptual Design Report: Dynamic Laser Compression Experiments at the HED Instrument of European XFEL. Technical report, European X-Ray Free-Electron Laser Facility GmbH.
- Zhongying, (2012) Zhongying, M. (2012). Strength, Elasticity and Phase Transition Study on NaCl and MgO-NaCl Mixture to Mantle Pressures. Electronic Thesis and Dissertation Repository. 1043, https://ir.lib.uwo.ca/etd/1043.
Acknowledgements: This work was performed under the auspices of the US Department of Energy by Lawrence Livermore National Laboratory under contract number DE-AC52-07NA27344. This work was supported through the Laboratory Directed Research and Development Program at LLNL (project no.’s 17-ERD-014, 21-ERD-032). C.A.B. would like to acknowledge support from Science Campaign 2 at Los Alamos National Laboratory, which is operated for the National Nuclear Security Administration of the U.S. Department of Energy under Contract No. DE-AC52-06NA25396. Use of the Linac Coherent Light Source (LCLS), SLAC National Accelerator Laboratory, was supported by the U.S. Department of Energy, Office of Science, Office of Basic Energy Sciences, under Contract No. DE-AC02-76SF00515. The MEC instrument is supported by the U.S. Department of Energy, Office of Science, Office of Fusion Energy Sciences, under Contract No. SF00515. The code used for the XRD analysis is publicly available at https://github.com/HEXRD.
SUPPLEMENTARY MATERIALS

