Towards Relatable Explainable AI with the Perceptual ProcessConference: CHI Conference on Human Factors in Computing Systems; April 29-May 5, 2022; New Orleans, LA, USACHI Conference on Human Factors in Computing Systems (CHI ’22), April 29-May 5, 2022, New Orleans, LA, USADOI: 10.1145/3491102.3501826ISBN: 978-1-4503-9157-3/22/049955CCS: Human-centered computing Empirical studies in HCICCS: Computing methodologies Artificial intelligence
Abstract.
Machine learning models need to provide contrastive explanations, since people often seek to understand why a puzzling prediction occurred instead of some expected outcome. Current contrastive explanations are rudimentary comparisons between examples or raw features, which remain difficult to interpret, since they lack semantic meaning. We argue that explanations must be more relatable to other concepts, hypotheticals, and associations. Inspired by the perceptual process from cognitive psychology, we propose the XAI Perceptual Processing Framework and RexNet model for relatable explainable AI with Contrastive Saliency, Counterfactual Synthetic, and Contrastive Cues explanations. We investigated the application of vocal emotion recognition, and implemented a modular multi-task deep neural network to predict and explain emotions from speech. From think-aloud and controlled studies, we found that counterfactual explanations were useful and further enhanced with semantic cues, but not saliency explanations. This work provides insights into providing and evaluating relatable contrastive explainable AI for perception applications.
Keywords:
Explainable AI, contrastive explanations, audio, vocal emotion1. Introduction
With the increasing availability of data, deep learning-based artificial intelligence (AI) has achieved strong capabilities in computer vision (Krizhevsky et al. 2012), natural language processing (Kenton and Toutanova 2019), and speech processing (Amodei et al. 2016). However, their complexity limits their use in real-world applications due to the difficulty to understand them (Gunning and Aha 2019). To address this, much research has been conducted on explainable AI (XAI) to develop new XAI algorithms and techniques (Adadi and Berrada 2018; Arrieta et al. 2020; Guidotti et al. 2018; Hohman et al. 2018), understand user needs (Liao et al. 2020; Lim and Dey 2009; Ehsan et al. 2021; Miller 2019; Wang et al. 2019) and evaluate their helpfulness (Abdul et al. 2020; Lim et al. 2009; Cai et al. 2019a; Cai et al. 2019b; Coppers et al. 2018; Ehsan et al. 2018; Poursabzi-Sangdeh et al. 2021; Wang et al. 2021).
Despite the myriad XAI techniques, many of them remain difficult to understand, due to the lack of human-centered design that do not satisfy human needs (Eiband et al. 2018; Miller 2019; Wang et al. 2019). Miller identified contrastive reasoning as a particular reason that people ask for explanations (Miller 2019) — "one does not explain events per se, but that one explains why the puzzling event occurred in the target cases but not in some counterfactual contrast case." (Hilton 1990). We further argue that explanations lack relatability towards concepts that people are familiar with, and therefore they seem too low-level technical and not semantically meaningful. Existing contrastive explanation techniques (Dhurandhar et al. [n.d.]; van der Waa et al. 2018; Miller 2021; Le et al. 2020) remain unrelatable, hence limiting their interpretability. In this work, we extend the framing of relatable explanations beyond contrastive explanations to include saliency, counterfactuals, and cues. Explanations should be relatable towards concepts via contrastive explanations, towards exemplars by providing counterfactual examples, and towards associated auxiliary concepts such as sensory and semantic cues.
We have identified audio prediction as a problem space in dire need of relatable explanations. Much research on XAI techniques focuses on structured data with semantically meaningful features, unstructured data such as text with semantically meaningful words or sentences, and images with visualizations that are visually intuitive. Explaining audio visually is problematic, since sound is not visual and people understand them through relating to concepts or other audio samples (Pell and Kotz 2011). Current explanation techniques for audio typically present saliency maps on audiograms or spectrograms. Spectrograms are too technical for lay users or even non-engineering domain experts. Saliency maps are too simple and merely point to regions without explaining their relevance. Example-based explanations extract or produce examples for users to compare, but this still requires people to speculate why some examples are similar or different. Hence, explaining audio predictions requires relating the prediction to other concepts, counterfactual examples, and associated cues. We study the use case of vocal emotion recognition to propose relatable explanations. With applications in smart speakers for the home (Maharjan et al. 2019), digital assistants for mental health monitoring (Wang et al. 2014; Ben-Zeev et al. 2015), and affective computing (Picard 2000), there is a growing need for these AI models to be relatably explainable.
Furthermore, not only should explanations be semantically meaningful, but the way the explanations are generated or the way the AI "thinks" should be human-like to earn people’s trust (Ross et al. 2017). We draw inspiration from theories of human cognition to understand why and how people relate concepts, information, and data. Specifically, we frame relatable explanations with the Perceptual Process (Carterette and Friedman 1978), where people select, organize, and interpret information to make a decision. Corresponding to these stages, we propose the XAI Perceptual Processing Framework with modular explanations for Contrastive Saliency, Cues, and Counterfactual Synthetics with Contrastive Cues, respectively. This was implemented as RexNet (Relatable Explanation Network), a deep learning model with modules for each explanation type. We evaluated the explanations with a modeling study, a qualitative think-aloud study and a quantitative controlled study to investigate their usage and impact on decision performance and trust perceptions. We found that RexNet improved prediction performance and explanation faithfulness; participants appreciated the diversity of explanations; and participants benefited from Counterfactual and Cues explanations, but not for Saliency explanations. In summary, we address the challenge that explanations need to be relatable, and studied this for an audio prediction task (vocal emotion recognition). Our contributions are:
- (1)
XAI Perceptual Processing Framework for relatable explanations inspired from theories in human cognition.
- (2)
RexNet model with multiple relatable explanation (Contrastive Saliency, Counterfactual Synthetic, Contrastive Cues).
- (3)
First to provide relatable explanations for audio predictions.
- (4)
Evaluation of usage and usefulness of relatable explanations.
2. Related Work
We introduce various explainable AI techniques, argue how they lack human-centeredness, and describe the background on speech emotion recognition and highlight their lack of explainability.
2.1. Explainable AI techniques
Much research has been done to develop explainable AI (XAI) for improving model transparency and trustworthiness. An intuitive approach is to point out which features are most important. Attribution explanations do this by identifying importance using gradients (Sundararajan et al. 2017), ablation (Richardson et al. 2006), activations (Selvaraju et al. 2017), or decompositions (Bach et al. 2015; Montavon et al. 2017; Ribeiro et al. 2016). In computer vision, attributions take the form of saliency maps (e.g., (Selvaraju et al. 2017)). Explaining by referring to key examples is another popular approach. This includes simply providing arbitrary samples of specific classes, cluster prototypes or criticisms (Kim et al. 2016), or influential training set instances (Koh and Liang 2017). However, users typically have expectations and goals when asking for explanations.
Users ask for contrastive explanations when expected outcomes do not happen. A simple answer would find the attribution differences between the actual (fact) and expected (foil) outcomes (Prabhushankar et al. 2020) However, this is naive because users are truly asking for what differences in feature values, not attributions, would lead to the alternative outcome. That is a counterfactual explanation. Furthermore, to anticipate a future outcome or prevent an undesirable one, users could ask for counterfactual explanations. Indeed, contrastive explanations are often conflated with counterfactual explanations in the research literature. Such explanations suggest the minimum changes in the current case to achieve the desired outcome (Wachter et al. 2017). Trained decision structures, such as local foil trees (van der Waa et al. 2018), Bayesian rule lists (Letham et al. 2015), or structural causal models (Miller 2021) can also serve as counterfactual explanations. Though typically explained in terms of feature values (Wachter et al. 2017; Le et al. 2020; Dhurandhar et al. [n.d.]) or anchor rules (Ribeiro et al. 2018), techniques have been developed to synthesize counterfactuals of unstructured data (e.g., images (Goyal et al. 2019) and text (Hendricks et al. 2018)). In this work, we employ the synthesis approach to generate counterfactuals of audio data.
There are many explanation types and Lim and Dey have framed them in an intelligibility taxonomy as Why (Attribution), Why Not (Contrastive), and How To (Counterfactual) (Lim and Dey 2009). Many of these XAI techniques have been independently developed or tested, so their usage is disparate. In this work, we unify them in a common framework and integrate them in a single machine learning model.
2.2. Human-Centered Explainable AI
Abdul et al. (Abdul et al. 2018) found a large gap between XAI algorithms and human-centered research. To close this gap, HCI researchers have been active in evaluating the various benefits of XAI or lack thereof, including understanding and trust (Lim et al. 2009), uncertainty (Lim and Dey 2011b; Wang et al. 2021; Yin et al. 2019), cognitive load (Abdul et al. 2020), types of examples (Cai et al. 2019a), etc. Studies have sought to determine the "best" explanation type (Lim et al. 2009; Tsai et al. 2021), but others have revealed the benefit of reasoning with multiple explanations (Lim and Dey 2011a; Lim and Dey 2013; Anderson et al. 2020). Hence, we propose a unified framework to provide multiple relatable explanations together. We determined our human-centered explanation requirements by studying literature on human cognition, which is epistemologically similar to works grounded in philosophy and psychology (Miller 2019; Wang et al. 2019), and unlike empirical approaches to elicit user requirements (Ehsan et al. 2021; Liao et al. 2020; Lim and Dey 2009). Furthermore, current works focus on explaining higher-level reasoning tasks, but not perception tasks that are commonplace. This has implications on the depth of explanations to provide, which we investigate in this work.
2.3. Speech Emotion Recognition
Deep learning approaches proliferate research on automatic speech emotion recognition (SER). Leveraging the intrinsic time-series structure of speech data, recurrent neural network (RNN) models with attention mechanism have been developed to capture transient acoustic features to understand contextual information (Mirsamadi et al. 2017). Employing popular techniques from the computer vision domain, audio data can be treated as 1D arrays or converted to a spectrogram as a 2D image. Convolutional neural networks (CNNs) can then extract spatial features from these audiograms or spectrograms (Huang et al. 2014). Current approaches improve performance by combining CNN and RNN (Tzirakis et al. 2018; Zhao et al. 2019), or modeling with multiple modalities (Yoon et al. 2018). Our RexNet model starts with a base CNN model to leverage many more XAI techniques available to CNNs than RNNs. Since our approach is modular, it can be generalized to state-of-the-art SER models.

2.4. Model Explanations of Audio Predictions
Due to the availability of image data and intuitiveness of vision, much XAI research has focused on image prediction tasks; in contrast, few techniques have been developed for audio prediction tasks. Many techniques exploit CNN explanations by generating a saliency map on the audio spectrogram (Agrawal and Ganapathy 2020; Krug and Stober 2018). Other explanations focus on model debugging by visualizing neuron activations (Krug et al. 2018), or as feature visualizing (Li et al. 2020) (like (Olah et al. 2017) for image kernels). We also leverage saliency maps as one explanation, due to its intuitive pointing, but augment it with relatable explanations. Other than explaining the model behavior post-hoc, another approach is to make the model more interpretable and trustworthy by constraining the trained model with domain knowledge, such as with voice-specific parametric convolutional filters (Ravanelli and Bengio 2018; Loweimi et al. 2019). Our approach with modular explanations of specific types follows a similar objective.
3. Intuition and Background
To improve trust, models should provide explanations that are relatable and human-like. Thus, we propose to use theories of human perception and cognition to define our explainable AI techniques. We discuss how the framework supports relatable explanations, and apply it to vocal emotion recognition. Next, we describe background theories from cognitive psychology and vocal emotion prosody, and define requirements for relatable explanations.
3.1. Perceptual Processing
The perceptual process defines three stages for how humans perceive and understand stimuli: selection, organization, and interpretation (Carterette and Friedman 1978). Fig. 1 illustrates these stages for the case of visually perceiving a cat and relates them to our technical approach. When sensory stimuli (e.g., light rays or audio vibrations) reach the senses, 1) our brain first selects only a subset of the information to focus attention. This is equivalent to highlighting salient regions in an image. 2) The next stage organizes the salient regions into meaningful cues. For a face, these would include recognizing the ears, eyes, and nose. 3) Finally, the brain interprets these lower-level cues towards higher-level concepts. In our example, the face cues are used to recognize the animal by: a) recalling from long-term memory the concepts of cat and dog, and their respective cues, b) compare whether each element is closer to the cat or dog version (Fig. 1 uses a slider paradigm for illustration), and c) categorize the concept with the smallest difference. For our application in vocal emotion recognition, the perceptual processing framework aligns with Kotz et al’s model for processing emotion prosody (Pell and Kotz 2011; Schirmer and Kotz 2006) that describes stages for "extracting sensory/acoustic features, detecting meaningful relations, conceptual processing of the acoustic patterns in relation to emotion-related knowledge held in long-term memory."
In particular, people categorize concepts by mentally recalling examples and comparing their similarities (Goldstein 2014). These examples may be prototypes or exemplars. With Prototype Theory, people summarize and recall average examples, but these may be quite different from the observed case being compared. With Exemplar Theory, people memorize and recall specific examples, but this does not scale with inexperienced cases. Instead, people can imagine new cases that they have never experienced (Byrne 2007). Moreover, rather than tacitly comparing some ill-defined difference between the examples, people make comparisons by judging similarities or differences along dimensions (cues) (Moyer and Bayer 1976). Categorization can then be done systematically with proposition rules or intuitively (Kahneman 2011), with either sometimes being more effective (Ma-Kellams and Lerner 2016).
We apply this framework and propose a unified technical approach with contrastive explanation types to align with each stage of perceptual processing: 1) highlight saliency, 2) recognize cues, 3a) synthesize counterfactual, 3b) compare cues, and 3c) classify concept. We further present cue differences as rules and leverage an embedding for emotions to represent intuition (described later).
3.2. Desiderata for Relatable Explanations
Informed by the Perceptual Process, Prototype and Exemplar Theories, we identified requirements that AI explanations of the prediction of an instance should be made more relatable towards:
- •
Concepts by relating the predicted concept to other concepts. Contrastive explanations (Lim and Dey 2009; Miller 2019) are thus a key foundation for broader relatable explanations.
- •
Exemplars by comparing the factual (actual) instance with counterfactual instances of the other concepts. Concepts are abstract, so providing concrete examples can help people to fixate on details and cues for comparison. Counterfactual explanations (Dhurandhar et al. [n.d.]; Miller 2019; Wachter et al. 2017) are a first step in identifying marginally different instances with different prediction outcomes, but do not further relate to why the instances are different.
- •
Cues by relating how auxiliary concepts or associated cues are different between the factual and counterfactual instances. For perception tasks, this involves highlighting saliency in sensory cues (stimuli; e.g., eyes of a face). For cognition tasks, this involves articulating differences in semantic cues (e.g., interpreted speech rate from phonemes). Attribute value explanations are popular in recommender systems (Pu and Chen 2007) to describe how two products have similar attributes (e.g., both are red in color), but they are used to explain similarity, rather than contrast.
Finally, we propose an integrated architecture, RexNet, which is relatable to human reasoning by mimicking parts of human perceptual processing. Together the individual capabilities and overall architecture can improve trust, understanding, and performance by being more relatable.
3.3. Vocal Emotion Prosody
| Vocal Cue (Juslin and Laukka 2001) |
|
Description | |||||||
|---|---|---|---|---|---|---|---|---|---|
|
|
| |||||||
| Voice Intensity | Loudness |
| |||||||
| Mean () | Average Pitch |
| |||||||
| SD () | Pitch Range |
| |||||||
| Speech Rate | Speaking Rate |
| |||||||
| Pause Proportion |
|
|
People recognize vocal emotions based on various vocal stimulus types and prosodic attributes (Lausen and Hammerschmidt 2020), such as verbal (Juslin and Laukka 2001) and non-verbal expressions (Sauter et al. 2010) (e.g., laughs, sobs, screams), and lexical (Mariooryad and Busso 2014) information. In this work, we focus on vocal cues (prosody) identified by Juslin et al. (e.g., see Table 1). These cues are about how words are spoken, rather than the words themselves (lexical information). We leverage people’s ability to index vocal emotion categories by the pattern of cues (Juslin and Laukka 2001) to identify cue differences between different emotions, which we present in our model explanation. Although people may be able to perceive various vocal cues, they may be unable to relate to them conceptually (e.g., "formant frequency" is technically complex), therefore, we limit cues to familiar everyday concepts. In our user study, we further verified their understandability in a screening test. For our prediction application, the concept to predict is emotion, cues are vocal cues for emotion prosody, cue differences support dimensional comparisons, and saliency is in terms of phonemes or pauses between them.
4. Technical Approach
We propose an interpretable deep neural network to predict vocal emotions and provide relatable explanations. We first describe the base prediction model, then specific explanation modules.
4.1. Base Prediction Model
We trained a vocal emotion classifier on the Ryerson Audio-Visual Database of Emotional Speech and Song (RAVDESS) dataset (Livingstone and Russo 2018) with 7356 audio clips of 24 voice actors (50% female) reading fixed sentences with 8 emotions (neutral, calm, happy, fearful, surprised, sad, disgust, angry). Each audio clip was 2.5-3.5 seconds long, and we padded or cropped them to a fixed 3.0s. We parsed each audio file to a time-series array of 48k readings (i.e., 16 kHz sampling rate), and preprocessed it to obtain a mel-frequency spectrogram with 128 frequency bins, 0.04s window size, and 0.01s overlap. Treating the spectrogram as a 2D image, we can train a convolutional neural network (CNN) (Hershey et al. 2017). Specifically, we trained a CNN with 3 convolutional blocks, and 2 fully connected layers. We used cross-entropy loss for multi-class classification. In sum, the base CNN model takes audio input to predict an emotion (lower left in Fig. 2).

4.2. RexNet: Relatable Explanation Network
We introduce RexNet — Relatable Explanation Network11 1 The ’x’ can also stand for a cross for Why Not to indicate contrastive explanations. — to provide relatable explanations for contrastive explainable AI. We extended the base model with multiple modules to provide three relatable contrastive explanations (Fig. 2). The whole architecture can be understood in terms of a chain of dependencies. We describe this in reverse starting with the goal. Ultimately, we want to explain the prediction with descriptive contrastive cues. This requires a counterfactual "foil" to compare the target "fact" with, therefore, we need to obtain an example for comparison. When making a comparison, not all stimuli are relevant for interpretation, hence, we need to select salient segments. For example, noticing a flower in a photo of a pet is irrelevant to identifying whether an animal is a dog or cat. In summary, our approach has steps:
- 1.
Highlight salient segments
- i.
Predict emotion concept as initial estimation
- ii.
Keep embedding vector of estimation for final classification
- iii.
Explain contrastive saliency using discounted Grad-CAM
- i.
- 2.
Describe segments
- i.
Infer associated cues
- i.
- 3a.
Generate counterfactual exemplar for each contrast concept
- i.
Generate counterfactual synthetic using StarGAN-VC (Kameoka et al. 2018)
- i.
- 3b.
Compare cue differences between target case and each exemplar
- i.
Calculate cue differences weighted by saliency
- ii.
Classify cue difference relations with cue differences and embedding for target and contrast concepts.
- i.
- 3c.
Classify concept fully
- i.
Predict concept using inputs: cue differences of all counterfactuals + embedding (initial estimation)
- ii.
Explain final concept with attributions for cue differences using Layer-wise Relevance Propagation (LRP) (Bach et al. 2015)
- i.
We next describe each module for specific contrastive explanations.
4.2.1. Contrastive Saliency
Saliency maps are very popular to explain predictions on images, since they intuitively highlight which pixels the model considers important for the predicted outcome (Simonyan et al. 2014; Selvaraju et al. 2017; Zhou et al. 2016). For spectrograms, they can identify which frequencies or time periods are most salient (Hershey et al. 2017). However, they have limited interpretability, since they merely point to raw pixels but do not further elaborate on why those pixels were important. For time-series data, highlighting on a spectrogram remains uninterpretable to non-technical users, since many are not trained to read spectrograms. Furthermore, some salient pixels may be important across all prediction classes, and thus be less uniquely relevant to the specific class of interest. For example, a saliency map to predict emotions from faces may always highlight the eyes regardless of emotion. To address the issue of saliency lacking semantic meaningfulness, we introduce associative cues, which we describe later. Here, we address the need for more specific saliency with a discounted saliency map to produce contrastive saliency. This retains some importance of globally important pixels, unlike current methods that simply subtract a saliency map of one class from that of another class (Prabhushankar et al. 2020). Dhurandhar et al. (Dhurandhar et al. [n.d.]) identified pertinent positives and negatives for more precise contrastive explanations by perturbing features, but our approach calculates based on feature activations.
We define two forms of contrastive saliency: pairwise and total. Pairwise contrastive saliency highlights pixels that are important for predicting target class but discounts pixels that are also important for foil class . We implemented the saliency map with Grad-CAM (Selvaraju et al. 2017), and define the class activation map for class as . The pairwise contrastive saliency between classes and is thus:
| (1) |
where indicates the discount factors for all pixels due to their attributions to class , is a matrix of all ones, and is the Hadamard operator for pixel-wise multiplication. To identify important pixels for class but not any other class, we define total contrastive saliency as:
| (2) |
where indicates the discount factors across all alternative classes, and is the number of classes.
In RexNet, the saliency explanation is calculated from the initial emotion classifier predicting an initial emotion concept . We present contrastive saliency for audio using a 1D saliency bar aligned to words in the speech (see Fig. 5), which aggregates saliency in the spectrogram across frequencies per time bin. This is more accessible for lay people to understand since it avoids using technical spectrograms or audiograms (audio waveforms).
4.2.2. Counterfactual Synthetic
Due to the open-ended variability in unstructured data, counterfactual samples drawn from a training set are likely to be quite different from the target instance. Counterfactual samples will have extraneous differences that may be distracting to interpret and less meaningful for comparison. Instead, counterfactual synthetics are generated to be similar to the target instance, except sufficient differences to achieve the contrastive outcome. Fig. 3 illustrates the benefit of using counterfactual synthetics for comparison. When deciding whether a target item is more similar to a first or second reference, one would measure the target’s distance to each reference. Counterfactual synthesis produces comparison references that are closer to the target item being classified, because it minimizes the differences between the target item and reference example. These counterfactual synthetics will be closer to other model samples that the model knows (prior instances in the training set), model prototypes (centroids or medoids of class clusters), or human mental exemplars (from the user’s memory), since the model may not have a similar example or the human may never have seen or heard a very similar case to the target item. This amplifies the ratio between the reference distances larger, and makes the difference more perceptible. Formally, the ratio of differences for counterfactual synthetics are larger than for other examples (prototypes, or samples of prior items), i.e., . Therefore, counterfactual synthetics help make comparison between references more easy.
We aim to create a counterfactual that is similar to the target instance which is classified as class , but with sufficient differences to be classified as another class . Current counterfactual methods focus on structured (tabular) data by minimizing changes to the target instance (Mothilal et al. 2020; Wachter et al. 2017), or identifying anchor rules (Ribeiro et al. 2018), but this is not possible for unstructured data (e.g., images, sounds). Instead, inspired by data synthesis with Generative Adversarial Networks (GANs) (Karras et al. 2019; Radford et al. 2015) and style transfer (Choi et al. 2018; Zhu et al. 2017), we propose explanations with counterfactual synthetics by "re-styling" the original target instance such that it is classified as another class .
For vocal emotion recognition, we aim to change the emotion of the speech audio while retaining the original words and identity by using an extension of StarGAN (Choi et al. 2018) for voice data, StarGAN-VC (Kameoka et al. 2018) (Fig. 4). As a generative adversarial model, StarGAN trains three models — a generator , discriminator , and domain classifier . inputs the target instance that is of class and the objective class to generate a similar instance . The training objectives are to make and . Next, and are input into to get as output. is trained to minimize the cycle consistency reconstruction loss between and , which also improves . is also input into the to output class , which is trained to minimize the loss between and . Finally, is trained to ensure that the generated instances are more realistic . Together, this semi-supervised method trains to generate style-transferred instances.


4.2.3. Contrastive Cues
The final contrastive explanation involves first inferring cues from the target and counterfactual instances and comparing them. We define the individual cue as absolute cues ( and ), and the difference as contrastive cues . We report on 6 vocal cues identified by Juslin and Laukka (Juslin and Laukka 2001) for vocal emotions (Table 1). Absolute cues can be inferred with machine learning predictions or heuristically. For vocal emotions, since cues can be deterministically measured from the input data, we use heuristic methods to infer the cues . For example, pitch range is calculated as follows: a) calculate fundamental frequency (modal frequency bin) for each CAM-salient time window in the spectrogram, b) calculate their standard deviation. For semantically abstract cues, such as sounding "melodic", "questioning", or "nasally", they should be annotated by humans and inferred using supervised learning.
| Vocal Cue | ||||||||||||||
|---|---|---|---|---|---|---|---|---|---|---|---|---|---|---|
| Target Emotion | Shrillness | Loudness |
|
|
|
| ||||||||
| Neutral | Average | Low | Low | Low | High | Low | ||||||||
| Calm | Low | Low | Low | Low | Average | Average | ||||||||
| Happy | High | High | High | Average | Average | Low | ||||||||
| Fearful | Average | High | High | High | High | Average | ||||||||
| Surprised | Average | Average | Average | High | High | Low | ||||||||
| Sad | Low | Low | Average | Average | Average | High | ||||||||
| Disgust | Average | Average | Low | Low | Low | High | ||||||||
| Angry | High | High | High | High | Low | Average | ||||||||
| Vocal Cue | |||||||||||||||
|---|---|---|---|---|---|---|---|---|---|---|---|---|---|---|---|
| Target Emotion | Shrillness | Loudness |
|
|
|
|
Contrast Emotion | ||||||||
| Neutral | Lower | Lower | Lower | Lower | Similar | Similar | Happy | ||||||||
| Calm | Lower | Lower | Lower | Lower | Lower | Similar | Happy | ||||||||
| Happy | Similar | Similar | Similar | Similar | Similar | Similar | Happy | ||||||||
| Fearful | Similar | Similar | Similar | Similar | Similar | Higher | Happy | ||||||||
| Surprised | Lower | Similar | Similar | Similar | Similar | Similar | Happy | ||||||||
| Sad | Lower | Lower | Lower | Lower | Similar | Higher | Happy | ||||||||
| Disgust | Average | Lower | Lower | Lower | Lower | Higher | Happy | ||||||||
| Angry | Higher | Higher | Similar | Similar | Lower | Higher | Happy | ||||||||
We calculated contrastive cues as ordinal cue difference relations from numeric cue differences based on the instances in the RAVDESS dataset (Livingstone and Russo 2018). To determine differences between emotions for each cue, we fit the data to a linear mixed effects model with emotion as the main fixed effect and voice actors as random effect (see Supplementary Fig. 1), and performed a Tukey HSD test with significance level to account for the multiple comparison effect. For each cue, if an emotion is not significantly higher than the other, then we label the cue difference as "similar"; otherwise, we label it as "higher" or "lower" depending on the direction. Table 2 describes the vocal cue patterns of each emotion compared to average levels, which is in close agreement with (Juslin and Laukka 2001) except for the fearful emotion. Table 3 describes the pairwise cue difference relations between each emotion and an emotion (happy).
Predicting the cue difference relations requires deciding the decision threshold at which to split the cue difference to categorize the relation, and this can contextually depend on initially estimating which emotion concepts and to compare, and which cues are more relevant. We define this as a multi-task model with two sub-models with fully connected neural network layers and . takes in the numeric cue differences and embedding representations (from the penultimate fully connected layer) of the emotion concepts and to predict the emotion heard in . We determine which cues were more important by calculating an attribution explanation with layer-wise relevance propagation (LRP) (Bach et al. 2015). These attributions are then concatenated on to determine the weighted cue differences . takes in , and to predict the cue difference relations . With the ground truth references, cue difference relations prediction can be trained using supervised learning. Since the cue difference relations (lower, similar, higher) are ordinal, we employed the NNRank ordinal encoding (Cheng et al. 2008) with 2 classes, such that lower = , similar = , higher = , sigmoid activation, and binary cross-entropy loss for multi-label classification.
4.2.4. RexNet Model Summary
RexNet consists of several modules to predict a concept and provide relatable explanations. Its primary task takes an input voice audio clip to predict emotion concept . For explanations, by specifying contrast emotion concept as input, the model generates explanations for the initial emotion concept , contrastive saliency , cue difference relations , and cue difference importance . Each of these explanations and other absolute explanations can be provided to the end-user.
4.3. Relatable Explanation User Interface
Fig. 5 shows the user interface with all relatable explanations. After listening to a voice clip (Input), the user can read the model’s recognition of the emotion (Prediction), listen to the voice as an alternative emotion (Counterfactual Synthetic), compare the cues between the target and counterfactual voice clips (Contrastive Cues), and see the salient moments in the heatmap (Contrastive Saliency).

5. Evaluations
We first evaluated the performance of our interpretable model, then conducted two user studies to evaluate the usage and usefulness of the contrastive explanations. The first user study was formative to qualitatively understand usage, and the second was summative to measure the effectiveness of each explanation type.
5.1. Modeling Study
5.1.1. Method
We evaluated the model prediction performance and explanation correctness with several metrics (Table 4). We measured the accuracies of the initial and final predictions of emotion, and compared them against that of the baseline CNN model. Each explanation type was evaluated with different metrics due to their different forms. We evaluated saliency maps by the relevance of important features to the model prediction, and compared absolute and contrastive saliency. We employed the ablation approach of (Li et al. 2018) that identifies more important features as those that cause larger decreases in model performance when that feature is ablated. We evaluated the faithfulness of counterfactual synthetics with these metrics: 1) reconstruction similarity between the input and synthesized , calculated with mean square error , to determine how similar they are; 2) the identity classification accuracy to indicate whether the counterfactual voice sounds like the same actor portraying the original emotion; and 3) the emotion classification accuracy with respect to the contrast emotion. We evaluated the correctness of cue difference relations by comparing the inferred relations (i.e., higher, lower, similar) to the ground truth relations calculated from the dataset (e.g., see Table 3). All multi-class metrics are reported with their macro-averages.
| Model | |||||||||
| Variable | Metric | Random |
|
RexNet |
| ||||
|
|
12.5% | 75.7% | 79.5% | 78.8% | ||||
|
|
78.5% | 77.4% | ||||||
|
|
14.9% | 16.7% | ||||||
|
|
13.7% | 16.3% | ||||||
|
|
0.553 | 1 | ||||||
|
4.2% | 60.2% | 96.2% | ||||||
|
12.5% | 30.7% | 75.7%* | ||||||
|
|
71.9% | 71.6% | ||||||
5.1.2. Results
We split the dataset into 80% training and 20% test. Table 4 reports the test results. Training with the explainable modules helped RexNet to achieve higher emotion accuracy than the base CNN (79.5% vs. 75.7%). Though the final emotion accuracy is slightly lower than the initial emotion prediction (78.5% vs. 79.5%), this is expected since interpretability typically trades-off accuracy (Gunning and Aha 2019). The ablated accuracy decrease indicates that the saliency pixels are somewhat important. Contrastive Saliency has slightly less importance than Absolute Saliency (13.7% vs. 14.9%), because the former excludes pixels that are commonly important for all classes. Counterfactual synthesis was moderately successful, achieving reasonable reconstruction similarity (reconstruction error MSE = 0.680), good speaker re-identification (60.2% compared to 4.2% random chance), and somewhat recognizable emotion which is significantly better than random chance (30.7% vs. 12.5%). The predictions of cue difference relations were good (71.9%).
Although the counterfactual synthesis accuracy was better than chance, it is still too low to be used by people. Hence, we evaluated instead using Counterfactual Samples (C.Samples), which uses actual voice clips corresponding to the same voice actor (identity), same speech words, but different portrayed contrast emotion. As expected, the identity and emotion accuracies are higher for Samples than Synthetics, but the other performances were comparable.
In the next step, we investigate the usage and usefulness of each explanation type. The focus is on the interactions and interface, rather than investigating whether each explanation as implemented is good enough. Therefore, we select instances with correct predictions and coherent explanations for the user studies. Since the Counterfactual Synthesis performance is limited, we use Counterfactual Samples to represent counterfactual examples instead.
5.2. Think-Aloud User Study
We conducted a formative study with the think-aloud protocol to understand how people 1) naturally infer emotions without AI assistance, and 2) use or misunderstand various explanations.
5.2.1. Experiment Method and Procedure
We recruited 14 participants from a university mailing list. They were 3 males, 11 females, with ages between 21-40 years old. We conducted the study via an online Zoom audio call. The experiment took 40-50 minutes and each participant was compensated with a $7.43 USD coffee gift card. The user task is a human-AI collaborative task for vocal emotion recognition. Given a voice clip, the participant infers the portrayed emotion with or without AI prediction and explanation. We provided 16 voice clips of 2 neutral sentences22 2 Neutral sentences: ”dogs are sitting by the door” and ”kids are talking by the door” intoned to portray 8 emotions. We selected only correct system predictions and explanations, since we were not investigating the impact of erroneous predictions or misleading explanations. The study contains 4 explanation interface conditions: Contrastive Saliency only, Counterfactual Sample voice examples only, Counterfactual Sample and Contrastive Cues, and all 3 explanations together (Fig. 5).
The procedure is: read an introduction, consent to the study, complete a guided tutorial of all explanations (regardless of condition), and start the main study with multiple trials of a vocal emotion recognition task. To limit the participation duration, each participant completes three trials, each trial randomly assigned to an explanation interface condition. For each trial, the participant listened to a voice clip, and gave an initial label of the emotion. On the next page, the participant was shown the system’s prediction with (or without) explanation based on the assigned condition. She could then revise her emotion label if she changed her mind. We used the think-aloud protocol to ask participants to articulate their thoughts as they examined the audio clip, prediction and explanations. We also asked them about their perceptions using the interface, and any suggestions for improvement. We describe our findings next.
5.2.2. Findings
We performed thematic analysis on the recorded audio to determine key themes (bolded). We describe our findings in terms of our research questions of how users innately infer vocal emotions, and how they used each explanation type. When inferring on their own (without XAI), participants would focus on specific cues to “check the intonations [pitch variation] for decision” [Participant P12], infer a Sad emotion based on the “flatness of the voice” [P04], or "use shrillness to distinguish between fearful and surprise" [P01]. Participants also relied on changes in tone, which we had not modeled. For example, a rising tone “sounds like the man is asking a question” [P02], “the last word has a questioning tone” [P03] helped participants to infer Surprise. The latter case identified the most relevant segment. In contrast, a "tone going down at the end of sentence" helped P01 infer Sad. Some participants mentally generated their own examples to "imagine what neutral sound like and compare against it" [P05]. These unprompted behaviors suggest the relevance of saliency, counterfactual, and cue explanations.
The usage of explanations was mixed with some benefits and some issues. In general, participants could understand the Saliency maps. P09 saw that “the highlight parts are consistent with my judgment for important words”, referring to ‘talking’ being highlighted. However, several participants had issues with saliency maps. There were some cases with highlights that spanned across multiple words and included highlighting spaces. P08 felt that saliency “should highlight all words”, and P14 “would prefer the color highlighted on text”. This lack of focus made P13 feel that “the color bar is not necessary”. Regularizing the explanation to prioritize highlighting words and penalize highlighting spaces can help align the explanations with user expectations and improve trust (Ross et al. 2017) Next, P11 thought that “the color bar reflects the fluctuation of tone”. While plausible, this indicates the risk of misinterpreting technical visualizations for explanations. Finally, P12 “used the saliency bar by listening to the highlighted part of the words, and try to infer based on intonation. But I think the highlighting in this example is not accurate”. This demonstrates causal oversimplification by reasoning with one factor rather than multiple factors (Damer 2012; Lim and Dey 2011a).
Many participants found Counterfactual samples “intuitive”. P11 could “check whether it’s consistent with my intuition” by mentally comparing the similarity of the target audio clip (sad) with clips for other suspected emotions (neutral, sad, happy). Unfortunately, her intuition was somewhat flawed, since she inferred Neutral which was wrong. P12 found counterfactuals “helpful to have a reference state, then I will also check the intonations for my decision.” Conversely, some participants felt counterfactual samples were not helpful. P06 felt that the “clips [neutral and calm] are too similar”. Had she received deeper explanations with saliency map or cue differences, she would have had more information about where and what the differences were, respectively.
Cues were used to check semantic consistency. P04 used cues to “confirm my judgment” and found that the “low shrillness [of Sad] is consistent with my understanding.” However, some participants perceived inconsistencies. P13 thought that “some cue descriptions were not consistent with my perception”, and disagreed with the system that Speaking Rate was similar for the Happy and Surprised audio clips. Along with the earlier case of P06, this suggests differences in perceptual acuity of cues between the user and system.
Finally, some participants felt that Counterfactual samples were more useful than Contrastive Cues. P11 found that “the comparison voice part is more helpful than the text part, though the text part is also helpful to reinforce my decision.” This could be due to cognitive load and differences between mental dual processing (Kahneman 2011). Many participants considered the audio samples “quite intuitive” [P04]. They used System 1 thinking which is fast, though they did not articulate why this was simple. In contrast, they found that “it’s hard to describe or understand the voice cue patterns” [P04]. P10 felt that “compared with [audio] clips, cue pattern is too abstract to use for comparison.” This requires slower System 2 thinking. Another possible reason is that the audio clip has higher information bandwidth than the 6 verbally presented semantic cues. Participants can perceive the gestalt (Koffka 2013) of the audio to make their inferences.
5.3. Controlled User Study
Having identified various benefits and usages of contrastive explanation, we next conducted a summative controlled study to understand: 1) how well participants could infer vocal emotions on their own, and with model predictions and explanations, and 2) how various explanations affect perceived helpfulness.
5.3.1. Experiment Design and Apparatus
We conducted a between-subjects experiment with XAI Type as the independent variable with 5 levels of explanations (None, Contrastive Saliency, Counterfactual Sample, Counterfactual + Contrastive Cues, and Saliency + Counterfactual + Cues). The user task is to label the portrayed emotion in a voice clip with feedback from the AI in one of the XAI Types. We included emotion as a random variable with 8 levels . Having many emotions helps to make the task more challenging to test. Fig. 5 shows the UI with all explanations together, and others are shown in Supplementary Figs. 7-11. For dependent variables, we measured decision quality (emotion label correctness and confidence), understanding of cue differences, task times, decision confidence, and perceived system helpfulness. Labeling correctness was measured with a “balls and bins” question (Goldstein and Rothschild 2014) that elicits the probability of multiple labels. Cue difference understanding was measured per cue with a multiple choice question for the cue difference relation between a randomly selected contrast emotion label and the target voice clip. Task times were logged for different pages. Perceptions were measured as ratings on a 7-point Likert scale ( Strongly Disagree, Strongly Agree). We asked two text questions about the rationale for perceived helpfulness and how the explanation was used. This was posed only twice to limit fatigue. See Supplementary Figs. 7-12 for the survey.
5.3.2. Experiment Procedure
The participant reads an introduction, consents to the study, reads a short tutorial about the explanation interfaces, and completes a screening test of audio equipment, auditory acuity, and UI understanding (Supplementary Figs. 2-4), where she: a) listens to a voice clip and chooses the correct spoken words, b) reads a saliency map and identifies important words, and c) identifies easy cue differences between two voice clips.
After passing screening (with all questions correct), the participant is randomly assigned to an XAI Type and commences a practice session. Similar to (Lim et al. 2009), we conducted the practice session to enable the participant to learn from any model explanations how the system predicts the emotion. She is encouraged to study these cases carefully, since she will not see the correct predictions later in the main study. The practice session comprises 8 trials, where each trial has three pages: i) Pre-AI to listen to a voice clip, label the emotion without AI assistance. We assess the labeling correctness here to estimate the Participant Unaided Skill, i.e., whether the participant has above- or below-average skill in recognizing vocal emotions. ii) Post-XAI to read any explanation feedback (without seeing the system prediction, label the emotion (again), and answer questions about cue difference understanding, and perceived ratings. iii) Review to examine the correct emotion label (same as the system prediction) with any AI explanations, and the participant’s previous answer, and write any free-form notes (open text).
After the practice session, the participant engages in the main study with the same XAI Type in two sessions with 8 trials each and a break in-between. Each trial is presented on one page where the participant: i) listens to the voice clip, ii) views any explanation feedback, iii) labels the emotion, and iv) rates perceptions. This evaluates human-simulatability (Lim et al. 2009; Lipton 2018) by deeply testing the participant’s understanding to apply explanations to new instances. To control any fatigue effects due to the moderate number of trials, we randomized the order of instances. We asked the rationale questions randomly in one trial per main session. The participant is incentivized to be fast and correct with a maximum $0.50 USD bonus for completing all trials within 8 minutes. The bonus is pro-rated by the number of correct emotion labels. Maximum bonus is $1.00 for two sessions over a base compensation of $3.00 USD. The participant ends with answering demographic questions.
5.3.3. Statistical Analysis and Quantitative Results
We recruited 175 participants from Amazon Mechanical Turk with high qualifications ( completed HITs with >97% approval rate). They were 52.0% male, with ages 21-70 (Median = 36). Participants took 27.4 minutes (median) to complete the survey. We excluded 14 participants who completed the survey without playing any voice clips.

For each dependent variable, we fit a linear mixed-effects model with XAI Type, Emotion, Voice Clip, Participant Unaided Skill and Trial Number as main fixed effects, and Participant as random effect. We did not find any significant interaction effects. See Supplementary Table 1 for details. We report significant results at a stricter significance level (p<.005) to account for multiple comparisons.
Regarding emotion labeling in the Pre-AI Practice Trials, participants recognized some emotions better than others (Fig. 6a) and perceived different cues with varying accuracies (Fig. 6b), indicating that speaking rate and shrillness could be most verifiable in explanations, while pause proportion and pitch variation may be least. Furthermore, there was a wide range of average correctness among participants (M=49.9%, SD=18.3%), so we divided participants by whether they had above- or below-average unaided skill.
Analyzing the Main Trials, we found varying performances and perceptions due to different XAI Types (Fig. 7). Although participants may select a wrong emotion label as most likely, they may still select the correct label with low confidence in the balls and bins question. Hence, we analyzed the Confidence on Correct Label to determine the participant’s decision quality. Results were similar when analyzing with labeling correctness. Fig. 7 shows that providing Counterfactual Sample voices with Cues (C.Sample + Cues) were most effective and significantly better than not providing any explanation (None), p=.0007. Omitting the cues (C.Sample) led to a decrease in decision quality such that the difference from None was marginal, p=.0160. Providing Contrastive Saliency explanations did not help to improve decision quality, and, surprisingly, neither did providing all explanations combined together. All XAI Types were rated as more helpful than None, though Saliency was only marginally so (p=.0443). All participants were equally confident (p=n.s.) in their emotion labels across XAI Types (Median=2 on -3 to 3 Likert scale). There was no difference in task time to label the emotions, though the most complex explanations (Saliency + C.Sample + Cues) was only 4.1 sec longer than None (26.1 vs. 21.0s).
5.3.4. Qualitative Results
We report why participants found specific XAI Types helpful or unhelpful and how they used them. Some participants depended on their own ability than rely on explanations, e.g., "I don’t think that the [Saliency] explanation information is helpful. I think that the voice is all you really need to be able to determine an emotion." [P169], "I didn’t [use C.Sample] for the most part. I trust my own instincts." [P54], "I think [Saliency + C.Sample + Cues] took longer than just listening to the clip … I glance over it, but it doesn’t affect my decision as much" [P121].
Some participants struggled to use the Contrastive Saliency map. P26 found it "difficult to parse … hard to analyze it by eye)". Errors in the Saliency explanations also led to distrust, as described by P8 that "the highlighted moments for Fearful don’t match well with [the] voice". Conversely, the sophistication of the explanation led to over-trusting, with P146 mentioning that it was "helpful to view the color bar to determine which part has the most importance", yet, this shallow interpretation led to him labeling wrongly. P117 commented that she was "unable to listen to different ratings the system has given to each emotion", indicating her desire to hear other samples.
Counterfactual Sample explanations were more appreciated and marginally effective in improving decision quality. P38 felt that the "emotion in the clip is very clearly anger and it helped to hear the system show me what this voice would sound like when angry"; thus, she was matching samples by their perceived similarity. Similarly, P132 "first made my own judgment to narrow down the possible emotions, then listen to those emotions. I rate the one that matches the highest." In contrast, P14 felt that C.Sample was "helpful to tell the difference between the neutral and calm voice" and "tried to see if there was a change in inflection or speed". P103 felt that "it is slightly far away from the sample clip, every single one of them", suggesting that he would appreciate Counterfactual Synthetics which would be generated to be more similar. Finally, P54 demurred that "the explanation information doesn’t elaborate at all why it’s giving that determination, so it’s mostly not helpful"; this indicates the need for deeper semantic explanations which C.Sample + Cues provides.
Instead of manually perceiving similarities or differences in voice clips, participants could read the cue differences in the Counterfactual Sample + Cues explanation. Their analytical understanding improved, as demonstrated in the vocabulary of their rationalization; e.g., P119 had a "better sense of the speaker’s pitch, loudness". The semantic knowledge provided by cues also helped to reduce cognitive burden, e.g., P168 "used the information to confirm something I feel ambiguous about or just to make a guess and not have to spend so much effort deciding between guesses." Specifically, cues helped to focus participants’ analyses, e.g., P90 found the explanation “helpful in letting you figure out what qualities to try to isolate in the voice clip to decide on where it learns in terms of emotion.”
Finally, although participants perceived Saliency + Counterfactual Sample + Cues as helpful, it did not improve decision quality. Participants rationalized the explanations by describing its various components separately, e.g., "it helps pinpoint what parts to listen to" [P31, Saliency], "the sample clips for each emotion are [helpful]" [P163, C.Sample], "compare the voices and the levels (like shrillness and pitch)" [P15, Cues]. However, no one explicitly described multiple components together, and there were few explicit descriptions about the saliency map. Perhaps, participants could not focus on specific explanation details. P167 was "not sure how to apply cross the broad", suggesting an issue with information overload.
5.4. Summary of Results
We summarize the results from our three evaluation studies. The modeling study showed that RexNet provides relevant Saliency explanations, accurate Contrastive Cues explanations, and promising Counterfactual Synthetics. These explanations helped to improve RexNet’s performance over the base CNN. The think-aloud user study showed that RexNet explanations align with how users innately perceive and infer vocal emotions, validating the XAI Perceptual Processing framework. We identified limitations in user perception and reasoning that led to some interpretation issues. The controlled user study showed that some relatable explanations can improve decision quality without sacrificing task time, especially Counterfactual Samples with semantic Cues. Saliency visualization is too technically sophisticated to be useful, and combining it with Counterfactual Samples and Cues could improve the perceived helpfulness, but also confuse or distract participants to decide poorly.
6. Discussion
Having evaluated our framework for relatable explainable AI, we discuss their usefulness, improvements to our approach and experiment, implications for human-centric XAI, and generalization.
6.1. Usefulness of Relatable Explanations
Our proposed XAI Perceptual Processing Framework and RexNet architecture unifies different explanations towards relatability. We have rationalized their relevance based on cognitive theories, demonstrated their benefit to improving model prediction performance, and partially validated their usefulness in user studies. We discuss takeaways for XAI developers to design relatable explanations.
The effectiveness of Counterfactual + Cues explanations indicates the value of augmenting example-based explanations with semantic information. However, we found that saliency explanations had limited usefulness. Furthermore, adding Saliency to Counterfactual + Cues nullifies any benefits of the latter. Our findings contradict those by Wang et al. (Wang and Yin 2021) that attribution explanations were more useful than counterfactuals, possibly due to the difference of interpreting structured or unstructured data. Despite many XAI techniques being developed as saliency maps (e.g., (Zhang and Zhu 2018)), there have been recent calls to develop more meaningful explanations of image prediction tasks (Ghorbani et al. 2019). Thus, saliency maps should not be used or need to be made more precisely correct (e.g., through model training or regularizations) and more semantically meaningful.
To address the weaknesses of some relatable explanations, we discuss ways to further improve their effectiveness. Using counterfactual synthetics, instead of counterfactual samples would refine the difference between the example and target, so this may focus the user’s attention to more meaningful differences and improve discriminating between concepts. Moreover, our current approach identifies one set of cue differences across multiple salient locations. Instead, different cue sets can be associated with specific highlights in the saliency map. This can provide more semantics to various parts of a saliency map, to indicate why particular regions were important, and improve the usefulness of saliency maps.
6.2. User Evaluation of Relatable Explanations
We chose to evaluate with vocal emotion recognition since it is an everyday task that is feasible to test with lay users. However, most people are already innately skilled in this, so this diminishes their need for AI or XAI to help them. Conversely, relatable explanations may be more useful for more analytical tasks and applications with more explicit domain knowledge (e.g., engine noise diagnosis).
We had identified several potential confounds — fatigue, skill at recognizing emotions, participants copying system predictions, learning effects from exposure to prior XAI versions — and discuss how we mitigated them. 1) We controlled for fatigue by: a) providing breaks between sessions, b) randomizing instances across trial numbers. We checked for fatigue by measuring: a) repeatedly identical responses (no participants were disqualified), b) decreases in labeling correctness over trials (no significant difference). 2) We controlled for recognition skills by measuring labeling performance without XAI (Pre-AI) and analyzed our results with that as a factor. 3) A more realistic use of AI is for it to make predictions and the user would verify its decision. However, in a pilot study evaluating with this task, we found that participants may copy the prediction rather than study the explanation, thus leading to over-trusting (Yin et al. 2019) and diminishing the usefulness of explanations to improve decision quality. We mitigated copying by evaluating with a human-simulatability task, instead of a predicted label verification task, though this trades-off some ecological validity. 4) We mitigated learning effects by designing the experiment as between-subjects, otherwise, participants may exploit new knowledge in subsequent experiment conditions (with weaker explanations).
6.3. More relatable vocal emotion explanations
This work is the first to explore relatable explanations for vocal emotion prediction, with an initial set of cues and adequate explanation accuracy. Future work can leverage other vocal stimulus types and prosodic attributes (Lausen and Hammerschmidt 2020), such as non-verbal expressions, affect bursts, and lexical information. In particular, we learned that participants focus on the change in tone in voices to infer emotion, so this should be included as a vocal cue. Counterfactual synthesis accuracy can be improved by using newer generators, such as Sequence-to-Sequence Voice Conversion (Kameoka et al. 2020), StarGAN-VC v2 (Kaneko et al. 2019). Though generated from a unified architecture, the explanations still had some inconsistencies. Annotating and debiasing explanations (Li et al. 2018; Zhang et al. 2020) could help to align explanations with user expectations (Ross et al. 2017) and improve the coherence between explanation types. Contrastive Cue relations were encoded as a table, but they could be represented as another data structure (e.g., decision trees or causal graphs) to better fit human mental models. Finally, further testing could evaluate the usage and usefulness of predictions and explanations in in-the-wild applications (Lim and Dey 2013), such as with smart speakers (e.g., Amazon Echo) (Maharjan et al. 2019), smartphone digital assistants for mental health or emotion monitoring (Wang et al. 2014; Ben-Zeev et al. 2015), or AI coaching for call center employees (Gorrostieta et al. 2018; Luo et al. 2021; Petrushin 1999).
6.4. Relatability for human-centric XAI
Although many XAI techniques have been recently developed, many remain too technical, or focus on supporting data scientists and machine learning model developers. Instead, there is a growing call to support different stakeholders and less technical users (Ehsan et al. 2018; Liao et al. 2020; Cheng et al. 2019) Towards this end, we have studied human perception and cognition to determine new requirements for XAI. Miller had argued for contrastive and counterfactual explanations based on philosophical and psychological principles (Miller 2019). This was extended by Wang et al. to identify human reasoning pathways that can be supported by specific XAI techniques (Wang and Yin 2021). We extend these perspectives by identifying a broader requirement that explanations need to be relatable and contextualized to be more meaningfully interpreted. Specifically, we supported four criteria for relatability: contrastive concepts, saliency, counterfactuals, and associated cues. Extending our work, explanations can be made more relatable by providing for other criteria such as: social proof (Cialdini et al. 1999; Miller 2019), narrative stories (Segel and Heer 2010) or rationalizations (Ehsan et al. 2018), analogies (Gentner and Smith 2012), user-defined concepts (Kim et al. 2018; Zhou et al. 2018; Ghorbani et al. 2019), and plausible explanations (Ross et al. 2017). Moreover, human cognition has natural flaws, like cognitive biases and limited working memory. XAI should include designs and capabilities to mitigate cognitive biases (Wang et al. 2019), moderate cognitive load (Abdul et al. 2020), and accommodate information handling preferences (Wang et al. 2021). Relatable explanations may need to account for these human factors to communicate why they may deviate from human reasoning.
The XAI Perceptual Processing Framework was inspired by human perceptual reasoning, rather than higher-level cognition. The latter is relevant for complex decision-making tasks, such as doctors’ reasoning with disease models, which are specific cases of causal structural models. Wang et al. proposed the XAI Reasoning Framework based on human reasoning processes (Wang et al. 2019), but this was not explicitly implemented in a single machine learning architecture. The Intelligibility Toolkit (Lim and Dey 2010) provided an API to automatically generate explanations to a taxonomy of questions (Lim and Dey 2009; Liao et al. 2020), but this was not implemented for deep learning. Future work can explore a meta-model that combines perceptual and reasoning faculties for more complex, human-like model explanations.
6.5. Generalization of Relatable XAI
Although we implemented RexNet for the application of vocal emotion recognition, the XAI Perceptual Processing Framework is generalizable to other audio and visual prediction applications. Other audio applications include equipment monitoring via vibrations (Wegerich et al. 2003), and heart murmur diagnosis (Reed et al. 2004). 1) Saliency can be highlighted on a spectrogram of vibration signals for trained engineers to interpret, or highlighted on auscultation diagrams for clinicians. 2) Counterfactual samples can be archetypal sounds of engine failure, specific heart disease (e.g., crescendo-decrescendo murmur in aortic stenosis), etc. 3) Cues can be the sound profiles, such as engine pinging, or a seagull cry sound in heart murmurs.
For vision perception (e.g., image recognition) tasks, relatable explanations can be as follows. 1) Saliency can be presented, as is common, as a heatmap to identify important pixels for a decision, such as highlighting the eyes and mouth of a happy face (Jain et al. 2018)), or papillary, sclerotic, solid, and hemorrhagic growth patterns for cancer in a histology image (Rakhlin et al. 2018). 2) Counterfactual samples can be based on canonical (prototype) or critical (almost ambiguous) examples (Kim et al. 2016), such as feminizing male faces (Xiao et al. 2018; He et al. 2019) or changing a scene from day to night (Zhu et al. 2017). 3) Cues can include visual cues, such as depth, motion, color, and contrast (Posner et al. 1976).
7. Conclusion
We presented the XAI Perceptual Processing Framework to unify a set of contrastive, saliency, counterfactual and cues explanations towards relatable explainable AI. The framework was implemented with RexNet, a modular multi-task deep neural network with multiple explanations, trained to predict vocal emotions. From qualitative think-aloud and quantitative controlled studies, we found varying usage and usefulness across the relatable contrastive explanations. This work gives insights into providing and evaluating relatable contrastive explainable AI for perception applications, and contributes a new basis towards human-centered XAI.
Acknowledgements.
This work was supported in part by the Ministry of Education, Singapore under the grant T2EP20121-0040, and was carried out at the NUS Centre for Research in Privacy Technologies (N-CRiPT) and the NUS Institute for Health Innovation and Technology (iHealthtech).References
- (1)
- Abdul et al. (2018) Ashraf Abdul, Jo Vermeulen, Danding Wang, Brian Y Lim, and Mohan Kankanhalli. 2018. Trends and trajectories for explainable, accountable and intelligible systems: An hci research agenda. In Proceedings of the 2018 CHI conference on human factors in computing systems. 1–18.
- Abdul et al. (2020) Ashraf Abdul, Christian von der Weth, Mohan Kankanhalli, and Brian Y Lim. 2020. COGAM: Measuring and Moderating Cognitive Load in Machine Learning Model Explanations. In Proceedings of the 2020 CHI Conference on Human Factors in Computing Systems. 1–14.
- Adadi and Berrada (2018) Amina Adadi and Mohammed Berrada. 2018. Peeking inside the black-box: a survey on explainable artificial intelligence (XAI). IEEE access 6 (2018), 52138–52160.
- Agrawal and Ganapathy (2020) Purvi Agrawal and Sriram Ganapathy. 2020. Interpretable representation learning for speech and audio signals based on relevance weighting. IEEE/ACM Transactions on Audio, Speech, and Language Processing 28 (2020), 2823–2836.
- Amodei et al. (2016) Dario Amodei, Sundaram Ananthanarayanan, Rishita Anubhai, Jingliang Bai, Eric Battenberg, Carl Case, Jared Casper, Bryan Catanzaro, Qiang Cheng, Guoliang Chen, et al. 2016. Deep speech 2: End-to-end speech recognition in english and mandarin. In International conference on machine learning. PMLR, 173–182.
- Anderson et al. (2020) Andrew Anderson, Jonathan Dodge, Amrita Sadarangani, Zoe Juozapaitis, Evan Newman, Jed Irvine, Souti Chattopadhyay, Matthew Olson, Alan Fern, and Margaret Burnett. 2020. Mental models of mere mortals with explanations of reinforcement learning. ACM Transactions on Interactive Intelligent Systems (TiiS) 10, 2 (2020), 1–37.
- Arrieta et al. (2020) Alejandro Barredo Arrieta, Natalia Díaz-Rodríguez, Javier Del Ser, Adrien Bennetot, Siham Tabik, Alberto Barbado, Salvador García, Sergio Gil-López, Daniel Molina, Richard Benjamins, et al. 2020. Explainable Artificial Intelligence (XAI): Concepts, taxonomies, opportunities and challenges toward responsible AI. Information Fusion 58 (2020), 82–115.
- Bach et al. (2015) Sebastian Bach, Alexander Binder, Grégoire Montavon, Frederick Klauschen, Klaus-Robert Müller, and Wojciech Samek. 2015. On pixel-wise explanations for non-linear classifier decisions by layer-wise relevance propagation. PloS one 10, 7 (2015), e0130140.
- Ben-Zeev et al. (2015) Dror Ben-Zeev, Emily A Scherer, Rui Wang, Haiyi Xie, and Andrew T Campbell. 2015. Next-generation psychiatric assessment: Using smartphone sensors to monitor behavior and mental health. Psychiatric rehabilitation journal 38, 3 (2015), 218.
- Byrne (2007) Ruth MJ Byrne. 2007. The rational imagination: How people create alternatives to reality. MIT press.
- Cai et al. (2019a) Carrie J Cai, Jonas Jongejan, and Jess Holbrook. 2019a. The effects of example-based explanations in a machine learning interface. In Proceedings of the 24th international conference on intelligent user interfaces. 258–262.
- Cai et al. (2019b) Carrie J Cai, Emily Reif, Narayan Hegde, Jason Hipp, Been Kim, Daniel Smilkov, Martin Wattenberg, Fernanda Viegas, Greg S Corrado, Martin C Stumpe, et al. 2019b. Human-centered tools for coping with imperfect algorithms during medical decision-making. In Proceedings of the 2019 CHI Conference on Human Factors in Computing Systems. 1–14.
- Carterette and Friedman (1978) Edward C. Carterette and Morton P. Friedman (Eds.). 1978. Perceptual processing. Academic Press, New York.
- Cheng et al. (2019) Hao-Fei Cheng, Ruotong Wang, Zheng Zhang, Fiona O’Connell, Terrance Gray, F Maxwell Harper, and Haiyi Zhu. 2019. Explaining decision-making algorithms through UI: Strategies to help non-expert stakeholders. In Proceedings of the 2019 chi conference on human factors in computing systems. 1–12.
- Cheng et al. (2008) Jianlin Cheng, Zheng Wang, and Gianluca Pollastri. 2008. A neural network approach to ordinal regression. In 2008 IEEE international joint conference on neural networks (IEEE world congress on computational intelligence). IEEE, 1279–1284.
- Choi et al. (2018) Yunjey Choi, Minje Choi, Munyoung Kim, Jung-Woo Ha, Sunghun Kim, and Jaegul Choo. 2018. Stargan: Unified generative adversarial networks for multi-domain image-to-image translation. In Proceedings of the IEEE conference on computer vision and pattern recognition. 8789–8797.
- Cialdini et al. (1999) Robert B Cialdini, Wilhelmina Wosinska, Daniel W Barrett, Jonathan Butner, and Malgorzata Gornik-Durose. 1999. Compliance with a request in two cultures: The differential influence of social proof and commitment/consistency on collectivists and individualists. Personality and Social Psychology Bulletin 25, 10 (1999), 1242–1253.
- Coppers et al. (2018) Sven Coppers, Jan Van den Bergh, Kris Luyten, Karin Coninx, Iulianna Van der Lek-Ciudin, Tom Vanallemeersch, and Vincent Vandeghinste. 2018. Intellingo: an intelligible translation environment. In Proceedings of the 2018 CHI Conference on Human Factors in Computing Systems. 1–13.
- Damer (2012) T Edward Damer. 2012. Attacking faulty reasoning. Cengage Learning.
- Dhurandhar et al. ([n.d.]) Amit Dhurandhar, Pin-Yu Chen, Ronny Luss, Chun-Chen Tu, Paishun Ting, Karthikeyan Shanmugam, and Payel Das. [n.d.]. Explanations based on the Missing: Towards Contrastive Explanations with Pertinent Negatives. Ann Arbor 1001 ([n. d.]), 48109.
- Ehsan et al. (2018) Upol Ehsan, Brent Harrison, Larry Chan, and Mark O Riedl. 2018. Rationalization: A neural machine translation approach to generating natural language explanations. In Proceedings of the 2018 AAAI/ACM Conference on AI, Ethics, and Society. 81–87.
- Ehsan et al. (2021) Upol Ehsan, Q Vera Liao, Michael Muller, Mark O Riedl, and Justin D Weisz. 2021. Expanding explainability: Towards social transparency in ai systems. In Proceedings of the 2021 CHI Conference on Human Factors in Computing Systems. 1–19.
- Eiband et al. (2018) Malin Eiband, Hanna Schneider, Mark Bilandzic, Julian Fazekas-Con, Mareike Haug, and Heinrich Hussmann. 2018. Bringing transparency design into practice. In 23rd international conference on intelligent user interfaces. 211–223.
- Gentner and Smith (2012) Dedre Gentner and Linsey Smith. 2012. Analogical reasoning. Encyclopedia of human behavior 2 (2012), 130–136.
- Ghorbani et al. (2019) Amirata Ghorbani, James Wexler, James Y Zou, and Been Kim. 2019. Towards Automatic Concept-based Explanations. Advances in Neural Information Processing Systems 32 (2019), 9277–9286.
- Goldstein and Rothschild (2014) Daniel G Goldstein and David Rothschild. 2014. Lay understanding of probability distributions. Judgment & Decision Making 9, 1 (2014).
- Goldstein (2014) E Bruce Goldstein. 2014. Cognitive psychology: Connecting mind, research and everyday experience. Cengage Learning.
- Gorrostieta et al. (2018) Cristina Gorrostieta, Richard Brutti, Kye Taylor, Avi Shapiro, Joseph Moran, Ali Azarbayejani, and John Kane. 2018. Attention-based Sequence Classification for Affect Detection.. In Interspeech. 506–510.
- Goyal et al. (2019) Yash Goyal, Ziyan Wu, Jan Ernst, Dhruv Batra, Devi Parikh, and Stefan Lee. 2019. Counterfactual visual explanations. In International Conference on Machine Learning. PMLR, 2376–2384.
- Guidotti et al. (2018) Riccardo Guidotti, Anna Monreale, Salvatore Ruggieri, Franco Turini, Fosca Giannotti, and Dino Pedreschi. 2018. A survey of methods for explaining black box models. ACM computing surveys (CSUR) 51, 5 (2018), 1–42.
- Gunning and Aha (2019) David Gunning and David Aha. 2019. DARPA’s explainable artificial intelligence (XAI) program. AI Magazine 40, 2 (2019), 44–58.
- He et al. (2019) Zhenliang He, Wangmeng Zuo, Meina Kan, Shiguang Shan, and Xilin Chen. 2019. Attgan: Facial attribute editing by only changing what you want. IEEE transactions on image processing 28, 11 (2019), 5464–5478.
- Hendricks et al. (2018) Lisa Anne Hendricks, Ronghang Hu, Trevor Darrell, and Zeynep Akata. 2018. Generating Counterfactual Explanations with Natural Language. In ICML Workshop on Human Interpretability in Machine Learning. 95–98.
- Hershey et al. (2017) Shawn Hershey, Sourish Chaudhuri, Daniel PW Ellis, Jort F Gemmeke, Aren Jansen, R Channing Moore, Manoj Plakal, Devin Platt, Rif A Saurous, Bryan Seybold, et al. 2017. CNN architectures for large-scale audio classification. In 2017 ieee international conference on acoustics, speech and signal processing (icassp). IEEE, 131–135.
- Hilton (1990) Denis J Hilton. 1990. Conversational processes and causal explanation. Psychological Bulletin 107, 1 (1990), 65.
- Hohman et al. (2018) Fred Hohman, Minsuk Kahng, Robert Pienta, and Duen Horng Chau. 2018. Visual analytics in deep learning: An interrogative survey for the next frontiers. IEEE transactions on visualization and computer graphics 25, 8 (2018), 2674–2693.
- Huang et al. (2014) Zhengwei Huang, Ming Dong, Qirong Mao, and Yongzhao Zhan. 2014. Speech emotion recognition using CNN. In Proceedings of the 22nd ACM international conference on Multimedia. 801–804.
- Jain et al. (2018) Neha Jain, Shishir Kumar, Amit Kumar, Pourya Shamsolmoali, and Masoumeh Zareapoor. 2018. Hybrid deep neural networks for face emotion recognition. Pattern Recognition Letters 115 (2018), 101–106.
- Juslin and Laukka (2001) Patrik N Juslin and Petri Laukka. 2001. Impact of intended emotion intensity on cue utilization and decoding accuracy in vocal expression of emotion. Emotion 1, 4 (2001), 381.
- Kahneman (2011) Daniel Kahneman. 2011. Thinking, fast and slow. Macmillan.
- Kameoka et al. (2018) Hirokazu Kameoka, Takuhiro Kaneko, Kou Tanaka, and Nobukatsu Hojo. 2018. Stargan-vc: Non-parallel many-to-many voice conversion using star generative adversarial networks. In 2018 IEEE Spoken Language Technology Workshop (SLT). IEEE, 266–273.
- Kameoka et al. (2020) Hirokazu Kameoka, Kou Tanaka, Damian Kwaśny, Takuhiro Kaneko, and Nobukatsu Hojo. 2020. ConvS2S-VC: Fully convolutional sequence-to-sequence voice conversion. IEEE/ACM Transactions on Audio, Speech, and Language Processing 28 (2020), 1849–1863.
- Kaneko et al. (2019) Takuhiro Kaneko, Hirokazu Kameoka, Kou Tanaka, and Nobukatsu Hojo. 2019. StarGAN-VC2: Rethinking conditional methods for StarGAN-based voice conversion. arXiv preprint arXiv:1907.12279 (2019).
- Karras et al. (2019) Tero Karras, Samuli Laine, and Timo Aila. 2019. A style-based generator architecture for generative adversarial networks. In Proceedings of the IEEE/CVF Conference on Computer Vision and Pattern Recognition. 4401–4410.
- Kenton and Toutanova (2019) Jacob Devlin Ming-Wei Chang Kenton and Lee Kristina Toutanova. 2019. BERT: Pre-training of Deep Bidirectional Transformers for Language Understanding. In Proceedings of NAACL-HLT. 4171–4186.
- Kim et al. (2016) Been Kim, Rajiv Khanna, and Oluwasanmi O Koyejo. 2016. Examples are not enough, learn to criticize! criticism for interpretability. Advances in neural information processing systems 29 (2016).
- Kim et al. (2018) Been Kim, Martin Wattenberg, Justin Gilmer, Carrie Cai, James Wexler, Fernanda Viegas, et al. 2018. Interpretability beyond feature attribution: Quantitative testing with concept activation vectors (tcav). In International conference on machine learning. PMLR, 2668–2677.
- Koffka (2013) Kurt Koffka. 2013. Principles of Gestalt psychology. Routledge.
- Koh and Liang (2017) Pang Wei Koh and Percy Liang. 2017. Understanding black-box predictions via influence functions. In International Conference on Machine Learning. PMLR, 1885–1894.
- Krizhevsky et al. (2012) Alex Krizhevsky, Ilya Sutskever, and Geoffrey E Hinton. 2012. Imagenet classification with deep convolutional neural networks. Advances in neural information processing systems 25 (2012), 1097–1105.
- Krug et al. (2018) Andreas Krug, René Knaebel, and Sebastian Stober. 2018. Neuron activation profiles for interpreting convolutional speech recognition models. In NeurIPS Workshop on Interpretability and Robustness in Audio, Speech, and Language (IRASL).
- Krug and Stober (2018) Andreas Krug and Sebastian Stober. 2018. Introspection for convolutional automatic speech recognition. In Proceedings of the 2018 EMNLP Workshop BlackboxNLP: Analyzing and Interpreting Neural Networks for NLP. 187–199.
- Lausen and Hammerschmidt (2020) Adi Lausen and Kurt Hammerschmidt. 2020. Emotion recognition and confidence ratings predicted by vocal stimulus type and prosodic parameters. Humanities and Social Sciences Communications 7, 1 (2020), 1–17.
- Le et al. (2020) Thai Le, Suhang Wang, and Dongwon Lee. 2020. GRACE: Generating Concise and Informative Contrastive Sample to Explain Neural Network Model’s Prediction. In Proceedings of the 26th ACM SIGKDD International Conference on Knowledge Discovery & Data Mining. 238–248.
- Letham et al. (2015) Benjamin Letham, Cynthia Rudin, Tyler H McCormick, and David Madigan. 2015. Interpretable classifiers using rules and bayesian analysis: Building a better stroke prediction model. The Annals of Applied Statistics 9, 3 (2015), 1350–1371.
- Li et al. (2020) Chung-Yi Li, Pei-Chieh Yuan, and Hung-Yi Lee. 2020. What does a network layer hear? analyzing hidden representations of end-to-end asr through speech synthesis. In ICASSP 2020-2020 IEEE International Conference on Acoustics, Speech and Signal Processing (ICASSP). IEEE, 6434–6438.
- Li et al. (2018) Kunpeng Li, Ziyan Wu, Kuan-Chuan Peng, Jan Ernst, and Yun Fu. 2018. Tell me where to look: Guided attention inference network. In Proceedings of the IEEE Conference on Computer Vision and Pattern Recognition. 9215–9223.
- Liao et al. (2020) Q Vera Liao, Daniel Gruen, and Sarah Miller. 2020. Questioning the AI: informing design practices for explainable AI user experiences. In Proceedings of the 2020 CHI Conference on Human Factors in Computing Systems. 1–15.
- Lim and Dey (2009) Brian Y Lim and Anind K Dey. 2009. Assessing demand for intelligibility in context-aware applications. In Proceedings of the 11th international conference on Ubiquitous computing. 195–204.
- Lim and Dey (2010) Brian Y Lim and Anind K Dey. 2010. Toolkit to support intelligibility in context-aware applications. In Proceedings of the 12th ACM international conference on Ubiquitous computing. 13–22.
- Lim and Dey (2011a) Brian Y Lim and Anind K Dey. 2011a. Design of an intelligible mobile context-aware application. In Proceedings of the 13th international conference on human computer interaction with mobile devices and services. 157–166.
- Lim and Dey (2011b) Brian Y Lim and Anind K Dey. 2011b. Investigating intelligibility for uncertain context-aware applications. In Proceedings of the 13th international conference on Ubiquitous computing. 415–424.
- Lim and Dey (2013) Brian Y Lim and Anind K Dey. 2013. Evaluating intelligibility usage and usefulness in a context-aware application. In International Conference on Human-Computer Interaction. Springer, 92–101.
- Lim et al. (2009) Brian Y Lim, Anind K Dey, and Daniel Avrahami. 2009. Why and why not explanations improve the intelligibility of context-aware intelligent systems. In Proceedings of the SIGCHI conference on human factors in computing systems. 2119–2128.
- Lipton (2018) Zachary C Lipton. 2018. The Mythos of Model Interpretability: In machine learning, the concept of interpretability is both important and slippery. Queue 16, 3 (2018), 31–57.
- Livingstone and Russo (2018) Steven R Livingstone and Frank A Russo. 2018. The Ryerson Audio-Visual Database of Emotional Speech and Song (RAVDESS): A dynamic, multimodal set of facial and vocal expressions in North American English. PloS one 13, 5 (2018), e0196391.
- Loweimi et al. (2019) Erfan Loweimi, Peter Bell, and Steve Renals. 2019. On Learning Interpretable CNNs with Parametric Modulated Kernel-Based Filters.. In INTERSPEECH. 3480–3484.
- Luo et al. (2021) Xueming Luo, Marco Shaojun Qin, Zheng Fang, and Zhe Qu. 2021. Artificial Intelligence Coaches for Sales Agents: Caveats and Solutions. Journal of Marketing 85, 2 (2021), 14–32.
- Ma-Kellams and Lerner (2016) Christine Ma-Kellams and Jennifer Lerner. 2016. Trust your gut or think carefully? Examining whether an intuitive, versus a systematic, mode of thought produces greater empathic accuracy. Journal of personality and social psychology 111, 5 (2016), 674.
- Maharjan et al. (2019) Raju Maharjan, Per Bækgaard, and Jakob E Bardram. 2019. "Hear me out" smart speaker based conversational agent to monitor symptoms in mental health. In Adjunct Proceedings of the 2019 ACM International Joint Conference on Pervasive and Ubiquitous Computing and Proceedings of the 2019 ACM International Symposium on Wearable Computers. 929–933.
- Mariooryad and Busso (2014) Soroosh Mariooryad and Carlos Busso. 2014. Compensating for speaker or lexical variabilities in speech for emotion recognition. Speech Communication 57 (2014), 1–12.
- Miller (2019) Tim Miller. 2019. Explanation in artificial intelligence: Insights from the social sciences. Artificial intelligence 267 (2019), 1–38.
- Miller (2021) Tim Miller. 2021. Contrastive explanation: A structural-model approach. The Knowledge Engineering Review 36 (2021).
- Mirsamadi et al. (2017) Seyedmahdad Mirsamadi, Emad Barsoum, and Cha Zhang. 2017. Automatic speech emotion recognition using recurrent neural networks with local attention. In 2017 IEEE International Conference on Acoustics, Speech and Signal Processing (ICASSP). IEEE, 2227–2231.
- Montavon et al. (2017) Grégoire Montavon, Sebastian Lapuschkin, Alexander Binder, Wojciech Samek, and Klaus-Robert Müller. 2017. Explaining nonlinear classification decisions with deep taylor decomposition. Pattern Recognition 65 (2017), 211–222.
- Mothilal et al. (2020) Ramaravind K Mothilal, Amit Sharma, and Chenhao Tan. 2020. Explaining machine learning classifiers through diverse counterfactual explanations. In Proceedings of the 2020 Conference on Fairness, Accountability, and Transparency. 607–617.
- Moyer and Bayer (1976) Robert S Moyer and Richard H Bayer. 1976. Mental comparison and the symbolic distance effect. Cognitive Psychology 8, 2 (1976), 228–246.
- Olah et al. (2017) Chris Olah, Alexander Mordvintsev, and Ludwig Schubert. 2017. Feature visualization. Distill 2, 11 (2017), e7.
- Pell and Kotz (2011) Marc D Pell and Sonja A Kotz. 2011. On the time course of vocal emotion recognition. PLoS One 6, 11 (2011), e27256.
- Petrushin (1999) Valery Petrushin. 1999. Emotion in speech: Recognition and application to call centers. In Proceedings of artificial neural networks in engineering, Vol. 710. 22.
- Picard (2000) Rosalind W Picard. 2000. Affective computing.
- Posner et al. (1976) Michael I Posner, Mary J Nissen, and Raymond M Klein. 1976. Visual dominance: an information-processing account of its origins and significance. Psychological review 83, 2 (1976), 157.
- Poursabzi-Sangdeh et al. (2021) Forough Poursabzi-Sangdeh, Daniel G Goldstein, Jake M Hofman, Jennifer Wortman Wortman Vaughan, and Hanna Wallach. 2021. Manipulating and measuring model interpretability. In Proceedings of the 2021 CHI Conference on Human Factors in Computing Systems. 1–52.
- Prabhushankar et al. (2020) Mohit Prabhushankar, Gukyeong Kwon, Dogancan Temel, and Ghassan AlRegib. 2020. Contrastive explanations in neural networks. In 2020 IEEE International Conference on Image Processing (ICIP). IEEE, 3289–3293.
- Pu and Chen (2007) Pearl Pu and Li Chen. 2007. Trust-inspiring explanation interfaces for recommender systems. Knowl. Based Syst. 20 (2007), 542–556.
- Radford et al. (2015) Alec Radford, Luke Metz, and Soumith Chintala. 2015. Unsupervised representation learning with deep convolutional generative adversarial networks. arXiv preprint arXiv:1511.06434 (2015).
- Rakhlin et al. (2018) Alexander Rakhlin, Alexey Shvets, Vladimir Iglovikov, and Alexandr A Kalinin. 2018. Deep convolutional neural networks for breast cancer histology image analysis. In International conference image analysis and recognition. Springer, 737–744.
- Ravanelli and Bengio (2018) Mirco Ravanelli and Yoshua Bengio. 2018. Speaker recognition from raw waveform with sincnet. In 2018 IEEE Spoken Language Technology Workshop (SLT). IEEE, 1021–1028.
- Reed et al. (2004) Todd R. Reed, Nancy E. Reed, and Peter A. Fritzson. 2004. Heart sound analysis for symptom detection and computer-aided diagnosis. Simul. Model. Pract. Theory 12 (2004), 129–146.
- Ribeiro et al. (2016) Marco Tulio Ribeiro, Sameer Singh, and Carlos Guestrin. 2016. " Why should i trust you?" Explaining the predictions of any classifier. In Proceedings of the 22nd ACM SIGKDD international conference on knowledge discovery and data mining. 1135–1144.
- Ribeiro et al. (2018) Marco Tulio Ribeiro, Sameer Singh, and Carlos Guestrin. 2018. Anchors: High-precision model-agnostic explanations. In Proceedings of the AAAI conference on artificial intelligence, Vol. 32.
- Richardson et al. (2006) Matthew Richardson, Amit Prakash, and Eric Brill. 2006. Beyond PageRank: machine learning for static ranking. In Proceedings of the 15th international conference on World Wide Web. 707–715.
- Ross et al. (2017) Andrew Slavin Ross, Michael C Hughes, and Finale Doshi-Velez. 2017. Right for the right reasons: training differentiable models by constraining their explanations. In Proceedings of the 26th International Joint Conference on Artificial Intelligence. 2662–2670.
- Sauter et al. (2010) Disa A Sauter, Frank Eisner, Andrew J Calder, and Sophie K Scott. 2010. Perceptual cues in nonverbal vocal expressions of emotion. Quarterly Journal of Experimental Psychology 63, 11 (2010), 2251–2272.
- Schirmer and Kotz (2006) Annett Schirmer and Sonja A Kotz. 2006. Beyond the right hemisphere: brain mechanisms mediating vocal emotional processing. Trends in cognitive sciences 10, 1 (2006), 24–30.
- Segel and Heer (2010) Edward Segel and Jeffrey Heer. 2010. Narrative visualization: Telling stories with data. IEEE transactions on visualization and computer graphics 16, 6 (2010), 1139–1148.
- Selvaraju et al. (2017) Ramprasaath R Selvaraju, Michael Cogswell, Abhishek Das, Ramakrishna Vedantam, Devi Parikh, and Dhruv Batra. 2017. Grad-cam: Visual explanations from deep networks via gradient-based localization. In Proceedings of the IEEE international conference on computer vision. 618–626.
- Simonyan et al. (2014) Karen Simonyan, Andrea Vedaldi, and Andrew Zisserman. 2014. Deep inside convolutional networks: Visualising image classification models and saliency maps. (2014).
- Sundararajan et al. (2017) Mukund Sundararajan, Ankur Taly, and Qiqi Yan. 2017. Axiomatic attribution for deep networks. In International Conference on Machine Learning. PMLR, 3319–3328.
- Tsai et al. (2021) Chun-Hua Tsai, Yue You, Xinning Gui, Yubo Kou, and John M Carroll. 2021. Exploring and Promoting Diagnostic Transparency and Explainability in Online Symptom Checkers. In Proceedings of the 2021 CHI Conference on Human Factors in Computing Systems. 1–17.
- Tzirakis et al. (2018) Panagiotis Tzirakis, Jiehao Zhang, and Bjorn W Schuller. 2018. End-to-end speech emotion recognition using deep neural networks. In 2018 IEEE International Conference on Acoustics, Speech and Signal Processing (ICASSP). IEEE, 5089–5093.
- van der Waa et al. (2018) J van der Waa, M Robeer, J van Diggelen, M Brinkhuis, and M Neerincx. 2018. Contrastive Explanations with Local Foil Trees. In Proceedings of the ICML Workshop on Human Interpretability in Machine Learning (WHI 2018), Stockholm, Sweden, Vol. 37.
- Wachter et al. (2017) Sandra Wachter, Brent Mittelstadt, and Chris Russell. 2017. Counterfactual explanations without opening the black box: Automated decisions and the GDPR. Harv. JL & Tech. 31 (2017), 841.
- Wang et al. (2019) Danding Wang, Qian Yang, Ashraf Abdul, and Brian Y Lim. 2019. Designing theory-driven user-centric explainable AI. In Proceedings of the 2019 CHI conference on human factors in computing systems. 1–15.
- Wang et al. (2021) Danding Wang, Wencan Zhang, and Brian Y Lim. 2021. Show or suppress? Managing input uncertainty in machine learning model explanations. Artificial Intelligence 294 (2021), 103456.
- Wang et al. (2014) Rui Wang, Fanglin Chen, Zhenyu Chen, Tianxing Li, Gabriella Harari, Stefanie Tignor, Xia Zhou, Dror Ben-Zeev, and Andrew T Campbell. 2014. StudentLife: assessing mental health, academic performance and behavioral trends of college students using smartphones. In Proceedings of the 2014 ACM international joint conference on pervasive and ubiquitous computing. 3–14.
- Wang and Yin (2021) Xinru Wang and Ming Yin. 2021. Are Explanations Helpful? A Comparative Study of the Effects of Explanations in AI-Assisted Decision-Making. In 26th International Conference on Intelligent User Interfaces. 318–328.
- Wegerich et al. (2003) Stephan W. Wegerich, Alan D. Wilks, and R. Matthew Pipke. 2003. Nonparametric modeling of vibration signal features for equipment health monitoring. 2003 IEEE Aerospace Conference Proceedings (Cat. No.03TH8652) 7 (2003), 3113–3121.
- Xiao et al. (2018) Taihong Xiao, Jiapeng Hong, and Jinwen Ma. 2018. Elegant: Exchanging latent encodings with gan for transferring multiple face attributes. In Proceedings of the European conference on computer vision (ECCV). 168–184.
- Yin et al. (2019) Ming Yin, Jennifer Wortman Vaughan, and Hanna Wallach. 2019. Understanding the effect of accuracy on trust in machine learning models. In Proceedings of the 2019 chi conference on human factors in computing systems. 1–12.
- Yoon et al. (2018) Seunghyun Yoon, Seokhyun Byun, and Kyomin Jung. 2018. Multimodal speech emotion recognition using audio and text. In 2018 IEEE Spoken Language Technology Workshop (SLT). IEEE, 112–118.
- Zhang and Zhu (2018) Quanshi Zhang and Song-Chun Zhu. 2018. Visual interpretability for deep learning: a survey. Frontiers of Information Technology & Electronic Engineering 19 (2018), 27–39.
- Zhang et al. (2020) Wencan Zhang, Mariella Dimiccoli, and Brian Y Lim. 2020. Debiased-CAM for bias-agnostic faithful visual explanations of deep convolutional networks. arXiv preprint arXiv:2012.05567 (2020).
- Zhao et al. (2019) Jianfeng Zhao, Xia Mao, and Lijiang Chen. 2019. Speech emotion recognition using deep 1D & 2D CNN LSTM networks. Biomedical Signal Processing and Control 47 (2019), 312–323.
- Zhou et al. (2016) Bolei Zhou, Aditya Khosla, Agata Lapedriza, Aude Oliva, and Antonio Torralba. 2016. Learning deep features for discriminative localization. In Proceedings of the IEEE conference on computer vision and pattern recognition. 2921–2929.
- Zhou et al. (2018) Bolei Zhou, Yiyou Sun, David Bau, and Antonio Torralba. 2018. Interpretable basis decomposition for visual explanation. In Proceedings of the European Conference on Computer Vision (ECCV). 119–134.
- Zhu et al. (2017) Jun-Yan Zhu, Taesung Park, Phillip Isola, and Alexei A Efros. 2017. Unpaired image-to-image translation using cycle-consistent adversarial networks. In Proceedings of the IEEE international conference on computer vision. 2223–2232.
Appendix A Appendix
A.1. Vocal cues for different emotions
A.2. User Study Survey
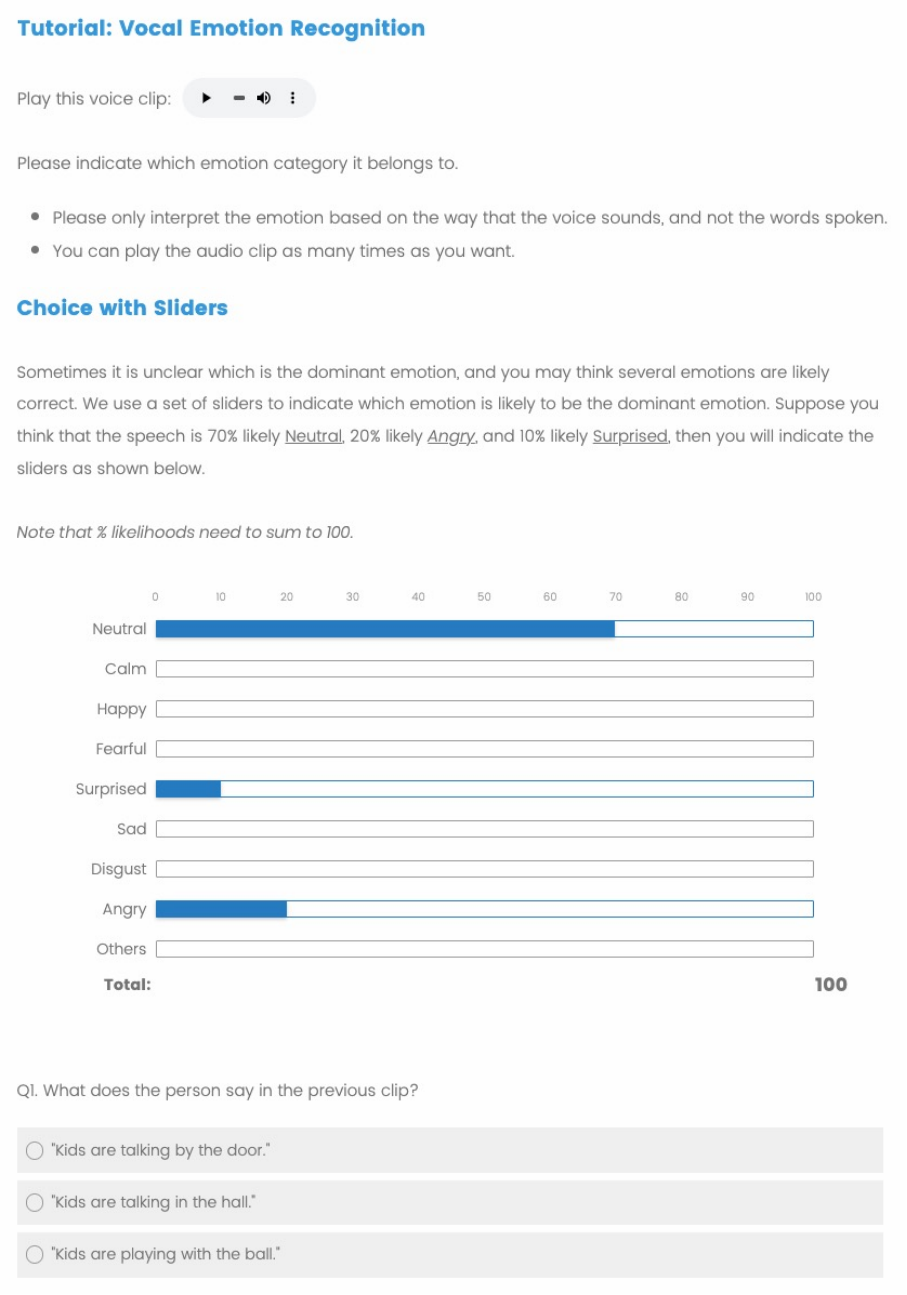


A.3. User Study Analysis: Statistical Model
| Response |
|
F | p>F | |||
|---|---|---|---|---|---|---|
| Labeling Correctness | XAI Type | 4.2 | <.0030 | .371 | ||
| Participant Unaided Skill | 50.0 | <.0001 | ||||
| Emotion | 68.6 | <.0001 | ||||
| Voice Clip | 67.1 | <.0001 | ||||
| Trial Number | 0.6 | n.s. | ||||
| Confidence Rating | 19.7 | <.0001 | ||||
| Helpfulness Rating | 7.9 | .0053 | ||||
| Confidence on Correct Label | XAI Type | 4.2 | <.0029 | .435 | ||
| Participant Unaided Skill | 64.4 | <.0001 | ||||
| Emotion | 81.8 | <.0001 | ||||
| Voice Clip | 80.2 | <.0001 | ||||
| Trial Number | 0.3 | n.s. | ||||
| Confidence Rating | 51.9 | <.0001 | ||||
| Helpfulness Rating | 6.4 | .0113 | ||||
| Confidence Rating | XAI Type | 0.5 | n.s. | .491 | ||
| Participant Unaided Skill | 0.1 | n.s. | ||||
| Emotion | 4.0 | .0002 | ||||
| Voice Clip | 7.7 | <.0001 | ||||
| Trial Number | 0.3 | n.s. | ||||
| Helpfulness Rating | XAI Type | 5.7 | .0002 | .831 | ||
| Participant Unaided Skill | 6.6 | .0114 | ||||
| Emotion | 2.2 | .0283 | ||||
| Voice Clip | 7.7 | <.0001 | ||||
| Trial Number | 0.7 | n.s. | ||||
| Log10(Task Time) | XAI Type | 1.0 | n.s. | .536 | ||
| Participant Unaided Skill | 2.8 | n.s. | ||||
| Emotion | 2.8 | n.s. | ||||
| Voice Clip | 9.3 | <.0001 | ||||
| Trial Number | 4.5 | .0001 |